
Factory incentives and traceability rules lift MOM spending
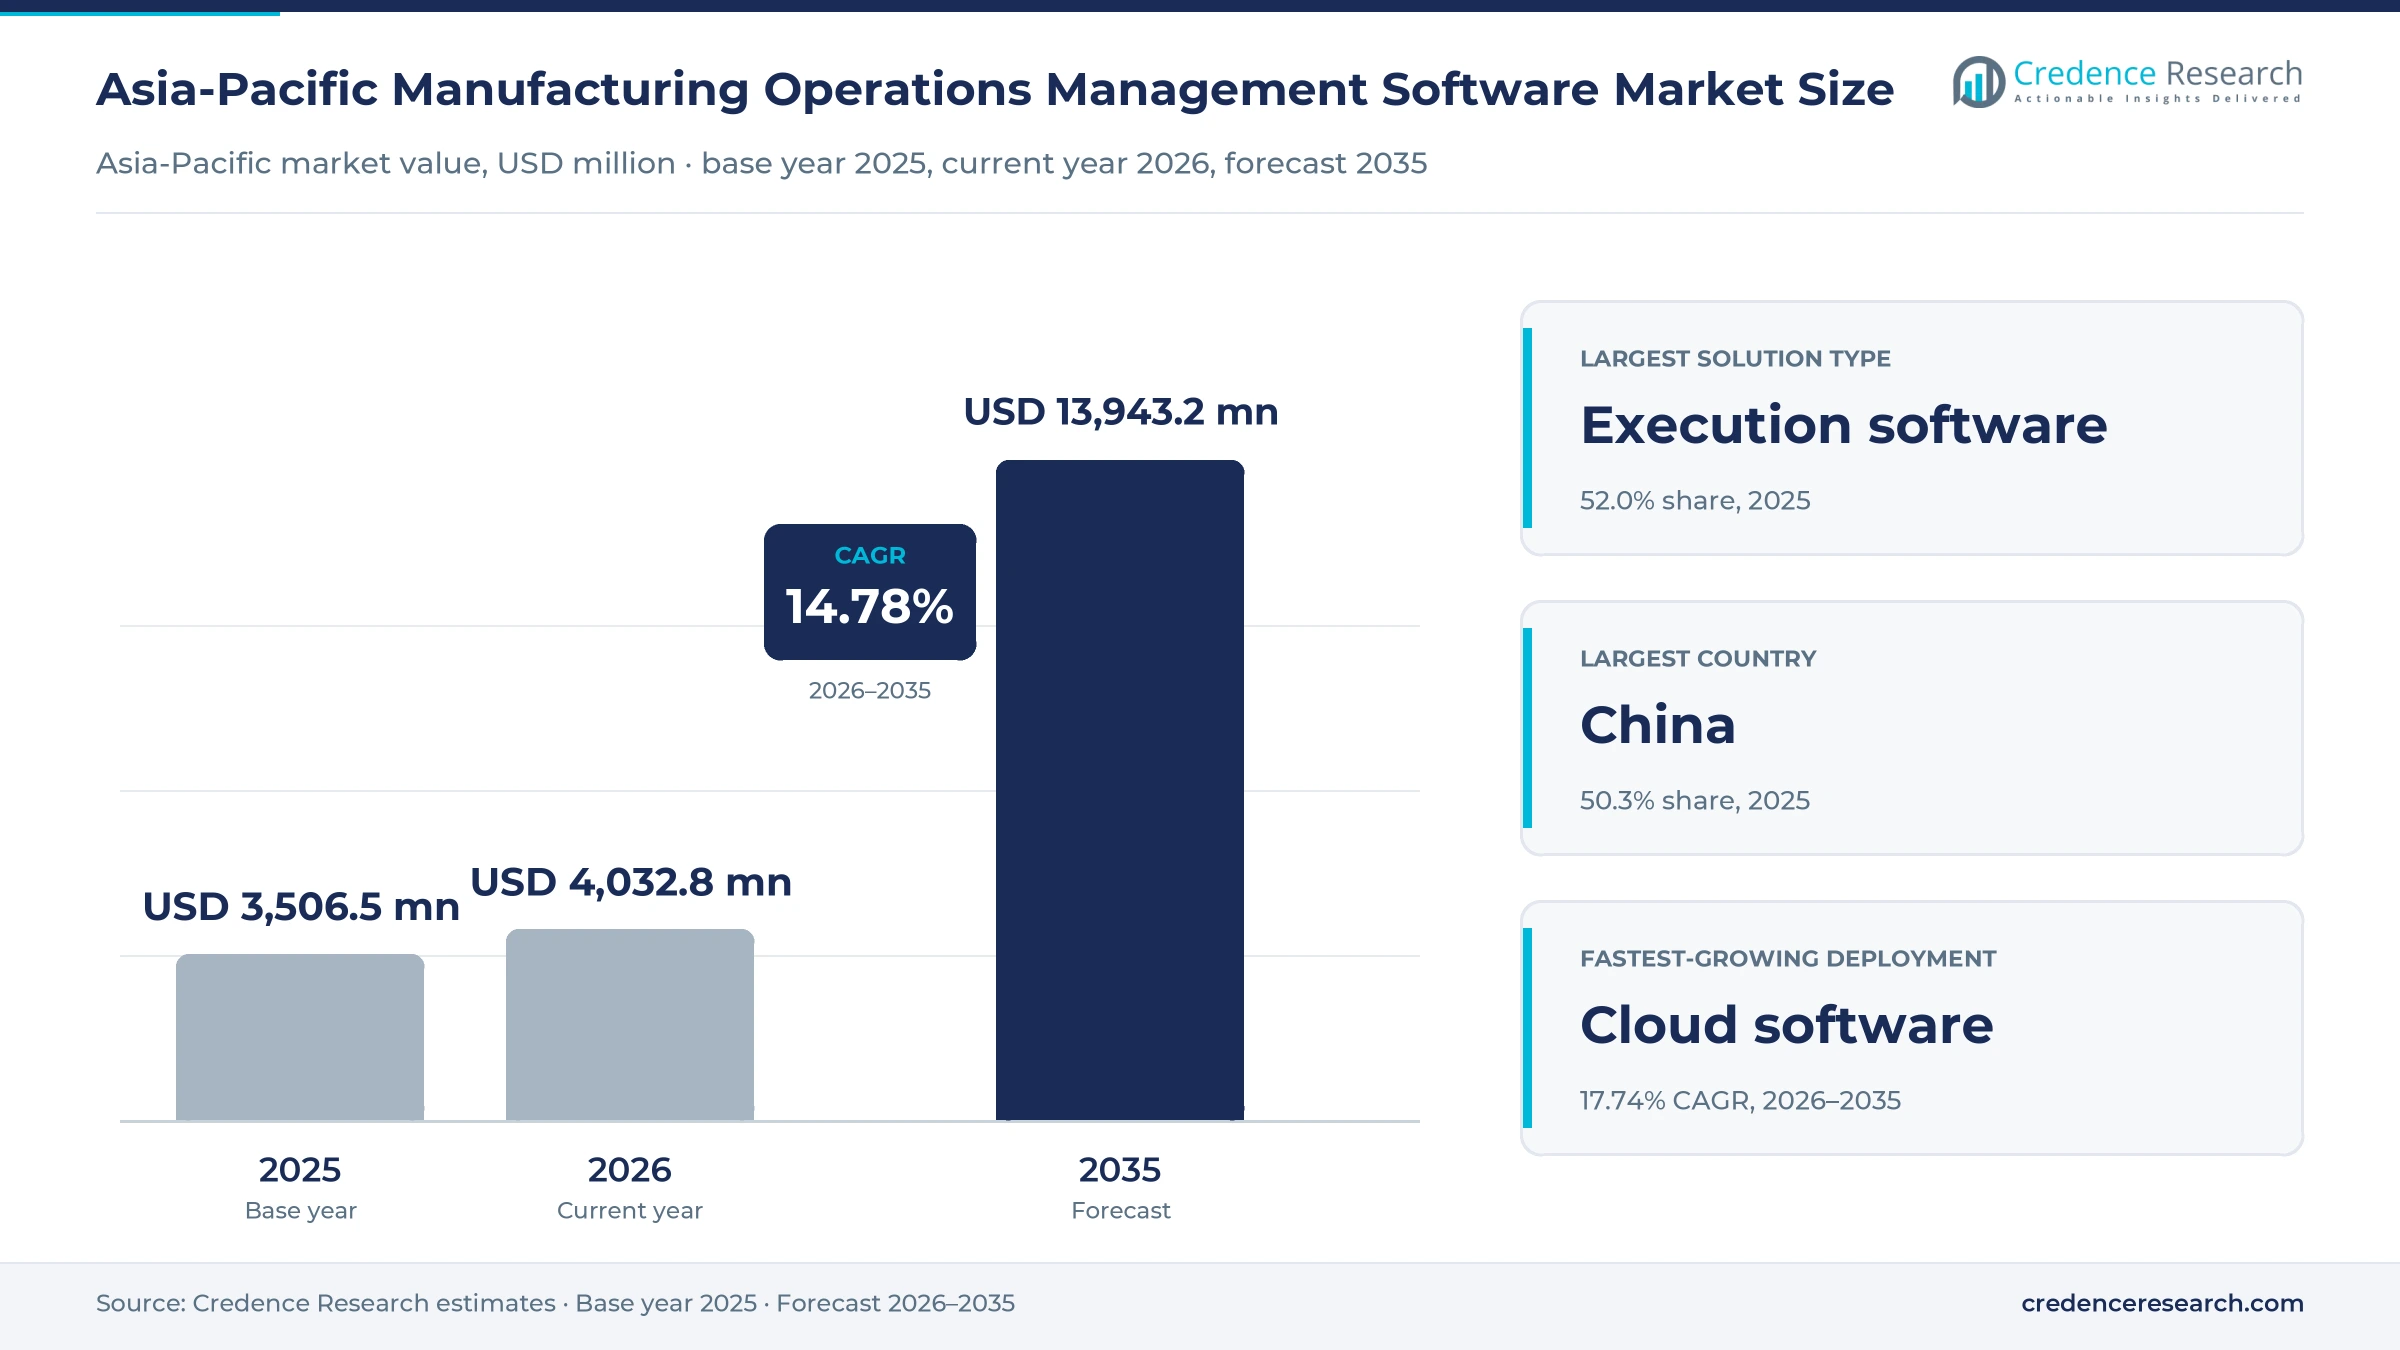
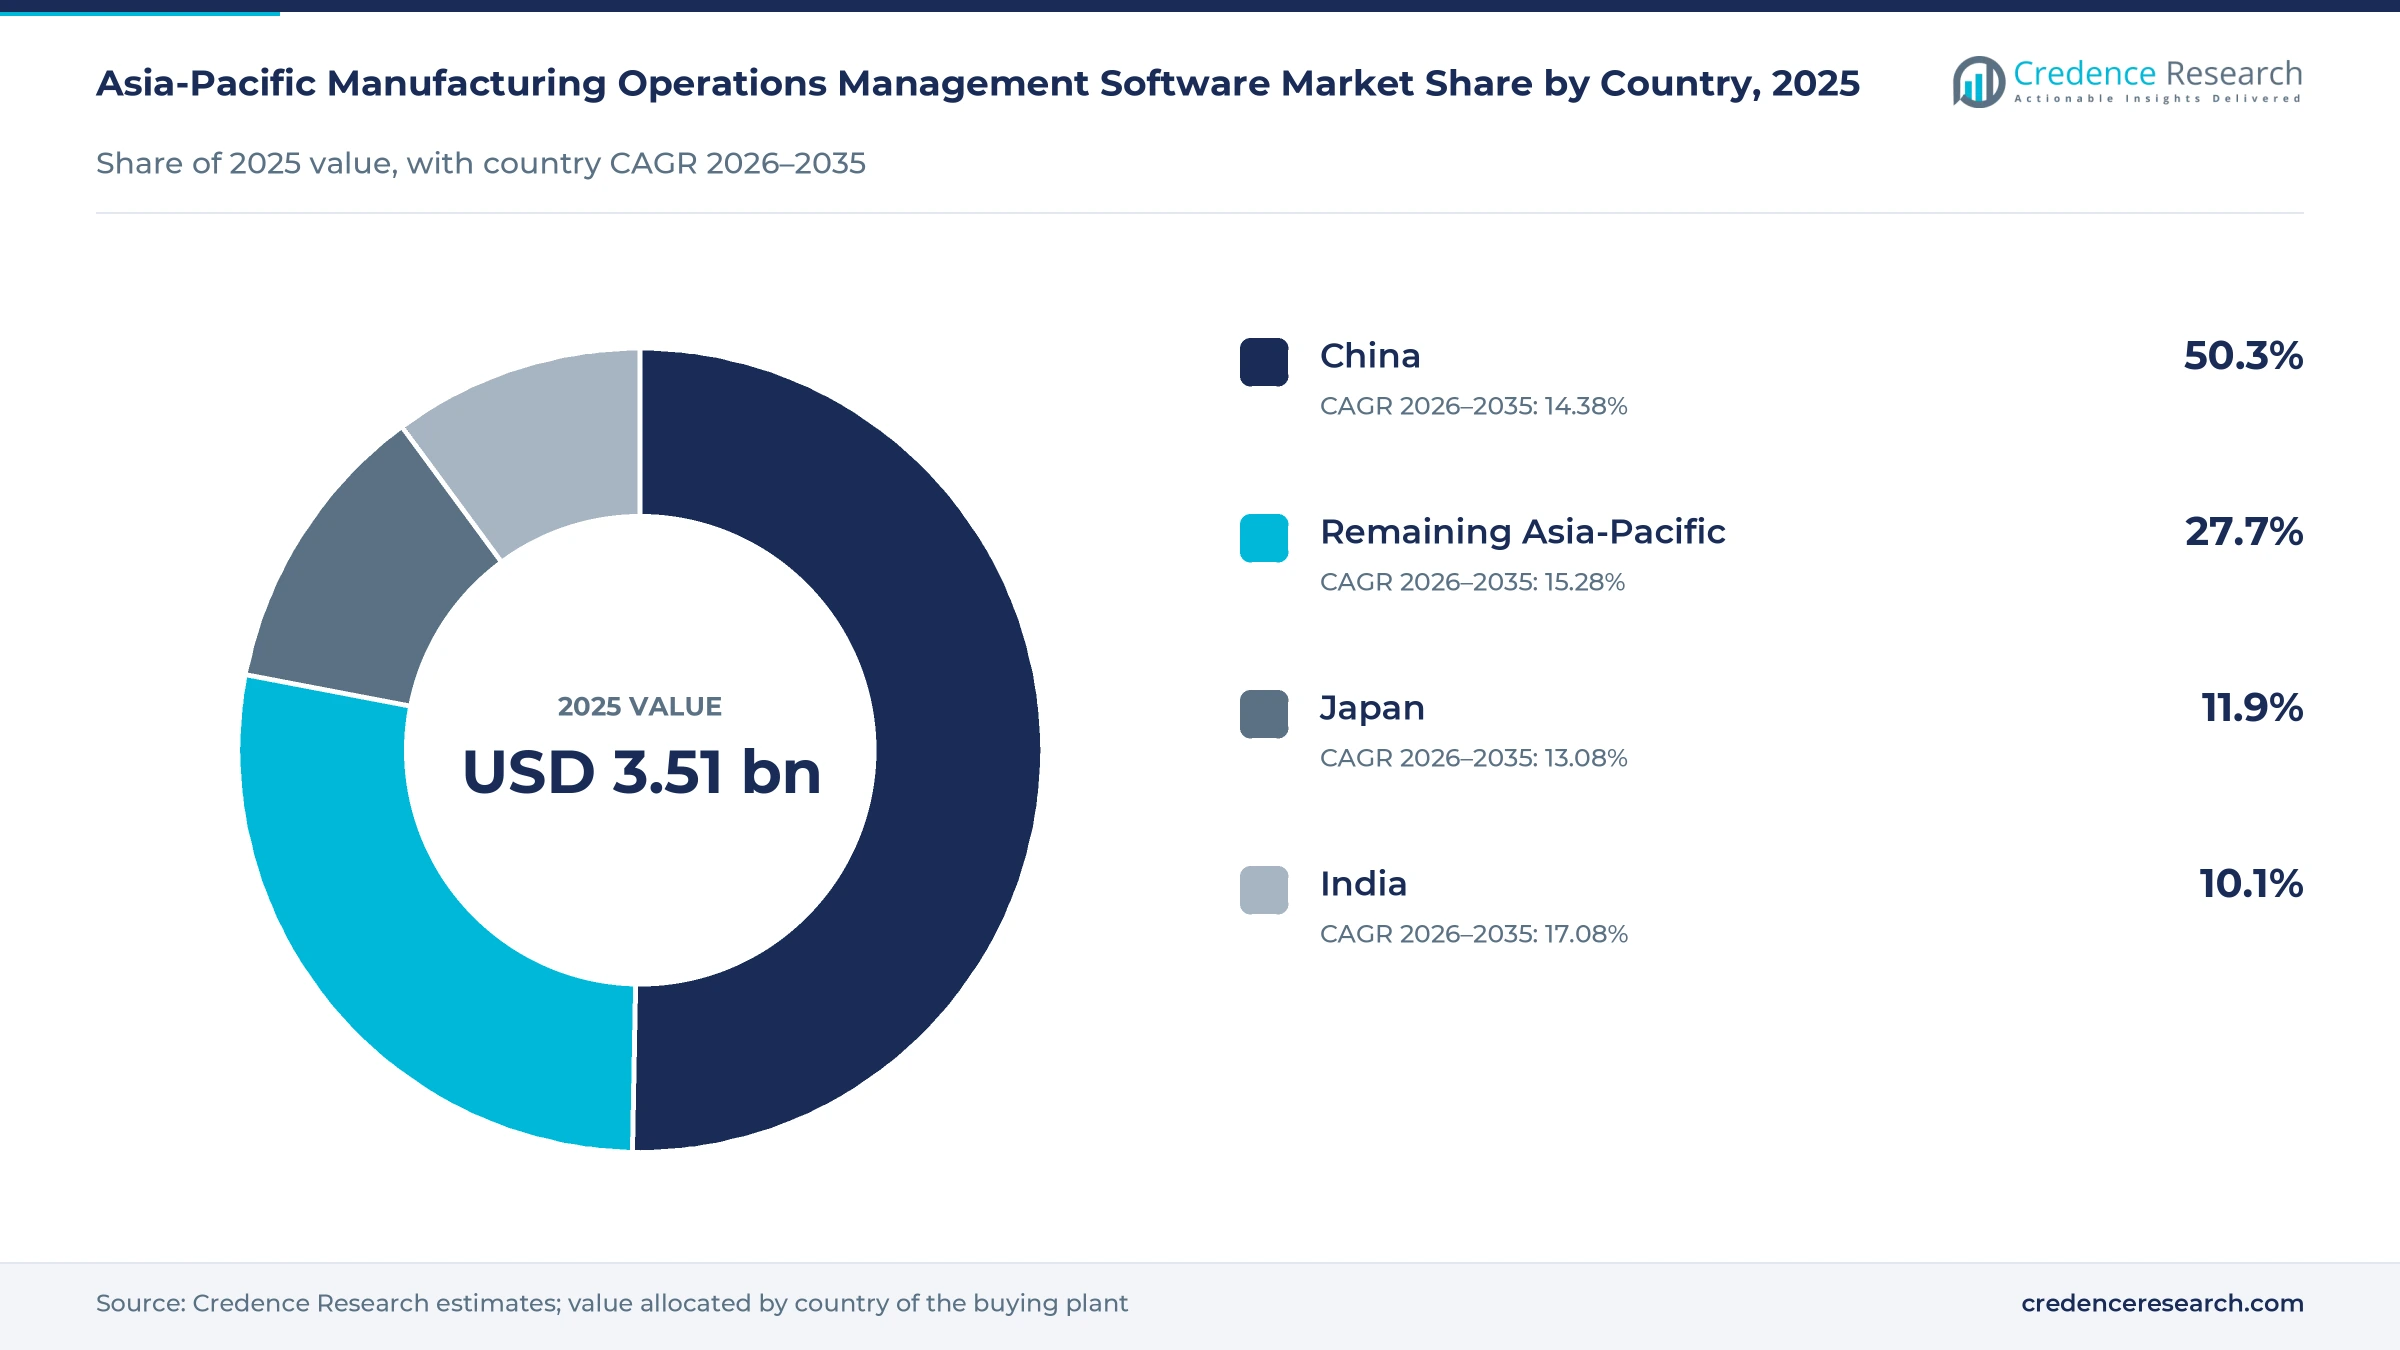
The Asia-Pacific manufacturing operations management software market was valued at USD 3.51 billion in 2025 and is projected to increase from USD 4.03 billion in 2026 to USD 13.94 billion by 2035, registering a CAGR of 14.78% during 2026–2035. Demand comes from electronics, automotive, pharmaceutical and process plants that need software to schedule production, record each batch and track equipment across many sites. China held the largest country share, 50.3% in 2025, because more than 30,000 of its plants reached basic-level smart factory status under a Ministry of Industry and Information Technology program. India is the fastest-growing country at 17.08% a year, as production-linked incentives and new semiconductor projects bring fresh plants online. Japan adds steady replacement demand as manufacturers retire legacy systems. In January 2026, the ministry said China had more than 7,000 advanced smart factories and over 500 excellence-level smart factories.
Which factory software does the regional estimate cover?
The estimate measures spending on software that runs and records work on the factory floor across the Asia-Pacific region. It covers manufacturing execution software, production planning and quality management tools and plant resource management software for equipment, labor and materials. Values are measured as subscription, license and maintenance payments received by software vendors and their resellers.
The estimate excludes control hardware such as programmable controllers, enterprise resource planning suites, product design software and stand-alone consulting work. The value chain runs from software developers through system integrators and resellers to plant owners in China, Japan, India and the remaining Asia-Pacific countries, where the software links machines, operators and business systems.
Asia-Pacific Manufacturing Operations Management Software Market Insights
- The Asia-Pacific manufacturing operations management software market was valued at USD 3.51 billion in 2025 and is projected to reach USD 13.94 billion by 2035, registering a CAGR of 14.78% during 2026–2035.
- China held a 50.3% share of 2025 value, because Chinese plants lead the region in smart factory upgrades and drug traceability rollouts.
- Manufacturing execution software led solution demand with a 52.0% share of 2025 value, because every connected plant needs a system to dispatch and record work orders.
- China made drug traceability code scanning mandatory for insurance reimbursement from July 1, 2025, which pushes drug makers to record codes at the packaging line.
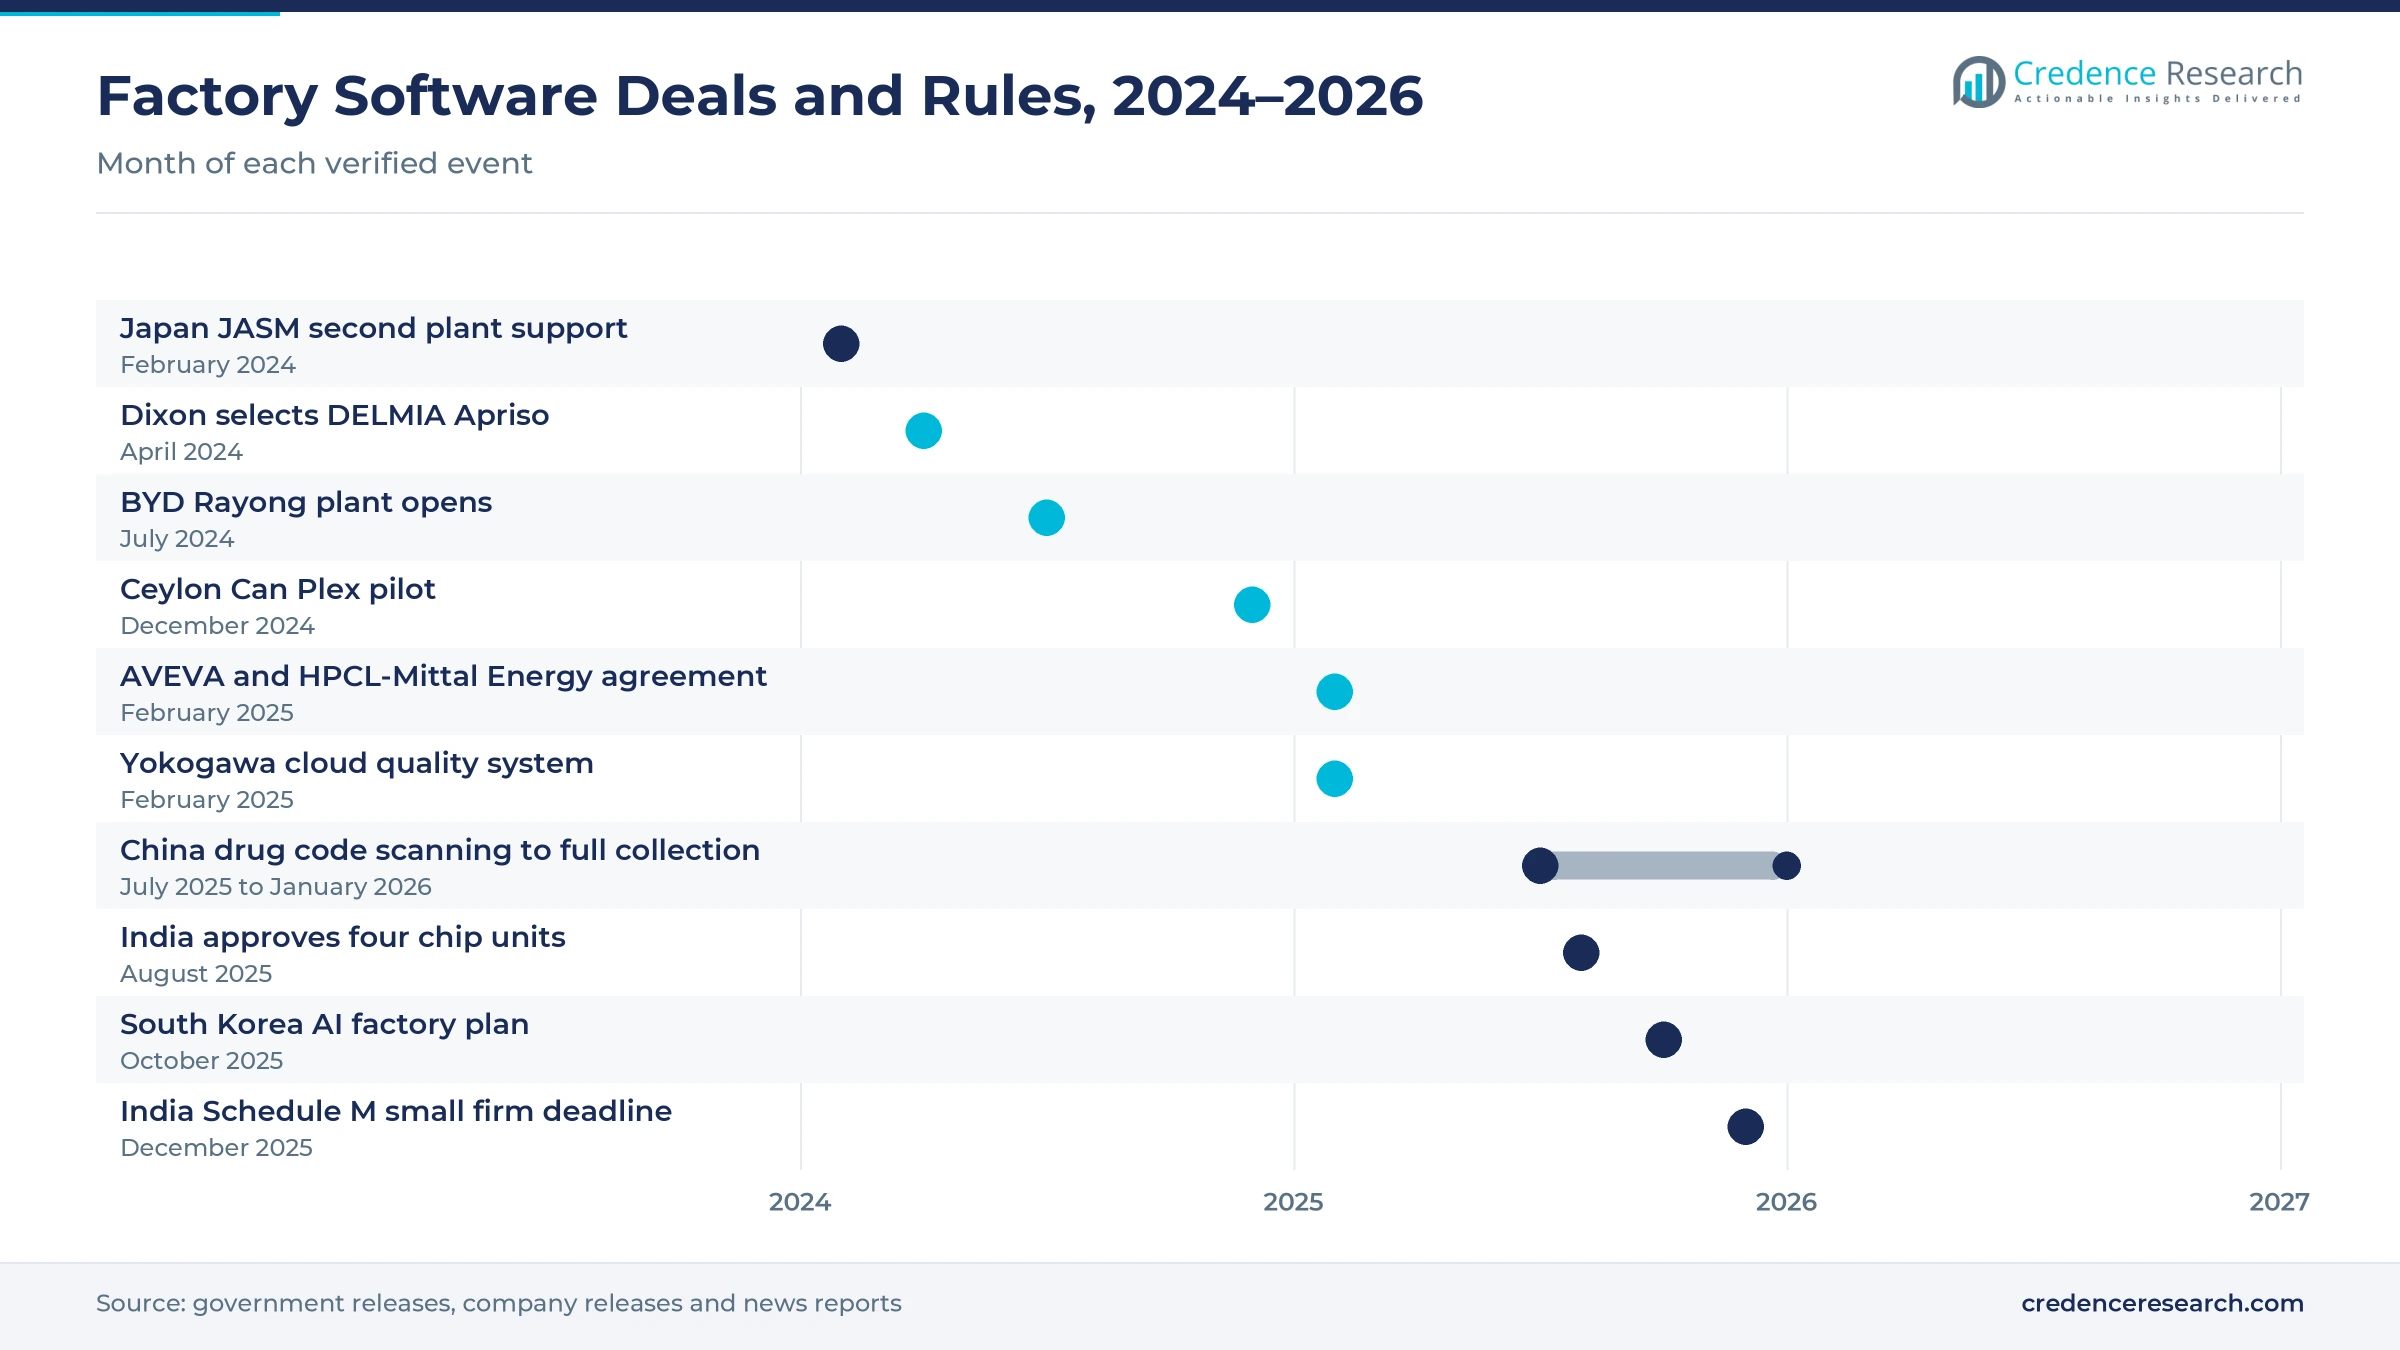
- AVEVA and HPCL-Mittal Energy signed a memorandum of understanding in February 2025 for a refinery command center in India.
Execution software leads as cloud deployment grows fastest
Why does execution software hold the largest share?
Based on solution type, the market is categorized into manufacturing execution software, planning and quality software and plant resource management software. Manufacturing Execution Software led with a 52.0% share of 2025 value, because every connected plant needs a system to dispatch work orders and record output. Planning and Quality Software grows fastest at 15.28% a year, as drug and device makers digitize deviation and batch release records.
How fast is cloud deployment gaining ground?
Based on deployment mode, the market is categorized into on-premises software, cloud software and hybrid software. On-Premises Software led with a 55.0% share of 2025 value, because many large plants keep production data on local servers for uptime and security. Cloud Software grows fastest at 17.74% a year, as vendors release software as a service versions that small sites can start quickly.
Why do electronics plants lead end-use demand?
Based on end-use industry, the market is categorized into automotive and transportation, electronics and semiconductors, pharmaceuticals and medical devices and process and diversified manufacturing. Electronics and Semiconductors led with a 31.0% share of 2025 value, because phone, chip and component lines track every unit. Pharmaceuticals and Medical Devices grows fastest at 15.96% a year, as new good manufacturing practice and traceability rules take effect.
How do large manufacturers shape customer demand?
Based on customer type, the market is categorized into large manufacturing enterprises, mid-market manufacturing enterprises and small manufacturing enterprises. Large Manufacturing Enterprises led with a 58.0% share of 2025 value, because multi-site groups standardize one system across plants. Small Manufacturing Enterprises grow fastest at 16.10% a year, as government smart factory programs fund first projects for smaller plants.
| Segment Group | Leading Sub-segment | Share, 2025 | Fastest-growing Sub-segment | CAGR, 2026–2035 |
|---|---|---|---|---|
| By Solution Type | Manufacturing Execution Software | 52.0% | Planning and Quality Software | 15.28% |
| By Deployment Mode | On-Premises Software | 55.0% | Cloud Software | 17.74% |
| By End-Use Industry | Electronics and Semiconductors | 31.0% | Pharmaceuticals and Medical Devices | 15.96% |
| By Customer Type | Large Manufacturing Enterprises | 58.0% | Small Manufacturing Enterprises | 16.10% |
Request a Free Sample
Fill in your details and we'll send you a free sample report.
- Sample data tables & charts
- Research methodology
Incentives, new plants and record rules drive adoption
How do factory incentive programs create new software demand?
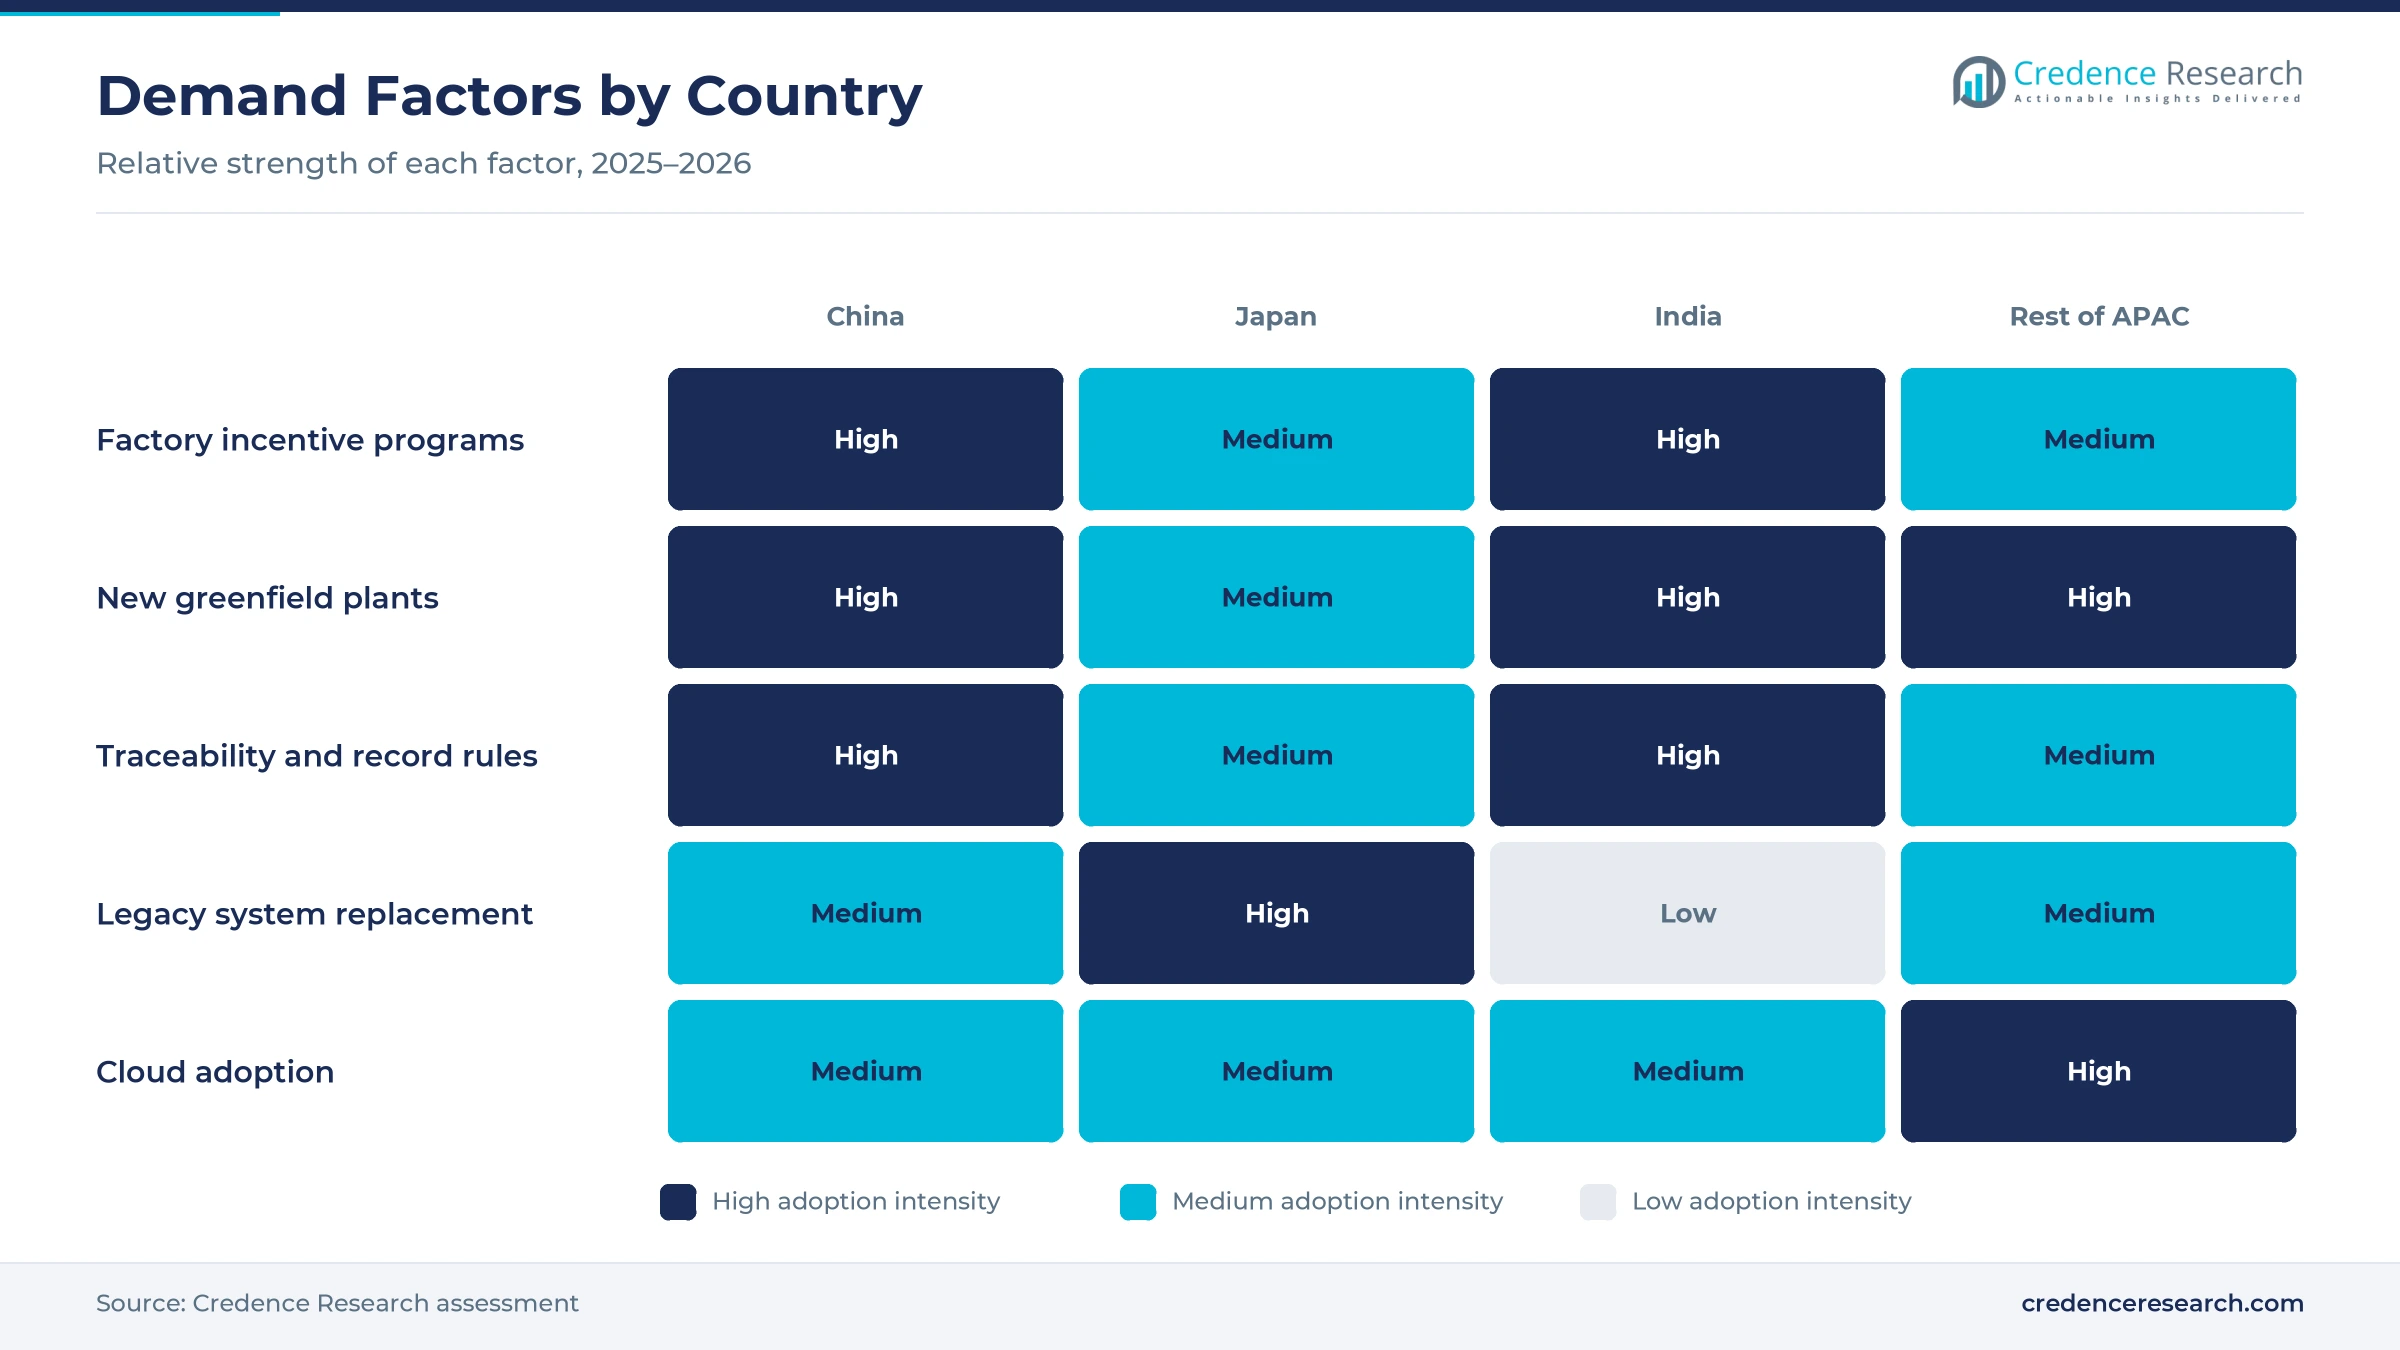
Government incentives for new factories create demand, because each new plant needs software to schedule work, record quality and prove output for subsidy claims. India approved 806 applications across 14 sectors under its production-linked incentive schemes, with INR 1.76 trillion invested by March 2025, according to India Briefing. Mobile phone production in India rose from INR 2.13 trillion in fiscal 2021 to INR 5.25 trillion in fiscal 2025 under the same program. India also had 10 approved semiconductor projects worth about INR 1.60 trillion by Aug. 12, 2025, Business Today reported. As a result, India is the fastest-growing country in the regional split.
Why does cross-border plant expansion favor standard systems?
Manufacturers that spread production across several countries need one execution system that works the same way in every plant. Vietnam drew USD 38.4 billion of registered foreign investment in 2025, and manufacturing took 59.2% of new and adjusted capital, according to Vietnam News. BYD opened a USD 490 million plant in Rayong, Thailand, on July 4, 2024, with capacity for 150,000 vehicles a year, Malay Mail reported. Ceylon Can began a Rockwell Automation Plex execution system pilot in Sri Lanka in December 2024 to prepare for two planned plants in India. In turn, the remaining Asia-Pacific countries hold 27.7% of 2025 value.
How do electronic record and traceability rules lift spending?
New rules require plants to keep electronic records and print unique codes, and paper systems cannot meet those deadlines. China made drug traceability code scanning mandatory for insurance reimbursement from July 1, 2025, and required full code collection by Jan. 1, 2026, Cisema reported. India gave about 8,500 smaller drug makers until Dec. 31, 2025, to meet its revised Schedule M good manufacturing rules, India Briefing reported in February 2025. Asian battery makers that export to Europe also need a digital battery passport from Feb. 18, 2027, so many add track and trace systems at the line. As a result, pharmaceuticals and medical devices grow fastest at 15.96% a year.
Why do national smart factory programs reach more plants?
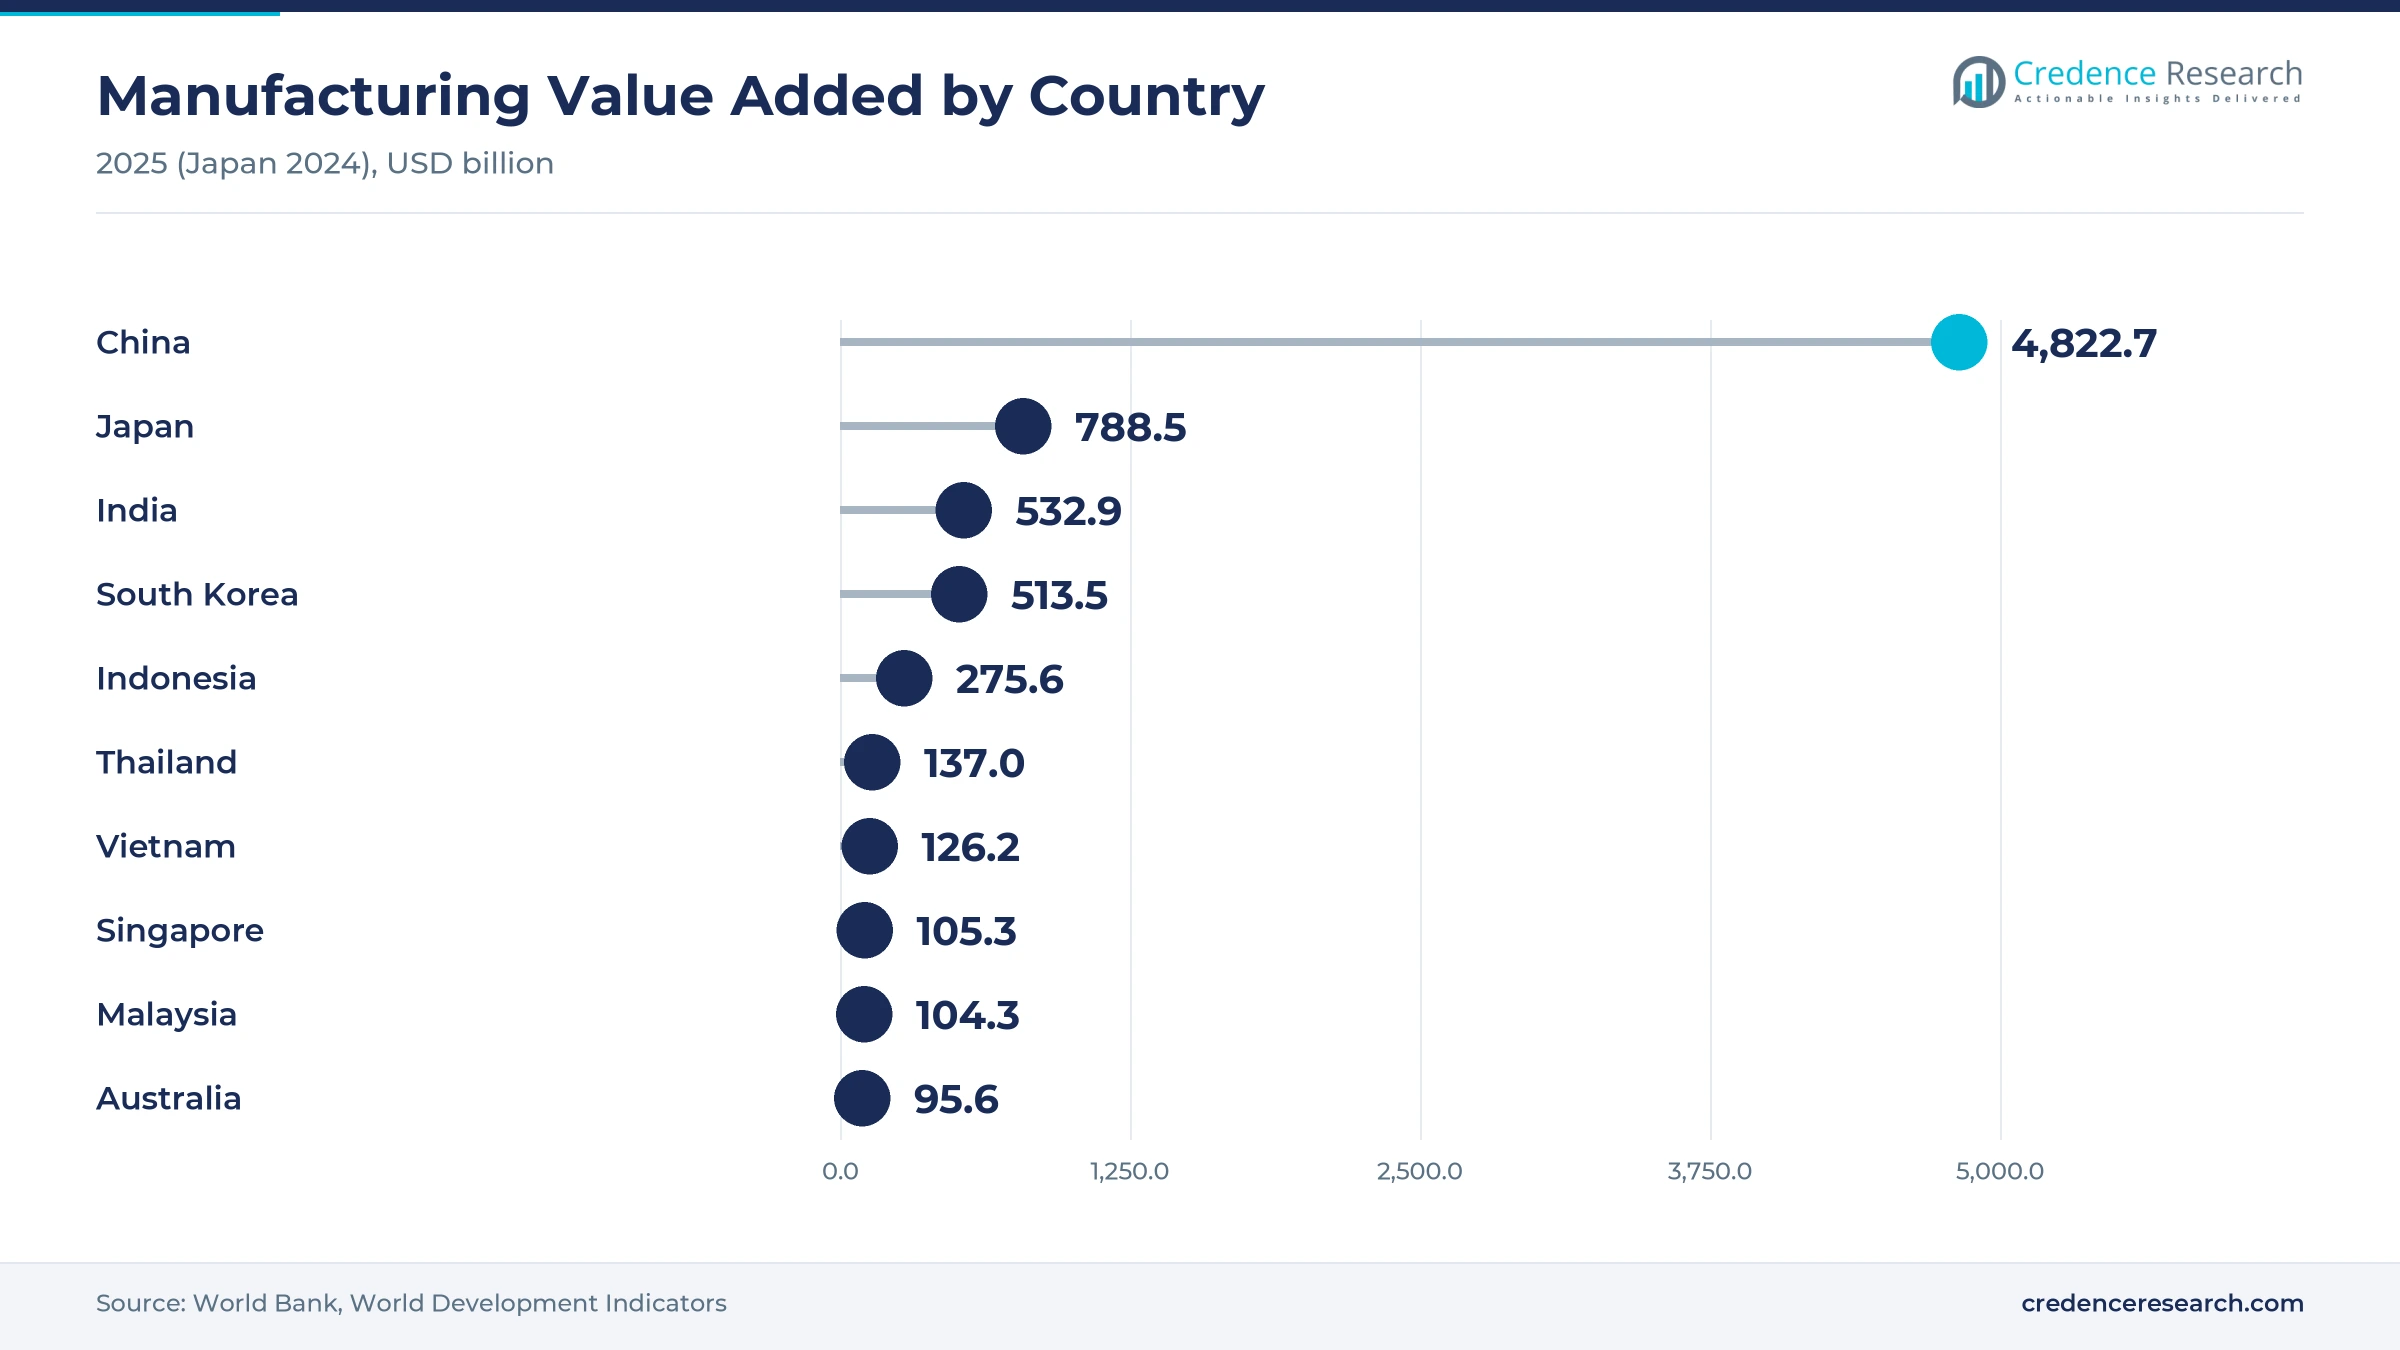
National smart factory programs set clear targets and grade plants, which turns software adoption into a public goal. China had more than 30,000 basic-level smart factories and 230 excellence-level factories by February 2025, and the excellence-level plants cut defect rates by 50.2% on average, Xinhua reported. China's manufacturing value added reached about USD 4.82 trillion in 2025, according to World Bank data, which gives the program a very large base. South Korea also plans AI-centered smart factories for 12,000 companies by 2030, The Asia Business Daily reported in October 2025. In turn, small manufacturing enterprises grow at 16.10% a year.
Cloud MES, vendor consolidation and AI operations rise
How is the shift to cloud and hybrid execution changing purchases?
Vendors now sell execution and quality software as subscriptions that run in the cloud or split work between the plant and the cloud. AVEVA launched a hybrid execution system in 2024 that keeps model-driven control at the edge and stores production data on its CONNECT cloud platform, the company said in January 2025. Siemens promoted its Opcenter X software as a service at Realize LIVE Asia Pacific in Bengaluru in August 2025, which drew more than 1,500 attendees. Yokogawa released a cloud quality management system on Feb. 3, 2025, for drug and food plants. As a result, cloud software grows fastest among deployment modes at 17.74% a year.
Why is the rise of vendor consolidation reshaping supply?
Ownership changes are regrouping factory software into fewer, larger portfolios that combine execution, data and analytics tools. GE Vernova sold its Proficy business to TPG, and Proficy now serves more than 20,000 customers as an independent company, TED Magazine reported in March 2026. Yokogawa agreed on April 23, 2025, to acquire Web Synergies, a provider of integrated IT and operational technology solutions. Dassault Systèmes also signed Dixon Technologies to DELMIA Apriso in April 2024 to streamline production and quality control across its consumer electronics, mobile phone and home appliance lines. In turn, execution software keeps a 52.0% share as buyers choose broad platforms.
Can legacy system replacement in Japan open new revenue?
Japanese manufacturers run many aging plant systems, and the government now presses them to modernize before costs rise further. METI published a legacy systems modernization report on May 28, 2025, which builds on its warning about a 2025 digital cliff for firms with outdated systems. Japan also offered up to JPY 732 billion in support for JASM's second chip fab in February 2024, according to a METI policy paper. Japan's manufacturing value added stood at about USD 788.5 billion in 2024, which gives replacement projects a large base. As a result, Japan still grows at 13.08% a year despite a mature installed base.
Is there room for growth in AI-driven plant operations?
Plant owners are starting to add AI tools on top of execution and data systems, which creates a new software layer to sell. AVEVA and HPCL-Mittal Energy signed a memorandum of understanding on Feb. 13, 2025, to collaborate on a refinery command center at the 11.3 million metric ton Bathinda refinery, according to an AVEVA release. South Korea aims to raise AI use among small and midsize manufacturers from about 1% to 10% within five years. China's ministry also reported shorter development cycles and 22.3% higher production efficiency at excellence-level smart factories. In turn, large manufacturing enterprises keep a 58.0% share, because refinery and multi-site groups fund most early AI projects.
Legacy systems, skills gaps and costs slow rollouts
How do legacy systems slow new rollouts?
Many plants run custom systems built over decades, and these systems hold recipes, routings and quality rules that are hard to move. Japan's METI said in May 2025 that legacy systems block new digital tools and weaken industrial competitiveness. As a result, projects take longer and cost more than planned. Vendors respond with phased rollouts, standard connectors and hybrid designs that keep old systems running while new modules go live.
Why do skills gaps limit adoption at smaller plants?
Execution and quality software needs staff who understand both plant processes and information technology, and smaller plants rarely have them. South Korea estimated that only about 1% of its small and midsize manufacturers used AI when it set its 2030 targets. In turn, many small plants stop after a pilot project and never scale up. Vendors and governments respond with training programs, local integrators and templates that cut configuration work.
How do upfront costs delay smaller buyers?
A full execution system with integration, validation and training can cost more than a small plant spends on IT in several years. Many small drug makers in India sought more time to meet revised Schedule M rules, which shows how costly upgrades are. As a result, purchases cluster around large groups and subsidized projects. Cloud subscriptions and modular licenses spread costs over time, which helps smaller buyers start.
Why do data security concerns slow cloud moves?
Production data shows yields, recipes and customer volumes, so many manufacturers hesitate to store it outside the plant. Defense, chip and drug plants often face strict rules on where data can sit. In turn, cloud adoption moves more slowly in these sites than in general manufacturing. Vendors respond with hybrid designs, local data centers and security certifications that keep sensitive records inside the country.
China leads while India grows fastest
| Country | Value, 2025 (USD billion) | Share, 2025 | CAGR, 2026–2035 |
|---|---|---|---|
| China | 1.76 | 50.3% | 14.38% |
| Remaining Asia-Pacific | 0.97 | 27.7% | 15.28% |
| Japan | 0.42 | 11.9% | 13.08% |
| India | 0.35 | 10.1% | 17.08% |
Why does China hold the largest share?
China held a 50.3% share of 2025 value and grows at 14.38% a year, because it has the region's largest factory base and an active smart factory program. Its manufacturing value added was the largest in the region in 2025, and the industry ministry counted more than 7,000 advanced smart factories in January 2026. Domestic and foreign vendors compete for contracts to supply Chinese MES platforms, while drug traceability rules add pharmaceutical demand.
What keeps Japan a steady replacement market?
Japan held an 11.9% share of 2025 value and grows at 13.08% a year, because most large plants already use execution software and now replace older versions. METI's May 2025 report urged firms to modernize legacy systems, and new chip plants such as JASM's second fab add greenfield demand. Yokogawa, a Tokyo-based vendor, released a cloud quality system in February 2025, which supports upgrades of Japanese MES installations.
Why is India the fastest-growing country?
India held a 10.1% share of 2025 value and grows fastest at 17.08% a year, because incentives are bringing new electronics, drug and chip plants online. India's smartphone exports reached about USD 30 billion in 2025, up about 47% from the prior year, IANS reported in January 2026. Mobile phone production reached INR 5.25 trillion in fiscal 2025, and Rockwell Automation announced a 98,000-square-foot manufacturing facility in Chennai in May 2024.
How do the remaining Asia-Pacific countries build demand?
The remaining Asia-Pacific countries held a 27.7% share of 2025 value and grow at 15.28% a year, because South Korea, Southeast Asia and Australia combine mature and new plants. South Korea's manufacturing value added reached about USD 513.5 billion in 2025, and Vietnam drew USD 27.6 billion of disbursed foreign investment that year. New plants such as BYD's Rayong factory in Thailand also need execution software from the first production day.
Plant software deals and rules from 2024 to 2026
| Development | Status and market relevance |
|---|---|
| In April 2024, Dixon Technologies signed an agreement with Dassault Systèmes to use DELMIA Apriso across its plants. | Brings execution software to a large Indian electronics contract maker |
| In December 2024, Ceylon Can began a pilot of the cloud-based Rockwell Automation Plex execution system in Sri Lanka. | First Plex execution system deployment in Sri Lanka |
| In July 2025, China made drug traceability code scanning mandatory for medical insurance reimbursement. | Requires code capture at drug packaging lines |
| In February 2025, Yokogawa released its cloud-based OpreX Quality Management System for drug and food plants. | Digitizes deviation, corrective action and change records |
| In August 2025, Siemens held Realize LIVE Asia Pacific in Bengaluru and promoted its Opcenter X cloud software. | Drew more than 1,500 attendees |
Execution, quality and industrial data tools shape plants
- Execution engines dispatch work orders, track materials and record each step, which gives plants one record of what was built.
- Quality and deviation tools log deviations, corrective actions and procedure changes, which helps drug and food plants meet good manufacturing rules.
- Industrial data platforms collect machine and process data from many vendors, which gives analytics and AI tools clean inputs.
- Cloud and hybrid delivery keep time-critical control at the plant while sending data to the cloud, which lowers upfront cost for new sites.
Need a Custom Version of This Report?
Tailor the scope, geography, or segments to your exact requirements.
- Custom geography or segment scope
- Direct access to our analyst team
Vendors compete on plant references and local partners
Competition combines global industrial software groups, automation suppliers and local integrators. AVEVA, owned by Schneider Electric, sells execution and industrial data software to refiners and process plants in India and across the region. Siemens markets its Opcenter portfolio, including the Opcenter X cloud version, and held its Asia Pacific user event in Bengaluru in August 2025. Dassault Systèmes sells DELMIA Apriso execution software to electronics contract makers, while Rockwell Automation deploys its Plex execution system in South Asia and announced a new manufacturing facility in Chennai in May 2024. Yokogawa Electric adds cloud quality software for drug and food plants. Companies compete on plant references, industry templates, local partners, validation support for regulated plants and the ability to run on premises, in the cloud or both.
Companies profiled and their roles in this market
| Company | Type | Role in the market |
|---|---|---|
| AVEVA Group Limited | Industrial software vendor | Sells execution and industrial data software to refiners and process plants in India |
| Siemens | Industrial software vendor | Promoted Opcenter X cloud software at its Bengaluru user event |
| Dassault Systèmes | Industrial software vendor | Sells DELMIA Apriso execution software to electronics makers in India |
| Rockwell Automation | Automation and software supplier | Deployed the Plex execution system at Ceylon Can in Sri Lanka |
| Yokogawa Electric | Control system and software vendor | Released the OpreX cloud quality management system in February 2025 |
Credence Research view on factory software demand
Credence Research's view is that factory software demand in the Asia-Pacific region will grow quickly because new plants, stricter record rules and national smart factory programs all point in the same direction. Execution software keeps the largest share, while cloud deployment grows fastest as vendors sell subscriptions. China stays the largest buyer, and India grows fastest as incentive-backed plants open. However, legacy systems and skills gaps will slow smaller plants. Vendors that pair proven templates with local integrators should gain share fastest.
How the regional factory software estimate was built
The report uses 2025 as the base year on a calendar basis, and market values come from the Credence Research model. That model combines manufacturing value added by country, incentive program data, foreign investment statistics, regulatory deadlines and company information on software deployments and partnerships. Segment splits, country shares and growth rates are Credence Research estimates. Sources used are official statistics, government releases, company releases and news reports, and no interviews or surveys were used.
Plant investment and compliance carry growth to 2035
Regional value for factory operations software is expected to reach USD 13.94 billion by 2035, a 14.78% CAGR during 2026–2035, as new plants and record rules keep projects moving. Growth should be strongest through 2030, while Indian, Chinese and Southeast Asian plants finish first rollouts and traceability deadlines pass. After that, subscriptions, upgrades and AI modules will carry more growth as installed systems mature. Faster cloud adoption would raise this outlook, while weaker factory investment would lower it.
Frequently Asked Questions
How big is the Asia-Pacific manufacturing operations management software market?
Which solution type leads regional demand?
Which country leads the regional market?
Which deployment mode grows fastest?
How do traceability rules affect software demand?
Which end-use industry leads demand?
Who are the leading companies in the region?
What are the main challenges for buyers?
Table of Content
Chapter 1 Market Segmentation
- 1.1 Segmentation Framework
- 1.1.1 Product and Service Classification
- 1.1.2 Application and End-Use Classification
- 1.1.3 Technology and Solution Classification
- 1.1.4 Customer and Distribution Channel Classification
- 1.1.5 Geographic Segmentation
- 1.1.6 Market Segment Definitions and Boundaries
- 1.2 By Solution Type
- 1.2.1 Manufacturing Execution Software
- 1.2.2 Planning and Quality Software
- 1.2.3 Plant Resource Management Software
- 1.3 By Deployment Mode
- 1.3.1 On-Premises Software
- 1.3.2 Cloud Software
- 1.3.3 Hybrid Software
- 1.4 By End-Use Industry
- 1.4.1 Automotive and Transportation
- 1.4.2 Electronics and Semiconductors
- 1.4.3 Pharmaceuticals and Medical Devices
- 1.4.4 Process and Diversified Manufacturing
- 1.5 By Customer Type
- 1.5.1 Large Manufacturing Enterprises
- 1.5.2 Mid-Market Manufacturing Enterprises
- 1.5.3 Small Manufacturing Enterprises
- 1.6 By Country
- 1.6.1 China
- 1.6.2 Japan
- 1.6.3 India
- 1.6.4 Remaining Asia-Pacific
Chapter 2 Introduction
- 2.1 Report Objectives and Scope
- 2.2 Product Definition and Industry Terminology
- 2.3 Market Inclusions and Exclusions
- 2.4 Research Process
- 2.4.1 Primary Research and Expert Interviews
- 2.4.2 Secondary Research and Source Review
- 2.4.3 Top-Down and Bottom-Up Estimation
- 2.4.4 Data Triangulation and Verification
- 2.5 Market Size Measurement Basis
- 2.5.1 2025: USD 3.51 billion → 2035: USD 13.94 billion
- 2.6 Historical and Forecast Reference Periods
- 2.6.1 Historical Period: 2018-2025
- 2.6.2 Base Year: 2025
- 2.6.3 Forecast Period: 2025-2035
- 2.7 Research Assumptions and Limitations
Chapter 3 Executive Summary
- 3.1 Market Snapshot and Key Findings
- 3.2 Base-Year Market Size, 2025
- 3.3 Forecast Market Size, 2035
- 3.4 Revenue and Volume Growth Outlook
- 3.5 Key Demand and Supply Indicators
- 3.6 Leading Market Segments
- 3.7 Fastest-Growing Market Opportunities
- 3.8 Regional Performance Highlights
- 3.9 Technology and Industry Transformation
- 3.10 Competitive Landscape Summary
- 3.11 Analyst View and Strategic Implications
Chapter 4 Asia-Pacific Manufacturing Operations Management Software Market Trends and Developments
- 4.1 Historical Industry Development, 2018-2025
- 4.2 Recent Market Trends and Developments
- 4.3 Demand and Customer Behavior Trends
- 4.4 Technology and Product Innovation
- 4.5 Artificial Intelligence, Automation and Digitalization
- 4.6 Local Manufacturing and Supply Chain Realignment
- 4.7 Industry Partnerships, Mergers and Acquisitions
- 4.8 Sustainability and Circular Economy Developments
- 4.9 Government and Private Sector Investment Trends
- 4.10 Emerging Business Models and Commercialization
- 4.11 Industry Developments and Announcements
Chapter 5 Asia-Pacific Manufacturing Operations Management Software Market Supply and Demand Analysis
- 5.1 Demand Trend and Consumption Analysis, 2018-2025
- 5.2 Demand Forecast, 2025-2035
- 5.3 Supply Chain Structure and Procurement Trends
- 5.4 Supply-Demand Gap and Bottlenecks
- 5.5 Import Dependence and Sourcing Structure
- 5.6 Regional Supply and Demand Concentration
Chapter 6 Asia-Pacific Manufacturing Operations Management Software Market Pricing Analysis
- 6.1 Pricing Structure and Measurement
- 6.2 Historical Pricing Trends, 2018-2025
- 6.3 Pricing Outlook, 2025-2035
- 6.4 Pricing by Product and Market Segment
- 6.5 Geographic Pricing Differences
- 6.6 Key Input, Energy, Labor and Logistics Costs
- 6.7 Contract Pricing and Purchasing Models
- 6.8 Pricing Sensitivity and Competitive Positioning
- 6.9 Price, Margin and Profitability Implications
Chapter 7 Asia-Pacific Manufacturing Operations Management Software Market Dynamics
- 7.1 Market Growth Drivers
- 7.1.1 Demand-Side Drivers
- 7.1.2 Technology and Innovation Drivers
- 7.1.3 Infrastructure and Investment Drivers
- 7.1.4 Regulatory and Policy Drivers
- 7.2 Market Restraints
- 7.2.1 Cost and Affordability Constraints
- 7.2.2 Technology and Adoption Barriers
- 7.2.3 Supply Chain and Operational Constraints
- 7.3 Market Challenges
- 7.3.1 Competitive Pressure and Margin Erosion
- 7.3.2 Skills, Infrastructure and Implementation Gaps
- 7.4 Emerging Market Opportunities
- 7.5 Market Dynamics Impact and Time-Horizon Assessment
Chapter 8 Asia-Pacific Manufacturing Operations Management Software Value Chain Analysis
- 8.1 Industry Value Chain Overview
- 8.2 Upstream Suppliers and Critical Inputs
- 8.3 Technology and Component Providers
- 8.4 Manufacturing or Service Delivery
- 8.5 Distribution, Channel Partners and Integrators
- 8.6 Downstream Applications and End Users
- 8.7 Value Addition and Profit Pools
- 8.8 Vertical Integration and Outsourcing
- 8.9 Supplier Concentration and Risk
- 8.10 Supply Chain Localization and Resilience
Chapter 9 Asia-Pacific Manufacturing Operations Management Software Market Regulations and Policies
- 9.1 Relevant Laws, Standards and Compliance Frameworks
- 9.2 Product, Service, Safety and Quality Requirements
- 9.3 Government Policies, Incentives and Subsidies
- 9.4 Imports, Exports and Trade Barriers
- 9.5 Public Procurement and Local Content Requirements
- 9.6 Data Protection, AI and Cybersecurity Compliance
- 9.7 Upcoming Policy Changes and Market Implications
Chapter 10 Asia-Pacific Manufacturing Operations Management Software Market Hotspots and Opportunities
- 10.1 Market Opportunity Mapping and Growth Hotspots
- 10.2 High-Growth Applications and Customer Groups
- 10.3 Underserved Markets and White-Space Opportunities
- 10.4 Emerging Technology and Product Opportunities
- 10.5 New Capacity and Investment Hotspots
- 10.6 Market Entry and Expansion Opportunities
- 10.7 Distribution and Partnership Opportunities
- 10.8 Near-Term and Long-Term Commercial Potential
- 10.9 Opportunity Attractiveness and Execution Risks
Chapter 11 Asia-Pacific Manufacturing Operations Management Software Market Outlook, 2025-2035
- 11.1 Market Size and Analysis
- 11.1.1 Revenue (Market Measurement: 2025: USD 3.51 billion → 2035: USD 13.94 billion)
- 11.1.2 Historical Market Size, 2018-2025
- 11.1.3 Base-Year Market Size, 2025
- 11.2 Market Forecast, 2025-2035
- 11.2.1 Revenue Forecast to 2035
- 11.2.2 CAGR and Year-on-Year Growth
- 11.2.3 Incremental Revenue Opportunity
- 11.3 Forecast Assumptions and Scenario Analysis
- 11.3.1 Base-Case Forecast
- 11.3.2 Optimistic and Conservative Scenarios
- 11.3.3 Technology, Pricing and Policy Sensitivities
- 11.4 Market Attractiveness and Growth Outlook
Chapter 12 Asia-Pacific Manufacturing Operations Management Software Market Segmentation and Outlook
- 12.1 Segmentation Summary and Market Shares, 2025
- 12.2 Largest and Fastest-Growing Segments
- 12.3 By Solution Type - Market Size and Forecast, 2025-2035
- 12.3.1 Segment Definition and Scope
- 12.3.2 Historical Market Size, 2018-2025
- 12.3.3 Revenue Forecast, 2025-2035
- 12.3.4 Base-Year Market Share, 2025
- 12.3.5 Segment CAGR and Growth Drivers
- 12.3.6 Subsegment Market Size and Forecast
- 12.3.6.1 Manufacturing Execution Software
- 12.3.6.2 Planning and Quality Software
- 12.3.6.3 Plant Resource Management Software
- 12.3.7 Subsegment Pricing and Adoption Trends
- 12.3.8 Leading Suppliers and Competition
- 12.3.9 Regional Demand and Opportunities
- 12.4 By Deployment Mode - Market Size and Forecast, 2025-2035
- 12.4.1 Segment Definition and Scope
- 12.4.2 Historical Market Size, 2018-2025
- 12.4.3 Revenue Forecast, 2025-2035
- 12.4.4 Base-Year Market Share, 2025
- 12.4.5 Segment CAGR and Growth Drivers
- 12.4.6 Subsegment Market Size and Forecast
- 12.4.6.1 On-Premises Software
- 12.4.6.2 Cloud Software
- 12.4.6.3 Hybrid Software
- 12.4.7 Subsegment Pricing and Adoption Trends
- 12.4.8 Leading Suppliers and Competition
- 12.4.9 Regional Demand and Opportunities
- 12.5 By End-Use Industry - Market Size and Forecast, 2025-2035
- 12.5.1 Segment Definition and Scope
- 12.5.2 Historical Market Size, 2018-2025
- 12.5.3 Revenue Forecast, 2025-2035
- 12.5.4 Base-Year Market Share, 2025
- 12.5.5 Segment CAGR and Growth Drivers
- 12.5.6 Subsegment Market Size and Forecast
- 12.5.6.1 Automotive and Transportation
- 12.5.6.2 Electronics and Semiconductors
- 12.5.6.3 Pharmaceuticals and Medical Devices
- 12.5.6.4 Process and Diversified Manufacturing
- 12.5.7 Subsegment Pricing and Adoption Trends
- 12.5.8 Leading Suppliers and Competition
- 12.5.9 Regional Demand and Opportunities
- 12.6 By Customer Type - Market Size and Forecast, 2025-2035
- 12.6.1 Segment Definition and Scope
- 12.6.2 Historical Market Size, 2018-2025
- 12.6.3 Revenue Forecast, 2025-2035
- 12.6.4 Base-Year Market Share, 2025
- 12.6.5 Segment CAGR and Growth Drivers
- 12.6.6 Subsegment Market Size and Forecast
- 12.6.6.1 Large Manufacturing Enterprises
- 12.6.6.2 Mid-Market Manufacturing Enterprises
- 12.6.6.3 Small Manufacturing Enterprises
- 12.6.7 Subsegment Pricing and Adoption Trends
- 12.6.8 Leading Suppliers and Competition
- 12.6.9 Regional Demand and Opportunities
- 12.7 By Country - Market Size and Forecast, 2025-2035
- 12.7.1 Segment Definition and Scope
- 12.7.2 Historical Market Size, 2018-2025
- 12.7.3 Revenue Forecast, 2025-2035
- 12.7.4 Base-Year Market Share, 2025
- 12.7.5 Segment CAGR and Growth Drivers
- 12.7.6 Subsegment Market Size and Forecast
- 12.7.6.1 China
- 12.7.6.2 Japan
- 12.7.6.3 India
- 12.7.6.4 Remaining Asia-Pacific
- 12.7.7 Subsegment Pricing and Adoption Trends
- 12.7.8 Leading Suppliers and Competition
- 12.7.9 Regional Demand and Opportunities
- 12.8 Segment Growth Comparison
- 12.9 Segment Attractiveness and Priority Matrix
Chapter 13 Asia-Pacific Manufacturing Operations Management Software End-Use and Application Market Outlook
- 13.1 End-Use Industry and Customer Demand Structure
- 13.2 Leading Applications and Customer Groups
- 13.3 End-Use Market Size, Share and Forecast
- 13.4 Major End-Use Industry Deep Dives
- 13.4.1 Customer Requirements and Use Cases
- 13.4.2 Demand and Replacement Cycles
- 13.4.3 Technical and Regulatory Considerations
- 13.4.4 Purchasing and Procurement Models
- 13.4.5 Leading Vendors and Distribution Channels
- 13.4.6 Forecast and Commercial Opportunities
- 13.5 Emerging Applications and Cross-Segment Demand
- 13.6 End-Use Industry Investment Priorities
Chapter 14 Asia-Pacific Manufacturing Operations Management Software Geographic Market Outlook, 2025-2035
- 14.1 Regional Market Size and Country-Level Shares, 2025
- 14.2 Country Market Size Comparison, 2025
- 14.3 Country Market Forecasts, 2025-2035
- 14.4 Subregional Industrial and Demand Clusters
- 14.5 Intra-Regional Pricing and Cost Differences
- 14.6 Cross-Border Trade and Supply Networks
- 14.7 Regional Supply and Demand Balances
- 14.8 Country Opportunity Comparison and Prioritization
Note: Every listed country is covered on the structure shown under the first country.
Chapter 15 Asia-Pacific Manufacturing Operations Management Software Technology, Innovation and Sustainability Outlook
- 15.1 Technology Landscape and Maturity
- 15.2 Product, Process and Service Innovation
- 15.3 AI, Automation and Digital Tools in the Industry
- 15.4 Technology Adoption and Performance Benchmarking
- 15.5 Innovation Pipeline and R&D Investment
- 15.6 Patent and Intellectual Property Trends
- 15.7 Energy Efficiency and Resource Management
- 15.8 Sustainability, Recycling and Circularity
- 15.9 Technology Roadmap, 2025-2035
- 15.10 Risks of Obsolescence and Technology Substitution
Chapter 16 Asia-Pacific Manufacturing Operations Management Software Market Key Strategic Imperatives
- 16.1 Growth and Market Entry Priorities
- 16.2 High-Return Products and Segments
- 16.3 Pricing, Profitability and Cost Optimization
- 16.4 Technology Investment and Product Differentiation
- 16.5 Supply Chain Localization and Resilience
- 16.6 Distribution and Customer Acquisition
- 16.7 Partnership, Acquisition and Capacity Strategy
- 16.8 Regional Expansion Priorities
- 16.9 Short-, Medium- and Long-Term Actions
Chapter 17 Competition Outlook
- 17.1 Industry Competition Characteristics
- 17.2 Market Structure and Concentration
- 17.3 Market Share and Competitive Positioning, 2025
- 17.4 Company-Wise Revenue and Product Benchmarking
- 17.5 Production and Service Capacity Benchmarking
- 17.6 Technology, Pricing and Differentiation
- 17.7 Regional Footprint and Distribution Strength
- 17.8 Mergers, Acquisitions and Strategic Alliances
- 17.9 New Entrants and Competitive Threats
- 17.10 Porter's Five Forces and Industry Attractiveness
- 17.11 Competitive Outlook, 2025-2035
Chapter 18 Company Profiles
- 18.1 Company Coverage and Selection Criteria
- 18.2 AVEVA Group Limited
- 18.2.1 Business Description
- 18.2.2 Company Ownership and Geographic Presence
- 18.2.3 Product and Service Portfolio
- 18.2.4 Manufacturing and Operating Footprint
- 18.2.5 Financial Performance and Investment
- 18.2.6 Market Share and Competitive Position
- 18.2.7 Technology and Innovation Capabilities
- 18.2.8 Strategic Alliances or Partnerships
- 18.2.9 Recent Developments
- 18.2.10 Growth Strategy and Outlook
- 18.3 Siemens
- 18.4 Dassault Systèmes
- 18.5 Rockwell Automation
- 18.6 Yokogawa Electric
- 18.7 Other Relevant Market Participants
Note: Every listed company is profiled on the structure shown under the first company. The company list is preliminary and may change based on research findings, market developments, data availability and client requirements.
Chapter 19 Disclaimer
- 19.1 Research and Forecast Disclaimer
- 19.2 Data Source and Estimation Limitations
Note: The depth of individual sections depends on data availability for this market. Volume, capacity, trade and other unit-based metrics are included where applicable.

