
Real-time temperature data becomes a buying priority
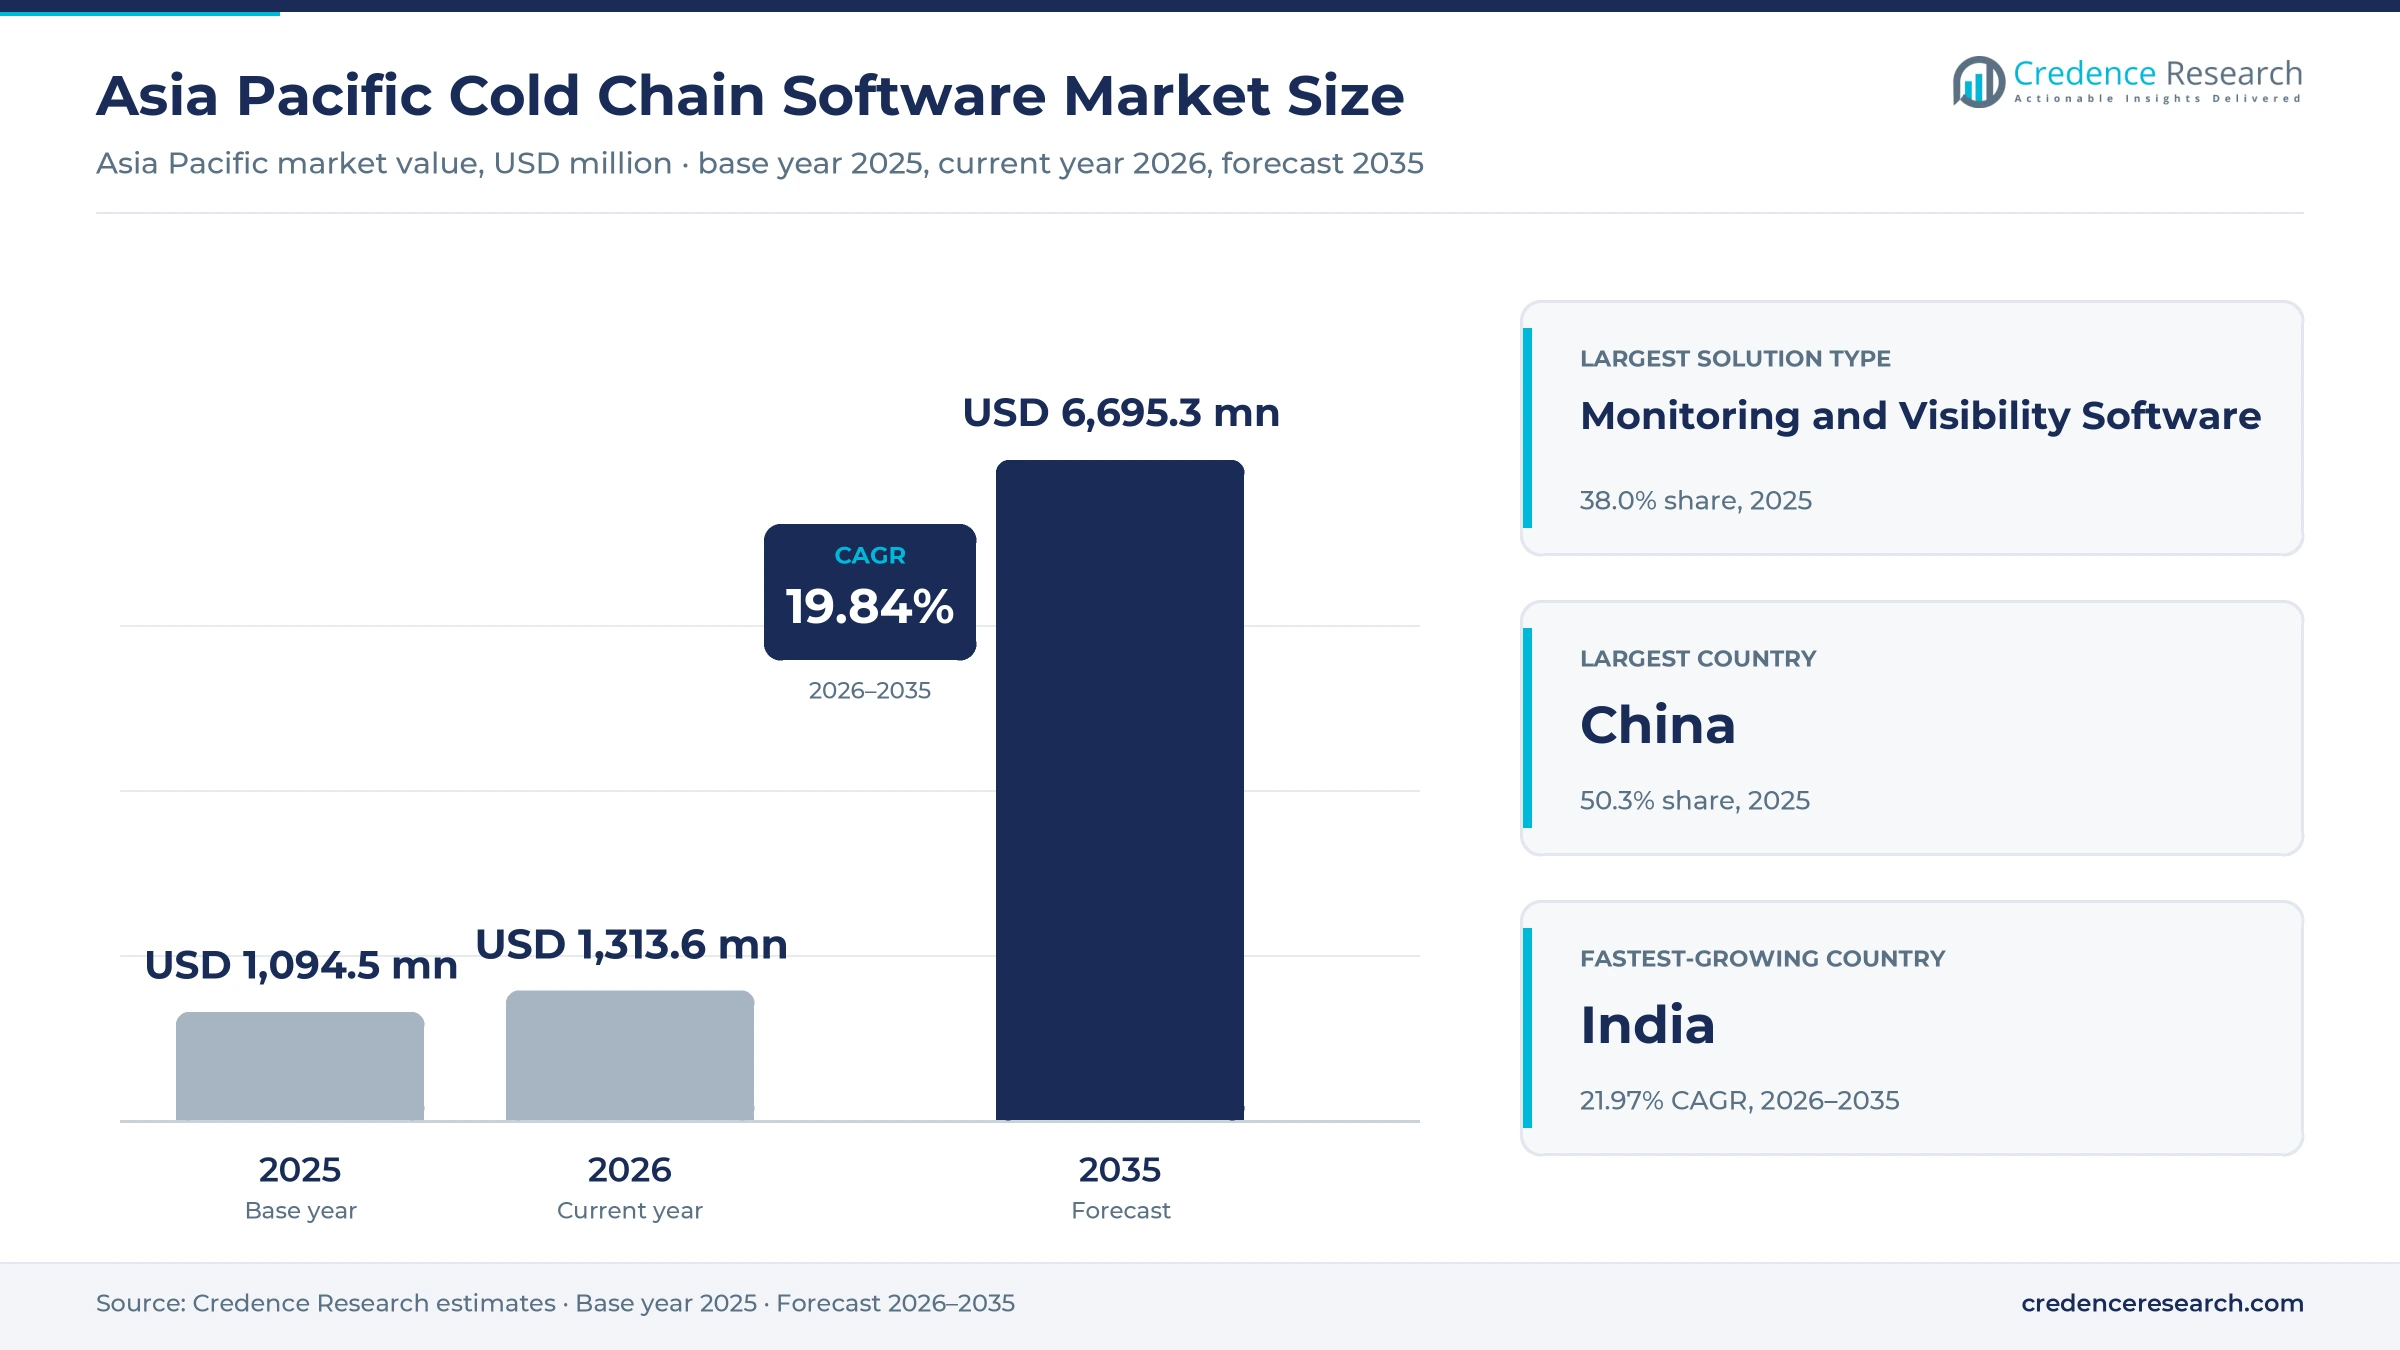
The Asia Pacific cold chain software market was valued at USD 1.09 billion in 2025 and is projected to increase from USD 1.31 billion in 2026 to USD 6.70 billion by 2035, registering a CAGR of 19.84% during 2026–2035. Demand comes from food distributors, drug makers, cold store operators and reefer carriers that need proof of temperature control from farm or factory to the final shelf. China held the largest share, 50.3% in 2025, because its cold storage base and refrigerated truck fleet keep expanding quickly. India is the fastest-growing country at 21.97% a year, as drug makers upgrade quality systems and new food cold chain projects come online. Technology also shifted in September 2026, when Sensitech launched a global 4G tracker for perishable food shipments at a Hong Kong produce show. As a result, buyers increasingly expect live alerts instead of data downloaded after a shipment arrives.
Which temperature-control software sales are counted?
The estimate measures spending on monitoring and visibility software, cold chain warehouse management software, cold chain transportation management software and analytics and compliance software used in China, India, Japan and the rest of Asia Pacific. It counts subscription, perpetual licence and usage-based fees paid by food, drug, chemical and other shippers, cold store operators and logistics providers.
The estimate excludes refrigeration equipment, reefer containers, data logger hardware sold on its own, packaging and freight charges. The value chain runs from sensor makers and software vendors through integration partners to operators that store, move and release temperature-sensitive goods.
Asia Pacific Cold Chain Software Market Insights
- The market was valued at USD 1.09 billion in 2025 and is projected to reach USD 6.70 billion by 2035, registering a CAGR of 19.84% during 2026–2035.
- China held 50.3% of regional value in 2025, as its cold chain logistics volume rose 4.5% to 381.4 million tons that year.
- Monitoring and visibility software led with 38.0% of 2025 value, because shippers first buy live temperature and location alerts.
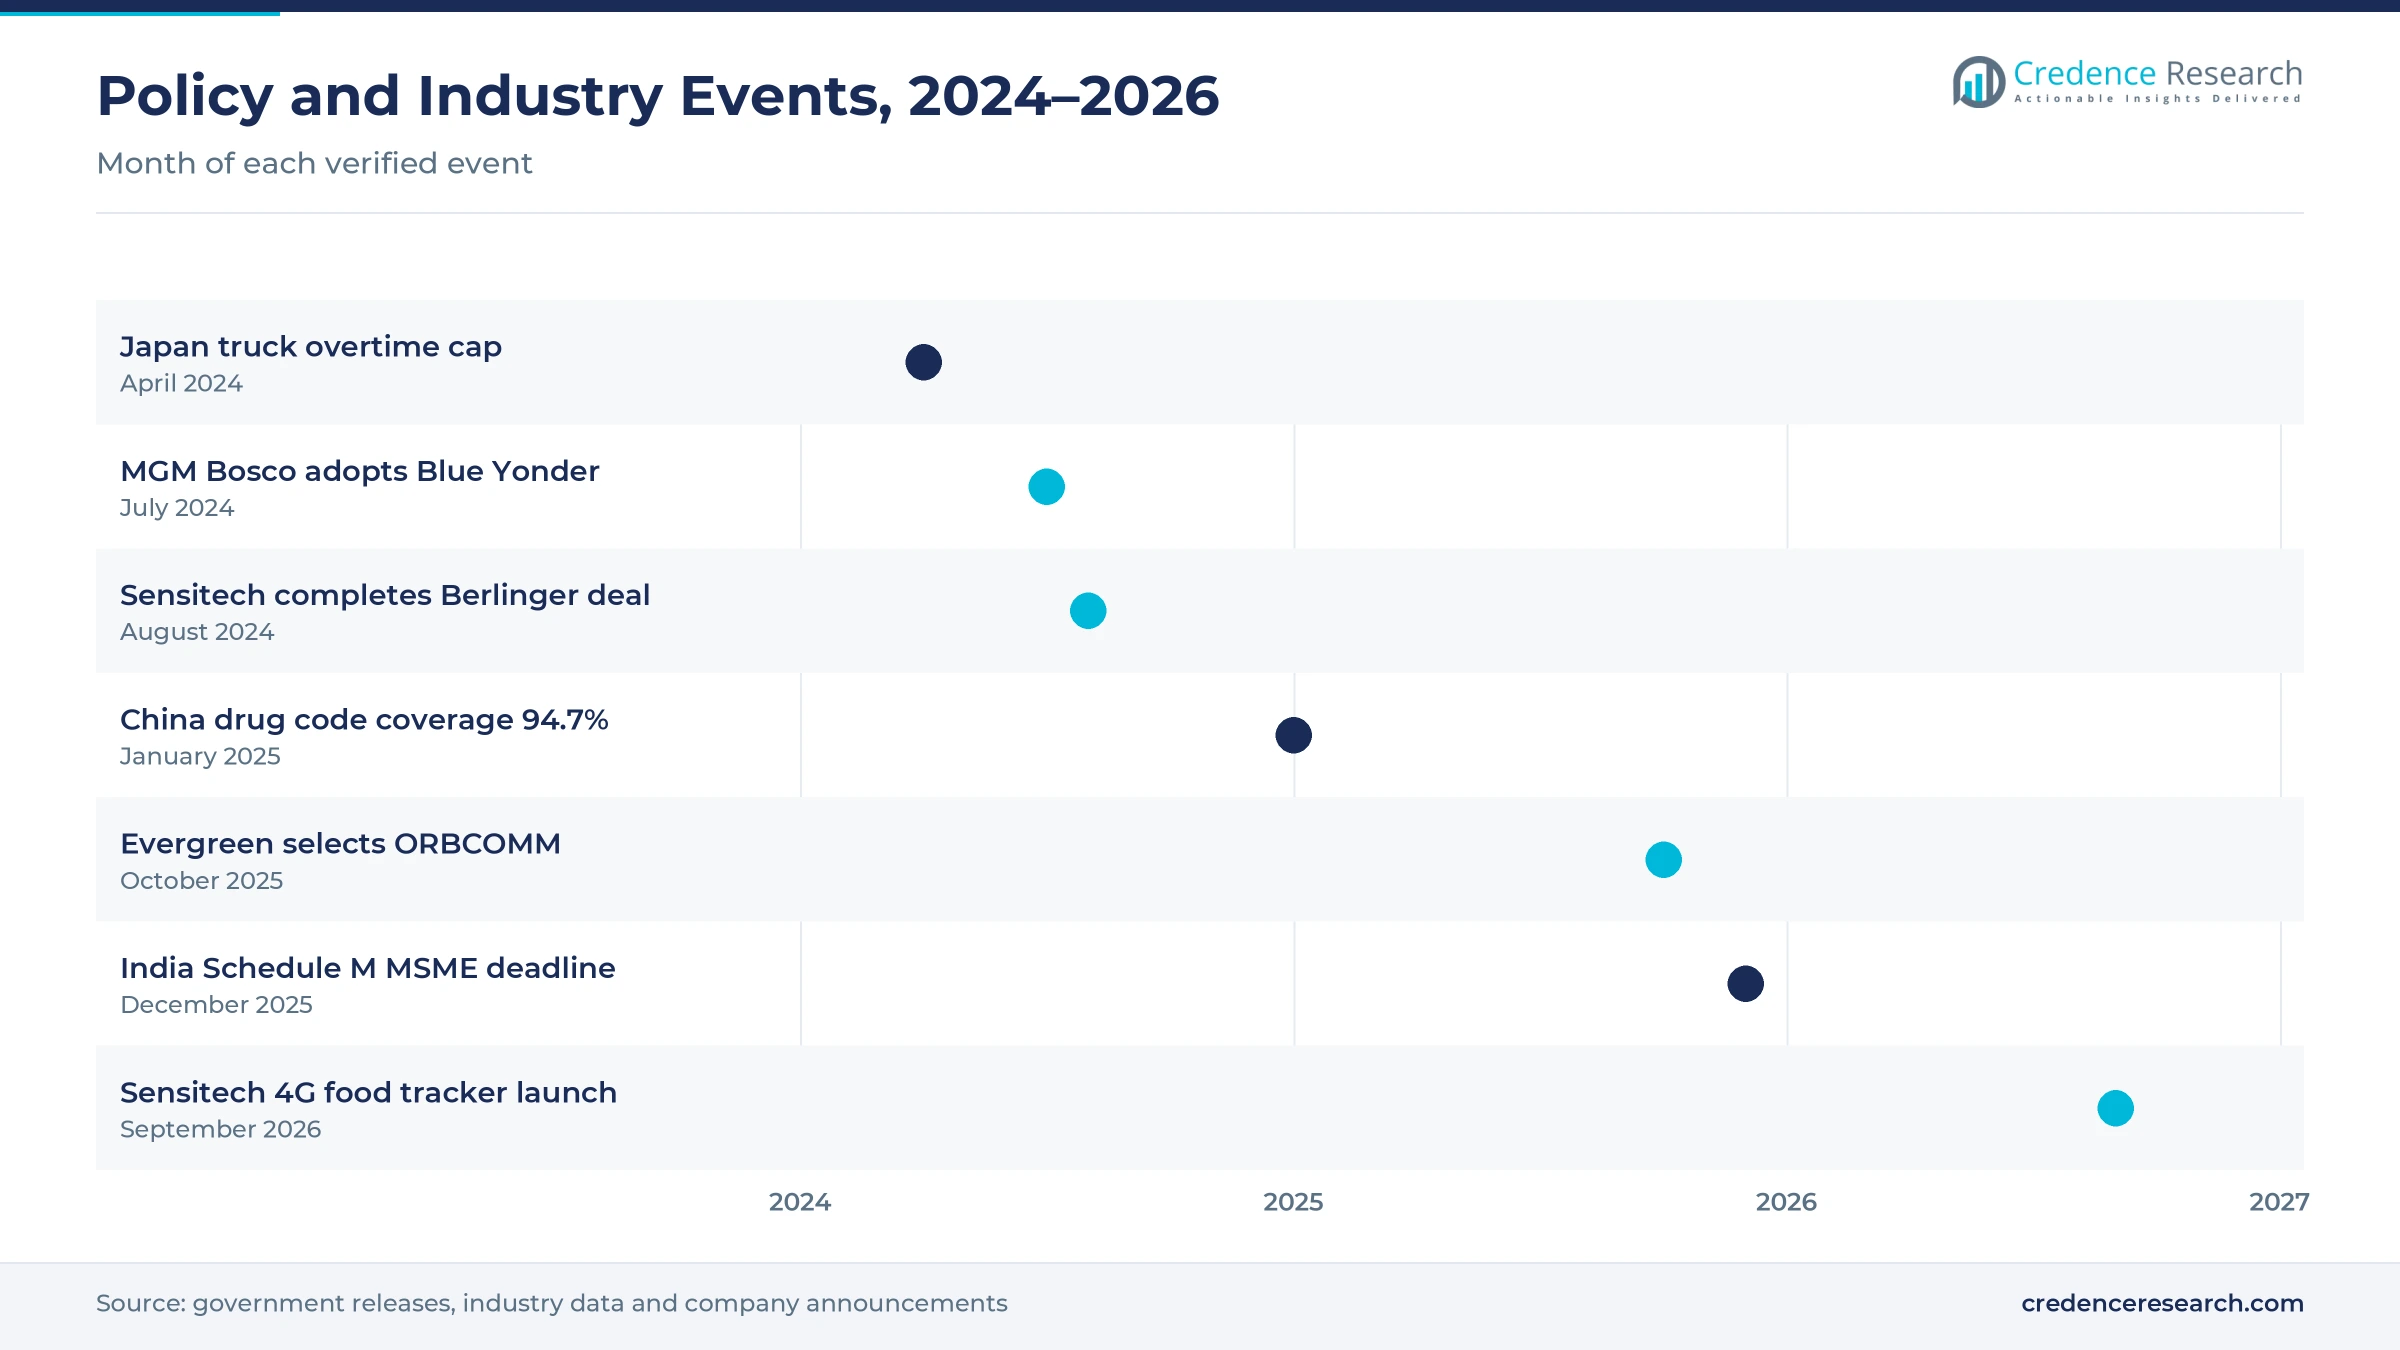
- India extended the revised Schedule M deadline for about 8,500 smaller drug units to Dec. 31, 2025, which pushes quality systems toward digital records.
- Evergreen Marine runs about 58,000 IoT-equipped reefer containers, which shows how carriers now sell condition data alongside space.
Monitoring tools, cloud delivery and food buyers lead value
Why do monitoring tools lead solution value?
Based on solution type, the market is categorized into monitoring and visibility software, cold chain warehouse management software, cold chain transportation management software and analytics and compliance software. Monitoring and Visibility Software led with 38.0% of 2025 value, because live alerts are the first step most shippers take. Analytics and Compliance Software grows fastest at 21.24% a year, as drug makers need audit-ready release records.
How fast is cloud delivery replacing local servers?
Based on deployment model, the market is categorized into cloud-based software, on-premises software and hybrid software. Cloud-Based Software led with 58.0% of 2025 value, because tracker data from trucks, reefers and stores flows straight into hosted platforms. Cloud-Based Software also grows fastest at 20.55% a year, as mid-sized operators avoid the cost of running their own servers.
Which industries buy the most temperature software?
Based on end-use industry, the market is categorized into food and beverages, pharmaceuticals and healthcare, specialty chemicals and other temperature-sensitive goods. Food and Beverages led with 52.0% of 2025 value, because frozen meat, dairy, seafood and produce make up most cold chain volume. Pharmaceuticals and Healthcare grows fastest at 20.66% a year, as regulators demand stronger product traceability.
Where is software used across the cold network?
Based on application, the market is categorized into storage operations, transportation operations and network quality management. Storage Operations led with 41.0% of 2025 value, because cold stores were the first sites to adopt warehouse management systems with temperature zones. Network Quality Management grows fastest at 20.99% a year, as shippers manage excursions across many partners.
| Segment Group | Leading Sub-segment | Share, 2025 | Fastest-growing Sub-segment | CAGR, 2026–2035 |
|---|---|---|---|---|
| By Solution Type | Monitoring and Visibility Software | 38.0% | Analytics and Compliance Software | 21.24% |
| By Deployment Model | Cloud-Based Software | 58.0% | Cloud-Based Software | 20.55% |
| By End-Use Industry | Food and Beverages | 52.0% | Pharmaceuticals and Healthcare | 20.66% |
| By Application | Storage Operations | 41.0% | Network Quality Management | 20.99% |
Request a Free Sample
Fill in your details and we'll send you a free sample report.
- Sample data tables & charts
- Research methodology
Drug quality rules and new cold stores lift demand
How does drug quality digitization lift software demand?
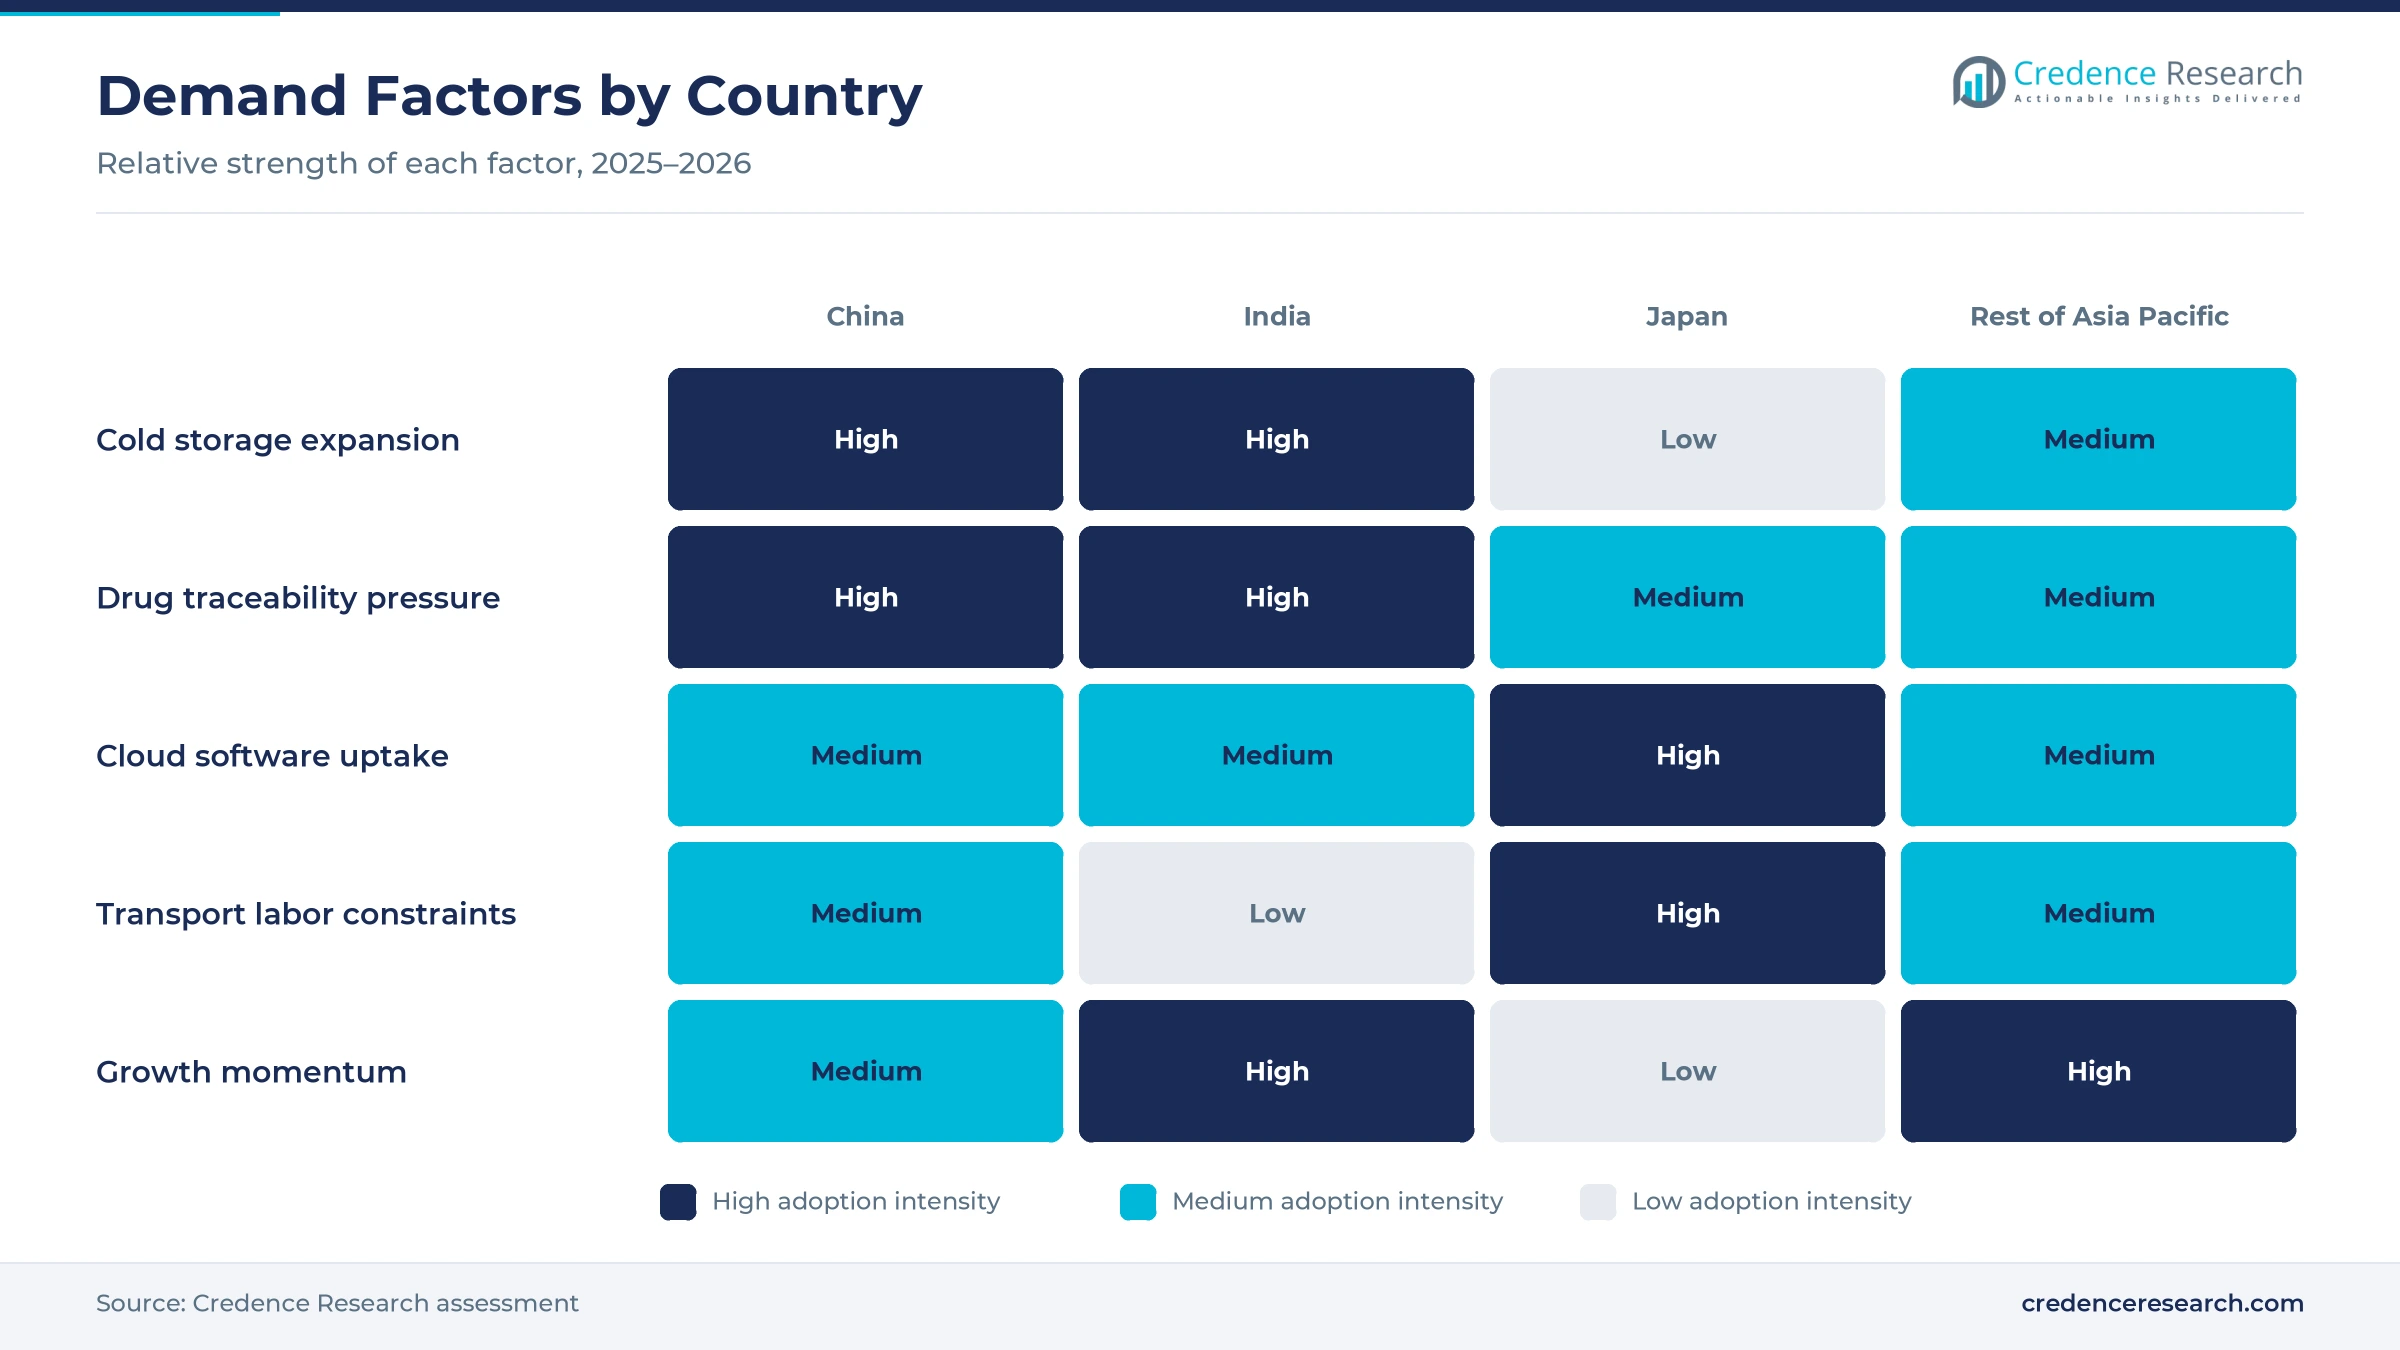
Regulators in India and China now expect drug makers and distributors to prove product history electronically, which turns paper quality files into software projects. India notified its revised Schedule M good manufacturing rules on Dec. 28, 2023, and gave about 8,500 smaller units until Dec. 31, 2025 to comply, according to India Briefing. In China, about 880,000 insurance-designated institutions, or 94.7% of the total, were linked to drug traceability codes by January 2025, as reported by China Daily, citing the National Healthcare Security Administration. India also shipped more than $30 billion of pharmaceuticals in fiscal 2024-25, according to All India Radio. As a result, pharmaceuticals and healthcare is the fastest-growing end-use industry at 20.66% a year.
Why does connected cold chain infrastructure expand demand?
Every new cold store and refrigerated truck in the region needs a system that logs temperatures, slots and routes from the first day of operation. China's cold storage capacity grew 5.53% in 2025, and its refrigerated truck fleet reached about 587,900 units, up about 19%, according to the International Institute of Refrigeration, citing CFLP data. India had approved 395 integrated cold chain projects by June 2025, with 291 operational and 25.52 lakh metric tons of yearly preservation capacity, according to the Press Information Bureau. MEDLOG and CMLog announced a Lingang cold store of about 80,000 tons in March 2026 with automated warehouse management. Therefore, storage operations hold 41.0% of 2025 application value in the regional model.
How does exception management reshape food distribution?
Fresh and frozen food shippers lose value when a delay, power fault or door opening goes unnoticed for several hours on a long route. Sensitech launched TempTale GEO APX Global on Sept. 1, 2026, with departure, arrival and exception alerts for ocean, road and rail shipments, according to Carrier. The device supports refrigerated shipments for up to 60 days and frozen loads for up to 120 days. Evergreen Marine said in September 2026 that about 58,000 of its reefer containers transmit temperature, humidity and status data, according to Container News. In turn, food and beverages hold 52.0% of 2025 value, which makes food distribution the largest buyer group.
Why do driver limits push transport software in Japan?
Japanese carriers must now move the same chilled freight with fewer driver hours, which raises the value of better route and load planning. Japan capped truck driver overtime at 960 hours a year from April 2024, and the country could lack capacity for up to 34% of domestic cargo by 2030 without reform, according to an AFP report carried by The Daily Star. Oracle Japan published new Oracle Transportation Management features on Feb. 6, 2025, including AI-based transit time prediction that flags high-risk shipments. Better load planning lets cold chain carriers fill trucks and cut empty trips. Therefore, cold chain transportation management software keeps pace with the market, while Japan holds 11.9% of 2025 regional value.
Cellular trackers and partner channels reshape buying
How is the shift to cellular trackers changing monitoring?
Shippers increasingly replace passive data loggers with connected devices, because they want to act before a load spoils rather than after it arrives. Sensitech built its September 2026 tracker on 4G LTE, so it keeps working as 2G and 3G networks are phased out, and data flows to its SensiWatch platform without manual downloads. Sensitech also announced a collaboration with Qualcomm on connected supply chain technologies in October 2024. Ocean Network Express introduced its CONTAINER+ reefer monitoring dashboard in July 2026, according to FreshPlaza. As a result, monitoring and visibility software holds 38.0% of 2025 value, and cloud-based software grows at 20.55% a year.
Why is the rise of predictive analytics notable?
Buyers now want software that warns of equipment failures and route delays early, rather than tools that only record what went wrong. Evergreen Marine said in September 2026 that it uses remote reefer diagnostics to spot equipment problems before failure, which supports a move from reactive to preventive maintenance. Oracle added AI transit time prediction and route prediction to its transportation software in early 2025. Infor highlighted agentic orchestration and process mining for warehouse users in Asia Pacific in September 2026. China's drug traceability system also handles 180 billion to 300 billion pieces of traceability data a year, which only analytics tools can review at scale. Therefore, analytics and compliance software is the fastest-growing solution type at 21.24% a year, and network quality management grows at 20.99%.
Can Southeast Asian operators open a new buyer base?
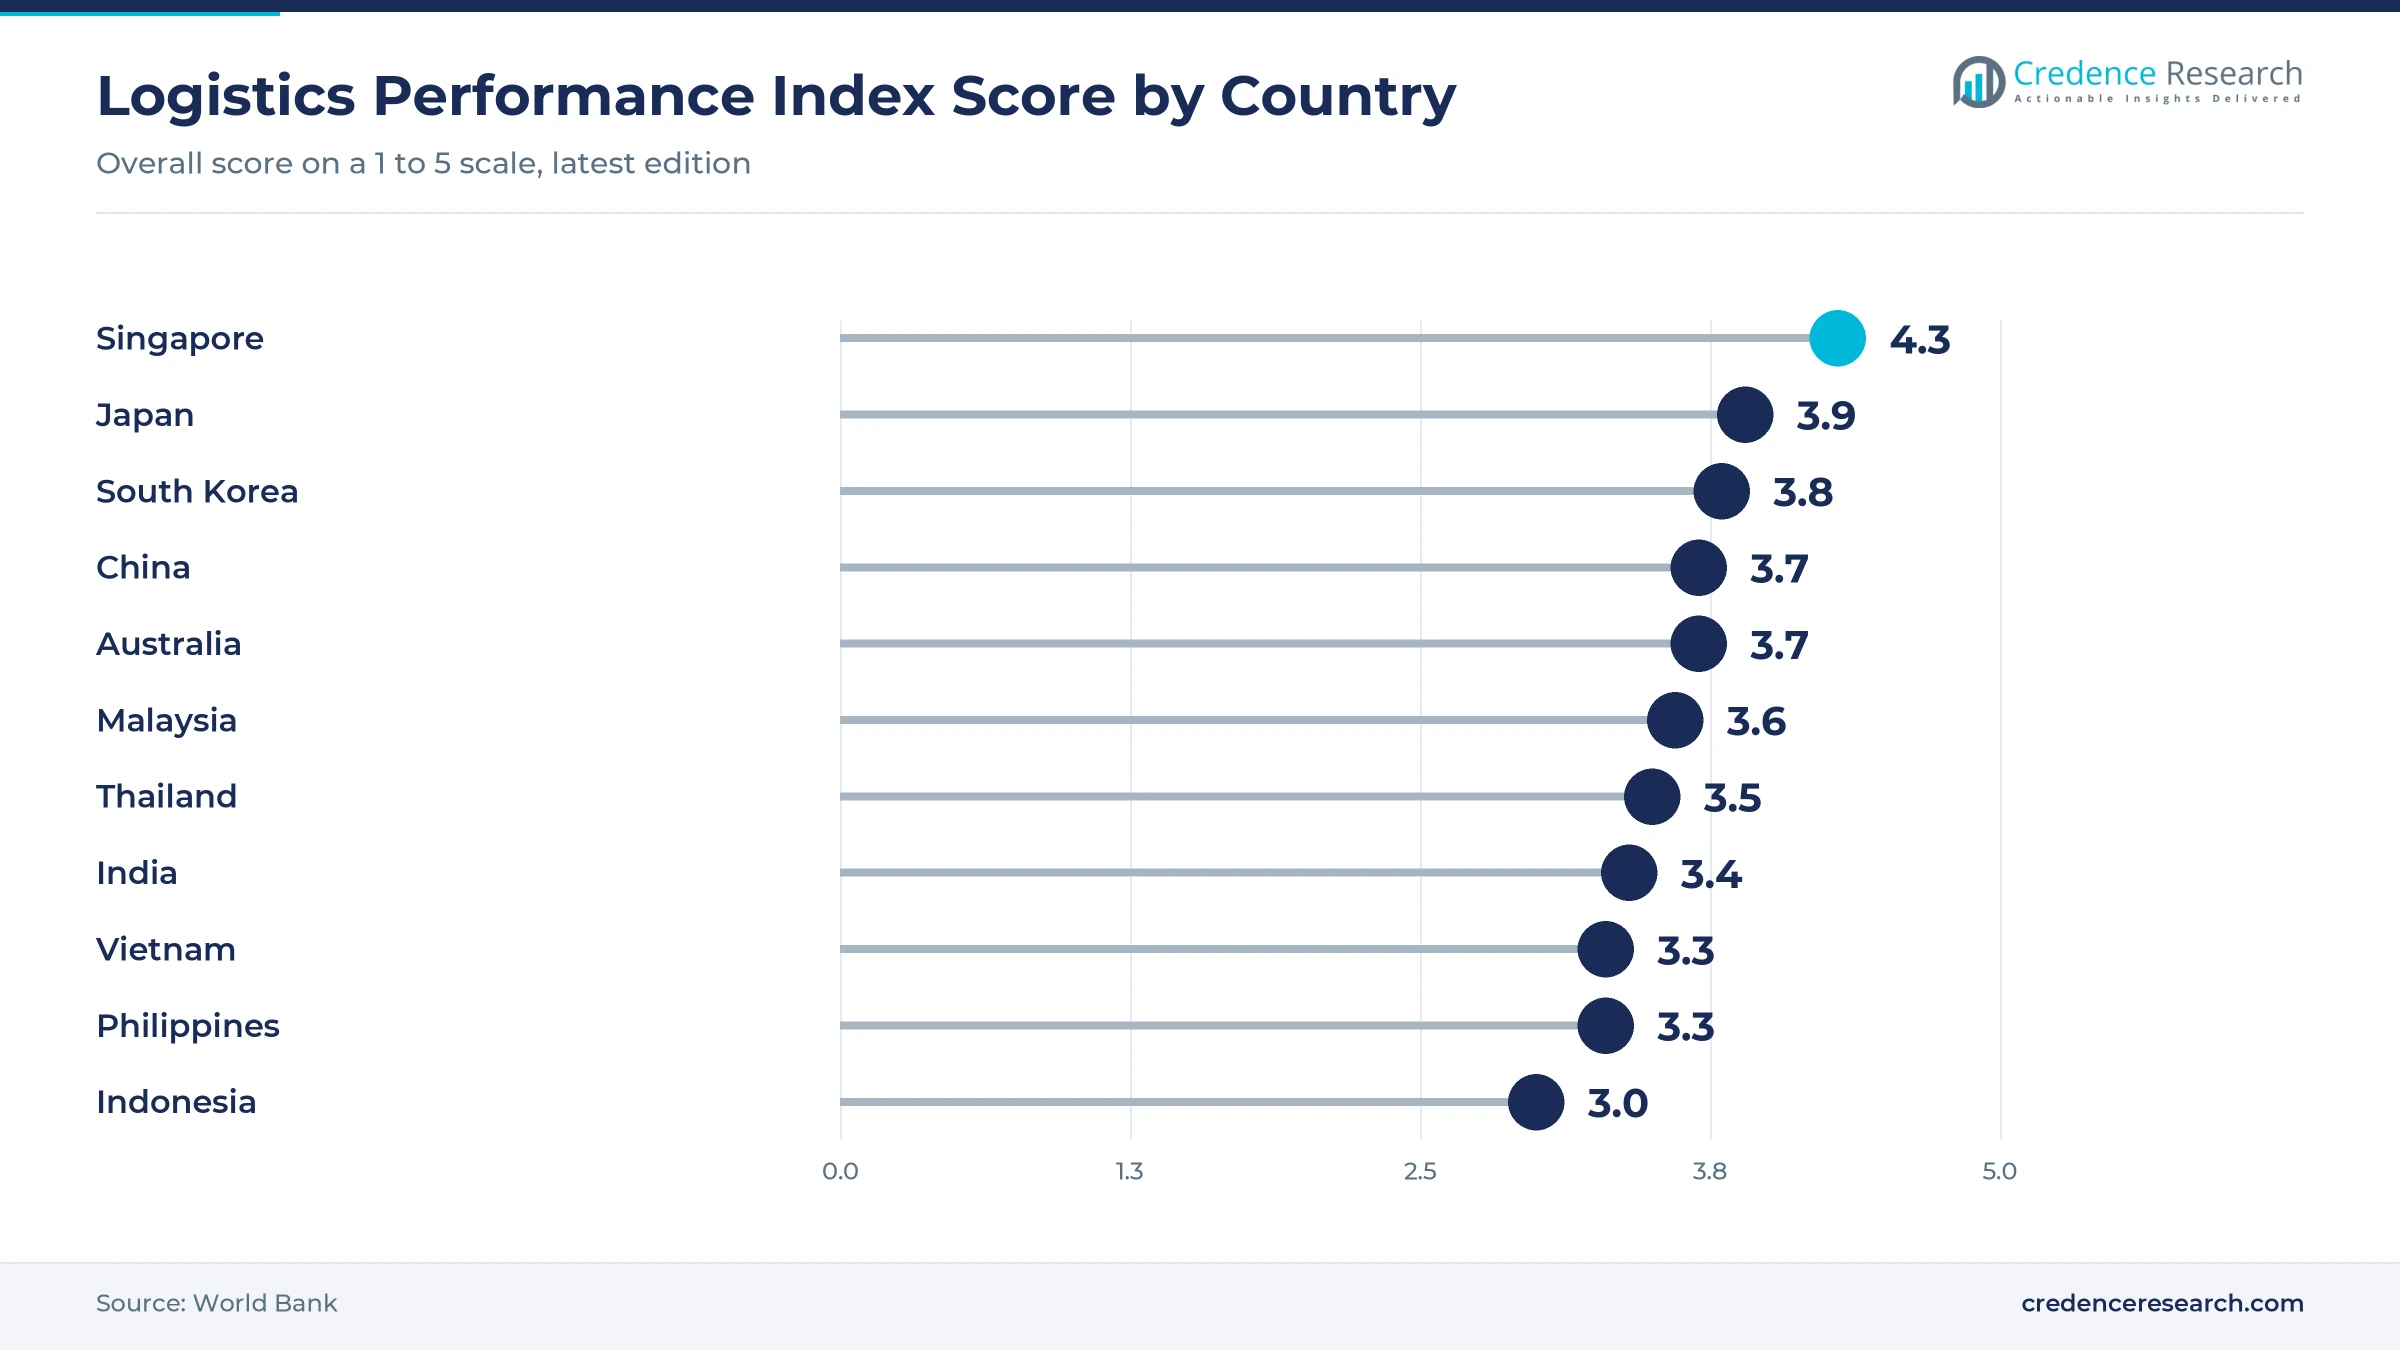
Many cold store and fleet operators in Southeast Asia still work with limited digital tools, which leaves a large group of first-time software buyers. Indonesia scored 3.0, Vietnam and the Philippines 3.3 and Singapore 4.3 on the latest World Bank Logistics Performance Index, which shows a wide service gap. Infor added NEOS by Argon & Co as a warehouse software partner for Australia, New Zealand, Japan, Malaysia, Thailand and Singapore in September 2026. Indonesian cold chain provider MGM Bosco Logistics adopted Blue Yonder warehouse software with a local partner in July 2024. As a result, the rest of Asia Pacific holds 27.7% of 2025 value and grows at 20.17% a year.
Can public health and food programs in India open demand?
State-backed systems in India are training thousands of health and food workers to use digital records, which builds familiarity with tracked storage and delivery. India's U-WIN immunization platform had 7.43 crore registered beneficiaries, 1.26 crore sessions and 27.77 crore recorded doses as of Nov. 25, 2024, according to a Lok Sabha reply. The government added 1,920 crore rupees to its food processing program in July 2025, including 1,000 crore rupees for 50 food irradiation units. Each new irradiation unit and cold store will need its own storage and transport tracking. Therefore, India gains share from 10.1% of 2025 value as public and private projects scale up.
Fragmented operators and patchy data slow adoption
How do fragmented operators slow software adoption?
Many cold stores and reefer fleets in the region are small family businesses with thin margins and few IT staff, which slows adoption. These firms often record temperatures on paper or simple loggers, so a full software rollout looks costly and complex. As a result, vendors spend more on sales and training for each customer. Subscription pricing, cloud delivery and local partners lower the entry cost, which helps vendors reach these smaller buyers over time.
Why do connectivity gaps weaken live visibility?
Trackers on ships, rural roads and inside steel cold rooms can lose their signal for hours, which weakens the value of live alerts. Ocean Network Express notes that CONTAINER+ data may be interrupted during parts of a voyage until a cellular connection returns. This means that exception alerts can arrive late, after a load is already damaged. Buffered devices, gateway readers in warehouses and satellite links reduce this risk, although they add cost to each shipment.
How do differing country rules complicate compliance?
Drug traceability codes in China, Schedule M in India and separate good distribution rules elsewhere each require different records and reports from the same shipper. Vendors must localize audit trails, languages and validation documents for each market. In turn, regional rollouts by multinational drug makers take longer and cost more. Configurable compliance modules and local validation partners help vendors reuse work across several countries.
Why does system integration raise project risk?
Temperature data must flow between sensors, warehouse tools, transport planners and enterprise resource planning systems before alerts reach the right people. Many operators run older systems that lack open interfaces, so data stays in separate silos. As a result, projects run over budget and alerts may not reach the right team in time. Standard interfaces, prebuilt connectors and phased rollouts lower this risk for buyers.
China leads while India grows fastest to 2035
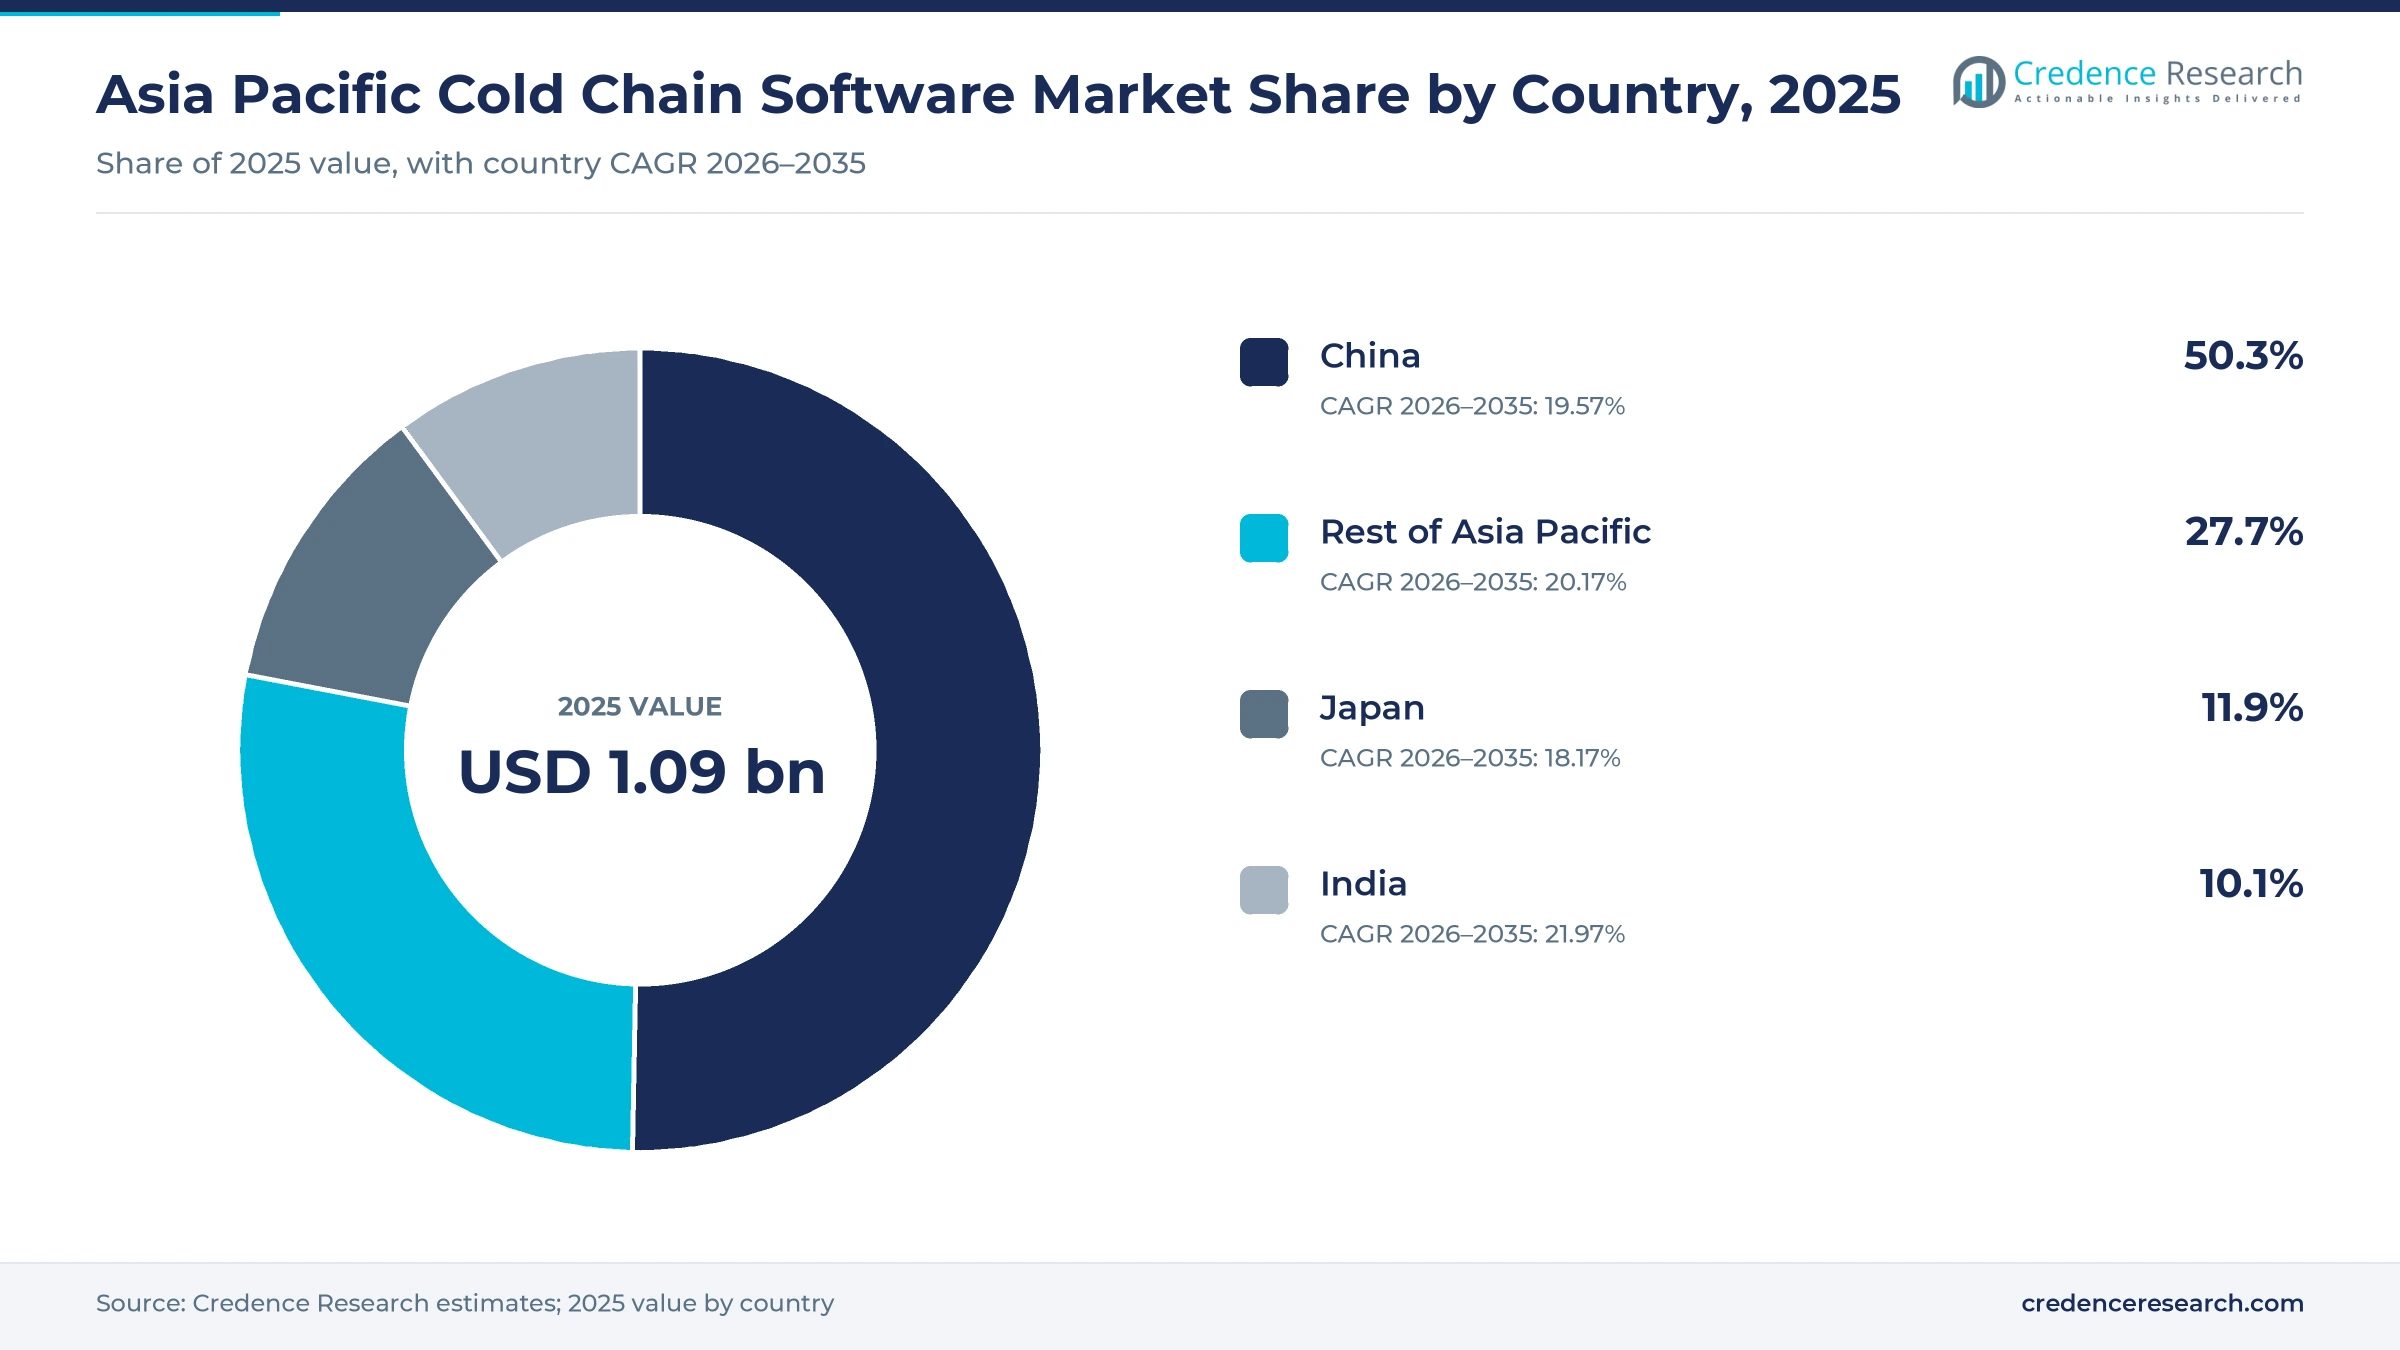
| Country | Value, 2025 (USD billion) | Share, 2025 | CAGR, 2026–2035 |
|---|---|---|---|
| China | 0.55 | 50.3% | 19.57% |
| Rest of Asia Pacific | 0.30 | 27.7% | 20.17% |
| Japan | 0.13 | 11.9% | 18.17% |
| India | 0.11 | 10.1% | 21.97% |
Why does China hold the largest share?
China held 50.3% of 2025 value and grows at 19.57% a year in the regional demand model. Its cold chain logistics volume rose 4.5% to 381.4 million tons in 2025, according to China Federation of Logistics and Purchasing data reported by FreshPlaza. The government also issued low-carbon cold chain measures in October 2025. As a result, operators need software that tracks energy use as well as temperature across stores and fleets.
How does Japan modernize a mature cold network?
Japan held 11.9% of 2025 value and grows at 18.17% a year in the regional demand model. Its cold chain is mature, so most spending replaces older systems rather than adding new sites. The 960-hour overtime cap for truck drivers from April 2024 pushes carriers toward better planning tools, and specialist healthcare logistics providers need validated records for drug deliveries.
Why is India growing fastest in the region?
India held 10.1% of 2025 value and grows fastest at 21.97% a year in the regional demand model. Revised Schedule M rules, which applied to smaller drug units from Dec. 31, 2025, push quality teams toward digital records. The country also had 291 operational integrated cold chain projects by June 2025, and each one creates new storage and transport data to manage.
What lifts the rest of Asia Pacific?
The rest of Asia Pacific held 27.7% of 2025 value and grows at 20.17% a year in the regional demand model. South Korea, Australia, Singapore and Taiwan host mature buyers, while Indonesia, Vietnam, the Philippines and Malaysia add operators that are digitizing for the first time, including Malaysian temperature-controlled logistics firms.
Tracker launches and carrier deals marked 2024 to 2026
| Development | Status and market relevance |
|---|---|
| In July 2024, Indonesian cold chain provider MGM Bosco Logistics adopted Blue Yonder warehouse management software. | Supports catch-weight handling and real-time inbound and outbound execution |
| In August 2024, Sensitech completed its acquisition of Berlinger & Co. monitoring solutions. | Expands its life sciences temperature monitoring range |
| In October 2025, Evergreen Line selected ORBCOMM smart container technology for its dry container fleet. | Adds door, shock and temperature deviation alerts with location reports |
| In September 2026, Sensitech launched TempTale GEO APX Global for perishable food shipments. | Shown at Asia Fruit Logistica in Hong Kong, Sept. 2 to 4, 2026 |
| In September 2026, Infor added NEOS by Argon & Co to its Asia Pacific partner network for warehouse software. | Covers Australia, New Zealand, Japan, Malaysia, Thailand and Singapore |
Cellular sensors and predictive tools reshape software
- Cellular trackers replace manual logger downloads, and new 4G devices send temperature, light and location data straight to cloud platforms during a trip.
- Reefer telematics let carriers watch supply and return air, humidity and power status, which links container telematics with shipper dashboards.
- Predictive models estimate arrival times and flag shipments at risk, so planners can reroute loads before a temperature limit is breached.
- Digital release tools help drug makers review excursion data quickly, and they connect with temperature monitoring systems already used in stores.
Need a Custom Version of This Report?
Tailor the scope, geography, or segments to your exact requirements.
- Custom geography or segment scope
- Direct access to our analyst team
Software suites and sensor specialists compete on data
Competition combines enterprise supply chain suites with sensor and telematics specialists. Blue Yonder sells warehouse software to cold chain providers and supported MGM Bosco Logistics in Indonesia with a local partner in 2024. Oracle promotes AI-based transit prediction in its transportation software through Oracle Japan. Infor relies on channel partners and added NEOS by Argon & Co in six Asia Pacific markets in September 2026. Sensitech, part of Carrier, competes on monitoring devices and its SensiWatch platform and launched a 4G food tracker at a Hong Kong trade show in September 2026. ORBCOMM supplies container monitoring and won Evergreen Line's dry container fleet in October 2025. Rivals compete on data quality, connectivity, validation support and the ability to link sensors with warehouse and transport planning tools.
Companies profiled and their roles in this market
| Company | Type | Role in the market |
|---|---|---|
| Blue Yonder | Supply chain software vendor | MGM Bosco Logistics in Indonesia adopted its warehouse software in July 2024 |
| Oracle | Enterprise software vendor | Oracle Japan published AI transit time prediction for its transport software in February 2025 |
| Infor | Enterprise software vendor | Added NEOS by Argon & Co as a warehouse software partner in six markets in September 2026 |
| Sensitech | Monitoring specialist, part of Carrier | Launched TempTale GEO APX Global at Asia Fruit Logistica in September 2026 |
| ORBCOMM | Container telematics provider | Selected by Evergreen Line for smart container technology in October 2025 |
Credence Research view on visibility-led growth
Credence Research's view is that Asia Pacific cold chain software value will grow on live visibility and compliance needs rather than on new cold stores alone. China remains the anchor because of its scale, although India adds the most new demand as drug quality rules tighten and food projects open. Carriers and monitoring specialists are turning condition data into a service, which pushes warehouse and transport vendors to connect their tools with sensors. Vendors with local partners and flexible pricing are best placed to win mid-sized buyers.
How the regional estimate was built
The report uses 2025 as the base year and presents market values in USD billion through 2035. Market values come from the Credence Research model, and country, solution type, deployment model, end-use industry and application splits are Credence Research estimates. Inputs include World Bank data, government and parliamentary releases, regulator statements reported by national media, industry association data and company announcements. Country shares follow the client's regional split, and growth tilts reflect cold chain capacity, drug regulation and logistics performance. No interviews or surveys were used in preparing these estimates.
India, pharma quality and analytics lead to 2035
The Asia Pacific cold chain software market is expected to reach USD 6.70 billion by 2035, a 19.84% CAGR during 2026–2035, as shippers move from manual logs to live alerts and analytics. India should gain the most share, while China stays the largest country market. Pharmaceuticals and healthcare and analytics and compliance software are expected to grow faster than the regional average. Weak connectivity, slow adoption by small operators or tight budgets would lower this outlook, while stricter traceability rules would raise it.
Frequently Asked Questions
How big is the Asia Pacific cold chain software market?
Which country leads regional demand?
Which country grows fastest?
Which solution type holds the largest share?
Which deployment model leads the market?
Why is pharmaceutical demand rising?
Who are the main companies in the market?
Which application grows fastest?
Table of Content
Chapter 1 Market Segmentation
- 1.1 Segmentation Framework
- 1.1.1 Product and Service Classification
- 1.1.2 Application and End-Use Classification
- 1.1.3 Technology and Solution Classification
- 1.1.4 Customer and Distribution Channel Classification
- 1.1.5 Geographic Segmentation
- 1.1.6 Market Segment Definitions and Boundaries
- 1.2 By Solution Type
- 1.2.1 Monitoring and Visibility Software
- 1.2.2 Cold Chain Warehouse Management Software
- 1.2.3 Cold Chain Transportation Management Software
- 1.2.4 Analytics and Compliance Software
- 1.3 By Deployment Model
- 1.3.1 Cloud-Based Software
- 1.3.2 On-Premises Software
- 1.3.3 Hybrid Software
- 1.4 By End-Use Industry
- 1.4.1 Food and Beverages
- 1.4.2 Pharmaceuticals and Healthcare
- 1.4.3 Specialty Chemicals
- 1.4.4 Other Temperature-Sensitive Goods
- 1.5 By Application
- 1.5.1 Storage Operations
- 1.5.2 Transportation Operations
- 1.5.3 Network Quality Management
- 1.6 By Country
- 1.6.1 China
- 1.6.2 India
- 1.6.3 Japan
- 1.6.4 Rest of Asia Pacific
Chapter 2 Introduction
- 2.1 Report Objectives and Scope
- 2.2 Product Definition and Industry Terminology
- 2.3 Market Inclusions and Exclusions
- 2.4 Research Process
- 2.4.1 Primary Research and Expert Interviews
- 2.4.2 Secondary Research and Source Review
- 2.4.3 Top-Down and Bottom-Up Estimation
- 2.4.4 Data Triangulation and Verification
- 2.5 Market Size Measurement Basis
- 2.5.1 2025: USD 1.09 billion → 2035: USD 6.70 billion
- 2.6 Historical and Forecast Reference Periods
- 2.6.1 Historical Period: 2018-2025
- 2.6.2 Base Year: 2025
- 2.6.3 Forecast Period: 2025-2035
- 2.7 Research Assumptions and Limitations
Chapter 3 Executive Summary
- 3.1 Market Snapshot and Key Findings
- 3.2 Base-Year Market Size, 2025
- 3.3 Forecast Market Size, 2035
- 3.4 Revenue and Volume Growth Outlook
- 3.5 Key Demand and Supply Indicators
- 3.6 Leading Market Segments
- 3.7 Fastest-Growing Market Opportunities
- 3.8 Regional Performance Highlights
- 3.9 Technology and Industry Transformation
- 3.10 Competitive Landscape Summary
- 3.11 Analyst View and Strategic Implications
Chapter 4 Asia Pacific Cold Chain Software Market Trends and Developments
- 4.1 Historical Industry Development, 2018-2025
- 4.2 Recent Market Trends and Developments
- 4.3 Demand and Customer Behavior Trends
- 4.4 Technology and Product Innovation
- 4.5 Artificial Intelligence, Automation and Digitalization
- 4.6 Local Manufacturing and Supply Chain Realignment
- 4.7 Industry Partnerships, Mergers and Acquisitions
- 4.8 Sustainability and Circular Economy Developments
- 4.9 Government and Private Sector Investment Trends
- 4.10 Emerging Business Models and Commercialization
- 4.11 Industry Developments and Announcements
Chapter 5 Asia Pacific Cold Chain Software Market Supply and Demand Analysis
- 5.1 Demand Trend and Consumption Analysis, 2018-2025
- 5.2 Demand Forecast, 2025-2035
- 5.3 Supply Chain Structure and Procurement Trends
- 5.4 Supply-Demand Gap and Bottlenecks
- 5.5 Import Dependence and Sourcing Structure
- 5.6 Regional Supply and Demand Concentration
Chapter 6 Asia Pacific Cold Chain Software Market Pricing Analysis
- 6.1 Pricing Structure and Measurement
- 6.2 Historical Pricing Trends, 2018-2025
- 6.3 Pricing Outlook, 2025-2035
- 6.4 Pricing by Product and Market Segment
- 6.5 Geographic Pricing Differences
- 6.6 Key Input, Energy, Labor and Logistics Costs
- 6.7 Contract Pricing and Purchasing Models
- 6.8 Pricing Sensitivity and Competitive Positioning
- 6.9 Price, Margin and Profitability Implications
Chapter 7 Asia Pacific Cold Chain Software Market Dynamics
- 7.1 Market Growth Drivers
- 7.1.1 Demand-Side Drivers
- 7.1.2 Technology and Innovation Drivers
- 7.1.3 Infrastructure and Investment Drivers
- 7.1.4 Regulatory and Policy Drivers
- 7.2 Market Restraints
- 7.2.1 Cost and Affordability Constraints
- 7.2.2 Technology and Adoption Barriers
- 7.2.3 Supply Chain and Operational Constraints
- 7.3 Market Challenges
- 7.3.1 Competitive Pressure and Margin Erosion
- 7.3.2 Skills, Infrastructure and Implementation Gaps
- 7.4 Emerging Market Opportunities
- 7.5 Market Dynamics Impact and Time-Horizon Assessment
Chapter 8 Asia Pacific Cold Chain Software Value Chain Analysis
- 8.1 Industry Value Chain Overview
- 8.2 Upstream Suppliers and Critical Inputs
- 8.3 Technology and Component Providers
- 8.4 Manufacturing or Service Delivery
- 8.5 Distribution, Channel Partners and Integrators
- 8.6 Downstream Applications and End Users
- 8.7 Value Addition and Profit Pools
- 8.8 Vertical Integration and Outsourcing
- 8.9 Supplier Concentration and Risk
- 8.10 Supply Chain Localization and Resilience
Chapter 9 Asia Pacific Cold Chain Software Market Regulations and Policies
- 9.1 Relevant Laws, Standards and Compliance Frameworks
- 9.2 Product, Service, Safety and Quality Requirements
- 9.3 Government Policies, Incentives and Subsidies
- 9.4 Imports, Exports and Trade Barriers
- 9.5 Public Procurement and Local Content Requirements
- 9.6 Data Protection, AI and Cybersecurity Compliance
- 9.7 Upcoming Policy Changes and Market Implications
Chapter 10 Asia Pacific Cold Chain Software Market Hotspots and Opportunities
- 10.1 Market Opportunity Mapping and Growth Hotspots
- 10.2 High-Growth Applications and Customer Groups
- 10.3 Underserved Markets and White-Space Opportunities
- 10.4 Emerging Technology and Product Opportunities
- 10.5 New Capacity and Investment Hotspots
- 10.6 Market Entry and Expansion Opportunities
- 10.7 Distribution and Partnership Opportunities
- 10.8 Near-Term and Long-Term Commercial Potential
- 10.9 Opportunity Attractiveness and Execution Risks
Chapter 11 Asia Pacific Cold Chain Software Market Outlook, 2025-2035
- 11.1 Market Size and Analysis
- 11.1.1 Revenue (Market Measurement: 2025: USD 1.09 billion → 2035: USD 6.70 billion)
- 11.1.2 Historical Market Size, 2018-2025
- 11.1.3 Base-Year Market Size, 2025
- 11.2 Market Forecast, 2025-2035
- 11.2.1 Revenue Forecast to 2035
- 11.2.2 CAGR and Year-on-Year Growth
- 11.2.3 Incremental Revenue Opportunity
- 11.3 Forecast Assumptions and Scenario Analysis
- 11.3.1 Base-Case Forecast
- 11.3.2 Optimistic and Conservative Scenarios
- 11.3.3 Technology, Pricing and Policy Sensitivities
- 11.4 Market Attractiveness and Growth Outlook
Chapter 12 Asia Pacific Cold Chain Software Market Segmentation and Outlook
- 12.1 Segmentation Summary and Market Shares, 2025
- 12.2 Largest and Fastest-Growing Segments
- 12.3 By Solution Type - Market Size and Forecast, 2025-2035
- 12.3.1 Segment Definition and Scope
- 12.3.2 Historical Market Size, 2018-2025
- 12.3.3 Revenue Forecast, 2025-2035
- 12.3.4 Base-Year Market Share, 2025
- 12.3.5 Segment CAGR and Growth Drivers
- 12.3.6 Subsegment Market Size and Forecast
- 12.3.6.1 Monitoring and Visibility Software
- 12.3.6.2 Cold Chain Warehouse Management Software
- 12.3.6.3 Cold Chain Transportation Management Software
- 12.3.6.4 Analytics and Compliance Software
- 12.3.7 Subsegment Pricing and Adoption Trends
- 12.3.8 Leading Suppliers and Competition
- 12.3.9 Regional Demand and Opportunities
- 12.4 By Deployment Model - Market Size and Forecast, 2025-2035
- 12.4.1 Segment Definition and Scope
- 12.4.2 Historical Market Size, 2018-2025
- 12.4.3 Revenue Forecast, 2025-2035
- 12.4.4 Base-Year Market Share, 2025
- 12.4.5 Segment CAGR and Growth Drivers
- 12.4.6 Subsegment Market Size and Forecast
- 12.4.6.1 Cloud-Based Software
- 12.4.6.2 On-Premises Software
- 12.4.6.3 Hybrid Software
- 12.4.7 Subsegment Pricing and Adoption Trends
- 12.4.8 Leading Suppliers and Competition
- 12.4.9 Regional Demand and Opportunities
- 12.5 By End-Use Industry - Market Size and Forecast, 2025-2035
- 12.5.1 Segment Definition and Scope
- 12.5.2 Historical Market Size, 2018-2025
- 12.5.3 Revenue Forecast, 2025-2035
- 12.5.4 Base-Year Market Share, 2025
- 12.5.5 Segment CAGR and Growth Drivers
- 12.5.6 Subsegment Market Size and Forecast
- 12.5.6.1 Food and Beverages
- 12.5.6.2 Pharmaceuticals and Healthcare
- 12.5.6.3 Specialty Chemicals
- 12.5.6.4 Other Temperature-Sensitive Goods
- 12.5.7 Subsegment Pricing and Adoption Trends
- 12.5.8 Leading Suppliers and Competition
- 12.5.9 Regional Demand and Opportunities
- 12.6 By Application - Market Size and Forecast, 2025-2035
- 12.6.1 Segment Definition and Scope
- 12.6.2 Historical Market Size, 2018-2025
- 12.6.3 Revenue Forecast, 2025-2035
- 12.6.4 Base-Year Market Share, 2025
- 12.6.5 Segment CAGR and Growth Drivers
- 12.6.6 Subsegment Market Size and Forecast
- 12.6.6.1 Storage Operations
- 12.6.6.2 Transportation Operations
- 12.6.6.3 Network Quality Management
- 12.6.7 Subsegment Pricing and Adoption Trends
- 12.6.8 Leading Suppliers and Competition
- 12.6.9 Regional Demand and Opportunities
- 12.7 By Country - Market Size and Forecast, 2025-2035
- 12.7.1 Segment Definition and Scope
- 12.7.2 Historical Market Size, 2018-2025
- 12.7.3 Revenue Forecast, 2025-2035
- 12.7.4 Base-Year Market Share, 2025
- 12.7.5 Segment CAGR and Growth Drivers
- 12.7.6 Subsegment Market Size and Forecast
- 12.7.6.1 China
- 12.7.6.2 India
- 12.7.6.3 Japan
- 12.7.6.4 Rest of Asia Pacific
- 12.7.7 Subsegment Pricing and Adoption Trends
- 12.7.8 Leading Suppliers and Competition
- 12.7.9 Regional Demand and Opportunities
- 12.8 Segment Growth Comparison
- 12.9 Segment Attractiveness and Priority Matrix
Chapter 13 Asia Pacific Cold Chain Software End-Use and Application Market Outlook
- 13.1 End-Use Industry and Customer Demand Structure
- 13.2 Leading Applications and Customer Groups
- 13.3 End-Use Market Size, Share and Forecast
- 13.4 Major End-Use Industry Deep Dives
- 13.4.1 Customer Requirements and Use Cases
- 13.4.2 Demand and Replacement Cycles
- 13.4.3 Technical and Regulatory Considerations
- 13.4.4 Purchasing and Procurement Models
- 13.4.5 Leading Vendors and Distribution Channels
- 13.4.6 Forecast and Commercial Opportunities
- 13.5 Emerging Applications and Cross-Segment Demand
- 13.6 End-Use Industry Investment Priorities
Chapter 14 Asia Pacific Cold Chain Software Geographic Market Outlook, 2025-2035
- 14.1 Regional Market Size and Country-Level Shares, 2025
- 14.2 Country Market Size Comparison, 2025
- 14.3 Country Market Forecasts, 2025-2035
- 14.4 Subregional Industrial and Demand Clusters
- 14.5 Intra-Regional Pricing and Cost Differences
- 14.6 Cross-Border Trade and Supply Networks
- 14.7 Regional Supply and Demand Balances
- 14.8 Country Opportunity Comparison and Prioritization
Note: Every listed country is covered on the structure shown under the first country.
Chapter 15 Asia Pacific Cold Chain Software Technology, Innovation and Sustainability Outlook
- 15.1 Technology Landscape and Maturity
- 15.2 Product, Process and Service Innovation
- 15.3 AI, Automation and Digital Tools in the Industry
- 15.4 Technology Adoption and Performance Benchmarking
- 15.5 Innovation Pipeline and R&D Investment
- 15.6 Patent and Intellectual Property Trends
- 15.7 Energy Efficiency and Resource Management
- 15.8 Sustainability, Recycling and Circularity
- 15.9 Technology Roadmap, 2025-2035
- 15.10 Risks of Obsolescence and Technology Substitution
Chapter 16 Asia Pacific Cold Chain Software Market Key Strategic Imperatives
- 16.1 Growth and Market Entry Priorities
- 16.2 High-Return Products and Segments
- 16.3 Pricing, Profitability and Cost Optimization
- 16.4 Technology Investment and Product Differentiation
- 16.5 Supply Chain Localization and Resilience
- 16.6 Distribution and Customer Acquisition
- 16.7 Partnership, Acquisition and Capacity Strategy
- 16.8 Regional Expansion Priorities
- 16.9 Short-, Medium- and Long-Term Actions
Chapter 17 Competition Outlook
- 17.1 Industry Competition Characteristics
- 17.2 Market Structure and Concentration
- 17.3 Market Share and Competitive Positioning, 2025
- 17.4 Company-Wise Revenue and Product Benchmarking
- 17.5 Production and Service Capacity Benchmarking
- 17.6 Technology, Pricing and Differentiation
- 17.7 Regional Footprint and Distribution Strength
- 17.8 Mergers, Acquisitions and Strategic Alliances
- 17.9 New Entrants and Competitive Threats
- 17.10 Porter's Five Forces and Industry Attractiveness
- 17.11 Competitive Outlook, 2025-2035
Chapter 18 Company Profiles
- 18.1 Company Coverage and Selection Criteria
- 18.2 Blue Yonder
- 18.2.1 Business Description
- 18.2.2 Company Ownership and Geographic Presence
- 18.2.3 Product and Service Portfolio
- 18.2.4 Manufacturing and Operating Footprint
- 18.2.5 Financial Performance and Investment
- 18.2.6 Market Share and Competitive Position
- 18.2.7 Technology and Innovation Capabilities
- 18.2.8 Strategic Alliances or Partnerships
- 18.2.9 Recent Developments
- 18.2.10 Growth Strategy and Outlook
- 18.3 Oracle
- 18.4 Infor
- 18.5 Sensitech
- 18.6 ORBCOMM
- 18.7 Other Relevant Market Participants
Note: Every listed company is profiled on the structure shown under the first company. The company list is preliminary and may change based on research findings, market developments, data availability and client requirements.
Chapter 19 Disclaimer
- 19.1 Research and Forecast Disclaimer
- 19.2 Data Source and Estimation Limitations
Note: The depth of individual sections depends on data availability for this market. Volume, capacity, trade and other unit-based metrics are included where applicable.

