
Advice, platform and SMSF software shift to cloud workflows
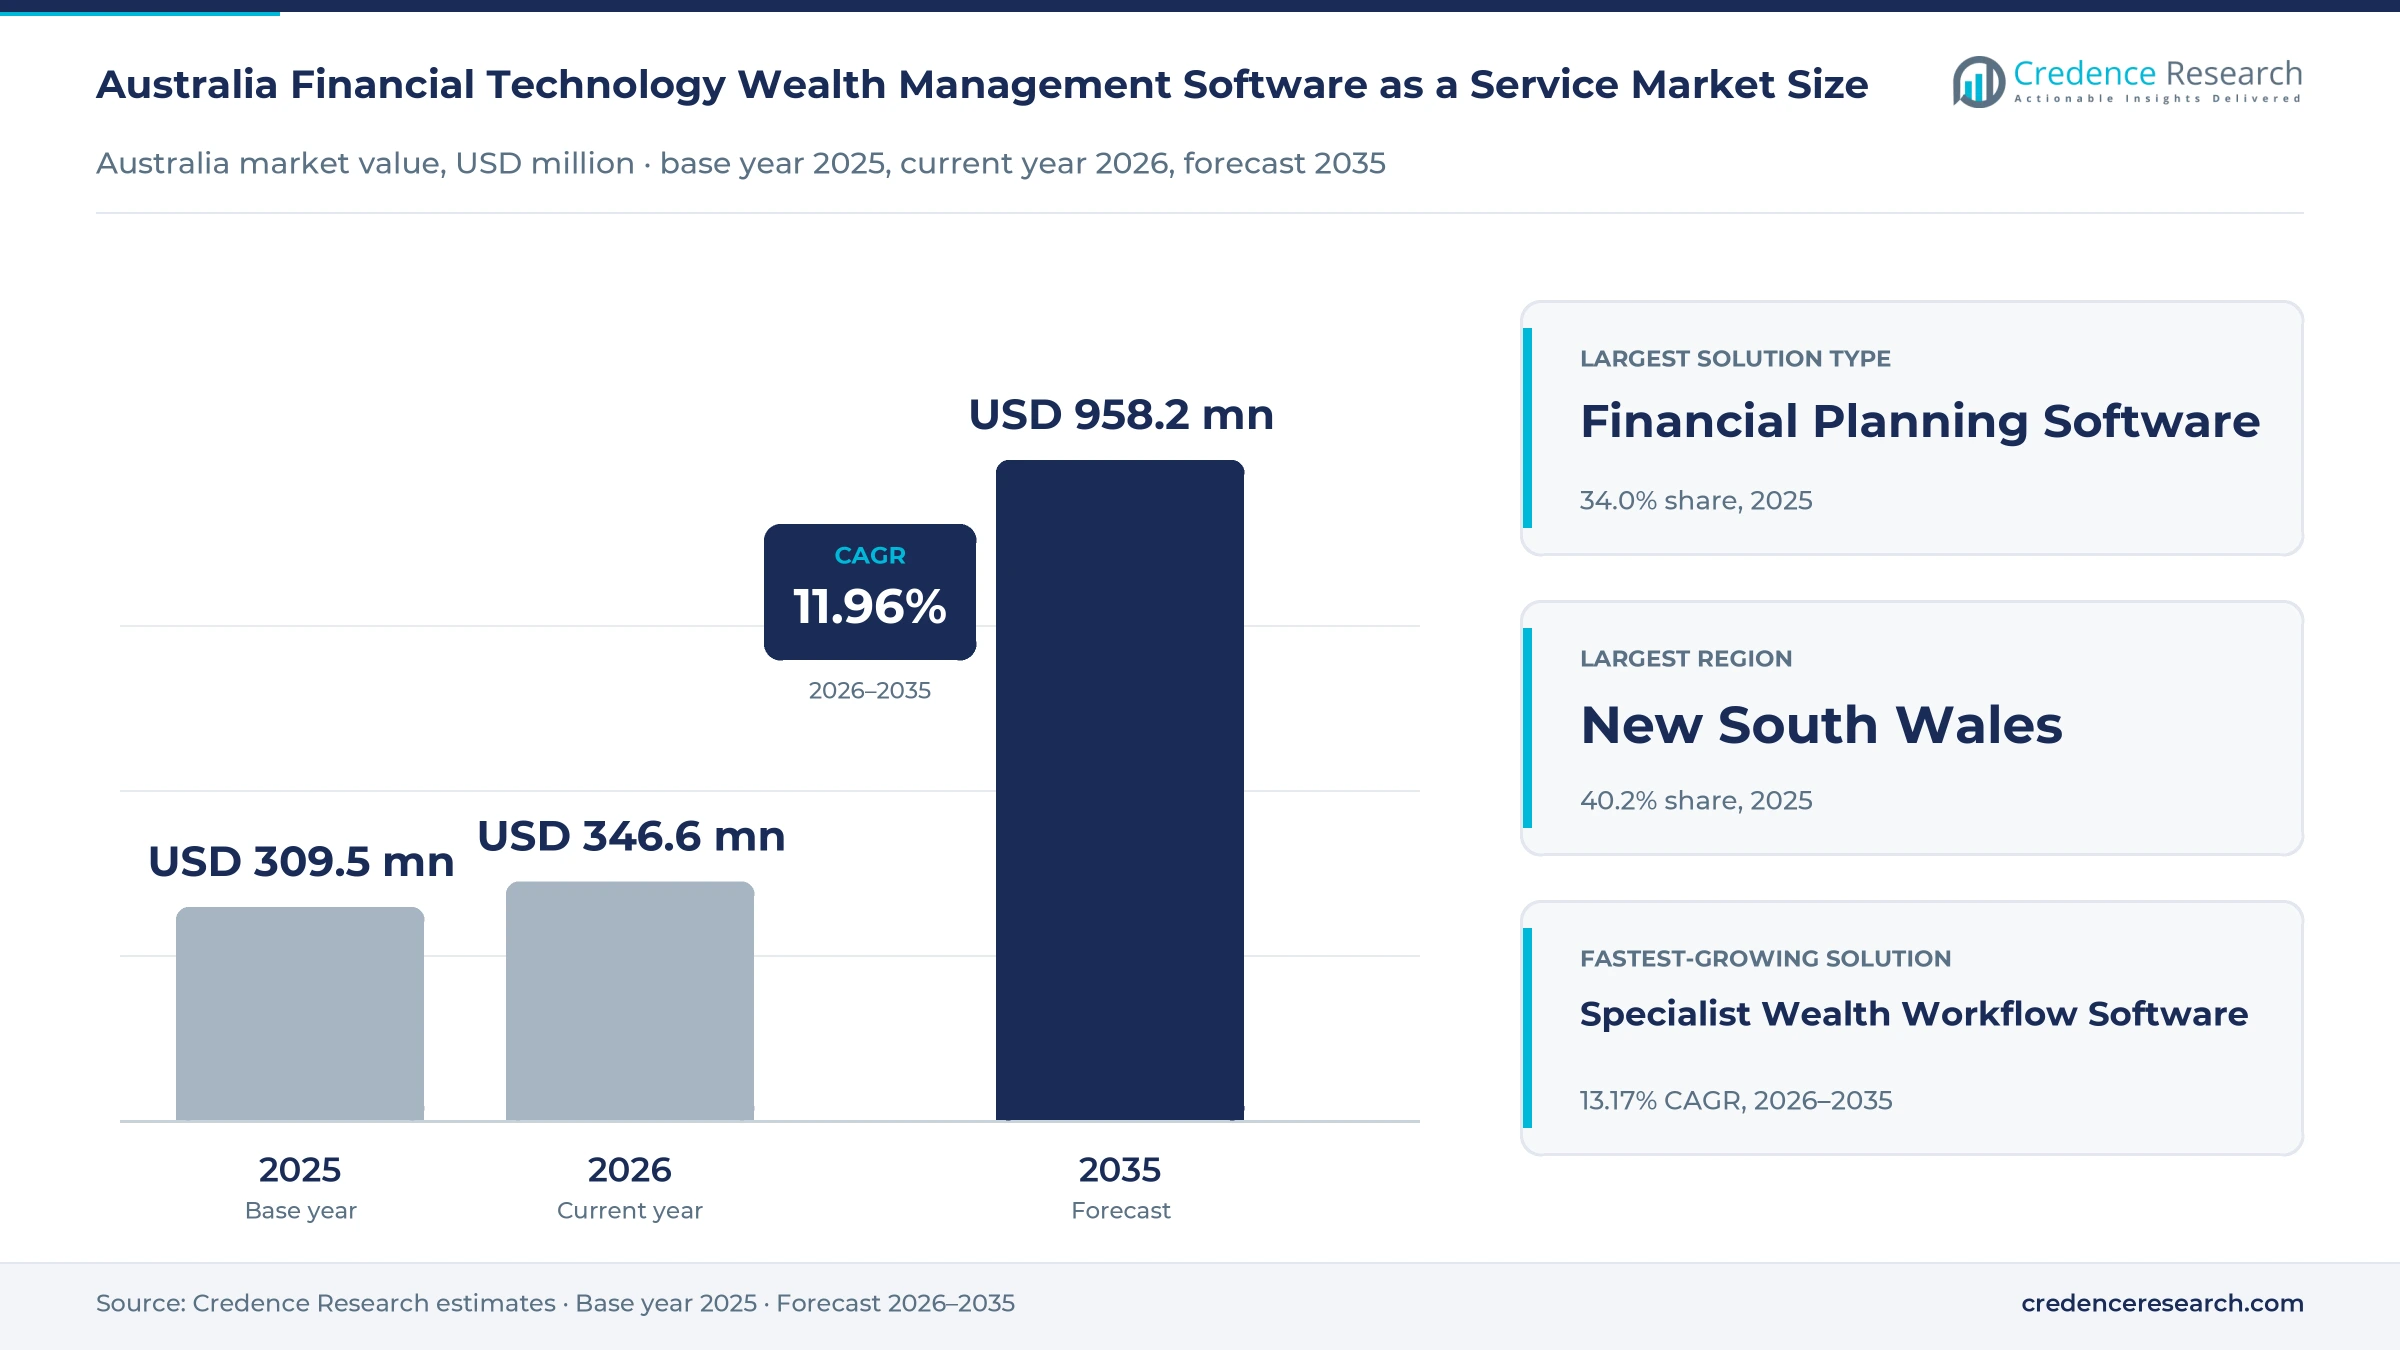
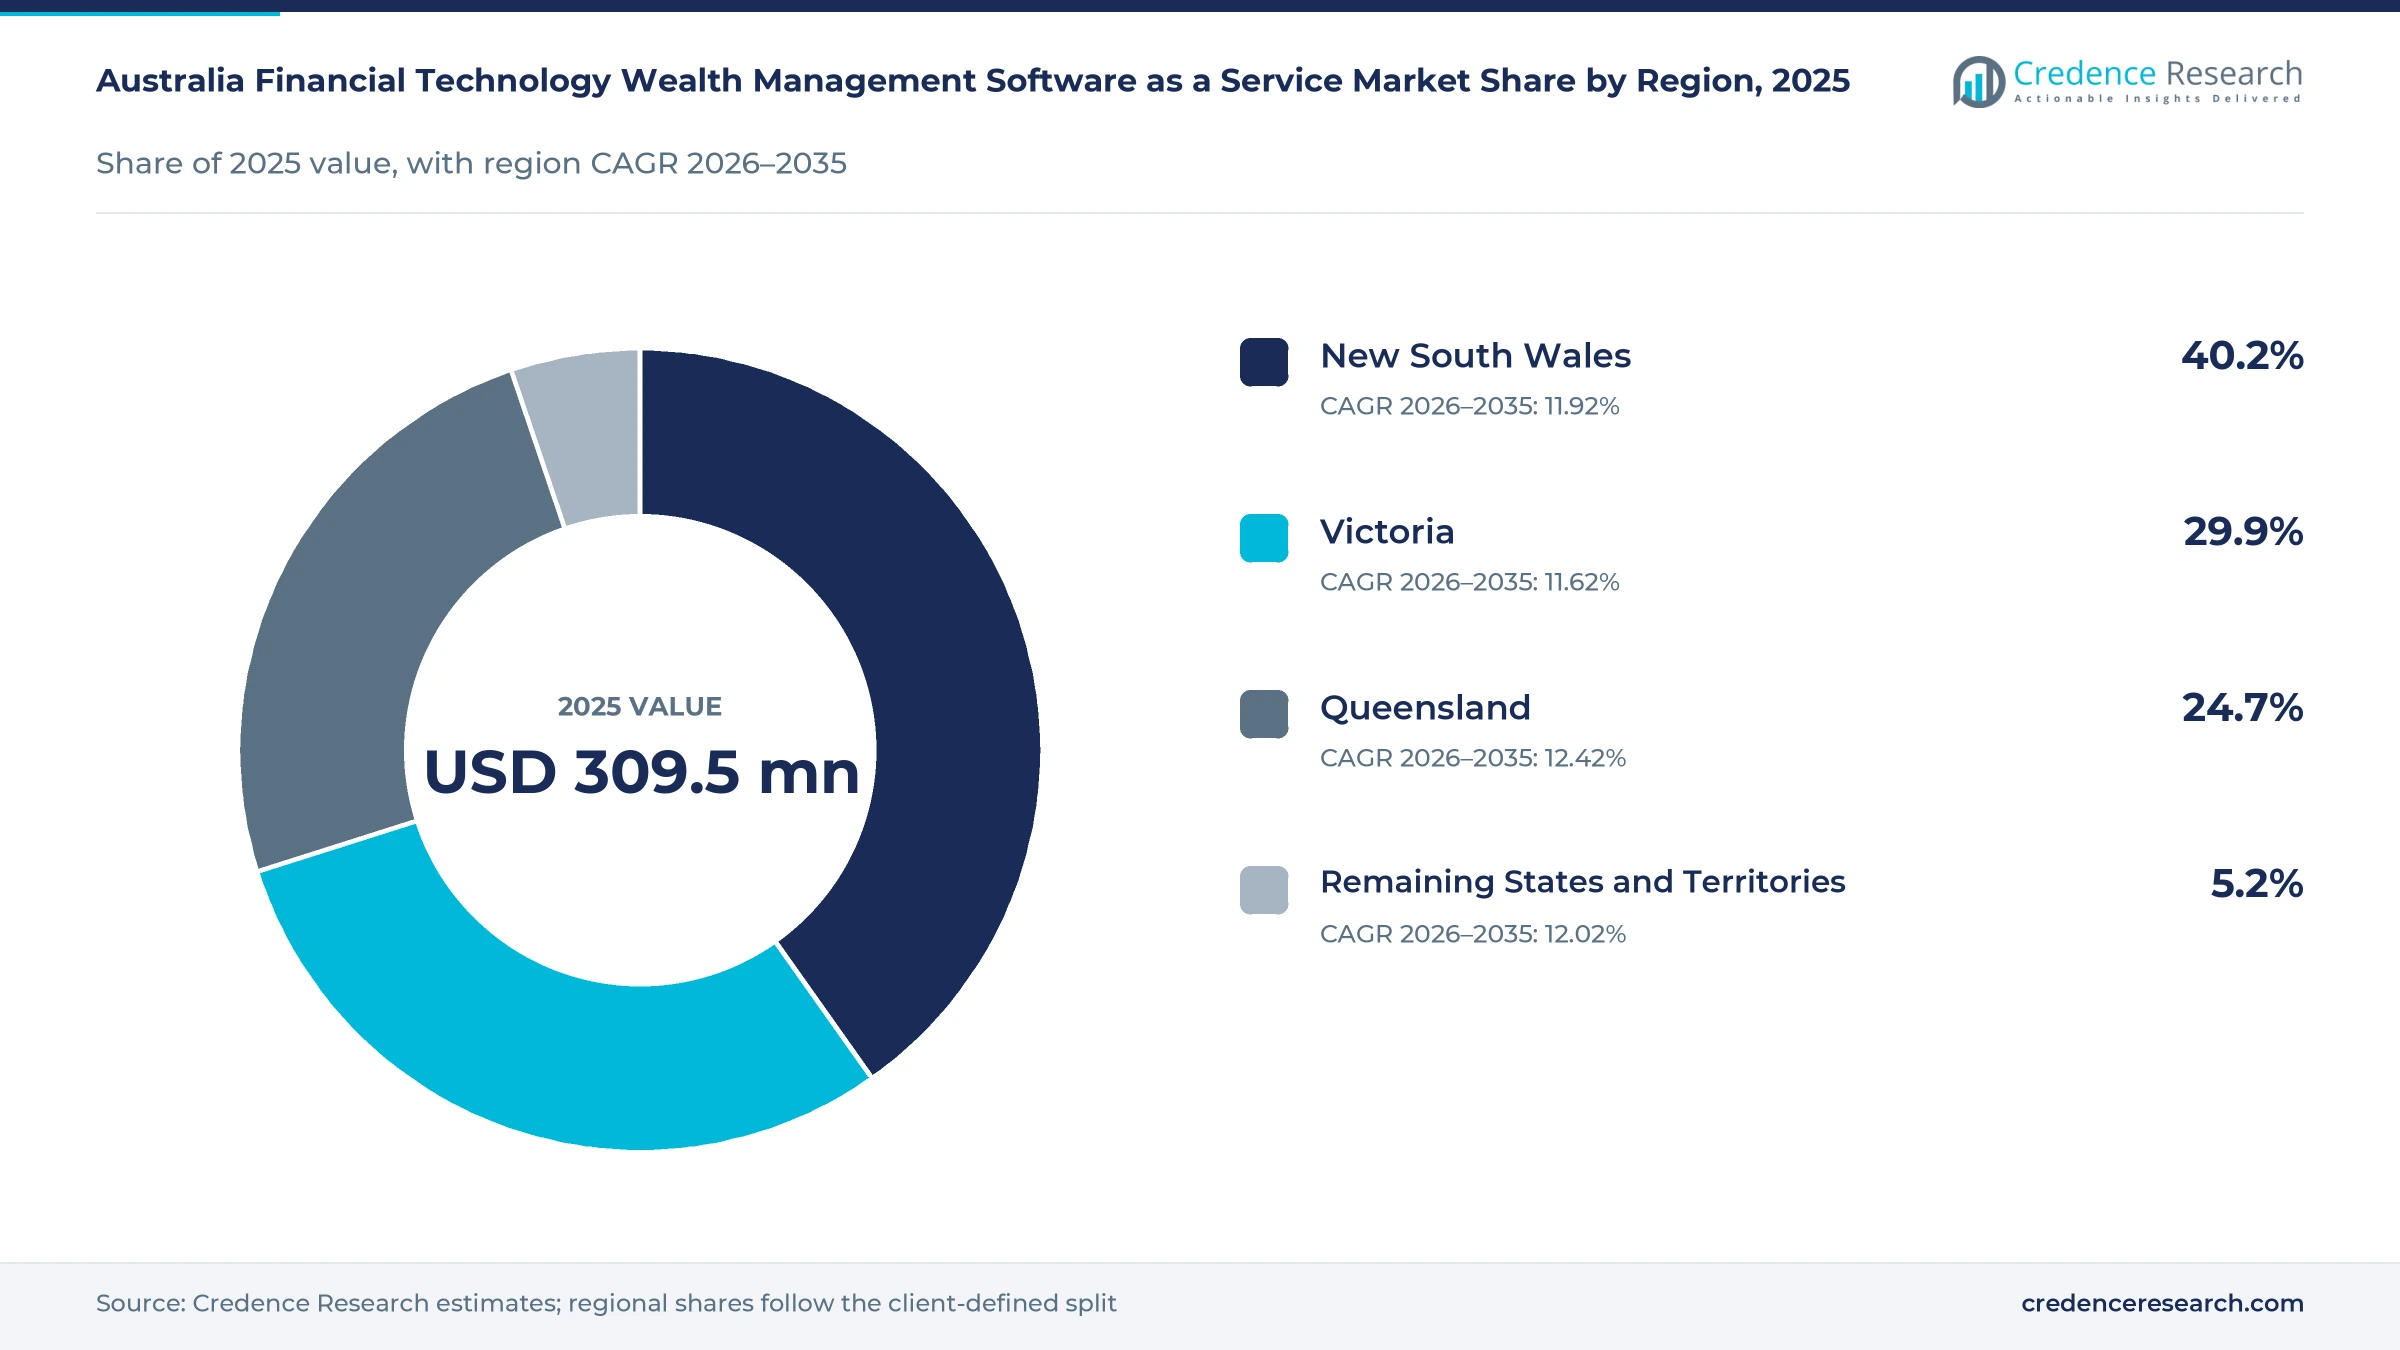
The Australia financial technology wealth management software as a service market was valued at USD 309.5 million in 2025 and is projected to increase from USD 346.6 million in 2026 to USD 958.2 million by 2035, registering a CAGR of 11.96% during 2026–2035. Demand comes from advice businesses, accounting practices, investment platforms and super funds that are replacing desktop planning tools, spreadsheets and in-house ledgers with hosted subscriptions for advice, fund administration and portfolio operations. New South Wales held the largest regional share, 40.2% in 2025, because the biggest advice licensees, platforms and institutions concentrate their buying there. Queensland is the fastest-growing region at 12.42% a year, helped by the strongest output growth among the three largest states. In turn, regulation has become a direct upgrade trigger, because Payday Super rules and the new tax on super balances above AUD 3 million both took effect on July 1, 2026, and require changes to fund processing and tax software.
Which advice, fund and platform tools fall inside the scope?
The estimate measures subscription and contract spending by Australian advice businesses, accounting practices, investment platforms, super funds and wealth institutions on hosted software. It counts financial planning software, self-managed super fund administration software, licensed investment platform technology and specialist workflow tools, whether sold per user, per fund or under enterprise contracts.
The estimate excludes platform administration fees charged on client balances, investment management fees, stand-alone consulting and hardware. The value chain runs from software developers and data providers through cloud hosting and integration partners to advisers, accountants, administrators and fund staff, who use the tools to produce advice, prepare fund accounts and serve clients and members.
Australia Financial Technology Wealth Management Software as a Service Market Insights
- The Australia financial technology wealth management software as a service market was valued at USD 309.5 million in 2025 and should reach USD 958.2 million by 2035, registering an 11.96% CAGR during 2026–2035.
- New South Wales held a 40.2% share of 2025 value, as the largest advice licensees, platforms and wealth institutions concentrate software buying in Sydney.
- Financial Planning Software led with a 34.0% share of 2025 value, because fact finds, modeling and advice documents anchor most practice budgets.
- Managed account funds under management reached AUD 292.9 billion at Dec. 31, 2025, up 25.8% in a year, which lifts demand for portfolio workflow software.
- Retirement and Wealth Institutions grow fastest among customers at 12.65% a year during 2026–2035, as super funds scale digital and retirement advice.
Planning software leads as specialist workflow tools surge
Why does financial planning software hold the largest share?
Based on solution type, the market is categorized into Financial Planning Software, Self-Managed Superannuation Fund Administration Software, Investment Platform Technology Licensing, and Specialist Wealth Workflow Software. Financial Planning Software led with a 34.0% share of 2025 value, because every licensed practice needs fact finds, modeling and advice records. Specialist Wealth Workflow Software grows fastest at 13.17% a year, as managed account, consent and meeting tools spread across practices.
How fast are buyers moving to shared cloud platforms?
Based on deployment model, the market is categorized into Multi-Tenant Cloud, Dedicated Cloud and Hybrid Cloud. Multi-Tenant Cloud led with a 52.0% share of 2025 value, because practices and accountants want automatic tax and rule updates without running servers. Multi-Tenant Cloud grows fastest at 12.52% a year, as smaller firms retire desktop tools and platforms consolidate their administration code.
Which customers fund most wealth software spending?
Based on customer type, the market is categorized into Financial Advice Businesses, Accounting Practices, Investment Platform Businesses and Retirement and Wealth Institutions. Financial Advice Businesses led with a 38.0% share of 2025 value, because advice practices buy several tools for each adviser. Retirement and Wealth Institutions grows fastest at 12.65% a year, as super funds roll out digital and retirement advice to large memberships.
Which tasks absorb most software budgets?
Based on application, the market is categorized into Advice Production, Fund Accounting and Tax, Investment Operations and Client Servicing. Advice Production led with a 33.0% share of 2025 value, because statements of advice, file notes and fee consents take most adviser time. Client Servicing grows fastest at 13.21% a year, as portals, meeting summaries and retirement projections reach more clients.
| Segment Group | Leading Sub-segment | Share, 2025 | Fastest-growing Sub-segment | CAGR, 2026–2035 |
|---|---|---|---|---|
| By Solution Type | Financial Planning Software | 34.0% | Specialist Wealth Workflow Software | 13.17% |
| By Deployment Model | Multi-Tenant Cloud | 52.0% | Multi-Tenant Cloud | 12.52% |
| By Customer Type | Financial Advice Businesses | 38.0% | Retirement and Wealth Institutions | 12.65% |
| By Application | Advice Production | 33.0% | Client Servicing | 13.21% |
Request a Free Sample
Fill in your details and we'll send you a free sample report.
- Sample data tables & charts
- Research methodology
Managed accounts, advice reform and fund demand lift spend
How does managed account growth lift workflow software?
Managed accounts let advice firms run model portfolios across many clients, which pushes platforms and practices to buy rebalancing, reporting and consent software. Funds under management in Australian managed accounts reached AUD 292.9 billion at Dec. 31, 2025, up 25.8% in a year, according to the Institute of Managed Accounts Professionals census reported by Financial Newswire. Net inflows reached AUD 21.7 billion in the census period to Dec. 31, 2025, which shows how quickly new portfolios are added. HUB24 also counted 5,649 active advisers on its platform at June 30, 2026, up 11% on a year earlier. As a result, rising invested balances keep Specialist Wealth Workflow Software the fastest-growing solution at 13.17% a year during 2026–2035.
Why are advice practices rebuilding their workflow systems?
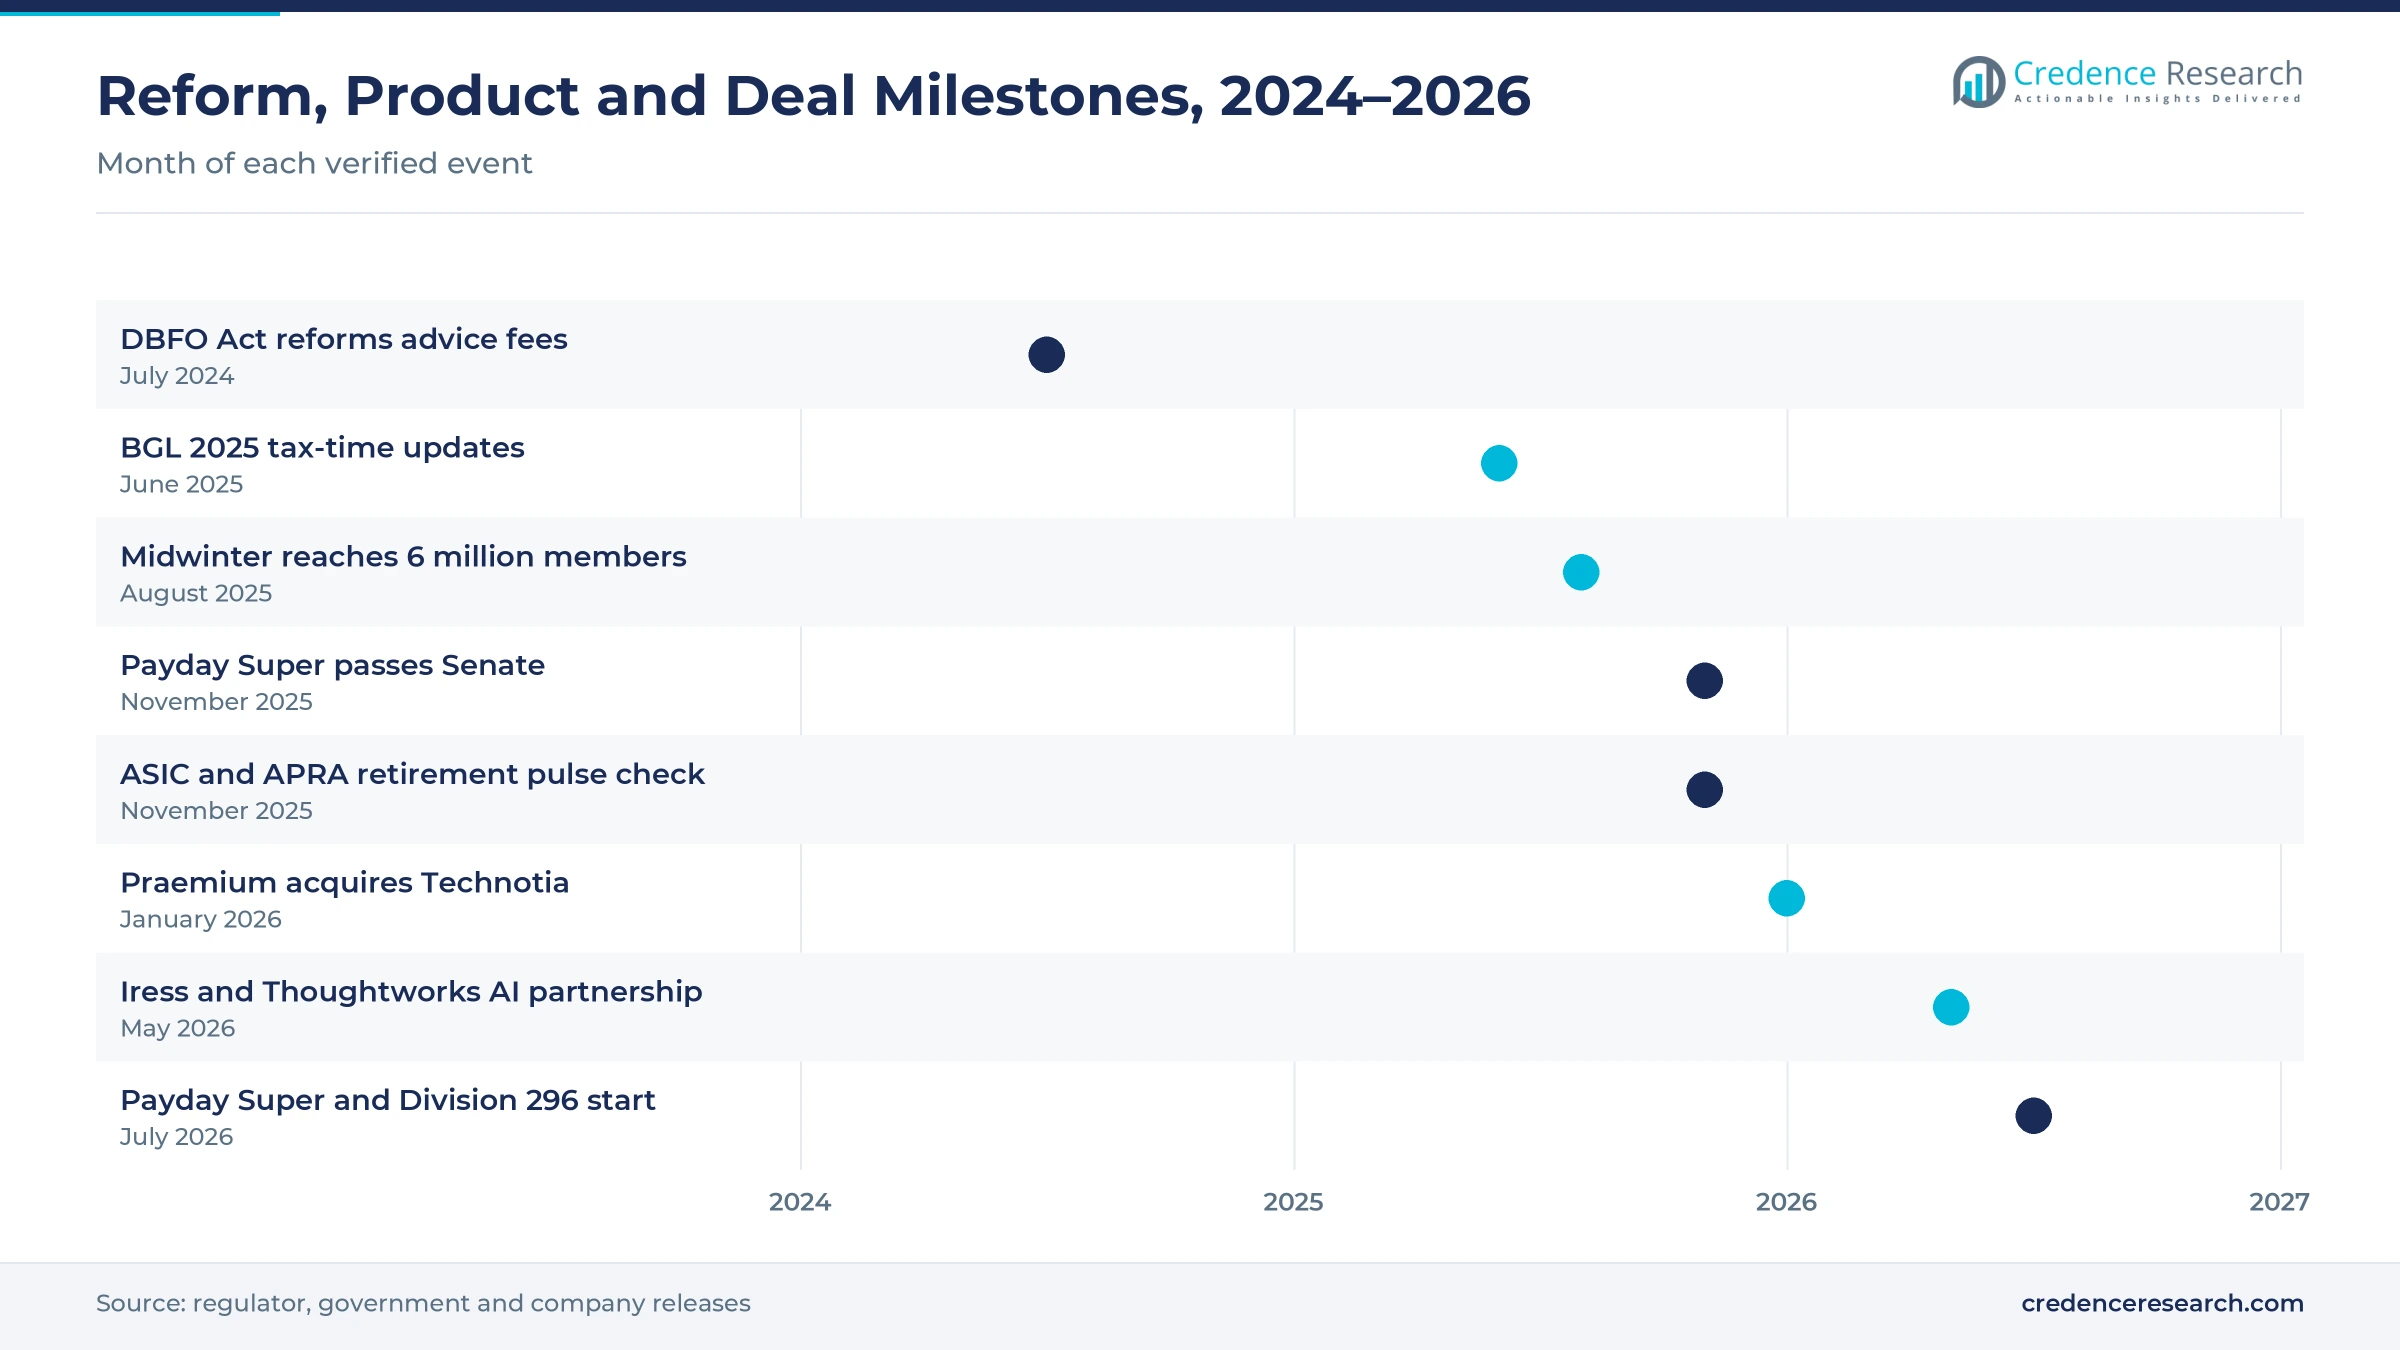
Advice practices are modernizing fact finds, file notes and fee consents, because fewer advisers must serve more clients under changing disclosure rules. The Delivering Better Financial Outcomes Act of 2024 streamlined ongoing fee renewals and removed the fee disclosure statement requirement, according to ASIC. Draft second-tranche legislation released in March 2025 would replace statements of advice with a shorter client advice record, according to Professional Planner. Only about 15,050 advisers were on the national register in mid-July 2026, according to Riskinfo, after the count fell to 14,984 in early July. Iress also said in August 2026 that it is delivering AI-enabled adviser workflow tools in the next version of Xplan. In turn, Advice Production holds 33.0% of 2025 value across advice businesses and licensee groups.
How are super funds scaling digital advice for members?
Large super funds are buying digital and retirement advice software, because regulators want trustees to help members turn balances into income. More than 1.5 million Australians are already retired and about 2.5 million more are expected to retire over the next decade, according to the November 2025 pulse check by ASIC and APRA. Total superannuation assets reached AUD 4,330.1 billion at June 30, 2025, up 9.8% in a year, according to APRA. Bravura said in August 2025 that its Midwinter digital advice tool was available to more than 6 million members. As a result, Retirement and Wealth Institutions grows fastest at 12.65% a year during 2026–2035, ahead of advice businesses and accounting practices.
Why do new super payment and tax rules lift software spending?
Two superannuation reforms that began on July 1, 2026, force funds, administrators and accountants to update processing and tax software. Payday Super laws passed the Senate on Nov. 4, 2025, and require employers to pay contributions at the same time as wages, according to Accountants Daily. The Division 296 tax also applies extra tax to earnings on balances above AUD 3 million, with a higher rate above AUD 10 million, according to the Commonwealth Superannuation Corporation. The SMSF sector counted 672,805 funds and 1,239,977 members in March 2026, according to ATO data reported by SMSF Adviser. As a result, accounting practices need tax engines that calculate earnings above the new thresholds for every affected member.
Embedded AI, in-house administration and retirement tools
How is embedded AI shifting adviser and administrator work?
Wealth software is shifting from separate AI pilots toward assistants built into core advice, platform and fund accounting systems. Iress announced a partnership with Thoughtworks on May 7, 2026, to embed AI across its platforms and modernize core products, according to Financial Standard. HUB24's Class business launched Intelligent Matching, an AI tool that automates matching of common transactions in reconciliation, according to HUB24's July 2026 operating update. BGL also describes SmartDocs 360 as an AI-powered paper-to-data service, and it reads annual tax statements into Simple Fund 360 workflows. In turn, buyers increasingly compare these assistants with AI-based regulatory compliance tools that check advice files and transactions.
Why are platforms moving super administration in-house?
Investment platforms are shifting more administration onto their own technology, which changes how licensing and workflow software is bought. Praemium completed the transition of acquired OneVue accounts in December 2025 and moved AUD 3.1 billion of OneVue funds onto its own platforms, according to its half-year report. It also acquired Technotia Laboratories on Jan. 22, 2026, after building an in-house super administration function with that business. Its Scope+ non-custodial service reached 10,696 portfolios, up 11.8% over the half, and nine new advice groups joined that service during the same period, which widened its practice base. As a result, platform operators now weigh owning administration code against licensing it from specialist software vendors.
Can retirement income tools open new contracts with funds?
Retirement income software gives suppliers a clear opening, because an aging membership needs projections, drawdown modeling and income product advice. People aged 65 and over made up 18.1% of Australia's population in 2025, up from 17.4% in 2023, according to World Bank data. The 2025 pulse check by ASIC and APRA also said retirees entrust almost AUD 600 billion in savings to super trustees. HUB24 launched Lifetime super, an income-for-life product built with TAL, on HUB24 Super during the 2026 financial year. As a result, Client Servicing grows fastest at 13.21% a year during 2026–2035, as projections and portals reach more members.
Can SMSF growth open more seats in accounting practices?
Steady growth in self-managed funds gives administration software suppliers an opening, because each new fund needs annual accounts, tax returns and audit files. Net SMSF establishments reached 11,029 in the March 2026 quarter, after a record 14,612 in the third quarter of 2025, according to SMSF Adviser's report of ATO data. Class added 11,092 accounts in the 2026 financial year, its largest annual increase since 2018, according to HUB24. Self-managed funds also held AUD 1,051.8 billion at June 30, 2025, according to APRA statistics. In turn, accounting practices that adopt automated fund accounting tools can handle more funds per staff member.
Levies, adviser shortages and migrations test buyers
Why do rising compensation levies squeeze advice budgets?
Advice practices fund the Compensation Scheme of Last Resort, and its revised advice levy estimate for the 2027 financial year reached AUD 190.3 million against a AUD 20 million subsector cap, according to Professional Planner. As a result, smaller practices face higher fixed costs at the same time as subscription prices rise. Some firms delay upgrades or cut seats to protect margins. Vendors respond with modular pricing and tools that cut compliance time per client.
How does a shrinking adviser base limit seat growth?
Per-user pricing ties vendor growth to adviser numbers, which fell to 14,984 on the national register in early July 2026 before recovering slightly. In turn, seat counts in advice businesses grow slowly even as client demand rises. Vendors respond by charging for productivity modules, paraplanner and support staff access, and practice-wide bundles. As a result, pricing shifts from adviser seats toward enterprise contracts that cover whole licensee groups.
Why do platform and fund migrations carry high risk?
Moving member, client and transaction records between administration systems can take years and requires data cleanup, reconciliation and parallel running. Praemium reported AUD 827 million of gross outflows from adviser exits during its half year, mostly linked to OneVue advisers, while it completed that platform transition. As a result, funds and platforms phase migrations carefully and delay new modules until cutovers settle. Vendors respond with staged cutovers, reconciliation tools and data validation services.
How do fraud and data security risks slow adoption?
Wealth software holds tax file numbers, identity documents and account details, which makes advice businesses and administrators attractive targets for fraud. NowInfinity added daily monitoring of verified individuals against global watchlists to its identity verification service, according to HUB24, which shows how suppliers respond. Smaller practices often lack security staff, so a single breach can disrupt client service for weeks. In turn, buyers favor vendors with strong identity, access and audit controls.
New South Wales leads as Queensland grows fastest
| Region | Value, 2025 (USD million) | Share, 2025 | CAGR, 2026–2035 |
|---|---|---|---|
| New South Wales | 124.4 | 40.2% | 11.92% |
| Victoria | 92.5 | 29.9% | 11.62% |
| Queensland | 76.4 | 24.7% | 12.42% |
| Remaining States and Territories | 16.1 | 5.2% | 12.02% |
New South Wales leads on licensee and institution buying
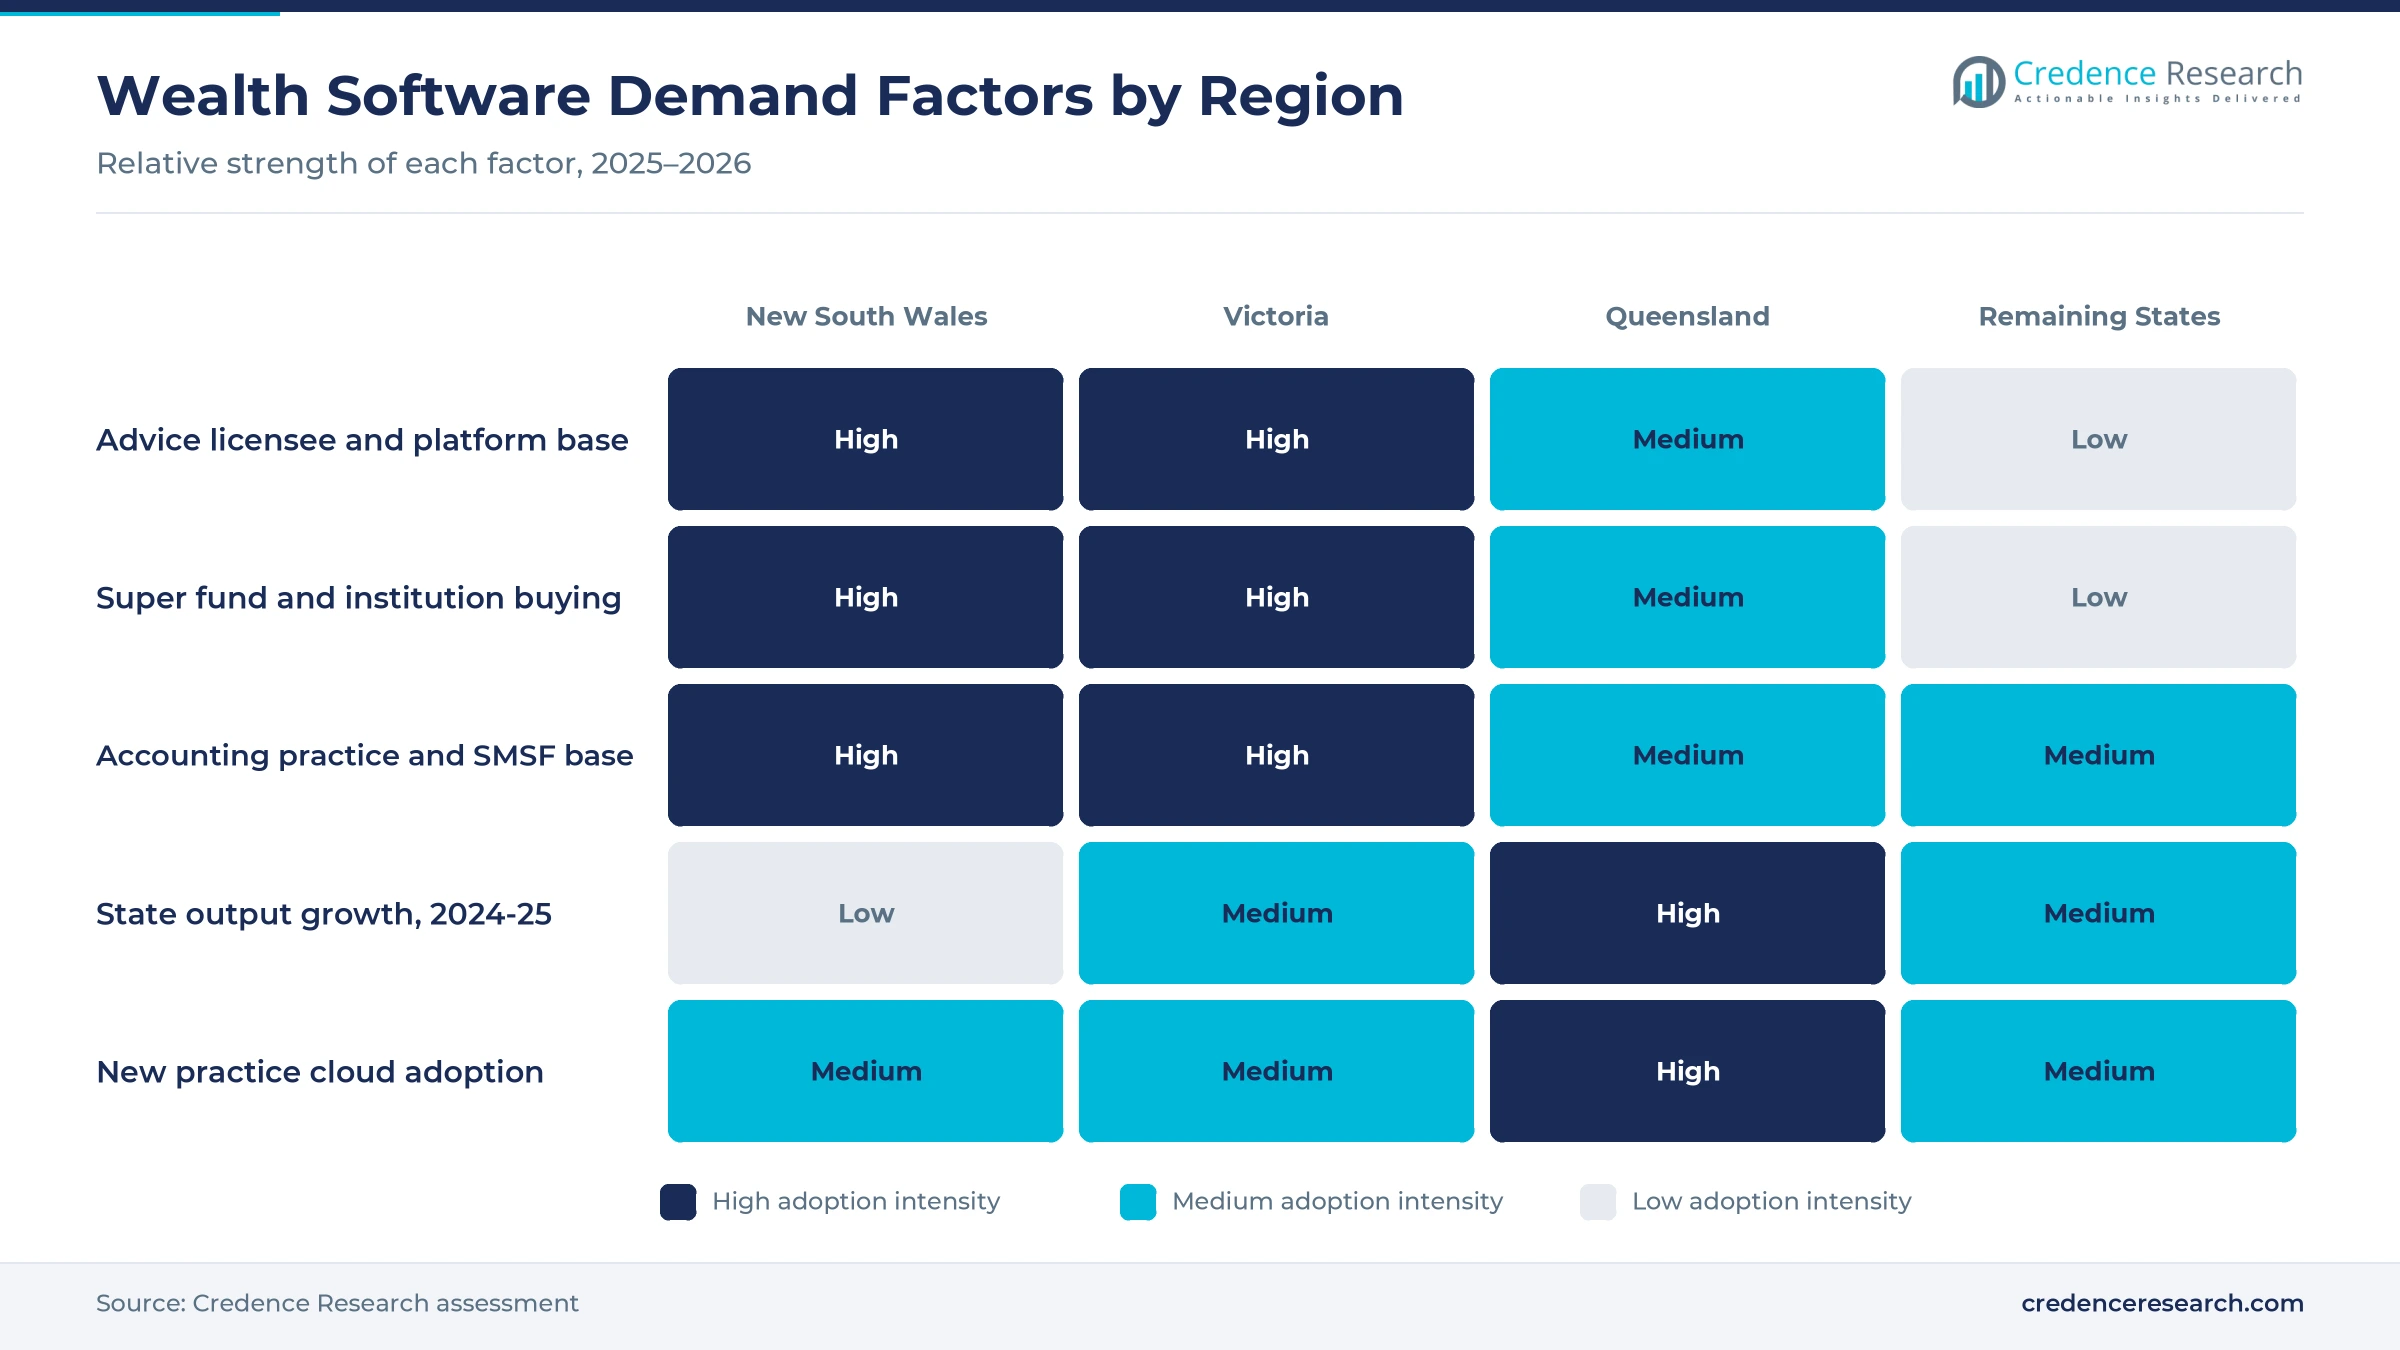
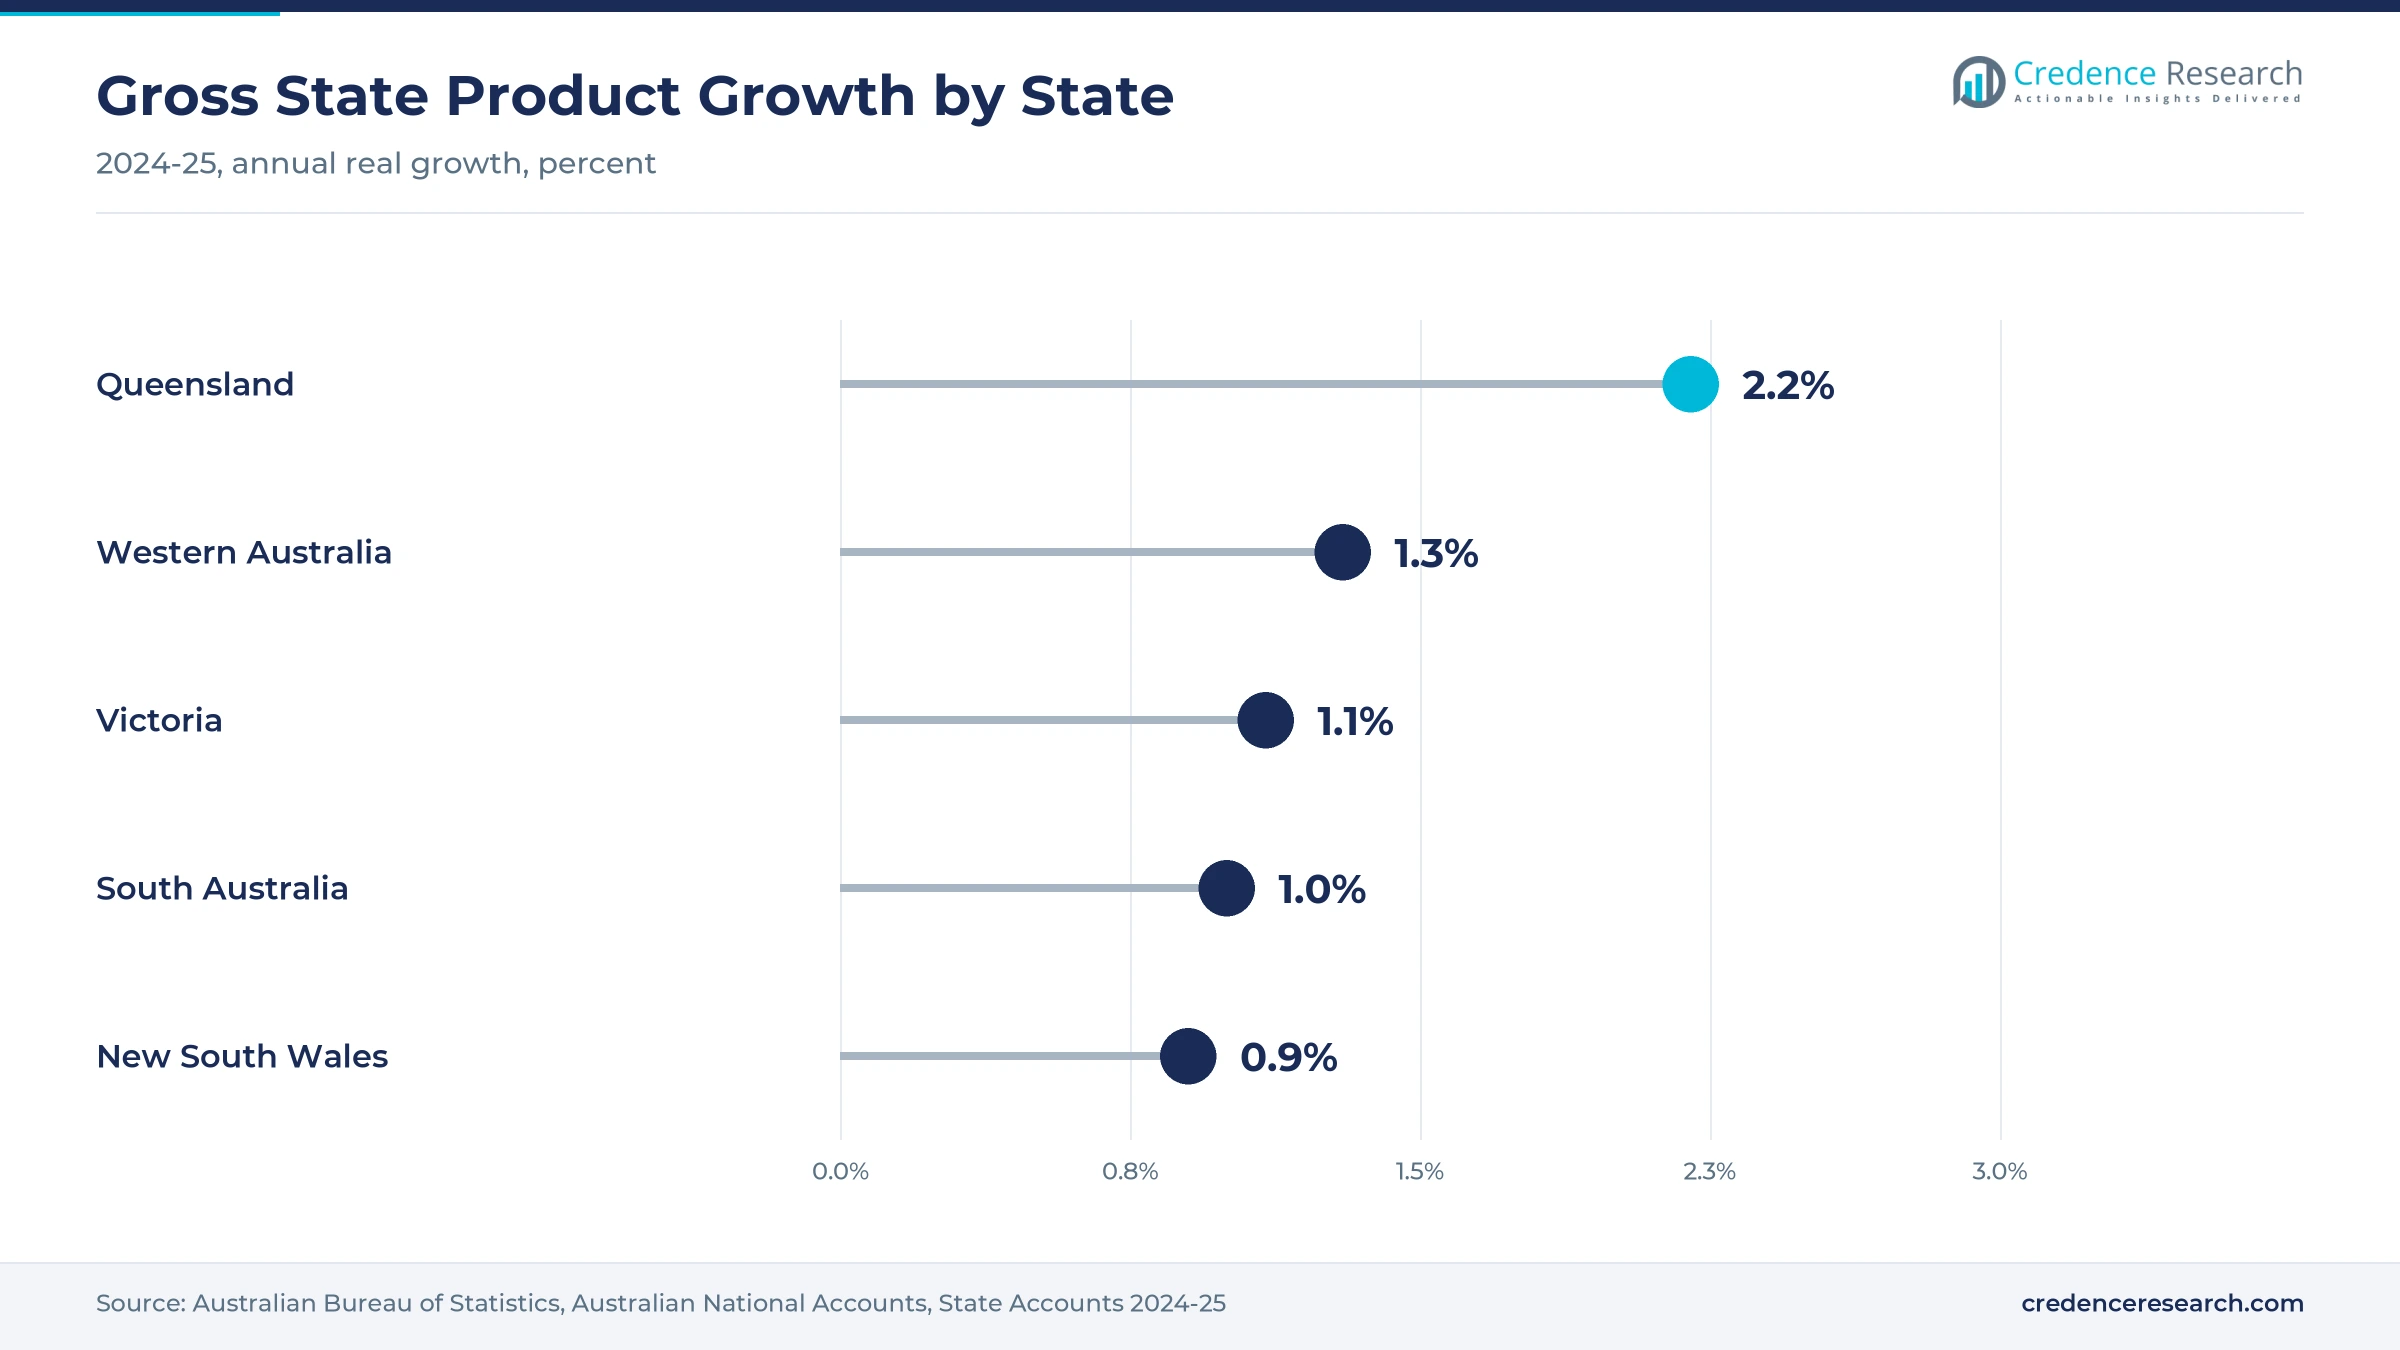
New South Wales held a 40.2% share of 2025 value and grows at 11.92% a year. Financial and insurance services output rose 3.8% in the state in 2024-25, even though total state output grew only 0.9%, according to the national statistics office. As a result, advice licensees, platforms and wealth institutions in Sydney account for the largest share of software seats and enterprise contracts. The state also hosts many of the accounting practices that run SMSF administration software for clients across the country.
How do funds and platforms shape demand in Victoria?
Victoria held a 29.9% share of 2025 value and grows at 11.62% a year. Financial and insurance services output rose 2.6% in the state in 2024-25, while total state output grew 1.1%, according to the national statistics office. In turn, Melbourne-based super funds, platforms and accounting practices keep steady demand for administration, investment operations and member servicing software. Large memberships also make the state an early market for digital advice and retirement projection tools sold under enterprise contracts.
Why does Queensland grow fastest among the regions?
Queensland held a 24.7% share of 2025 value and grows fastest at 12.42% a year. State output rose 2.2% in 2024-25, the strongest result among the three largest states, according to the national statistics office. As a result, newer advice practices and accounting firms in the state add cloud seats faster than practices in the larger southern markets, often starting directly on multi-tenant platforms. Because these firms carry fewer legacy systems, they also adopt managed account and meeting tools earlier in their growth.
How do the smaller states and territories add demand?
Remaining States and Territories held a 5.2% share of 2025 value and grow at 12.02% a year. Output rose 3.5% in the Australian Capital Territory and 1.3% in Western Australia in 2024-25, while South Australia recorded 4.7% growth in financial and insurance services. In turn, practices in Perth, Adelaide, Hobart, Canberra and Darwin buy mainly per-user cloud subscriptions.
AI partnerships, acquisitions and tax updates, 2025–2026
| Development | Status and market relevance |
|---|---|
| In June 2025, BGL Corporate Solutions released its 2025 tax-time updates for Simple Fund 360 and Simple Invest 360. | Keeps annual SMSF, trust and company returns current |
| In August 2025, Bravura Solutions said its Midwinter digital advice tool was available to more than 6 million members. | Shows super funds scaling digital advice |
| In January 2026, Praemium acquired Technotia Laboratories, which helped build its in-house super administration function. | Moves platform administration onto owned technology |
| In May 2026, Iress formed a partnership with Thoughtworks to embed AI across its platforms. | Supports AI-enabled adviser workflow tools in Xplan |
| In July 2026, HUB24 reported that Class had launched Intelligent Matching, an AI tool for transaction reconciliation. | Cuts manual work in SMSF administration |
Cloud platforms, data feeds and AI assistants shape choices
- Multi-tenant advice platforms run fact finds, modeling, advice records and fee consents for many practices on one hosted code base, which speeds releases and rule updates.
- SMSF data feeds pull bank, broker and registry data into fund ledgers automatically, which lets accounting practices prepare annual returns with less manual entry.
- Managed account engines rebalance model portfolios across thousands of client accounts and record consents, which lets advice firms scale portfolio services.
- AI assistants summarize meetings, update client records in CRM systems and match transactions for review, which saves staff time while adding audit and privacy duties.
Need a Custom Version of This Report?
Tailor the scope, geography, or segments to your exact requirements.
- Custom geography or segment scope
- Direct access to our analyst team
Local specialists compete on integration and compliance
Competition is led by local specialists that combine advice, administration and platform software with deep integration into Australian tax, super and regulatory rules. Iress supplies Xplan to advice businesses and is adding AI-enabled workflow tools through a partnership with Thoughtworks announced in May 2026. Bravura Solutions provides Sonata administration and Midwinter digital advice software to funds and wealth institutions. HUB24 Tech Solutions runs Class SMSF administration software, NowInfinity documents and identity checks, and the myhub advice tools. BGL Corporate Solutions sells Simple Fund 360 and related tools to accounting practices, while Praemium licenses platform and non-custodial portfolio technology to advice groups. Rivals compete on data feeds, integration depth, compliance updates and AI features, which favors suppliers with strong practice and fund references.
Which companies supply wealth software in Australia?
| Company | Type | Role in the market |
|---|---|---|
| Iress | Advice and trading software | Xplan with AI workflow tools, Thoughtworks partnership 2026 |
| Bravura Solutions | Fund administration and digital advice | Sonata and Midwinter digital advice for funds |
| HUB24 Tech Solutions | SMSF, document and advice tools | Class Intelligent Matching AI and myhub pilot |
| BGL Corporate Solutions | SMSF and entity software | Simple Fund 360 and SmartDocs 360 for accountants |
| Praemium | Platform and portfolio technology | Scope+ portfolios and in-house super administration |
Reform and retirement needs make software a core cost
Credence Research's view is that the Australia financial technology wealth management software as a service market will grow strongly because managed accounts, advice reform and retirement needs now push practices, funds and platforms toward hosted, automated tools. Financial Planning Software remains the largest value pool, while Specialist Wealth Workflow Software adds the fastest growth. Suppliers that combine local tax and super rules, strong data feeds and practical AI should gain share. Compensation levies, a small adviser base and migration risk will slow some purchases.
Model built from super statistics and company filings
The report uses 2025 as the base year on a calendar basis, and market values come from the Credence Research model. That model draws on superannuation and SMSF statistics, state accounts, population data, regulator releases and company filings on advisers, accounts, launches and acquisitions. Segment splits and regional growth rates are Credence Research estimates, while regional shares follow the client-defined split. Sources used are official statistics, regulator releases, government documents, company filings and releases, and trade press, and no interviews or surveys were used.
AI workflow and retirement tools carry growth to 2035
The Australia financial technology wealth management software as a service market is expected to reach USD 958.2 million by 2035, an 11.96% CAGR during 2026–2035, as AI workflow and retirement tools spread across practices and funds. Growth should be strongest through 2029 while advice reforms, Payday Super and the new balance tax reshape processing. After that, client servicing and member tools will carry more of the value. Higher levies or a shrinking adviser base would slow seat growth, while faster fund adoption of digital advice would lift enterprise spending.
Frequently Asked Questions
How big is the Australia financial technology wealth management software as a service market?
Which solution type leads Australian wealth software spending?
Which region leads the Australian market?
How do managed accounts affect software demand?
Why are super funds buying digital advice tools?
How do the July 2026 super reforms affect software?
Who are the leading companies in Australian wealth software?
What are the main challenges for software buyers?
Table of Content
Chapter 1 Market Segmentation
- 1.1 Segmentation Framework
- 1.1.1 Product and Service Classification
- 1.1.2 Application and End-Use Classification
- 1.1.3 Technology and Solution Classification
- 1.1.4 Customer and Distribution Channel Classification
- 1.1.5 Geographic Segmentation
- 1.1.6 Market Segment Definitions and Boundaries
- 1.2 By Solution Type
- 1.2.1 Financial Planning Software
- 1.2.2 Self-Managed Superannuation Fund Administration Software
- 1.2.3 Investment Platform Technology Licensing
- 1.2.4 Specialist Wealth Workflow Software
- 1.3 By Deployment Model
- 1.3.1 Multi-Tenant Cloud
- 1.3.2 Dedicated Cloud
- 1.3.3 Hybrid Cloud
- 1.4 By Customer Type
- 1.4.1 Financial Advice Businesses
- 1.4.2 Accounting Practices
- 1.4.3 Investment Platform Businesses
- 1.4.4 Retirement and Wealth Institutions
- 1.5 By Application
- 1.5.1 Advice Production
- 1.5.2 Fund Accounting and Tax
- 1.5.3 Investment Operations
- 1.5.4 Client Servicing
Chapter 2 Introduction
- 2.1 Report Objectives and Scope
- 2.2 Product Definition and Industry Terminology
- 2.3 Market Inclusions and Exclusions
- 2.4 Research Process
- 2.4.1 Primary Research and Expert Interviews
- 2.4.2 Secondary Research and Source Review
- 2.4.3 Top-Down and Bottom-Up Estimation
- 2.4.4 Data Triangulation and Verification
- 2.5 Market Size Measurement Basis
- 2.5.1 2025: USD 309.5 million → 2035: USD 958.2 million
- 2.6 Historical and Forecast Reference Periods
- 2.6.1 Historical Period: 2018-2025
- 2.6.2 Base Year: 2025
- 2.6.3 Forecast Period: 2025-2035
- 2.7 Research Assumptions and Limitations
Chapter 3 Executive Summary
- 3.1 Market Snapshot and Key Findings
- 3.2 Base-Year Market Size, 2025
- 3.3 Forecast Market Size, 2035
- 3.4 Revenue and Volume Growth Outlook
- 3.5 Key Demand and Supply Indicators
- 3.6 Leading Market Segments
- 3.7 Fastest-Growing Market Opportunities
- 3.8 Regional Performance Highlights
- 3.9 Technology and Industry Transformation
- 3.10 Competitive Landscape Summary
- 3.11 Analyst View and Strategic Implications
Chapter 4 Australia Financial Technology Wealth Management Software as a Service Market Trends and Developments
- 4.1 Historical Industry Development, 2018-2025
- 4.2 Recent Market Trends and Developments
- 4.3 Demand and Customer Behavior Trends
- 4.4 Technology and Product Innovation
- 4.5 Artificial Intelligence, Automation and Digitalization
- 4.6 Local Manufacturing and Supply Chain Realignment
- 4.7 Industry Partnerships, Mergers and Acquisitions
- 4.8 Sustainability and Circular Economy Developments
- 4.9 Government and Private Sector Investment Trends
- 4.10 Emerging Business Models and Commercialization
- 4.11 Industry Developments and Announcements
Chapter 5 Australia Financial Technology Wealth Management Software as a Service Market Supply and Demand Analysis
- 5.1 Demand Trend and Consumption Analysis, 2018-2025
- 5.2 Demand Forecast, 2025-2035
- 5.3 Supply Chain Structure and Procurement Trends
- 5.4 Supply-Demand Gap and Bottlenecks
- 5.5 Import Dependence and Sourcing Structure
- 5.6 Regional Supply and Demand Concentration
Chapter 6 Australia Financial Technology Wealth Management Software as a Service Market Pricing Analysis
- 6.1 Pricing Structure and Measurement
- 6.2 Historical Pricing Trends, 2018-2025
- 6.3 Pricing Outlook, 2025-2035
- 6.4 Pricing by Product and Market Segment
- 6.5 Geographic Pricing Differences
- 6.6 Key Input, Energy, Labor and Logistics Costs
- 6.7 Contract Pricing and Purchasing Models
- 6.8 Pricing Sensitivity and Competitive Positioning
- 6.9 Price, Margin and Profitability Implications
Chapter 7 Australia Financial Technology Wealth Management Software as a Service Market Dynamics
- 7.1 Market Growth Drivers
- 7.1.1 Demand-Side Drivers
- 7.1.2 Technology and Innovation Drivers
- 7.1.3 Infrastructure and Investment Drivers
- 7.1.4 Regulatory and Policy Drivers
- 7.2 Market Restraints
- 7.2.1 Cost and Affordability Constraints
- 7.2.2 Technology and Adoption Barriers
- 7.2.3 Supply Chain and Operational Constraints
- 7.3 Market Challenges
- 7.3.1 Competitive Pressure and Margin Erosion
- 7.3.2 Skills, Infrastructure and Implementation Gaps
- 7.4 Emerging Market Opportunities
- 7.5 Market Dynamics Impact and Time-Horizon Assessment
Chapter 8 Australia Financial Technology Wealth Management Software as a Service Value Chain Analysis
- 8.1 Industry Value Chain Overview
- 8.2 Upstream Suppliers and Critical Inputs
- 8.3 Technology and Component Providers
- 8.4 Manufacturing or Service Delivery
- 8.5 Distribution, Channel Partners and Integrators
- 8.6 Downstream Applications and End Users
- 8.7 Value Addition and Profit Pools
- 8.8 Vertical Integration and Outsourcing
- 8.9 Supplier Concentration and Risk
- 8.10 Supply Chain Localization and Resilience
Chapter 9 Australia Financial Technology Wealth Management Software as a Service Market Regulations and Policies
- 9.1 Relevant Laws, Standards and Compliance Frameworks
- 9.2 Product, Service, Safety and Quality Requirements
- 9.3 Government Policies, Incentives and Subsidies
- 9.4 Imports, Exports and Trade Barriers
- 9.5 Public Procurement and Local Content Requirements
- 9.6 Data Protection, AI and Cybersecurity Compliance
- 9.7 Upcoming Policy Changes and Market Implications
Chapter 10 Australia Financial Technology Wealth Management Software as a Service Market Hotspots and Opportunities
- 10.1 Market Opportunity Mapping and Growth Hotspots
- 10.2 High-Growth Applications and Customer Groups
- 10.3 Underserved Markets and White-Space Opportunities
- 10.4 Emerging Technology and Product Opportunities
- 10.5 New Capacity and Investment Hotspots
- 10.6 Market Entry and Expansion Opportunities
- 10.7 Distribution and Partnership Opportunities
- 10.8 Near-Term and Long-Term Commercial Potential
- 10.9 Opportunity Attractiveness and Execution Risks
Chapter 11 Australia Financial Technology Wealth Management Software as a Service Market Outlook, 2025-2035
- 11.1 Market Size and Analysis
- 11.1.1 Revenue (Market Measurement: 2025: USD 309.5 million → 2035: USD 958.2 million)
- 11.1.2 Historical Market Size, 2018-2025
- 11.1.3 Base-Year Market Size, 2025
- 11.2 Market Forecast, 2025-2035
- 11.2.1 Revenue Forecast to 2035
- 11.2.2 CAGR and Year-on-Year Growth
- 11.2.3 Incremental Revenue Opportunity
- 11.3 Forecast Assumptions and Scenario Analysis
- 11.3.1 Base-Case Forecast
- 11.3.2 Optimistic and Conservative Scenarios
- 11.3.3 Technology, Pricing and Policy Sensitivities
- 11.4 Market Attractiveness and Growth Outlook
Chapter 12 Australia Financial Technology Wealth Management Software as a Service Market Segmentation and Outlook
- 12.1 Segmentation Summary and Market Shares, 2025
- 12.2 Largest and Fastest-Growing Segments
- 12.3 By Solution Type - Market Size and Forecast, 2025-2035
- 12.3.1 Segment Definition and Scope
- 12.3.2 Historical Market Size, 2018-2025
- 12.3.3 Revenue Forecast, 2025-2035
- 12.3.4 Base-Year Market Share, 2025
- 12.3.5 Segment CAGR and Growth Drivers
- 12.3.6 Subsegment Market Size and Forecast
- 12.3.6.1 Financial Planning Software
- 12.3.6.2 Self-Managed Superannuation Fund Administration Software
- 12.3.6.3 Investment Platform Technology Licensing
- 12.3.6.4 Specialist Wealth Workflow Software
- 12.3.7 Subsegment Pricing and Adoption Trends
- 12.3.8 Leading Suppliers and Competition
- 12.3.9 Regional Demand and Opportunities
- 12.4 By Deployment Model - Market Size and Forecast, 2025-2035
- 12.4.1 Segment Definition and Scope
- 12.4.2 Historical Market Size, 2018-2025
- 12.4.3 Revenue Forecast, 2025-2035
- 12.4.4 Base-Year Market Share, 2025
- 12.4.5 Segment CAGR and Growth Drivers
- 12.4.6 Subsegment Market Size and Forecast
- 12.4.6.1 Multi-Tenant Cloud
- 12.4.6.2 Dedicated Cloud
- 12.4.6.3 Hybrid Cloud
- 12.4.7 Subsegment Pricing and Adoption Trends
- 12.4.8 Leading Suppliers and Competition
- 12.4.9 Regional Demand and Opportunities
- 12.5 By Customer Type - Market Size and Forecast, 2025-2035
- 12.5.1 Segment Definition and Scope
- 12.5.2 Historical Market Size, 2018-2025
- 12.5.3 Revenue Forecast, 2025-2035
- 12.5.4 Base-Year Market Share, 2025
- 12.5.5 Segment CAGR and Growth Drivers
- 12.5.6 Subsegment Market Size and Forecast
- 12.5.6.1 Financial Advice Businesses
- 12.5.6.2 Accounting Practices
- 12.5.6.3 Investment Platform Businesses
- 12.5.6.4 Retirement and Wealth Institutions
- 12.5.7 Subsegment Pricing and Adoption Trends
- 12.5.8 Leading Suppliers and Competition
- 12.5.9 Regional Demand and Opportunities
- 12.6 By Application - Market Size and Forecast, 2025-2035
- 12.6.1 Segment Definition and Scope
- 12.6.2 Historical Market Size, 2018-2025
- 12.6.3 Revenue Forecast, 2025-2035
- 12.6.4 Base-Year Market Share, 2025
- 12.6.5 Segment CAGR and Growth Drivers
- 12.6.6 Subsegment Market Size and Forecast
- 12.6.6.1 Advice Production
- 12.6.6.2 Fund Accounting and Tax
- 12.6.6.3 Investment Operations
- 12.6.6.4 Client Servicing
- 12.6.7 Subsegment Pricing and Adoption Trends
- 12.6.8 Leading Suppliers and Competition
- 12.6.9 Regional Demand and Opportunities
- 12.7 Segment Growth Comparison
- 12.8 Segment Attractiveness and Priority Matrix
Chapter 13 Australia Financial Technology Wealth Management Software as a Service End-Use and Application Market Outlook
- 13.1 End-Use Industry and Customer Demand Structure
- 13.2 Leading Applications and Customer Groups
- 13.3 End-Use Market Size, Share and Forecast
- 13.4 Major End-Use Industry Deep Dives
- 13.4.1 Customer Requirements and Use Cases
- 13.4.2 Demand and Replacement Cycles
- 13.4.3 Technical and Regulatory Considerations
- 13.4.4 Purchasing and Procurement Models
- 13.4.5 Leading Vendors and Distribution Channels
- 13.4.6 Forecast and Commercial Opportunities
- 13.5 Emerging Applications and Cross-Segment Demand
- 13.6 End-Use Industry Investment Priorities
Chapter 14 Australia Financial Technology Wealth Management Software as a Service Geographic Market Outlook, 2025-2035
- 14.1 Domestic Market Distribution and Demand Clusters
- 14.2 State- or Province-Wise Market Size and Forecast, 2025-2035
- 14.3 City and Metropolitan Market Outlook
- 14.4 Industrial, Manufacturing and Commercial Clusters
- 14.5 Geographic Concentration of Key End Users
- 14.6 Local Pricing and Purchasing Differences
- 14.7 Domestic Production Facilities and Capacity Map
- 14.8 Local Infrastructure and Project Pipeline
- 14.9 State-Level Policy and Incentive Differences
- 14.10 Subnational Investment Hotspots and Opportunities
- 14.11 Distribution and Logistics Networks
- 14.12 Domestic Competitive Footprint
Chapter 15 Australia Financial Technology Wealth Management Software as a Service Technology, Innovation and Sustainability Outlook
- 15.1 Technology Landscape and Maturity
- 15.2 Product, Process and Service Innovation
- 15.3 AI, Automation and Digital Tools in the Industry
- 15.4 Technology Adoption and Performance Benchmarking
- 15.5 Innovation Pipeline and R&D Investment
- 15.6 Energy Efficiency and Resource Management
- 15.7 Sustainability, Recycling and Circularity
- 15.8 Technology Roadmap, 2025-2035
- 15.9 Risks of Obsolescence and Technology Substitution
Chapter 16 Australia Financial Technology Wealth Management Software as a Service Market Key Strategic Imperatives
- 16.1 Growth and Market Entry Priorities
- 16.2 High-Return Products and Segments
- 16.3 Pricing, Profitability and Cost Optimization
- 16.4 Technology Investment and Product Differentiation
- 16.5 Supply Chain Localization and Resilience
- 16.6 Distribution and Customer Acquisition
- 16.7 Partnership, Acquisition and Capacity Strategy
- 16.8 Regional Expansion Priorities
- 16.9 Short-, Medium- and Long-Term Actions
Chapter 17 Competition Outlook
- 17.1 Industry Competition Characteristics
- 17.2 Market Structure and Concentration
- 17.3 Market Share and Competitive Positioning, 2025
- 17.4 Company-Wise Revenue and Product Benchmarking
- 17.5 Production and Service Capacity Benchmarking
- 17.6 Technology, Pricing and Differentiation
- 17.7 Regional Footprint and Distribution Strength
- 17.8 Mergers, Acquisitions and Strategic Alliances
- 17.9 New Entrants and Competitive Threats
- 17.10 Porter's Five Forces and Industry Attractiveness
- 17.11 Competitive Outlook, 2025-2035
Chapter 18 Company Profiles
- 18.1 Company Coverage and Selection Criteria
- 18.2 Iress
- 18.2.1 Business Description
- 18.2.2 Company Ownership and Geographic Presence
- 18.2.3 Product and Service Portfolio
- 18.2.4 Manufacturing and Operating Footprint
- 18.2.5 Financial Performance and Investment
- 18.2.6 Market Share and Competitive Position
- 18.2.7 Technology and Innovation Capabilities
- 18.2.8 Strategic Alliances or Partnerships
- 18.2.9 Recent Developments
- 18.2.10 Growth Strategy and Outlook
- 18.3 Bravura Solutions
- 18.4 HUB24 Tech Solutions
- 18.5 BGL Corporate Solutions
- 18.6 Praemium
- 18.7 Other Relevant Market Participants
Note: Every listed company is profiled on the structure shown under the first company. The company list is preliminary and may change based on research findings, market developments, data availability and client requirements.
Chapter 19 Disclaimer
- 19.1 Research and Forecast Disclaimer
- 19.2 Data Source and Estimation Limitations
Note: The depth of individual sections depends on data availability for this market. Volume, capacity, trade and other unit-based metrics are included where applicable.

