
Aging patients and domestic implants shape regional demand
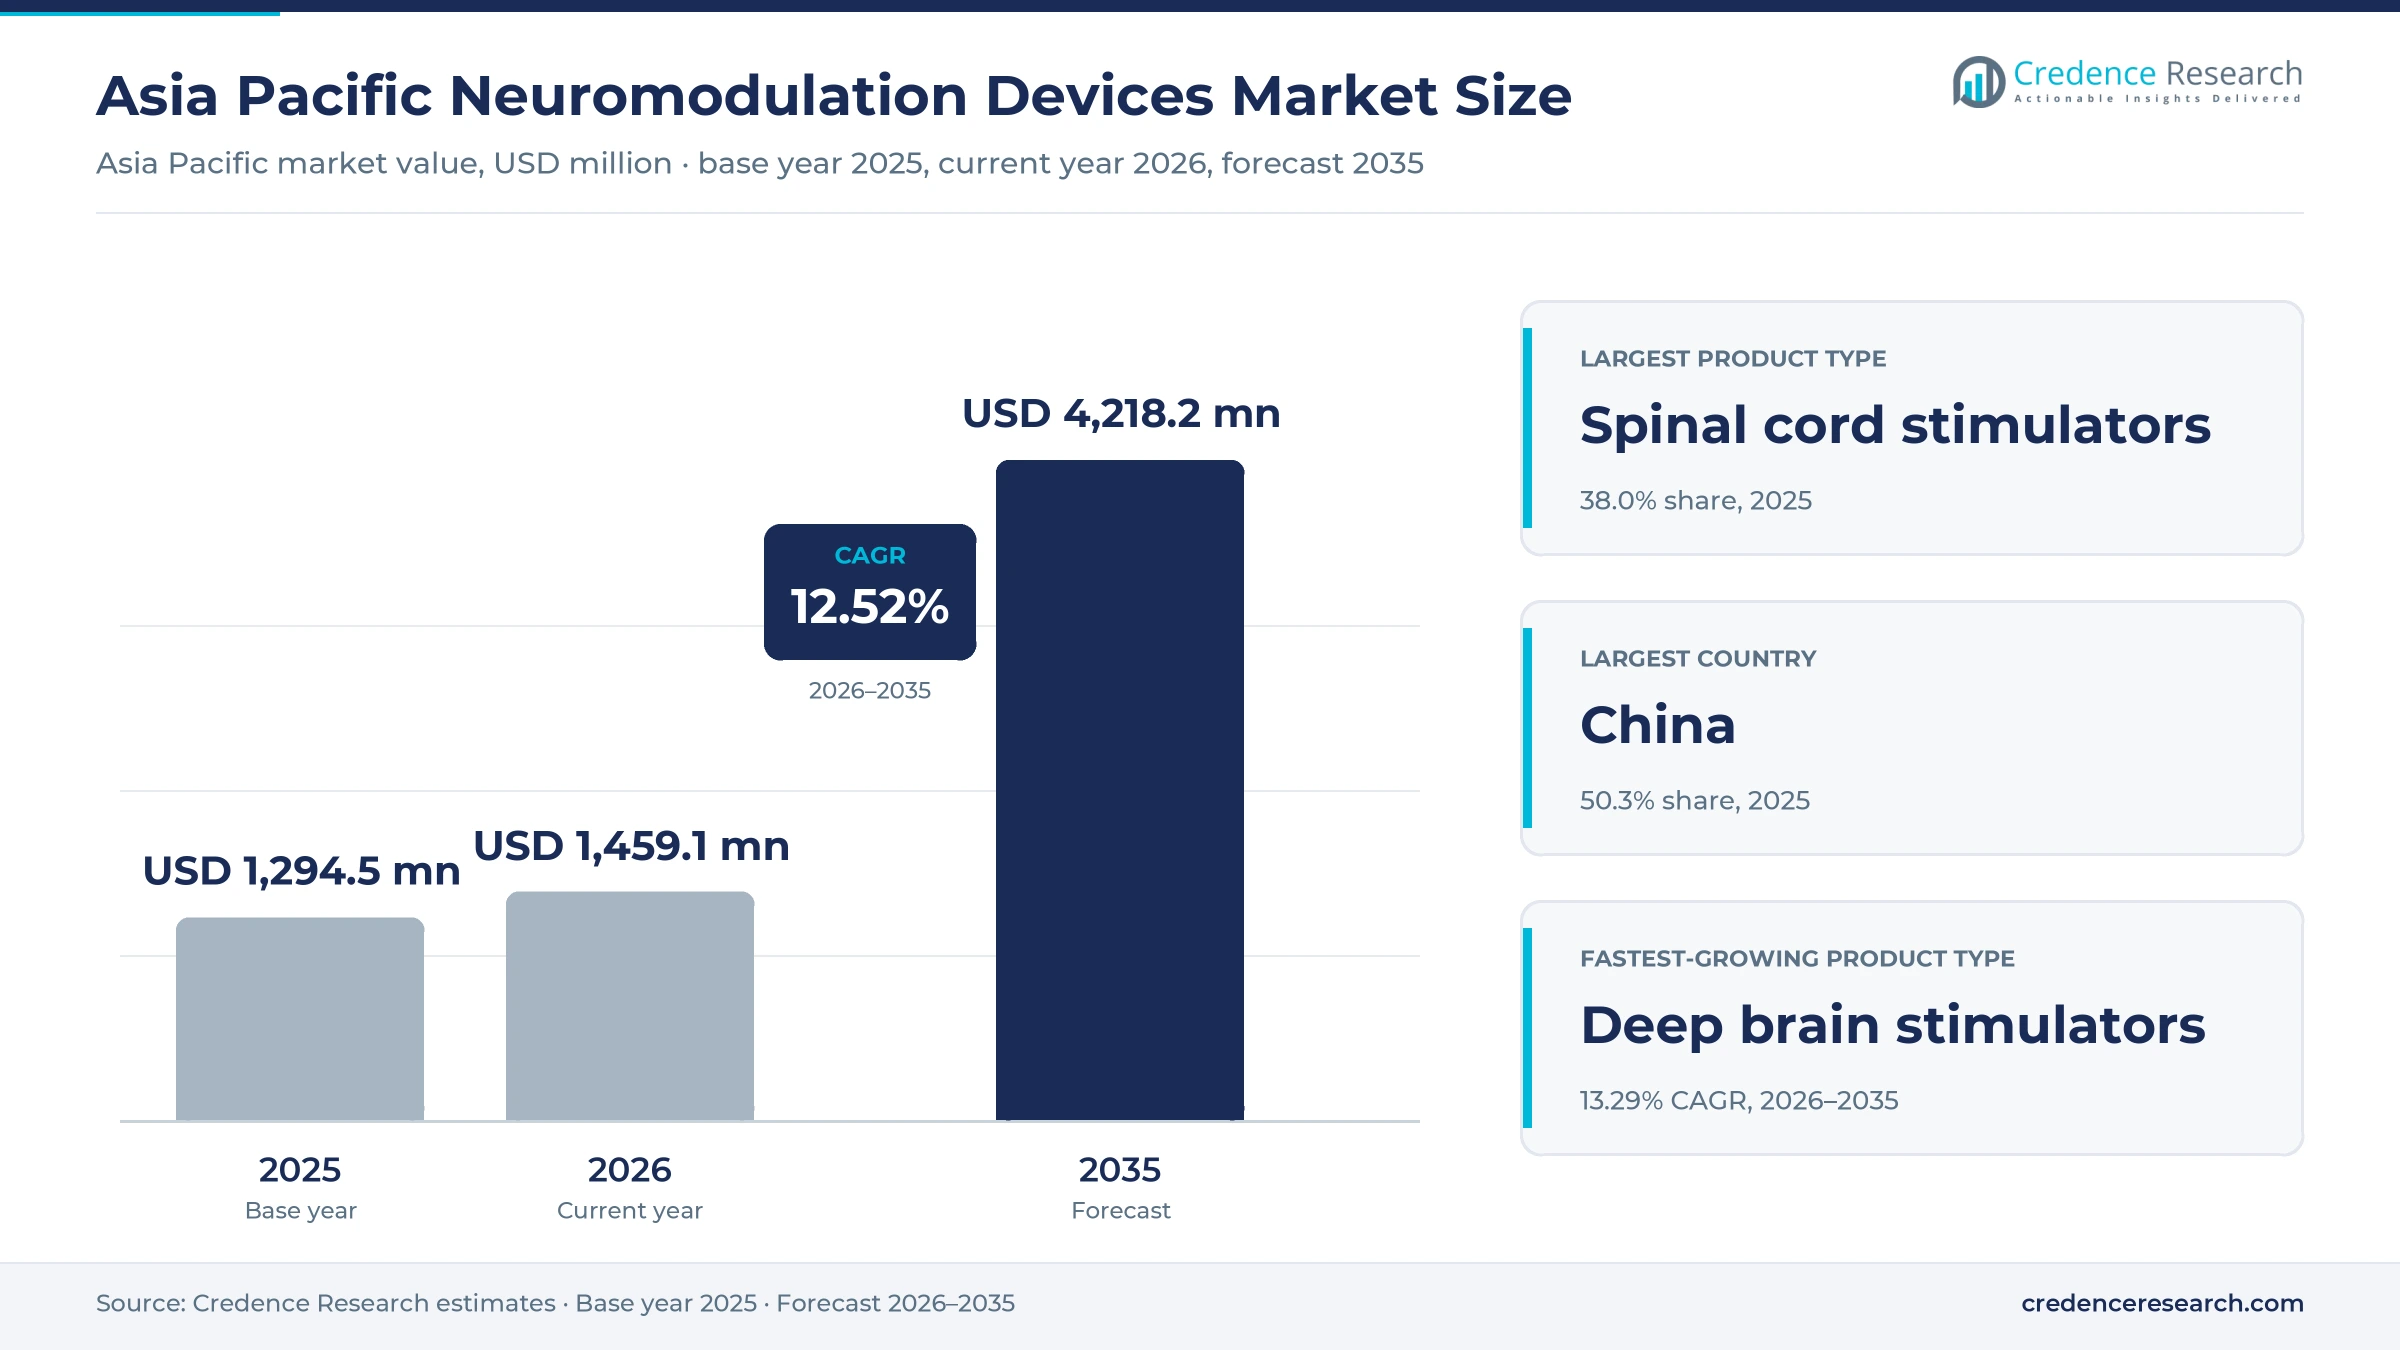
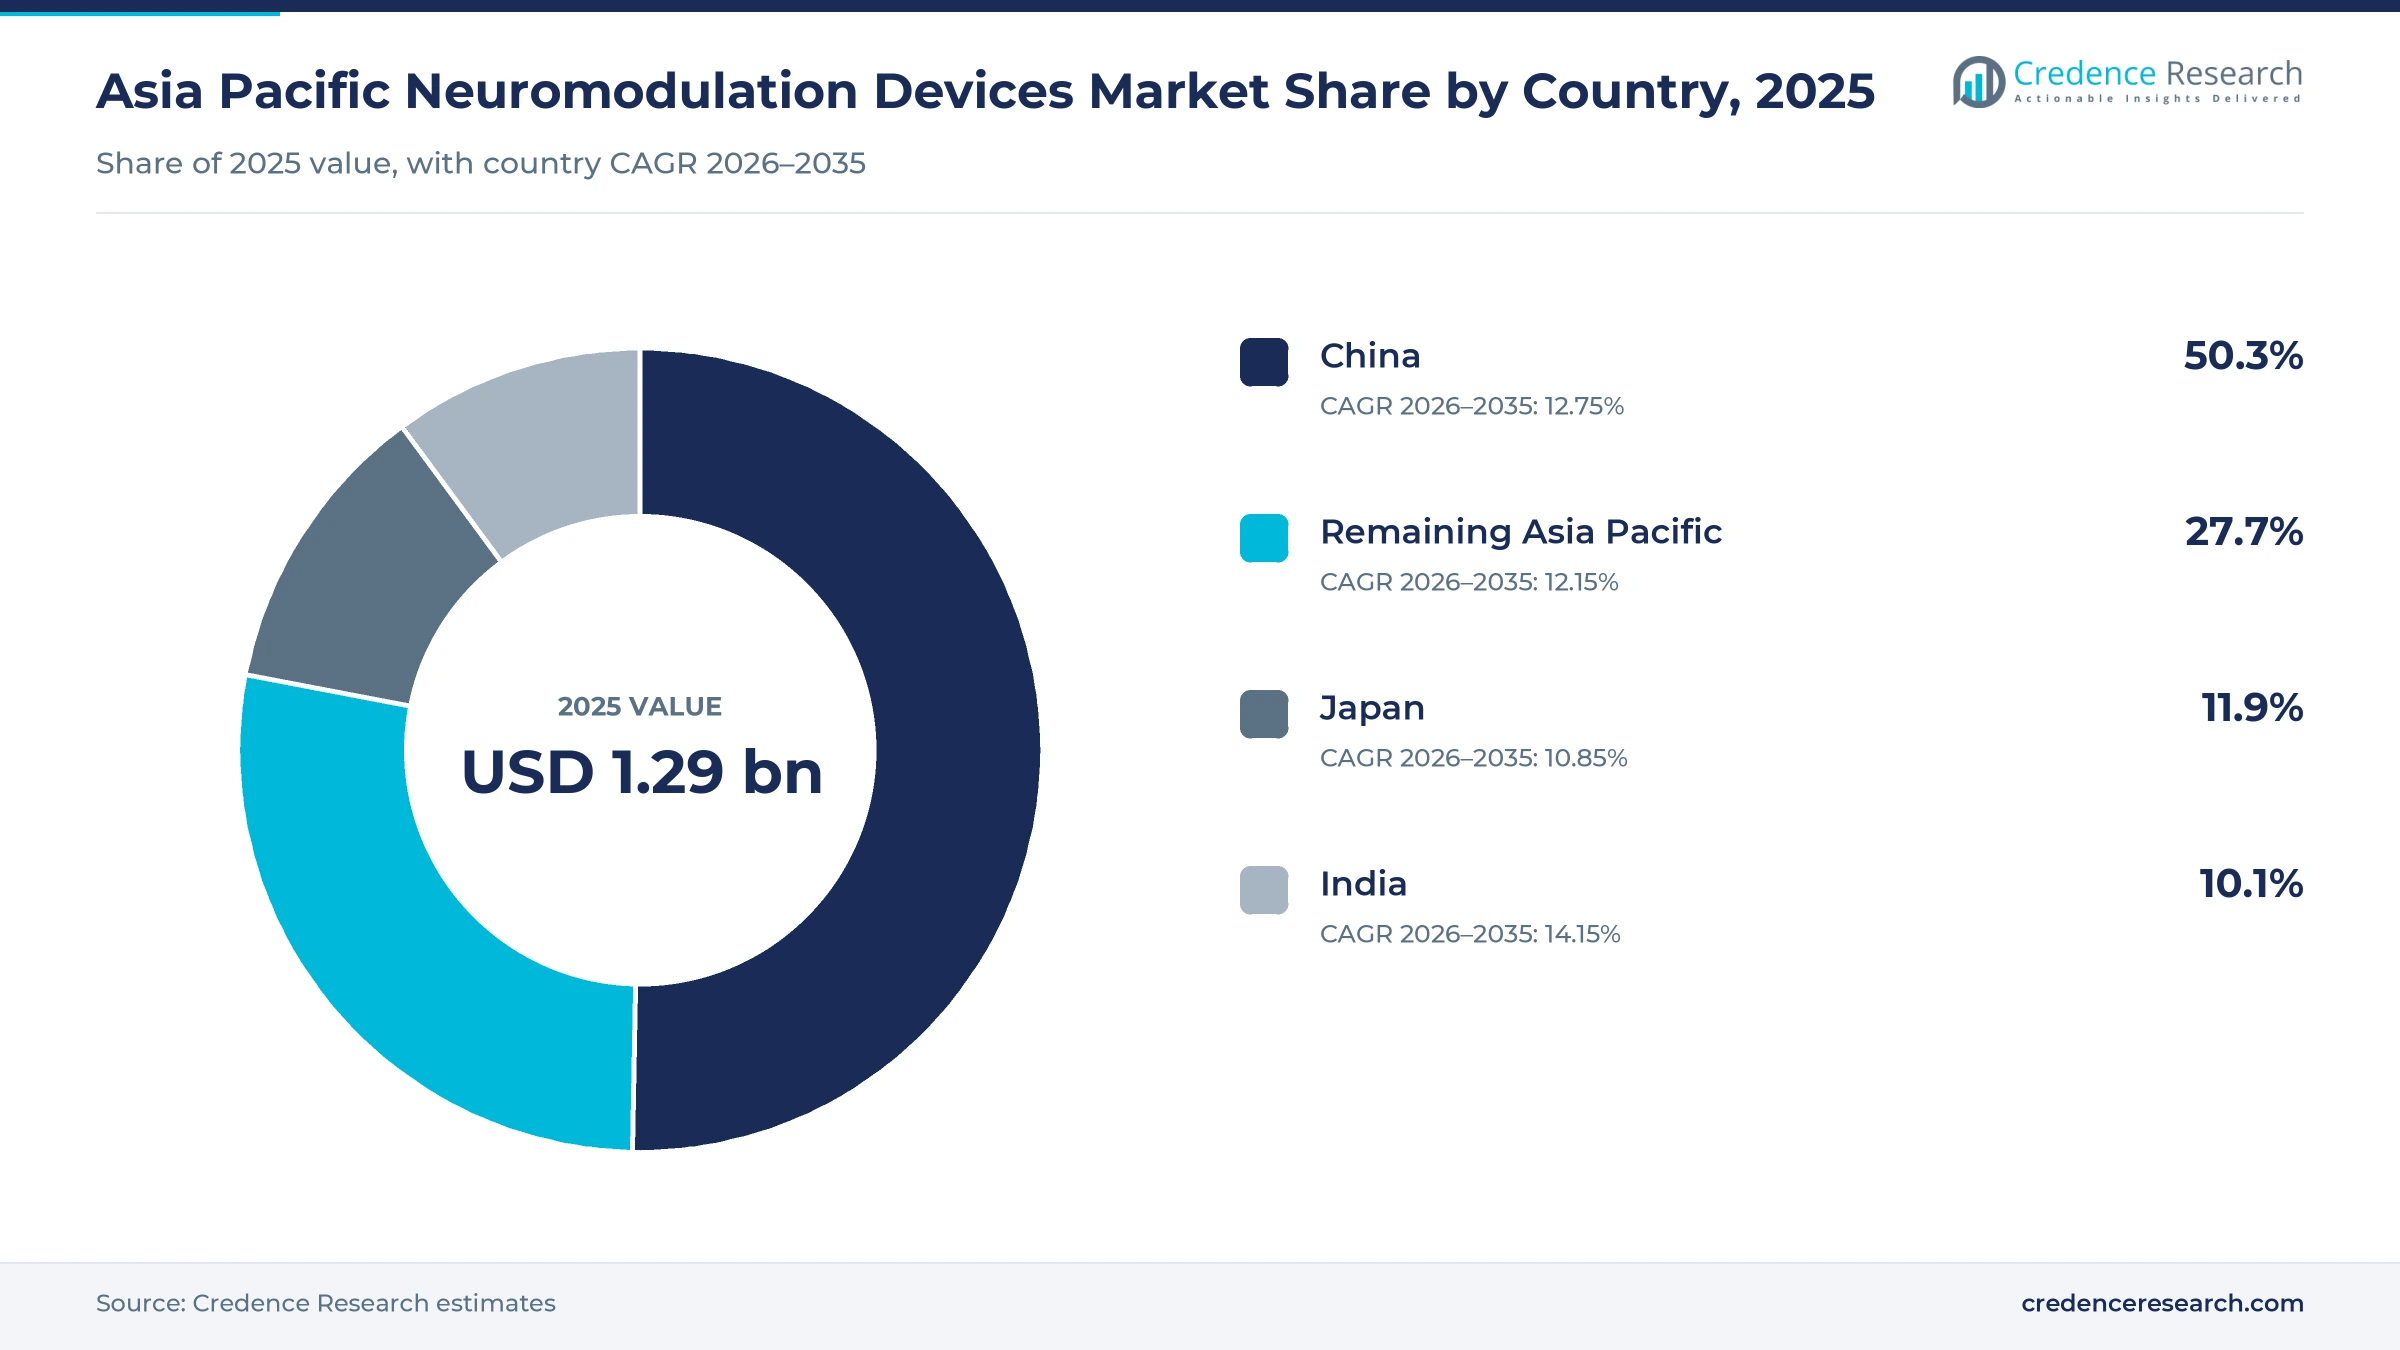
The Asia Pacific neuromodulation devices market was valued at USD 1.29 billion in 2025 and is projected to increase from USD 1.46 billion in 2026 to USD 4.22 billion by 2035, registering a CAGR of 12.52% during 2026–2035. Demand comes from neurosurgery and pain centers that implant stimulators for chronic pain, Parkinson's disease, tremor and drug-resistant epilepsy, along with psychiatric units that run magnetic stimulation. China held the largest country share, 50.3% in 2025, because domestic makers now supply most of its annual implants at lower prices than imported systems. India is the fastest-growing country at 14.15% a year, as private hospital groups add movement disorder programs beyond the largest cities. The biggest technology change is adaptive brain stimulation, which reads brain signals and adjusts therapy without manual input. Medtronic launched its adaptive system in India in April 2026, which brings sensing-based Parkinson's care to a large untreated patient pool.
Which stimulators and buyers does the estimate cover?
The estimate measures the value of neuromodulation systems sold to hospitals, specialty clinics and home care programs in Asia Pacific. It covers spinal cord stimulators, deep brain stimulators, other implantable stimulators such as vagus, sacral and gastric systems, and external clinical stimulators used in hospitals.
The estimate excludes surgical fees, imaging, drugs and consumer wellness stimulators sold without a prescription. The value chain runs from implant makers and lead suppliers through distributors and centralized purchasing bodies to neurosurgeons, neurologists, pain specialists and psychiatrists who select, implant and program each system.
Asia Pacific Neuromodulation Devices Market Insights
- The Asia Pacific neuromodulation devices market was valued at USD 1.29 billion in 2025 and is projected to reach USD 4.22 billion by 2035, registering a CAGR of 12.52% during 2026–2035.
- China held a 50.3% share of 2025 value, because domestic makers such as Beijing PINS Medical now supply most of the country's annual implants.
- Spinal cord stimulators led with a 38.0% share of 2025 value, because chronic back and leg pain remains the largest implant indication.
- Medtronic launched adaptive deep brain stimulation in India in April 2026, weeks after Apollo Hospitals in Chennai performed the country's first adaptive implant.
- Deep brain stimulators grow fastest at 13.29% a year during 2026–2035, as Chinese makers add rechargeable and directional systems for Parkinson's care.
Spinal cord stimulators lead as brain stimulation gains
Why do spinal cord stimulators hold the largest value?
Based on product type, the market is categorized into spinal cord stimulators, deep brain stimulators, additional implantable stimulators and external clinical stimulators. Spinal Cord Stimulators led with a 38.0% share of 2025 value, because failed back surgery and chronic leg pain form the largest implant pool. Deep Brain Stimulators grow fastest at 13.29% a year, as Chinese makers win approvals for rechargeable and directional systems.
Which conditions drive the most implants?
Based on disease area, the market is categorized into chronic pain, movement disorders, epilepsy and psychiatric disorders, and pelvic, gastric and headache disorders. Chronic Pain led with a 40.0% share of 2025 value, because pain programs implant the most systems each year. Epilepsy and Psychiatric Disorders grow fastest at 13.35% a year, as payers in Taiwan and Japan cover vagus nerve and magnetic stimulation.
How fast are rechargeable platforms gaining ground?
Based on technology, the market is categorized into rechargeable implantable platforms, primary-cell implantable platforms and externally powered clinical platforms. Rechargeable Implantable Platforms led with a 52.0% share of 2025 value, because younger pain and Parkinson's patients want fewer replacement surgeries. Rechargeable Implantable Platforms also grow fastest at 13.21% a year, as new brain stimulators from Abbott and Lepu Medical use rechargeable cells.
Where are stimulators implanted and managed?
Based on care setting, the market is categorized into hospitals, specialty clinics and research and prescription home care. Hospitals led with a 78.0% share of 2025 value, because implants need operating rooms, imaging and neurosurgical teams. Research and Prescription Home Care grows fastest at 13.88% a year, as remote programming lets clinicians adjust settings while patients stay at home.
| Segment Group | Leading Sub-segment | Share, 2025 | Fastest-growing Sub-segment | CAGR, 2026–2035 |
|---|---|---|---|---|
| By Product Type | Spinal Cord Stimulators | 38.0% | Deep Brain Stimulators | 13.29% |
| By Disease Area | Chronic Pain | 40.0% | Epilepsy and Psychiatric Disorders | 13.35% |
| By Technology | Rechargeable Implantable Platforms | 52.0% | Rechargeable Implantable Platforms | 13.21% |
| By Care Setting | Hospitals | 78.0% | Research and Prescription Home Care | 13.88% |
Request a Free Sample
Fill in your details and we'll send you a free sample report.
- Sample data tables & charts
- Research methodology
Aging, coverage decisions and adaptive systems lift demand
How does age-associated neurological demand lift implants?
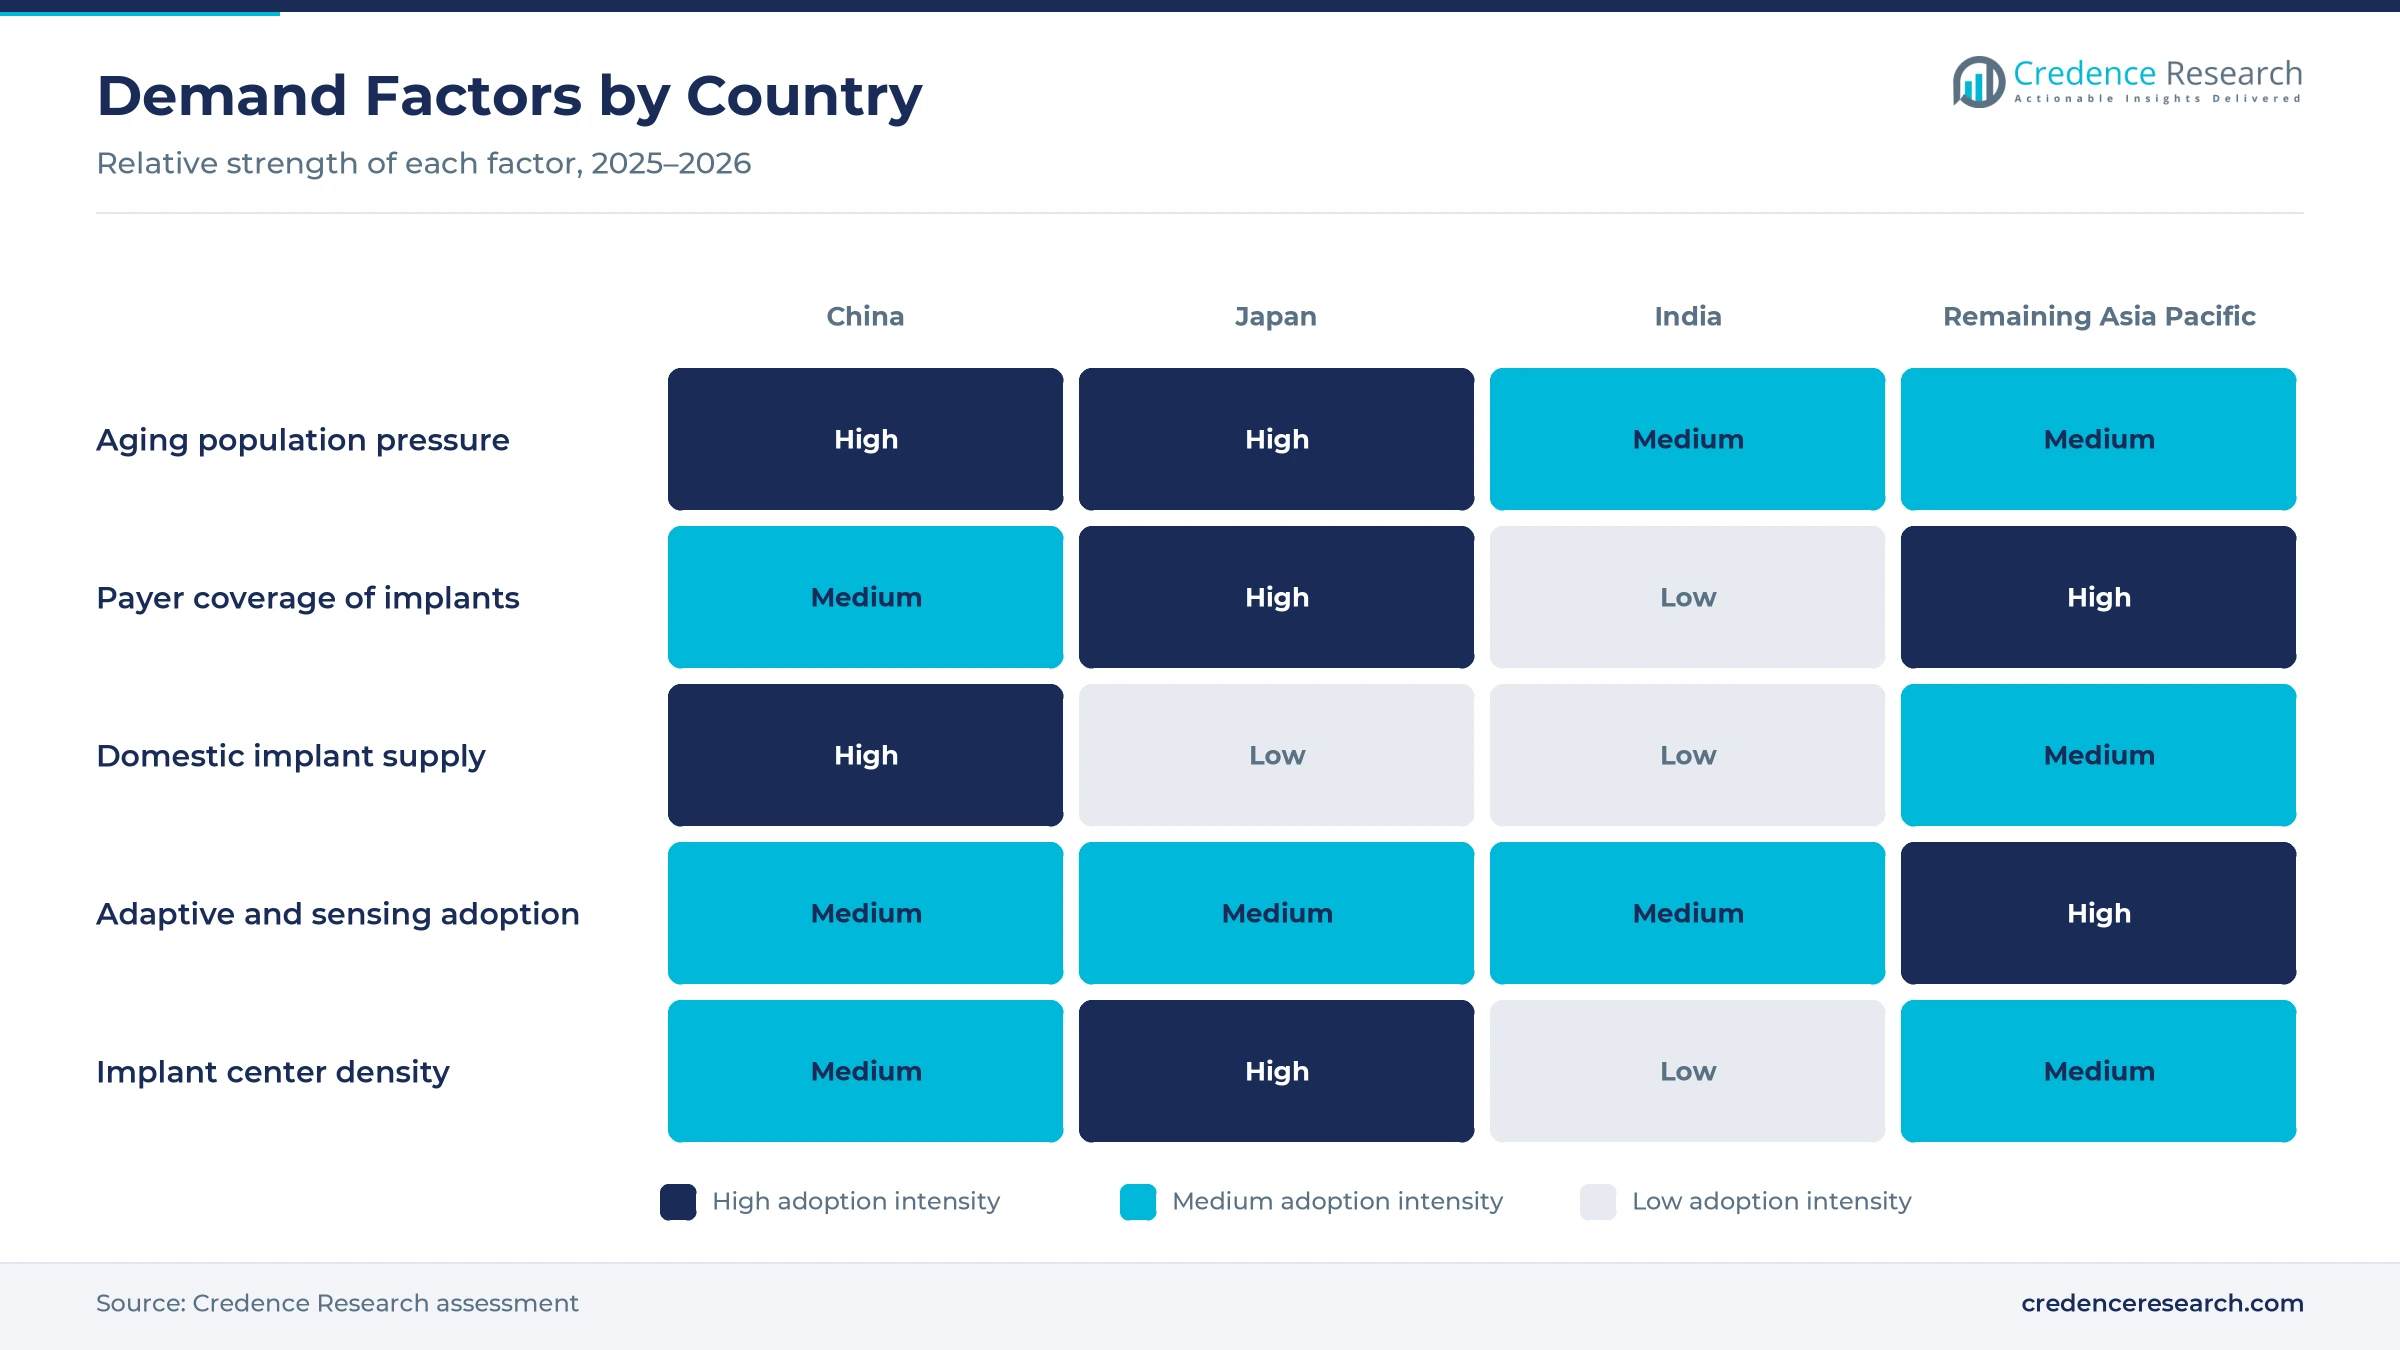
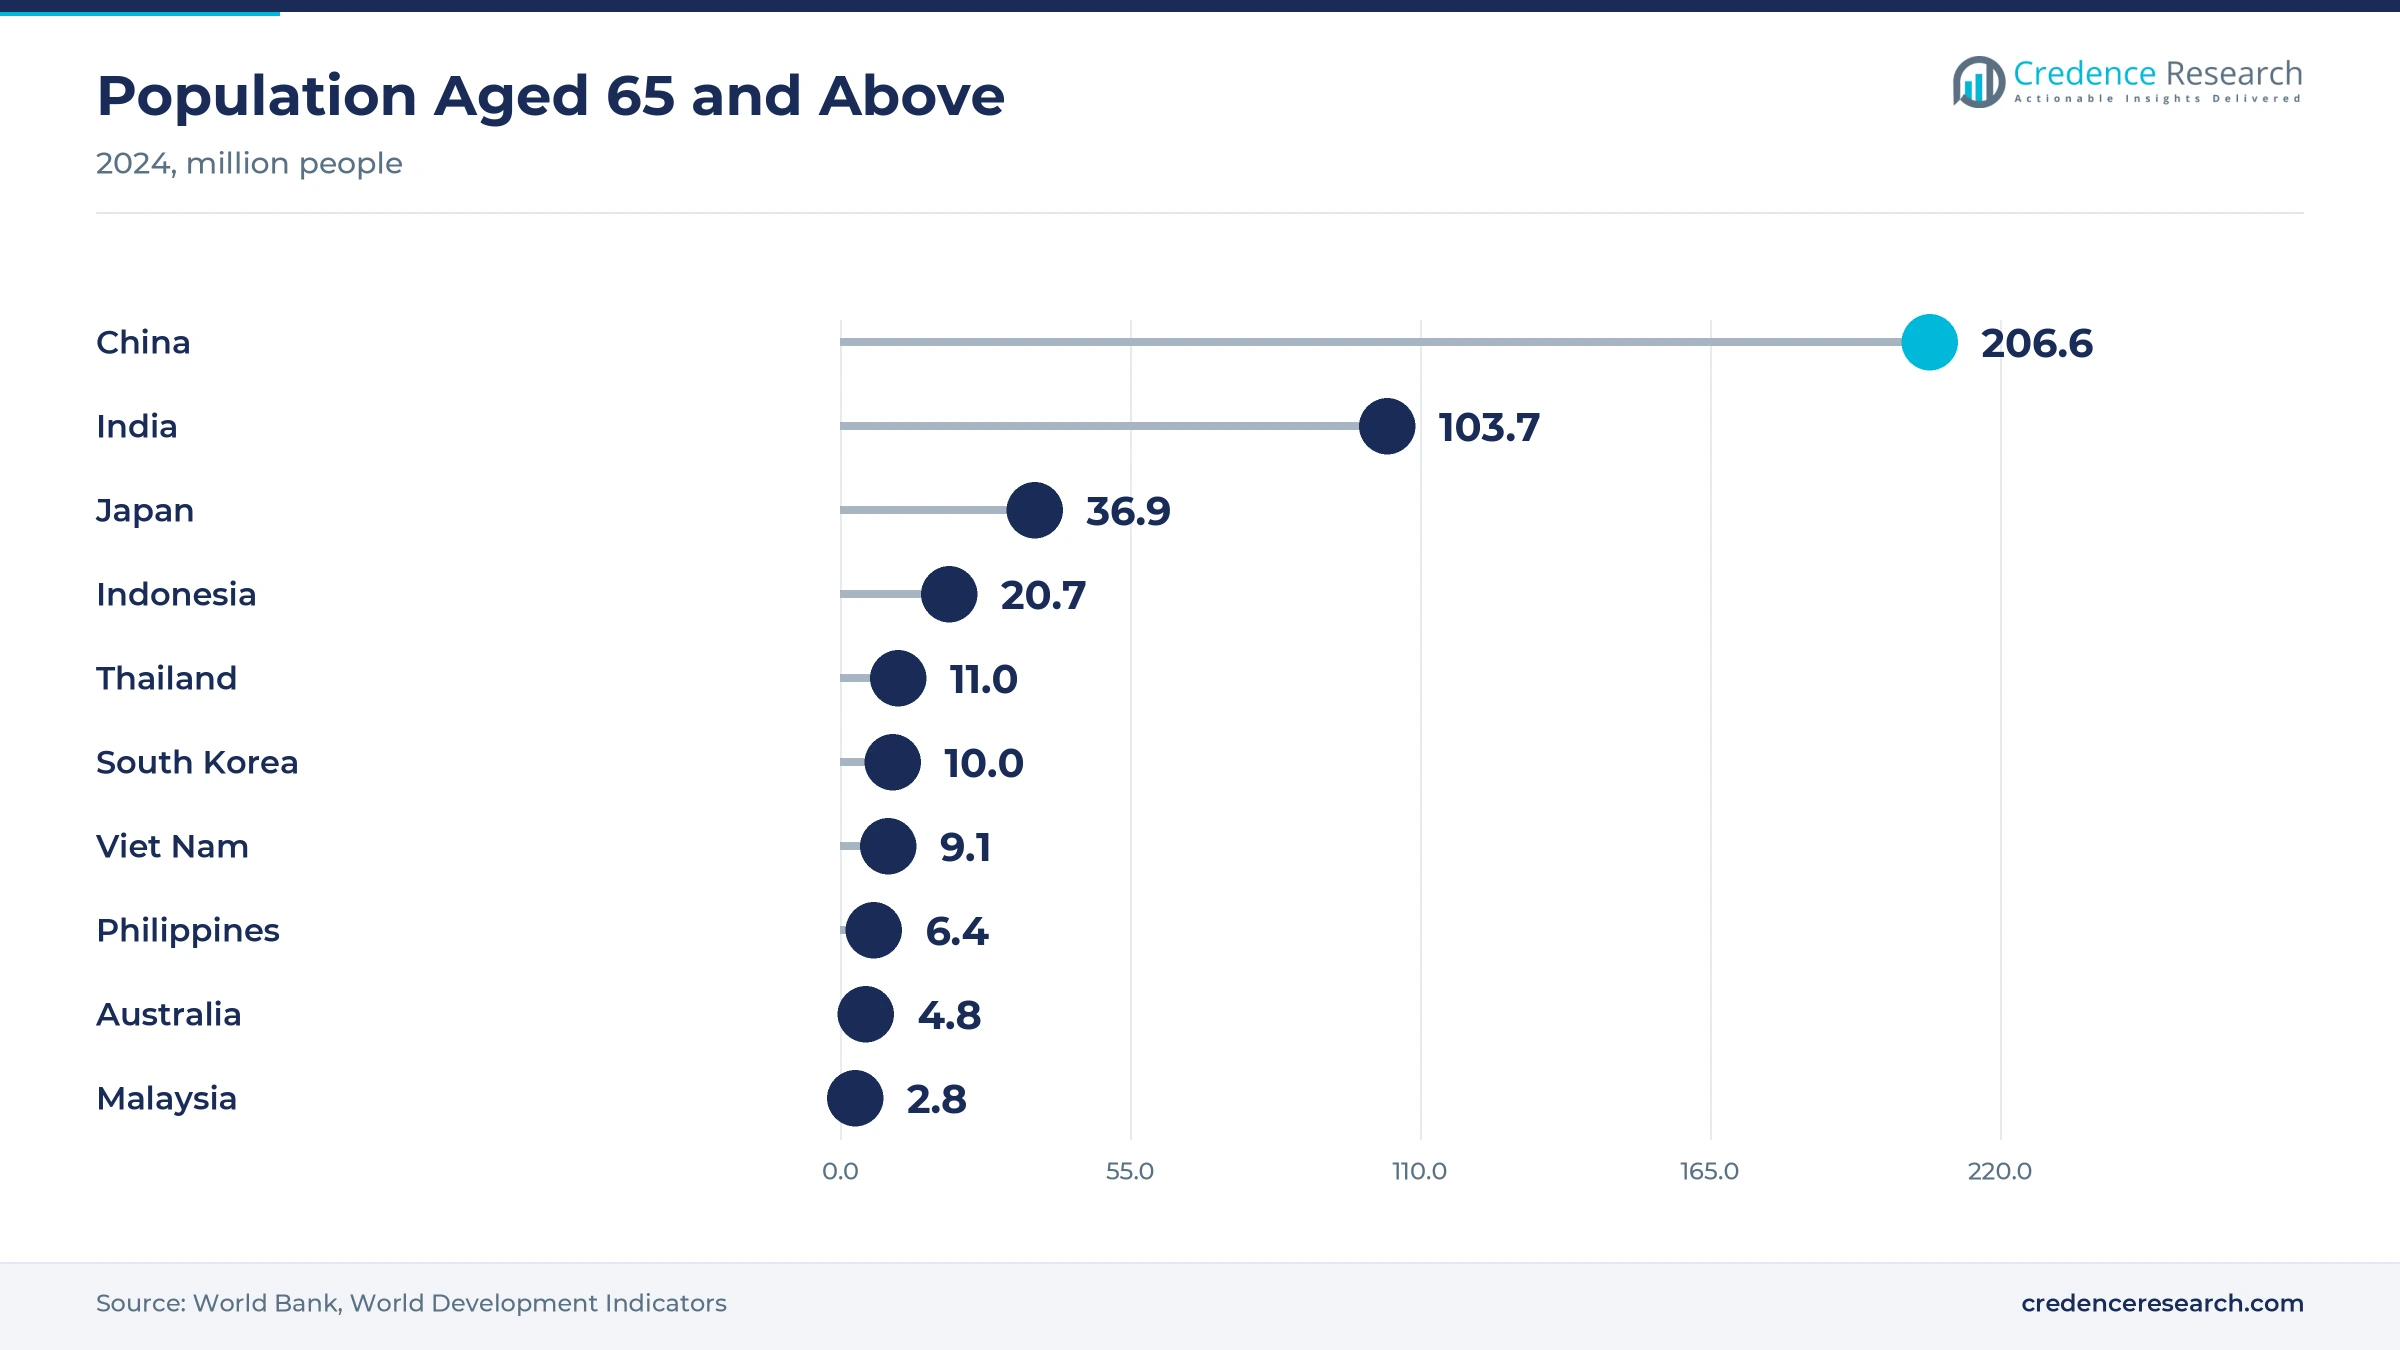
Parkinson's disease, spinal degeneration and chronic pain all rise sharply after age 60, so the region's fast-aging population enlarges the pool of implant candidates each year. China had about 206.6 million people aged 65 and above in 2024, while Japan had 36.9 million and India had 103.7 million, according to the World Bank. Older residents made up 29.8% of the Japanese population in the same year, the highest share in the region. In India, Parkinson's prevalence reached an estimated 771,000 people in 2019, and age-standardized prevalence rose about 30% between 1990 and 2016. As a result, deep brain stimulators grow at 13.29% a year, the fastest product type during 2026–2035.
Why does guideline-enabled treatment access widen use?
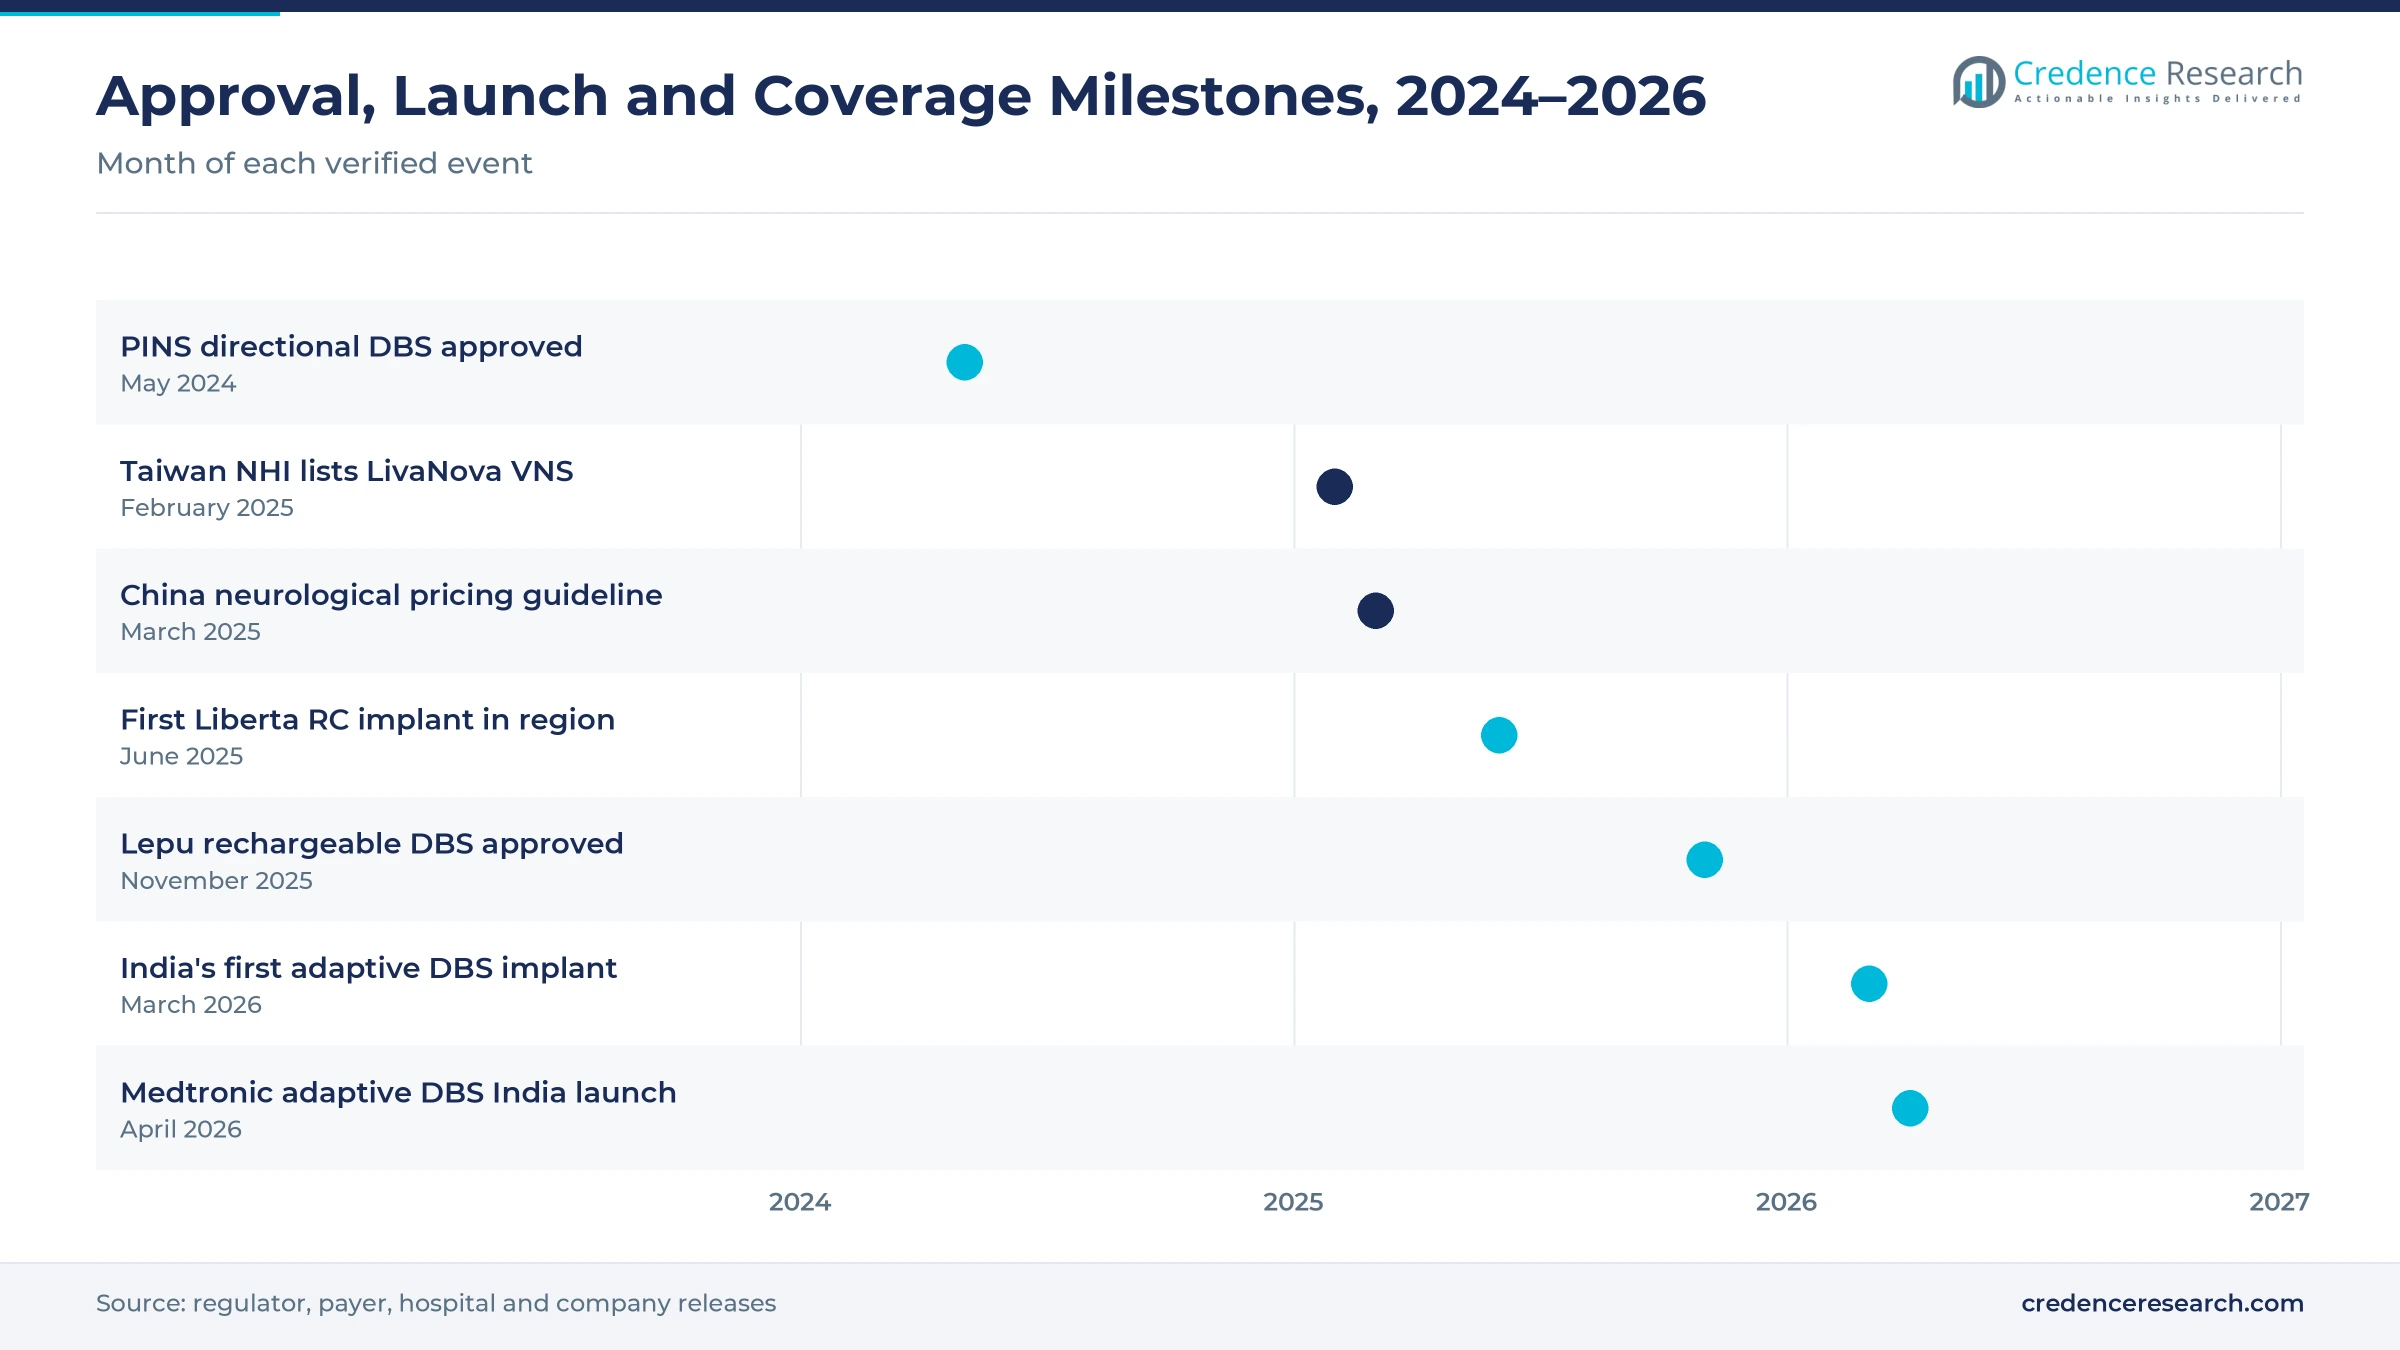
Payers and health technology bodies decide which patients can afford an implant, and several recent decisions have widened coverage in the region. Taiwan's National Health Insurance Administration added the LivaNova vagus nerve stimulation system to coverage on Feb. 1, 2025, and expects about 113 epilepsy patients a year to gain access, according to the NHI Administration. Japan began reimbursing repetitive transcranial magnetic stimulation for drug-resistant depression in June 2019, at about $110 per session. China's National Healthcare Security Administration issued a pricing guideline for neurological services on March 12, 2025, with separate billing items for implanted brain-computer interfaces. In turn, epilepsy and psychiatric disorders grow at 13.35% a year, the fastest disease area.
How does adaptive and directional innovation raise value?
Sensing systems cut manual programming and reduce side effects, which lets makers charge more for each implant they sell. China's drug and device regulator approved Beijing PINS Medical's directional brain stimulation system in May 2024, the first domestic directional product in China, according to the NMPA. Medtronic won U.S. approval for adaptive brain stimulation on Feb. 24, 2025, and its Percept stimulators had served more than 40,000 patients worldwide. Apollo Hospitals in Chennai then performed India's first adaptive implant on March 2, 2026, in a 62-year-old man. As a result, rechargeable implantable platforms hold 52.0% of 2025 value, because sensing platforms need durable power.
Why do domestic Chinese makers expand the patient pool?
Locally built stimulators cost less and reach provincial hospitals that once lacked implant programs, which enlarges the treated population in China. Devices from the Tsinghua University neuromodulation laboratory, co-founded with Beijing PINS Medical and Beijing Tiantan Hospital, account for more than 60% of annual implants in China. The laboratory has developed deep brain, vagus nerve, sacral nerve and spinal cord stimulators with remote programming. Lepu Medical also received approval on Nov. 4, 2025, for a rechargeable deep brain stimulator for late-stage Parkinson's disease. In turn, China grows at 12.75% a year, as more provincial hospitals adopt deep brain stimulation systems from local suppliers.
Closed-loop sensing, local makers and remote care spread
How is the shift to closed-loop sensing changing therapy?
Implants increasingly read nerve or brain signals and adjust stimulation on their own, which changes how pain and Parkinson's therapy is delivered. Medtronic's Inceptiv system, approved in the United States on April 26, 2024, senses spinal cord responses 50 times per second and allows full-body 3T MRI scans under set conditions. Medtronic's adaptive brain stimulation also reached Europe and the United States in early 2025 before its Indian launch on April 23, 2026. These products move sensing from research use into routine pain and Parkinson's care across the region. As a result, buyers of spinal cord stimulators compare sensing features alongside battery life, MRI access and recharge intervals when they choose a system.
Why is the rise of remote programming notable?
Patients in large countries often live far from the few centers that implant stimulators, so makers now add programming over secure connections. St Andrew's War Memorial Hospital in Brisbane implanted the first Abbott Liberta RC brain stimulator in Asia Pacific on June 26, 2025, which was its team's 1,350th implant. Clinicians can adjust Liberta RC settings and push software updates over Wi-Fi through the NeuroSphere platform. The Tsinghua laboratory also lists remote program control among its main breakthroughs for Chinese stimulators. In turn, research and prescription home care grows at 13.88% a year, the fastest care setting during 2026–2035.
Can pediatric epilepsy care open new demand?
Many children with drug-resistant seizures in China still lack a surgical option, which leaves a large group of untreated candidates. A multicenter study across China followed 87 children who received vagus nerve stimulation, according to a December 2025 study. At 26 weeks, 18.6% of the children had a 50% or greater drop in seizures, and 16.3% were seizure-free. Only two children had adverse events, and both were mild and transient. Taiwan also widened coverage for vagus nerve stimulation in 2025. As a result, makers of vagus nerve stimulators can grow sales in pediatric epilepsy centers across China and Taiwan.
Is there room to grow in Indian movement disorder care?
Brain stimulation in India remains concentrated in a few large cities, which leaves a wide gap between need and treatment. An Indian health technology assessment found that the therapy costs about Rs 6 lakh to Rs 26 lakh and is available only in Tier 1 cities, according to the ICMR policy brief. The same brief proposed a financial framework and decision process for fair access to the therapy. Medtronic says India carries about 10% of the global Parkinson's burden. In turn, India holds 10.1% of 2025 value, and private hospital groups are adding movement disorder teams and programming clinics.
Price, payer reviews and surgeon capacity limit uptake
Why does high implant cost limit uptake in India?
Most Indian patients pay for stimulators from their own savings or private insurance, which keeps implants out of reach for many families. As a result, many eligible Parkinson's and pain patients stay on drugs even when their symptoms no longer respond well. Makers respond with financing plans, lower-cost product lines and hospital partnerships that spread costs. This barrier weighs most on smaller cities, where incomes are lower and few neurosurgeons perform implants.
How do payer reviews in Australia create uncertainty?
The Australian health department is reviewing spinal cord stimulator benefits on its Prescribed List, which leaves suppliers unsure about future benefit levels. A 2023 consultant report found the evidence on comparative effectiveness uncertain, and stakeholder consultation ran from June to November 2025. In turn, private insurers and hospitals may slow purchases until benefit settings are final. Makers respond with registry data and long-term outcome studies that support current listings.
Why does surgeon and programmer capacity slow growth?
Each implant needs a trained neurosurgeon, a neurologist or pain specialist and repeated programming visits, and these specialists remain scarce outside large cities. As a result, waiting lists grow in large public hospitals, while many provincial centers perform only a few implants each year. Makers respond with training programs, remote programming and simpler software that shortens each visit. This shortage affects brain stimulation most, because patient selection and lead placement demand long specialist training.
How do price controls pressure supplier margins?
Public payers in China and other countries set procedure fees and buy implants through tenders, which caps the prices suppliers can charge. In turn, imported systems face strong competition from domestic stimulators that sell at lower prices with similar core features. Global makers respond with local partners, premium sensing features and service programs that justify higher prices. This pressure falls hardest on primary-cell systems, which offer fewer clear advantages over lower-cost local rivals.
China leads while India adds the fastest growth
| Country | Value, 2025 (USD billion) | Share, 2025 | CAGR, 2026–2035 |
|---|---|---|---|
| China | 0.65 | 50.3% | 12.75% |
| Remaining Asia Pacific | 0.36 | 27.7% | 12.15% |
| Japan | 0.15 | 11.9% | 10.85% |
| India | 0.13 | 10.1% | 14.15% |
Why does China hold half of regional value?
China held a 50.3% share of 2025 value and grows at 12.75% a year, because domestic makers now supply most of its implants at lower prices than imported systems. Devices from the Tsinghua laboratory and Beijing PINS Medical account for more than 60% of annual implants in China. Lepu Medical added a rechargeable brain stimulator in November 2025, which gives provincial hospitals a second domestic rechargeable option. As a result, China leads both volume and new product approvals.
How does Japan support premium therapy demand?
Japan held an 11.9% share of 2025 value and grows at 10.85% a year, because its insurance system pays for implants and magnetic stimulation at stable fees. A study of 21 Japanese institutes reported a 53.5% response rate among patients who received repetitive transcranial magnetic stimulation for drug-resistant depression. Japan also has the oldest population in the region, with 29.8% of residents aged 65 and above. In turn, Japan remains a premium market with slower volume growth than China or India.
What makes India the fastest-growing country?
India held 10.1% of 2025 value and grows fastest at 14.15% a year, because a large untreated Parkinson's pool meets new private hospital programs. Apollo Hospitals in Chennai performed India's first adaptive brain stimulation implant in March 2026, and Medtronic launched the system nationally in April 2026. The national assessment body has also studied brain stimulation costs and access. As a result, India gains new implant centers beyond Delhi, Mumbai and Chennai.
How do the remaining countries contribute?
The remaining Asia Pacific countries held 27.7% of 2025 value and grow at 12.15% a year, because Australia, South Korea, Taiwan and Southeast Asia run mature implant programs. Brisbane surgeons implanted the first Abbott Liberta RC system in Asia Pacific in June 2025. Taiwan added LivaNova vagus nerve stimulation to national coverage in February 2025. In turn, this group adds steady demand, although Australian payer reviews of spinal cord stimulators may slow pain implants.
Approvals, launches and coverage moves since 2024
| Development | Status and market relevance |
|---|---|
| In May 2024, China's drug and device regulator approved Beijing PINS Medical's directional deep brain stimulation system. | First domestic directional system in China |
| In February 2025, Taiwan's National Health Insurance added the LivaNova vagus nerve stimulation system to coverage. | Widens access for drug-resistant epilepsy |
| In June 2025, St Andrew's War Memorial Hospital in Brisbane implanted the first Abbott Liberta RC system in Asia Pacific. | Brings remote-programmable brain stimulation to the region |
| In November 2025, Lepu Medical received approval for a rechargeable deep brain stimulator in China. | Adds a second domestic rechargeable rival |
| In April 2026, Medtronic launched its adaptive deep brain stimulation system in India. | Brings sensing-based Parkinson's care to India |
Sensing, directional leads and rechargeable cells advance
- Closed-loop sensing reads spinal or brain signals and adjusts stimulation automatically, as Medtronic's Inceptiv system does 50 times per second.
- Directional leads steer current toward specific parts of a brain target, which can lower side effects and reduce repeat lead surgery.
- Rechargeable cells extend implant life beyond a decade in systems such as Abbott's Liberta RC, which cuts replacement operations for younger patients.
- Remote programming lets clinicians change settings over secure connections, which helps patients who live far from implant centers in China, India and Australia.
Need a Custom Version of This Report?
Tailor the scope, geography, or segments to your exact requirements.
- Custom geography or segment scope
- Direct access to our analyst team
Global implant makers and Chinese rivals compete on access
Competition combines global implant makers with broad portfolios and Chinese makers that win on price and local service. Medtronic competes with spinal cord, brain and pelvic stimulators and stresses sensing, after launching adaptive brain stimulation in India in April 2026. Abbott competes in brain and spinal cord stimulation and brought its Liberta RC system to Australia in June 2025. Beijing PINS Medical competes across brain, vagus nerve, sacral and spinal cord stimulation and holds a large share of Chinese implants. Lepu Medical entered brain stimulation with a rechargeable system in November 2025. LivaNova competes in vagus nerve stimulation for epilepsy and gained national coverage in Taiwan in 2025. Rivals compete on price, battery life, sensing features, MRI access, surgeon training and programming support, which keeps service networks central to winning hospital contracts.
Which suppliers serve Asia Pacific implant centers?
| Company | Type | Role in the market |
|---|---|---|
| Medtronic | Global implant maker | Launched adaptive deep brain stimulation in India in April 2026 |
| Abbott Laboratories | Global implant maker | First Liberta RC implant in Asia Pacific in Brisbane, June 2025 |
| Beijing PINS Medical | Chinese implant maker | Won approval for China's first domestic directional brain stimulator |
| LivaNova | Global epilepsy specialist | Vagus nerve stimulation added to Taiwan coverage in February 2025 |
| Lepu Medical | Chinese device maker | Won approval for a rechargeable brain stimulator in November 2025 |
Credence Research view on Asian neuromodulation demand
Credence Research's view is that Asia Pacific neuromodulation sales will grow quickly because aging, payer coverage and local manufacturing widen the pool of treatable patients across the region. Spinal cord stimulators remain the largest value pool, while brain stimulation, epilepsy care and home programming add the fastest growth. Chinese makers will keep pressure on prices in China and may export to nearby countries. Suppliers that pair sensing features with training and remote follow-up should gain the most, because surgeon capacity limits growth more than demand.
How the regional neuromodulation estimate was built
The report uses 2025 as the base year on a calendar basis, and market values come from the Credence Research model. That model combines international agency statistics on population and aging, government data on coverage and approvals, published clinical studies and company releases on launches and implants. Country shares, country growth rates, segment splits and segment growth rates are Credence Research estimates from public data. Sources used are international agency data, government releases, peer-reviewed studies, hospital releases and company releases, and no interviews or surveys were used.
Brain stimulation and home programming carry growth to 2035
The Asia Pacific neuromodulation devices market is expected to reach USD 4.22 billion by 2035, a 12.52% CAGR during 2026–2035, as aging populations and wider coverage bring more patients to implant centers. Growth should be strongest in India, deep brain stimulators and epilepsy and psychiatric care, because these areas gain most from new approvals and payer decisions. High prices, payer reviews and surgeon shortages could slow growth in some countries, while domestic Chinese supply and remote programming should lower the cost of care.
Frequently Asked Questions
How big is the Asia Pacific neuromodulation devices market?
Which product type leads the market?
Which country leads the market?
What is adaptive deep brain stimulation?
Why do rechargeable platforms lead?
Which disease area grows fastest?
Who are the leading companies in this market?
What are the main challenges for suppliers?
Table of Content
Chapter 1 Market Segmentation
- 1.1 Segmentation Framework
- 1.1.1 Product and Service Classification
- 1.1.2 Application and End-Use Classification
- 1.1.3 Technology and Solution Classification
- 1.1.4 Customer and Distribution Channel Classification
- 1.1.5 Geographic Segmentation
- 1.1.6 Market Segment Definitions and Boundaries
- 1.2 By Product Type
- 1.2.1 Spinal Cord Stimulators
- 1.2.2 Deep Brain Stimulators
- 1.2.3 Additional Implantable Stimulators
- 1.2.4 External Clinical Stimulators
- 1.3 By Disease Area
- 1.3.1 Chronic Pain
- 1.3.2 Movement Disorders
- 1.3.3 Epilepsy and Psychiatric Disorders
- 1.3.4 Pelvic, Gastric and Headache Disorders
- 1.4 By Technology
- 1.4.1 Rechargeable Implantable Platforms
- 1.4.2 Primary-Cell Implantable Platforms
- 1.4.3 Externally Powered Clinical Platforms
- 1.5 By Care Setting
- 1.5.1 Hospitals
- 1.5.2 Specialty Clinics
- 1.5.3 Research and Prescription Home Care
- 1.6 By Country
- 1.6.1 Japan
- 1.6.2 China
- 1.6.3 India
- 1.6.4 Remaining Asia Pacific
Chapter 2 Introduction
- 2.1 Report Objectives and Scope
- 2.2 Product Definition and Industry Terminology
- 2.3 Market Inclusions and Exclusions
- 2.4 Research Process
- 2.4.1 Primary Research and Expert Interviews
- 2.4.2 Secondary Research and Source Review
- 2.4.3 Top-Down and Bottom-Up Estimation
- 2.4.4 Data Triangulation and Verification
- 2.5 Market Size Measurement Basis
- 2.5.1 2025: USD 1.29 billion → 2035: USD 4.22 billion
- 2.6 Historical and Forecast Reference Periods
- 2.6.1 Historical Period: 2018-2025
- 2.6.2 Base Year: 2025
- 2.6.3 Forecast Period: 2025-2035
- 2.7 Research Assumptions and Limitations
Chapter 3 Executive Summary
- 3.1 Market Snapshot and Key Findings
- 3.2 Base-Year Market Size, 2025
- 3.3 Forecast Market Size, 2035
- 3.4 Revenue and Volume Growth Outlook
- 3.5 Key Demand and Supply Indicators
- 3.6 Leading Market Segments
- 3.7 Fastest-Growing Market Opportunities
- 3.8 Regional Performance Highlights
- 3.9 Technology and Industry Transformation
- 3.10 Competitive Landscape Summary
- 3.11 Analyst View and Strategic Implications
Chapter 4 Asia Pacific Neuromodulation Devices Market Trends and Developments
- 4.1 Historical Industry Development, 2018-2025
- 4.2 Recent Market Trends and Developments
- 4.3 Demand and Customer Behavior Trends
- 4.4 Technology and Product Innovation
- 4.5 Artificial Intelligence, Automation and Digitalization
- 4.6 Local Manufacturing and Supply Chain Realignment
- 4.7 Industry Partnerships, Mergers and Acquisitions
- 4.8 Sustainability and Circular Economy Developments
- 4.9 Government and Private Sector Investment Trends
- 4.10 Emerging Business Models and Commercialization
- 4.11 Industry Developments and Announcements
Chapter 5 Asia Pacific Neuromodulation Devices Market Production, Supply and Demand Analysis
- 5.1 Demand Trend and Consumption Analysis, 2018-2025
- 5.2 Demand Forecast, 2025-2035
- 5.3 Production and Output Trend, 2018-2025
- 5.4 Production and Output Forecast, 2025-2035
- 5.5 Installed Capacity and Capacity Utilization
- 5.6 Company-Wise Production Plants and Statistics
- 5.6.1 Installed Production Capacity
- 5.6.2 Actual Production
- 5.6.3 Planned Capacity and Expansion Targets
- 5.7 Supply Chain Structure and Procurement Trends
- 5.8 Supply-Demand Gap and Bottlenecks
- 5.9 Import Dependence and Sourcing Structure
- 5.10 Contract Manufacturing and Outsourcing
- 5.11 Regional Supply and Demand Concentration
Chapter 6 Asia Pacific Neuromodulation Devices Market Pricing Analysis
- 6.1 Pricing Structure and Measurement
- 6.2 Historical Pricing Trends, 2018-2025
- 6.3 Pricing Outlook, 2025-2035
- 6.4 Average Selling Price and Unit Economics
- 6.5 Pricing by Product and Market Segment
- 6.6 Geographic Pricing Differences
- 6.7 Key Input, Energy, Labor and Logistics Costs
- 6.8 Contract Pricing and Purchasing Models
- 6.9 Pricing Sensitivity and Competitive Positioning
- 6.10 Price, Margin and Profitability Implications
Chapter 7 Asia Pacific Neuromodulation Devices Market Dynamics
- 7.1 Market Growth Drivers
- 7.1.1 Demand-Side Drivers
- 7.1.2 Technology and Innovation Drivers
- 7.1.3 Infrastructure and Investment Drivers
- 7.1.4 Regulatory and Policy Drivers
- 7.2 Market Restraints
- 7.2.1 Cost and Affordability Constraints
- 7.2.2 Technology and Adoption Barriers
- 7.2.3 Supply Chain and Operational Constraints
- 7.3 Market Challenges
- 7.3.1 Competitive Pressure and Margin Erosion
- 7.3.2 Skills, Infrastructure and Implementation Gaps
- 7.4 Emerging Market Opportunities
- 7.5 Market Dynamics Impact and Time-Horizon Assessment
Chapter 8 Asia Pacific Neuromodulation Devices Value Chain Analysis
- 8.1 Industry Value Chain Overview
- 8.2 Upstream Suppliers and Critical Inputs
- 8.3 Technology and Component Providers
- 8.4 Manufacturing or Service Delivery
- 8.5 Distribution, Channel Partners and Integrators
- 8.6 Downstream Applications and End Users
- 8.7 Value Addition and Profit Pools
- 8.8 Vertical Integration and Outsourcing
- 8.9 Supplier Concentration and Risk
- 8.10 Supply Chain Localization and Resilience
Chapter 9 Asia Pacific Neuromodulation Devices Market Regulations and Policies
- 9.1 Relevant Laws, Standards and Compliance Frameworks
- 9.2 Product, Service, Safety and Quality Requirements
- 9.3 Government Policies, Incentives and Subsidies
- 9.4 Imports, Exports and Trade Barriers
- 9.5 Public Procurement and Local Content Requirements
- 9.6 Environmental and Sustainability Compliance
- 9.7 Upcoming Policy Changes and Market Implications
Chapter 10 Asia Pacific Neuromodulation Devices Market Hotspots and Opportunities
- 10.1 Market Opportunity Mapping and Growth Hotspots
- 10.2 High-Growth Applications and Customer Groups
- 10.3 Underserved Markets and White-Space Opportunities
- 10.4 Emerging Technology and Product Opportunities
- 10.5 New Capacity and Investment Hotspots
- 10.6 Market Entry and Expansion Opportunities
- 10.7 Distribution and Partnership Opportunities
- 10.8 Near-Term and Long-Term Commercial Potential
- 10.9 Opportunity Attractiveness and Execution Risks
Chapter 11 Asia Pacific Neuromodulation Devices Market Outlook, 2025-2035
- 11.1 Market Size and Analysis
- 11.1.1 Revenue (Market Measurement: 2025: USD 1.29 billion → 2035: USD 4.22 billion)
- 11.1.2 Market Volume and Quantity Sold
- 11.1.3 Historical Market Size, 2018-2025
- 11.1.4 Base-Year Market Size, 2025
- 11.2 Market Forecast, 2025-2035
- 11.2.1 Revenue Forecast to 2035
- 11.2.2 Volume Forecast to 2035
- 11.2.3 CAGR and Year-on-Year Growth
- 11.2.4 Incremental Revenue Opportunity
- 11.3 Forecast Assumptions and Scenario Analysis
- 11.3.1 Base-Case Forecast
- 11.3.2 Optimistic and Conservative Scenarios
- 11.3.3 Technology, Pricing and Policy Sensitivities
- 11.4 Market Attractiveness and Growth Outlook
Chapter 12 Asia Pacific Neuromodulation Devices Market Segmentation and Outlook
- 12.1 Segmentation Summary and Market Shares, 2025
- 12.2 Largest and Fastest-Growing Segments
- 12.3 By Product Type - Market Size and Forecast, 2025-2035
- 12.3.1 Segment Definition and Scope
- 12.3.2 Historical Market Size, 2018-2025
- 12.3.3 Revenue Forecast, 2025-2035
- 12.3.4 Volume Forecast, 2025-2035
- 12.3.5 Base-Year Market Share, 2025
- 12.3.6 Segment CAGR and Growth Drivers
- 12.3.7 Subsegment Market Size and Forecast
- 12.3.7.1 Spinal Cord Stimulators
- 12.3.7.2 Deep Brain Stimulators
- 12.3.7.3 Additional Implantable Stimulators
- 12.3.7.4 External Clinical Stimulators
- 12.3.8 Subsegment Pricing and Adoption Trends
- 12.3.9 Leading Suppliers and Competition
- 12.3.10 Regional Demand and Opportunities
- 12.4 By Disease Area - Market Size and Forecast, 2025-2035
- 12.4.1 Segment Definition and Scope
- 12.4.2 Historical Market Size, 2018-2025
- 12.4.3 Revenue Forecast, 2025-2035
- 12.4.4 Volume Forecast, 2025-2035
- 12.4.5 Base-Year Market Share, 2025
- 12.4.6 Segment CAGR and Growth Drivers
- 12.4.7 Subsegment Market Size and Forecast
- 12.4.7.1 Chronic Pain
- 12.4.7.2 Movement Disorders
- 12.4.7.3 Epilepsy and Psychiatric Disorders
- 12.4.7.4 Pelvic, Gastric and Headache Disorders
- 12.4.8 Subsegment Pricing and Adoption Trends
- 12.4.9 Leading Suppliers and Competition
- 12.4.10 Regional Demand and Opportunities
- 12.5 By Technology - Market Size and Forecast, 2025-2035
- 12.5.1 Segment Definition and Scope
- 12.5.2 Historical Market Size, 2018-2025
- 12.5.3 Revenue Forecast, 2025-2035
- 12.5.4 Volume Forecast, 2025-2035
- 12.5.5 Base-Year Market Share, 2025
- 12.5.6 Segment CAGR and Growth Drivers
- 12.5.7 Subsegment Market Size and Forecast
- 12.5.7.1 Rechargeable Implantable Platforms
- 12.5.7.2 Primary-Cell Implantable Platforms
- 12.5.7.3 Externally Powered Clinical Platforms
- 12.5.8 Subsegment Pricing and Adoption Trends
- 12.5.9 Leading Suppliers and Competition
- 12.5.10 Regional Demand and Opportunities
- 12.6 By Care Setting - Market Size and Forecast, 2025-2035
- 12.6.1 Segment Definition and Scope
- 12.6.2 Historical Market Size, 2018-2025
- 12.6.3 Revenue Forecast, 2025-2035
- 12.6.4 Volume Forecast, 2025-2035
- 12.6.5 Base-Year Market Share, 2025
- 12.6.6 Segment CAGR and Growth Drivers
- 12.6.7 Subsegment Market Size and Forecast
- 12.6.7.1 Hospitals
- 12.6.7.2 Specialty Clinics
- 12.6.7.3 Research and Prescription Home Care
- 12.6.8 Subsegment Pricing and Adoption Trends
- 12.6.9 Leading Suppliers and Competition
- 12.6.10 Regional Demand and Opportunities
- 12.7 By Country - Market Size and Forecast, 2025-2035
- 12.7.1 Segment Definition and Scope
- 12.7.2 Historical Market Size, 2018-2025
- 12.7.3 Revenue Forecast, 2025-2035
- 12.7.4 Volume Forecast, 2025-2035
- 12.7.5 Base-Year Market Share, 2025
- 12.7.6 Segment CAGR and Growth Drivers
- 12.7.7 Subsegment Market Size and Forecast
- 12.7.7.1 Japan
- 12.7.7.2 China
- 12.7.7.3 India
- 12.7.7.4 Remaining Asia Pacific
- 12.7.8 Subsegment Pricing and Adoption Trends
- 12.7.9 Leading Suppliers and Competition
- 12.7.10 Regional Demand and Opportunities
- 12.8 Segment Growth Comparison
- 12.9 Segment Attractiveness and Priority Matrix
Chapter 13 Asia Pacific Neuromodulation Devices Geographic Market Outlook, 2025-2035
- 13.1 Regional Market Size and Country-Level Shares, 2025
- 13.2 Country Market Size Comparison, 2025
- 13.3 Country Market Forecasts, 2025-2035
- 13.4 Subregional Industrial and Demand Clusters
- 13.5 Intra-Regional Pricing and Cost Differences
- 13.6 Cross-Border Trade and Supply Networks
- 13.7 Regional Supply and Demand Balances
- 13.8 Country Opportunity Comparison and Prioritization
Note: Every listed country is covered on the structure shown under the first country.
Chapter 14 Asia Pacific Neuromodulation Devices Technology, Innovation and Sustainability Outlook
- 14.1 Technology Landscape and Maturity
- 14.2 Product, Process and Service Innovation
- 14.3 AI, Automation and Digital Tools in the Industry
- 14.4 Technology Adoption and Performance Benchmarking
- 14.5 Innovation Pipeline and R&D Investment
- 14.6 Patent and Intellectual Property Trends
- 14.7 Energy Efficiency and Resource Management
- 14.8 Sustainability, Recycling and Circularity
- 14.9 Technology Roadmap, 2025-2035
- 14.10 Risks of Obsolescence and Technology Substitution
Chapter 15 Asia Pacific Neuromodulation Devices Market Key Strategic Imperatives
- 15.1 Growth and Market Entry Priorities
- 15.2 High-Return Products and Segments
- 15.3 Pricing, Profitability and Cost Optimization
- 15.4 Technology Investment and Product Differentiation
- 15.5 Supply Chain Localization and Resilience
- 15.6 Distribution and Customer Acquisition
- 15.7 Partnership, Acquisition and Capacity Strategy
- 15.8 Regional Expansion Priorities
- 15.9 Short-, Medium- and Long-Term Actions
Chapter 16 Competition Outlook
- 16.1 Industry Competition Characteristics
- 16.2 Market Structure and Concentration
- 16.3 Market Share and Competitive Positioning, 2025
- 16.4 Company-Wise Revenue and Product Benchmarking
- 16.5 Production and Service Capacity Benchmarking
- 16.6 Technology, Pricing and Differentiation
- 16.7 Regional Footprint and Distribution Strength
- 16.8 Mergers, Acquisitions and Strategic Alliances
- 16.9 New Entrants and Competitive Threats
- 16.10 Porter's Five Forces and Industry Attractiveness
- 16.11 Competitive Outlook, 2025-2035
Chapter 17 Company Profiles
- 17.1 Company Coverage and Selection Criteria
- 17.2 Medtronic
- 17.2.1 Business Description
- 17.2.2 Company Ownership and Geographic Presence
- 17.2.3 Product and Service Portfolio
- 17.2.4 Manufacturing and Operating Footprint
- 17.2.5 Production Capacity and Expansion Plans
- 17.2.6 Financial Performance and Investment
- 17.2.7 Market Share and Competitive Position
- 17.2.8 Technology and Innovation Capabilities
- 17.2.9 Strategic Alliances or Partnerships
- 17.2.10 Recent Developments
- 17.2.11 Growth Strategy and Outlook
- 17.3 Abbott Laboratories
- 17.4 Boston Scientific
- 17.5 Beijing PINS Medical
- 17.6 LivaNova
- 17.7 Lepu Medical
- 17.8 Other Relevant Market Participants
Note: Every listed company is profiled on the structure shown under the first company. The company list is preliminary and may change based on research findings, market developments, data availability and client requirements.
Chapter 18 Disclaimer
- 18.1 Research and Forecast Disclaimer
- 18.2 Data Source and Estimation Limitations
Note: The depth of individual sections depends on data availability for this market. Volume, capacity, trade and other unit-based metrics are included where applicable.

