
Connected monitoring moves chronic care into the home
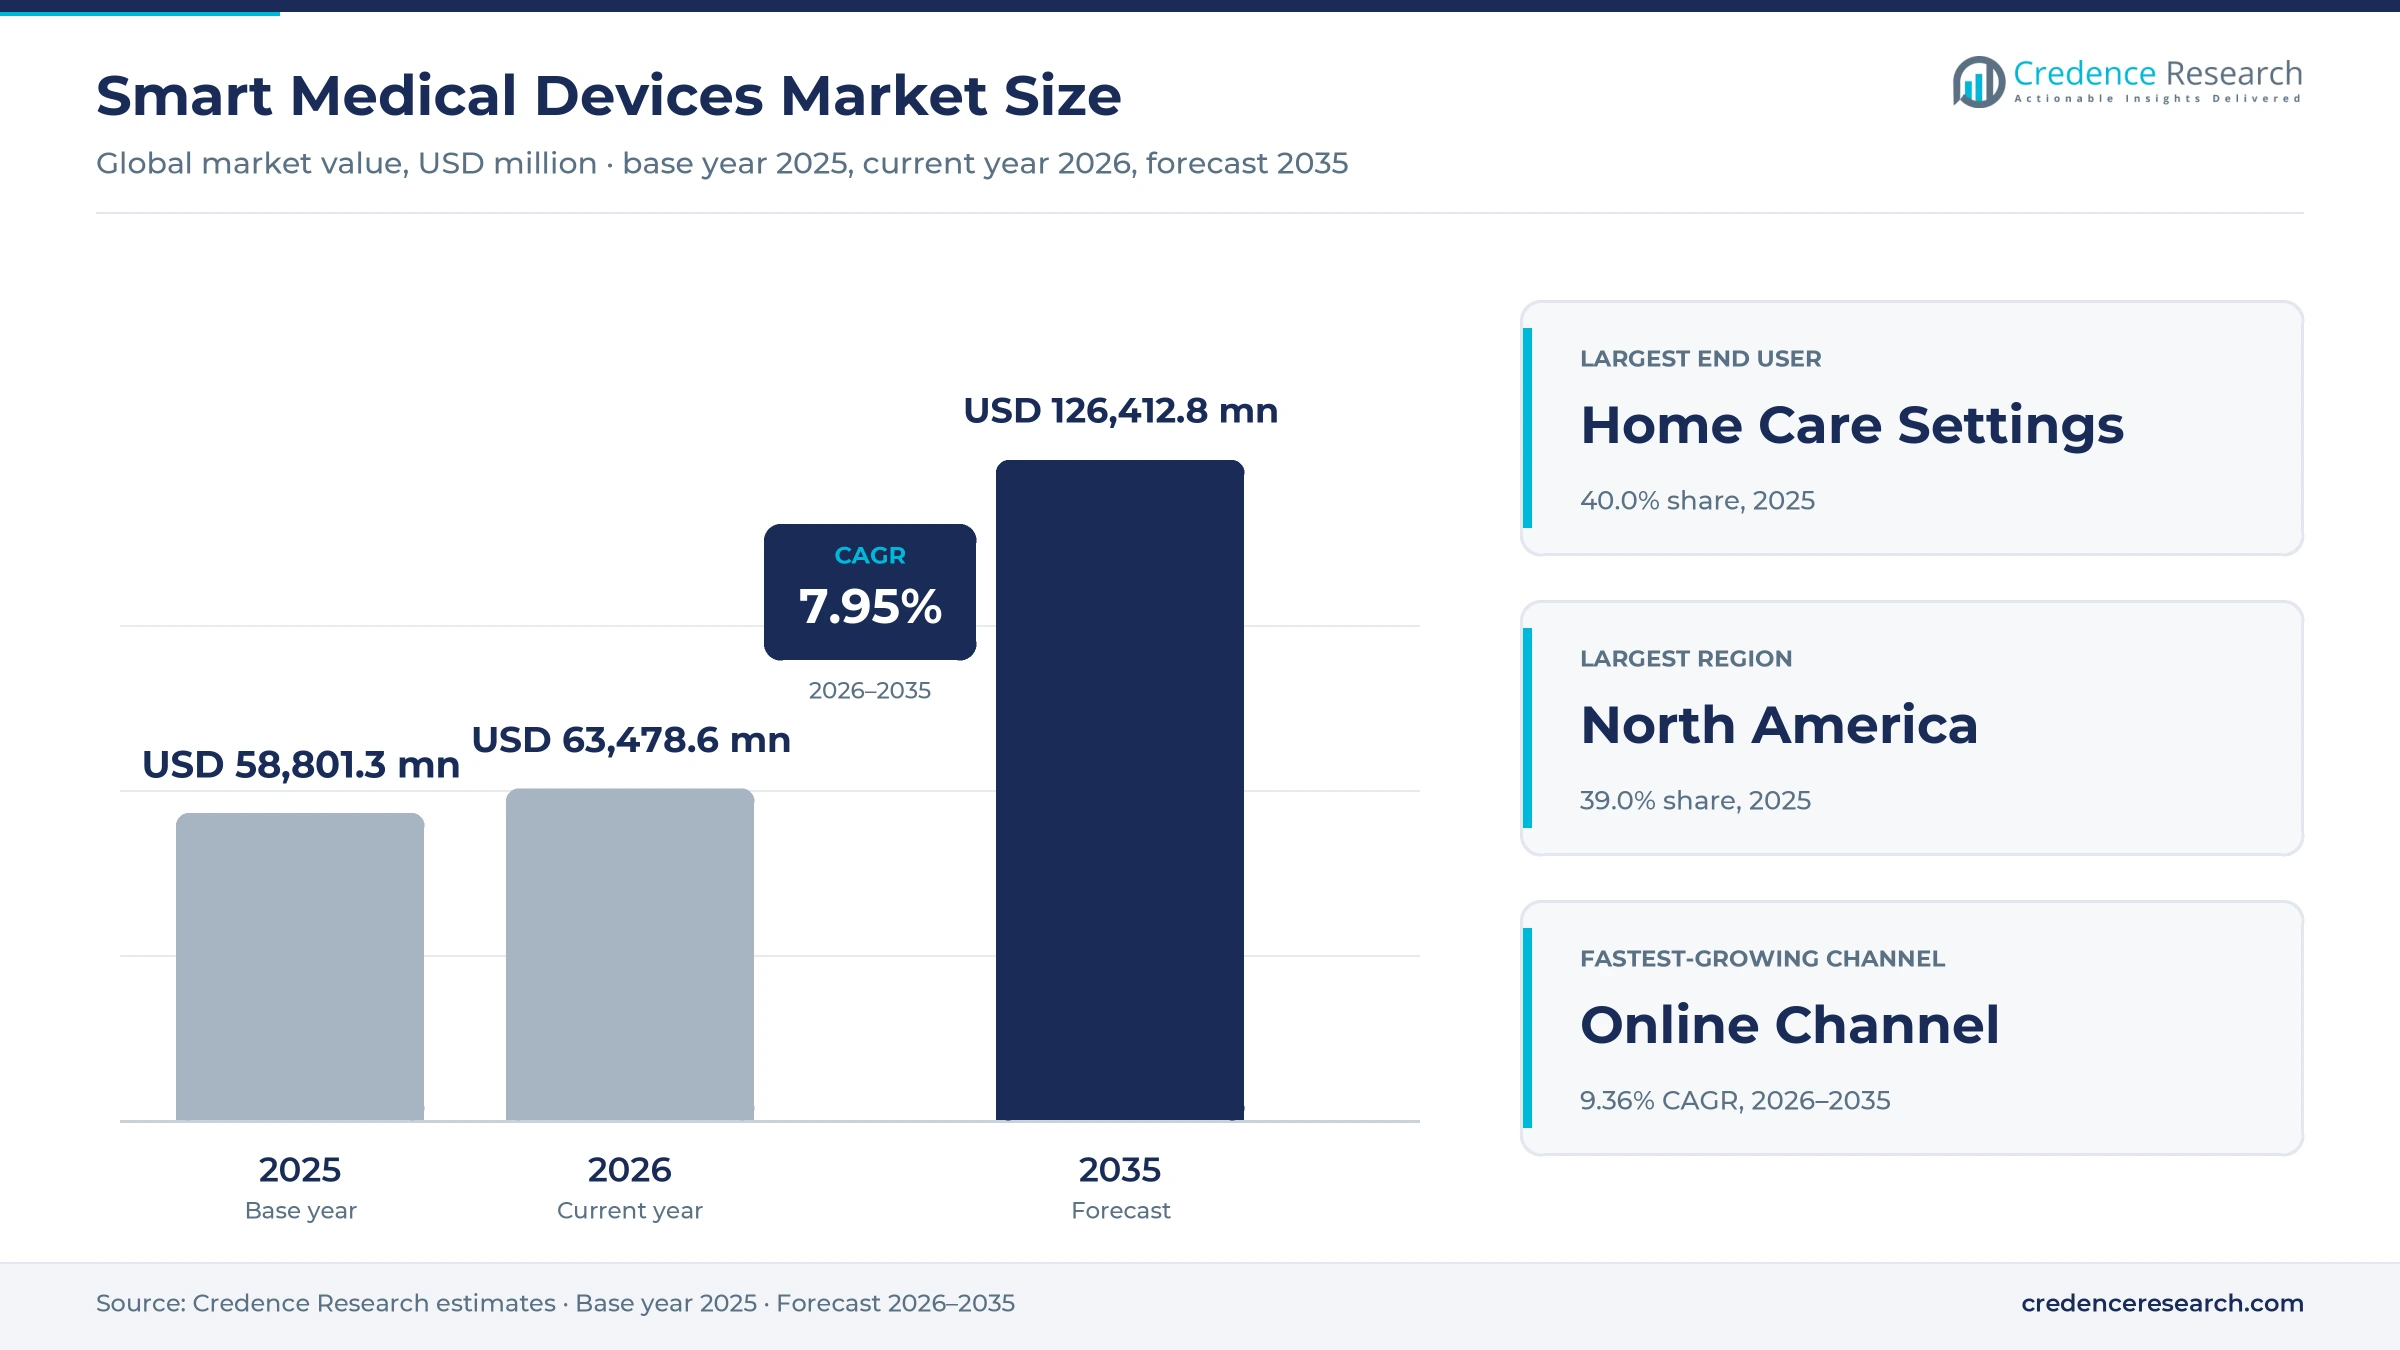
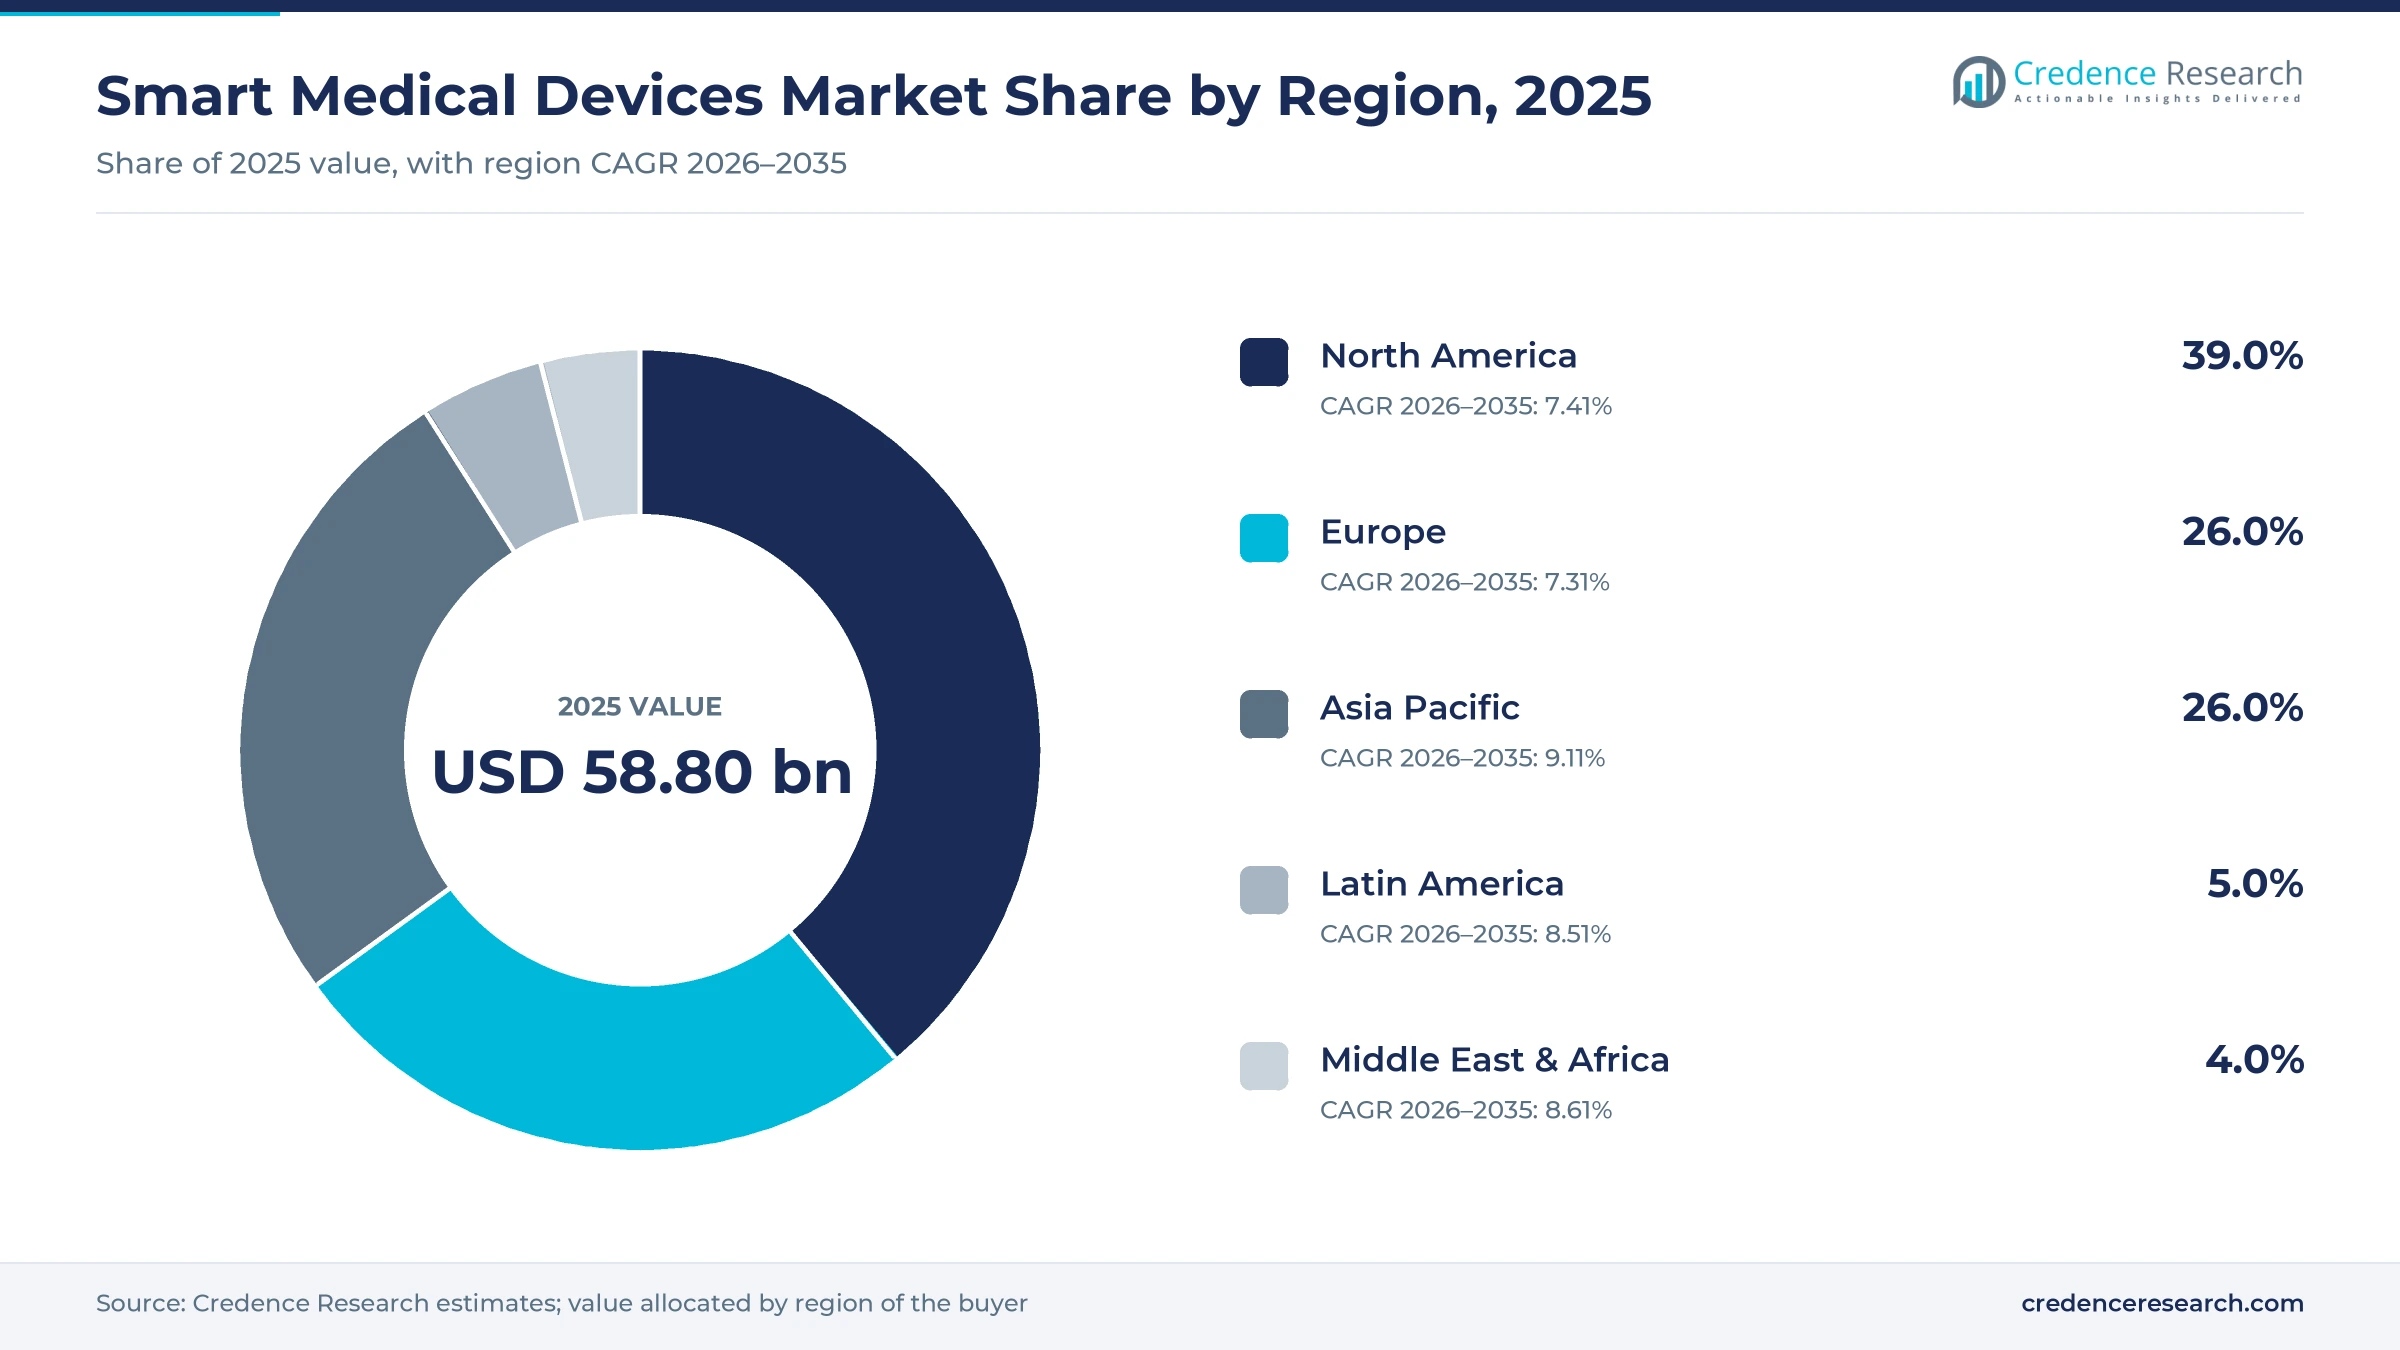
The global smart medical devices market was valued at USD 58.80 billion in 2025 and is projected to increase from USD 63.48 billion in 2026 to USD 126.41 billion by 2035, registering a CAGR of 7.95% during 2026–2035. Demand rises because diabetes, high blood pressure and hearing loss affect hundreds of millions of people who need regular readings or support outside the clinic. North America held the largest regional share, 39.0% in 2025, because U.S. payers cover continuous glucose monitors and insulin pumps, and consumers can now buy sensors without a prescription. Asia Pacific is the fastest-growing region at 9.11% a year, as China, India and Japan expand diabetes care and home health spending. The commercial model also changed in 2024, when U.S. regulators cleared the first over-the-counter continuous glucose monitors. As a result, pharmacies and online stores now sell connected sensors directly to adults who are not on insulin.
Which connected products does this analysis count?
The analysis counts connected diagnostic and monitoring products, such as glucose sensors, blood pressure monitors, pulse oximeters and cardiac wearables, plus connected therapeutic products such as insulin pumps, hearing aids and inhaler sensors. Hospitals, clinics and home users buy them through pharmacies, online stores and direct supply.
General fitness trackers without a regulated health function and stand-alone hospital imaging systems sit outside the value counted here. The value chain runs from sensor and chip design through device assembly, regulatory clearance and software platforms to distribution and reimbursement.
Smart Medical Devices Market Insights
- The smart medical devices market grows from USD 58.80 billion in 2025 to USD 126.41 billion by 2035, a 7.95% CAGR as chronic care moves into homes.
- North America held 39.0% of global value in 2025, because U.S. payers cover connected glucose sensors and insulin pumps widely.
- Home care settings led end users with 40.0% of 2025 value and grow fastest at 8.81% a year through 2035.
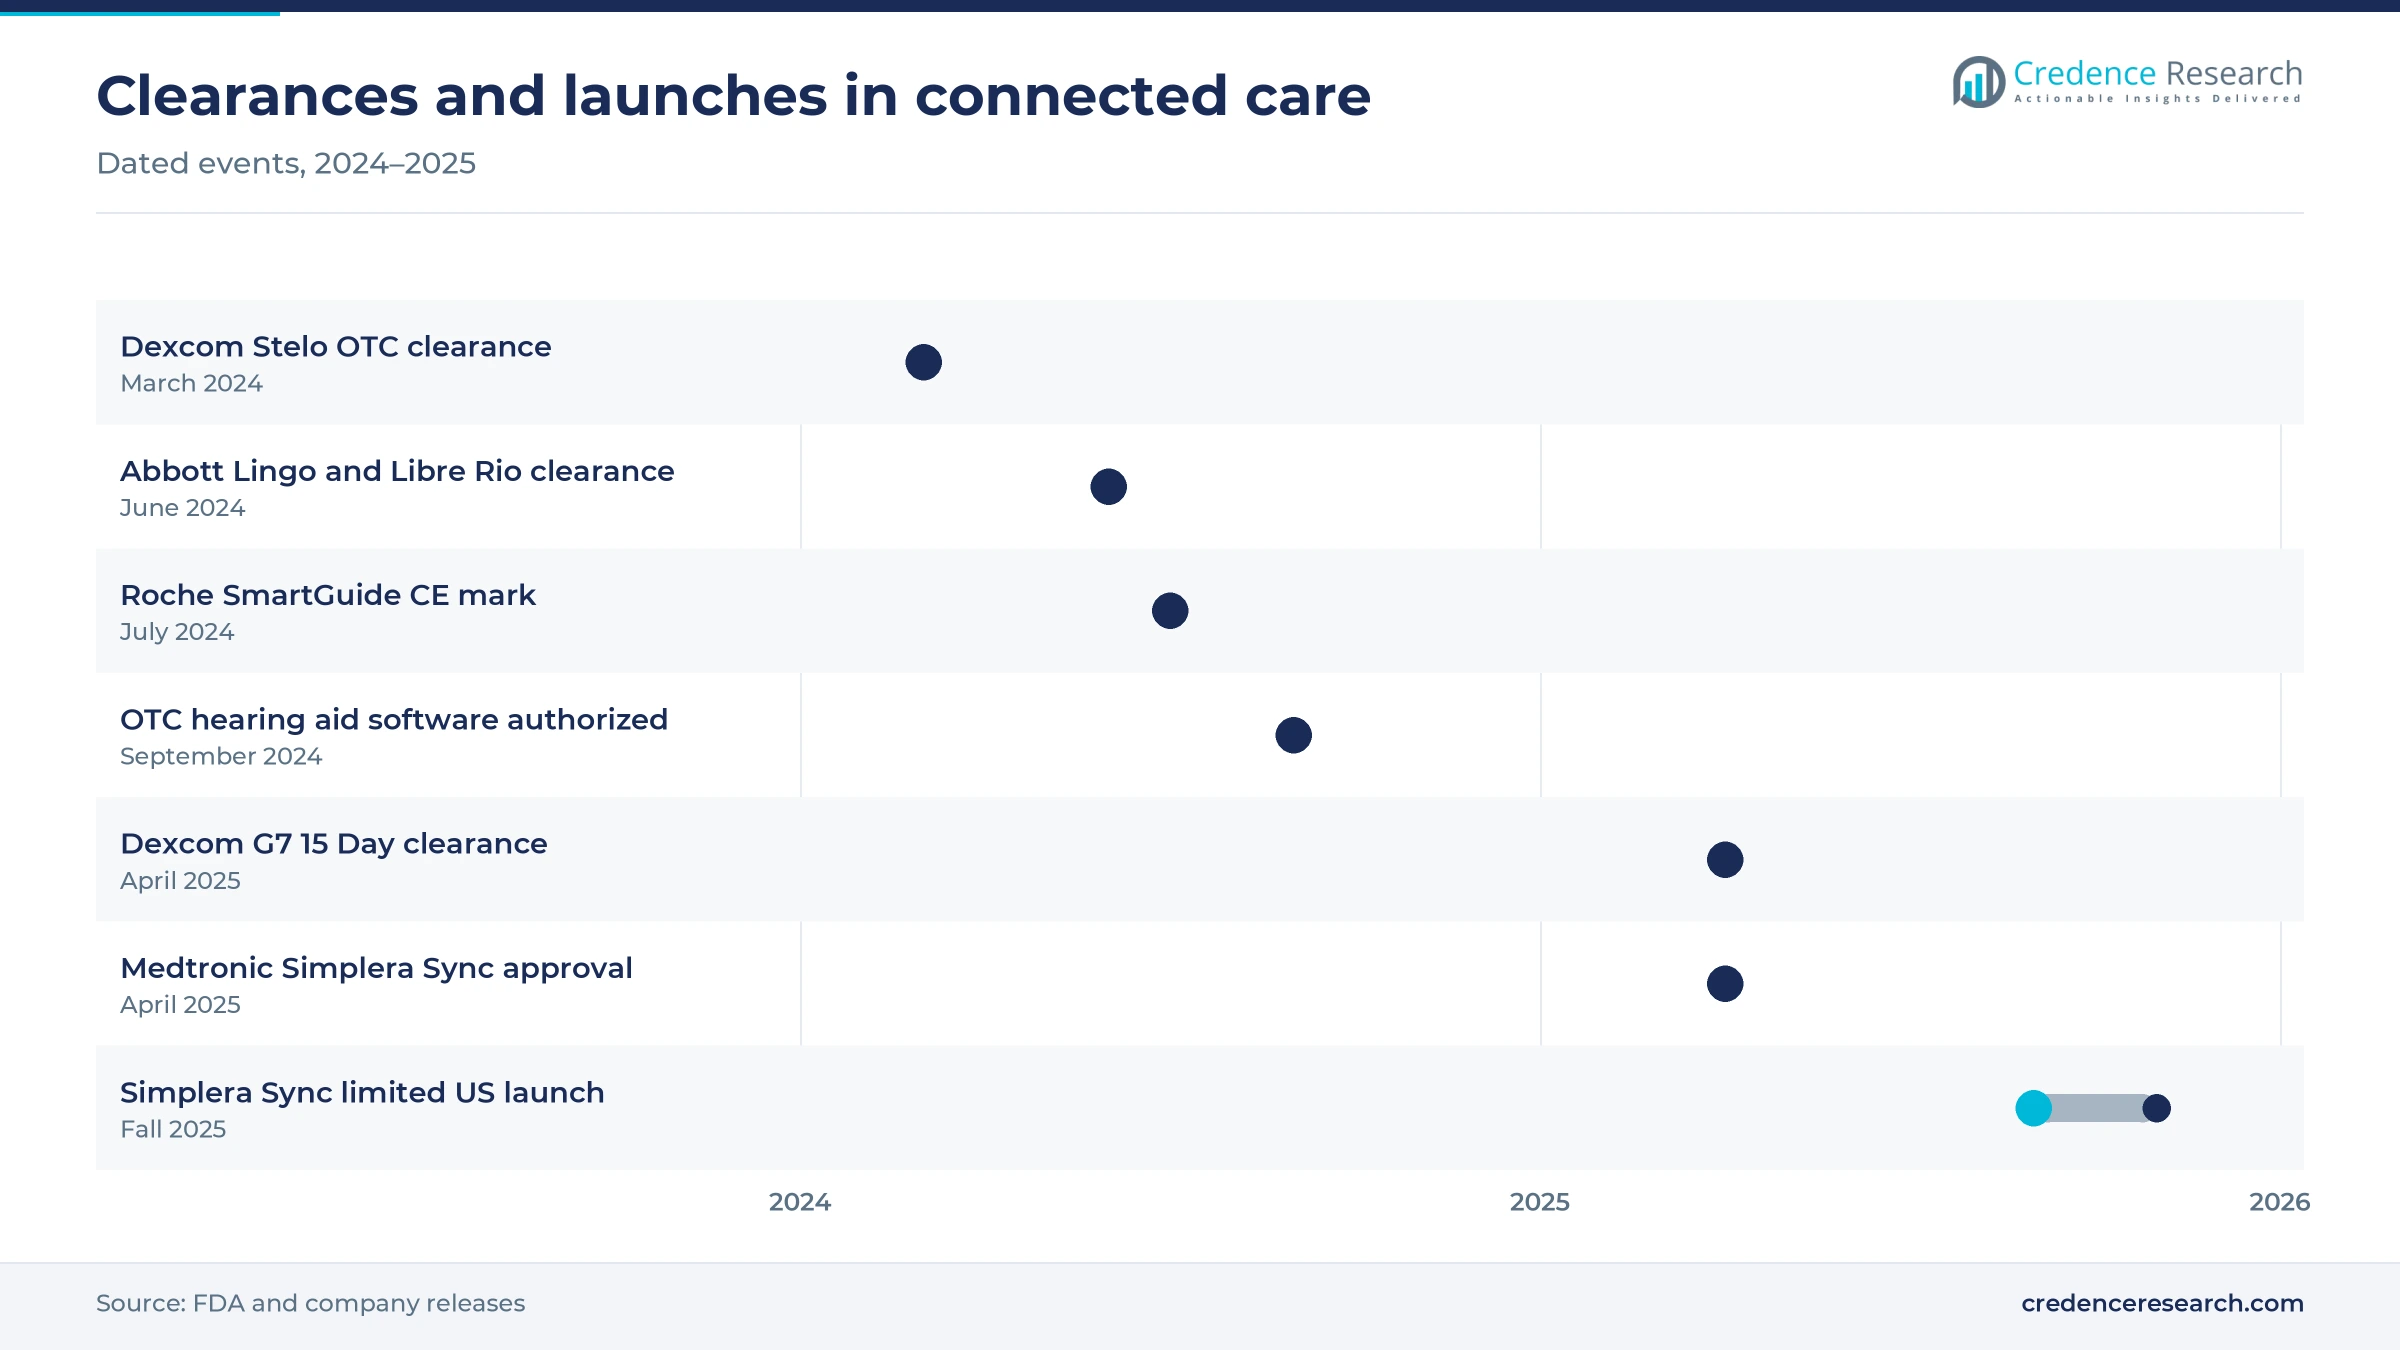
- In March 2024, the FDA cleared Dexcom Stelo as the first over-the-counter continuous glucose monitor for adults not using insulin.
- The online channel grows fastest among distribution channels at 9.36% a year through 2035, as consumers buy sensors directly.
Monitoring devices and home care lead the mix
Which product groups hold most of the value?
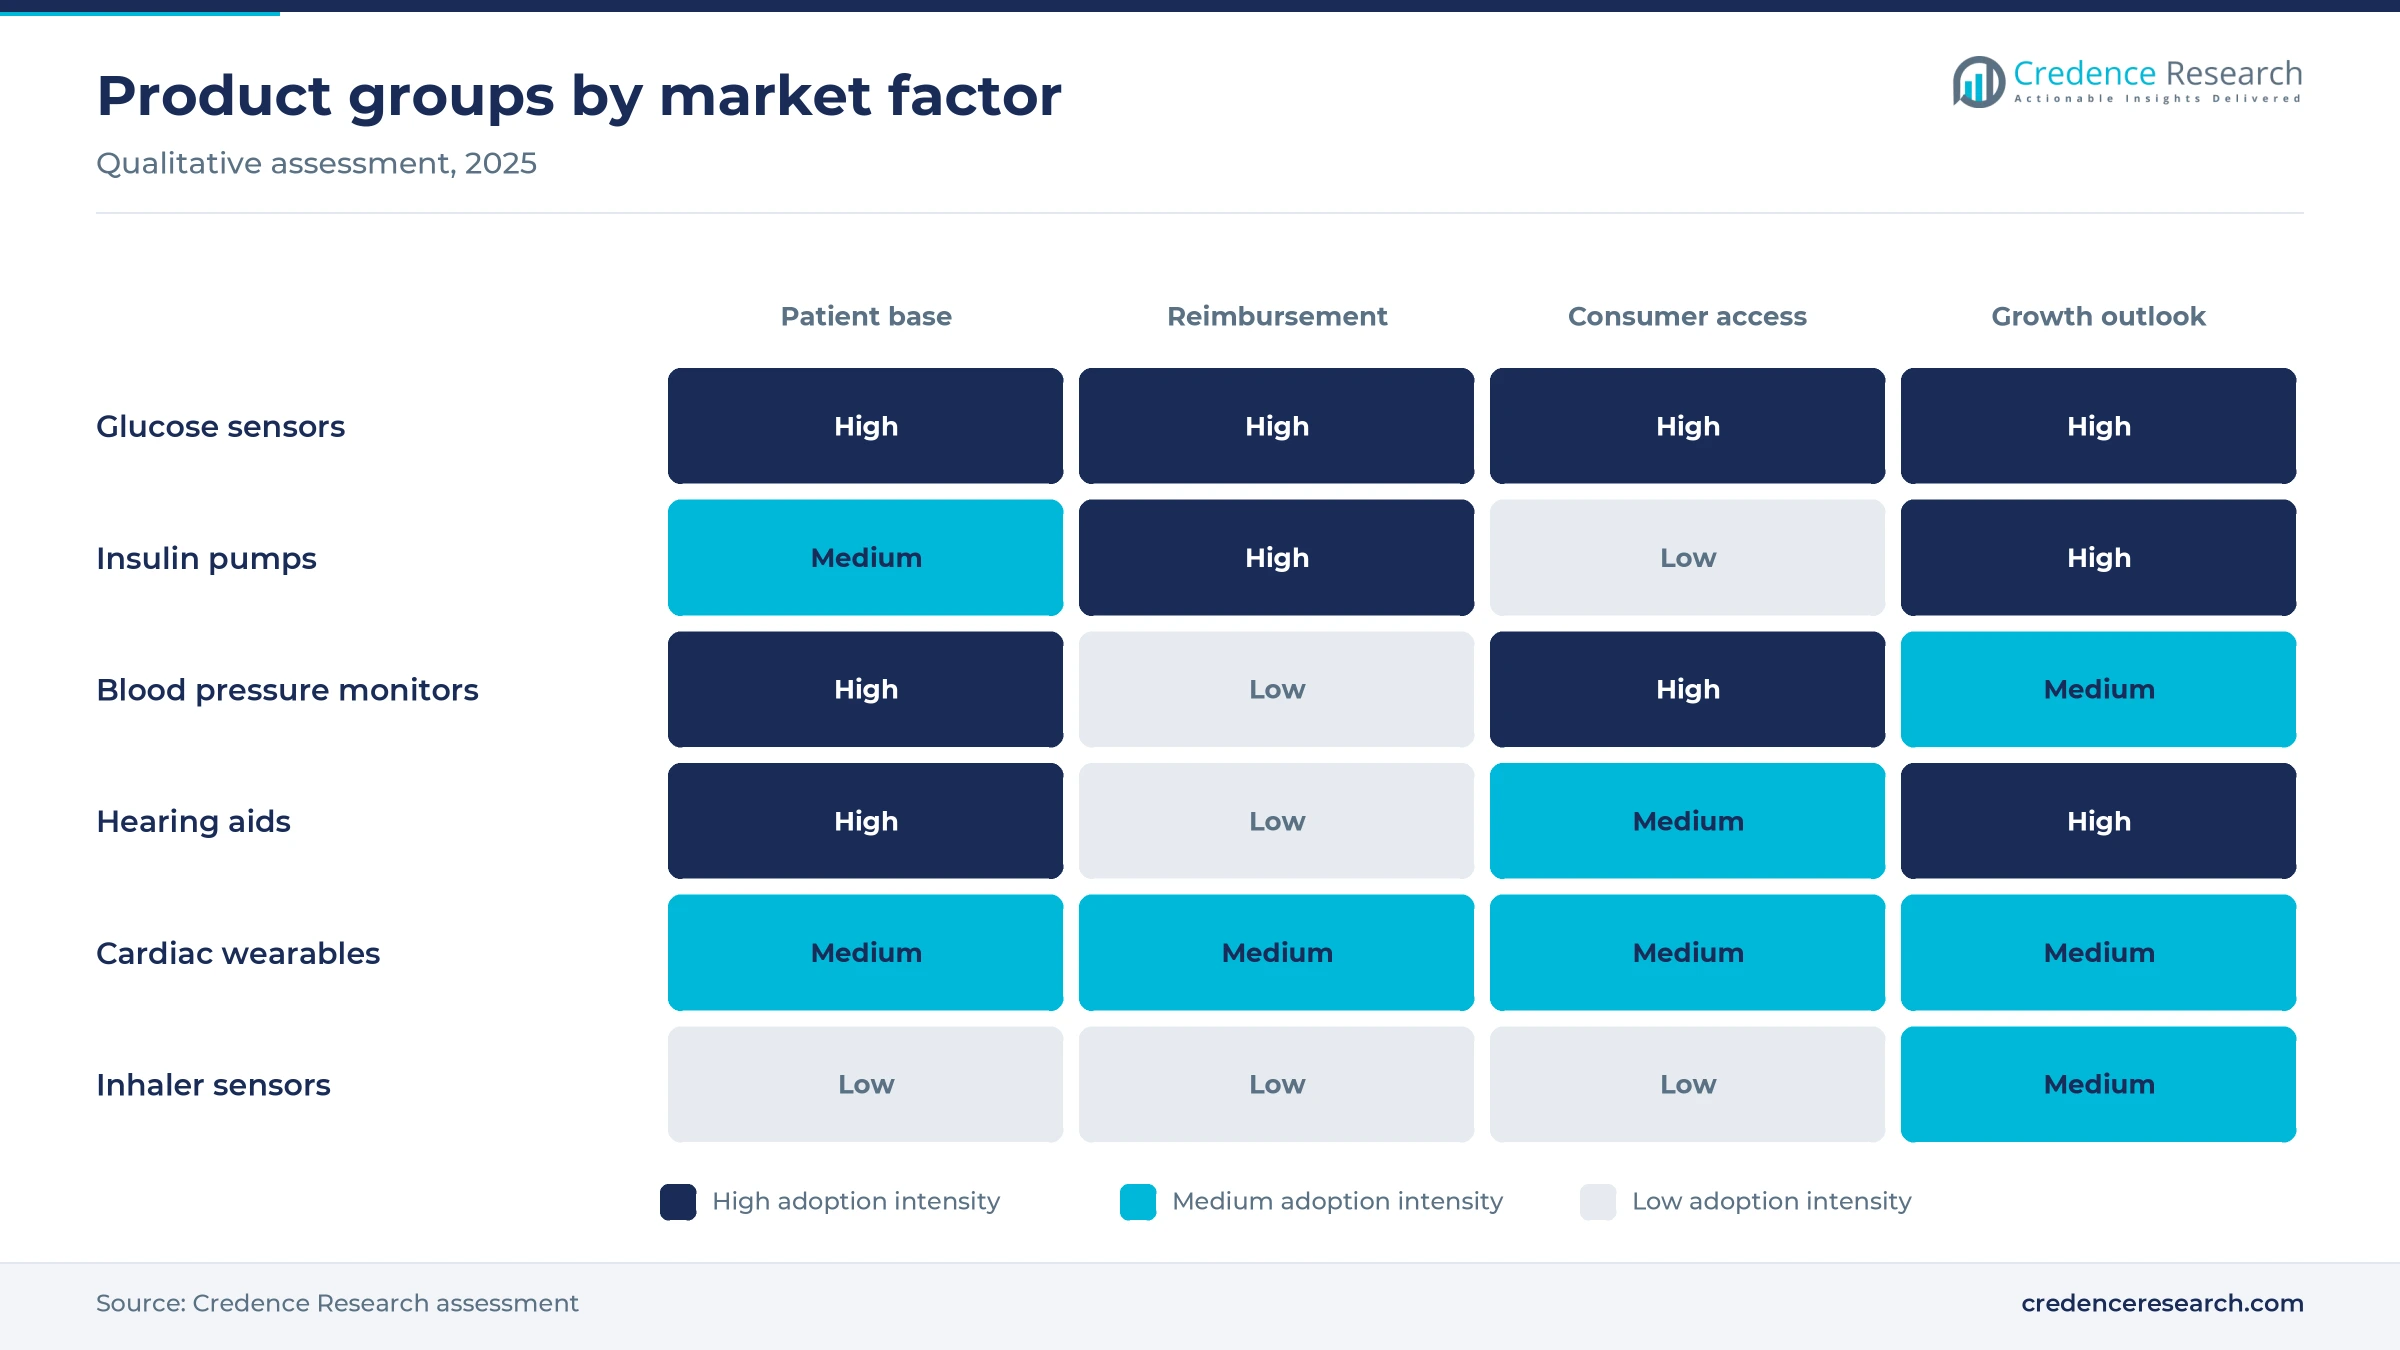
Based on indication, the market is categorized into diagnostics and monitoring devices and therapeutic devices. Diagnostics and Monitoring Devices led with 62.0% of 2025 value, because glucose sensors, blood pressure cuffs and cardiac wearables reach very large patient groups. They also grow fastest at 8.16% a year, as over-the-counter sensors widen use. Therapeutic devices include insulin pumps, connected hearing aids and inhaler sensors that support daily treatment.
Where are connected products used most?
Based on end user, the market is categorized into hospitals, ambulatory surgical centers, specialty clinics, home care settings and others. Home Care Settings led with 40.0% of 2025 value, because patients wear glucose sensors and hearing aids every day at home. They also grow fastest at 8.81% a year, as remote monitoring expands. Hospitals use connected monitors for inpatient wards and discharge programs.
How do buyers obtain these products?
Based on distribution channel, the market is categorized into pharmacies, online channel and others. Pharmacies led with 48.0% of 2025 value, because insurers reimburse glucose sensors and pump supplies through pharmacy benefits. The Online Channel grows fastest at 9.36% a year, as consumers buy over-the-counter sensors and hearing products directly. Hospital supply contracts make up most of the others group.
| Segment Group | Leading Sub-segment | Share, 2025 | Fastest-growing Sub-segment | CAGR, 2026–2035 |
|---|---|---|---|---|
| By Indication | Diagnostics and Monitoring Devices | 62.0% | Diagnostics and Monitoring Devices | 8.16% |
| By End User | Home Care Settings | 40.0% | Home Care Settings | 8.81% |
| By Distribution Channel | Pharmacies | 48.0% | Online Channel | 9.36% |
Request a Free Sample
Fill in your details and we'll send you a free sample report.
- Sample data tables & charts
- Research methodology
Diabetes, hypertension and hearing loss lift demand
How does rising diabetes prevalence lift demand?
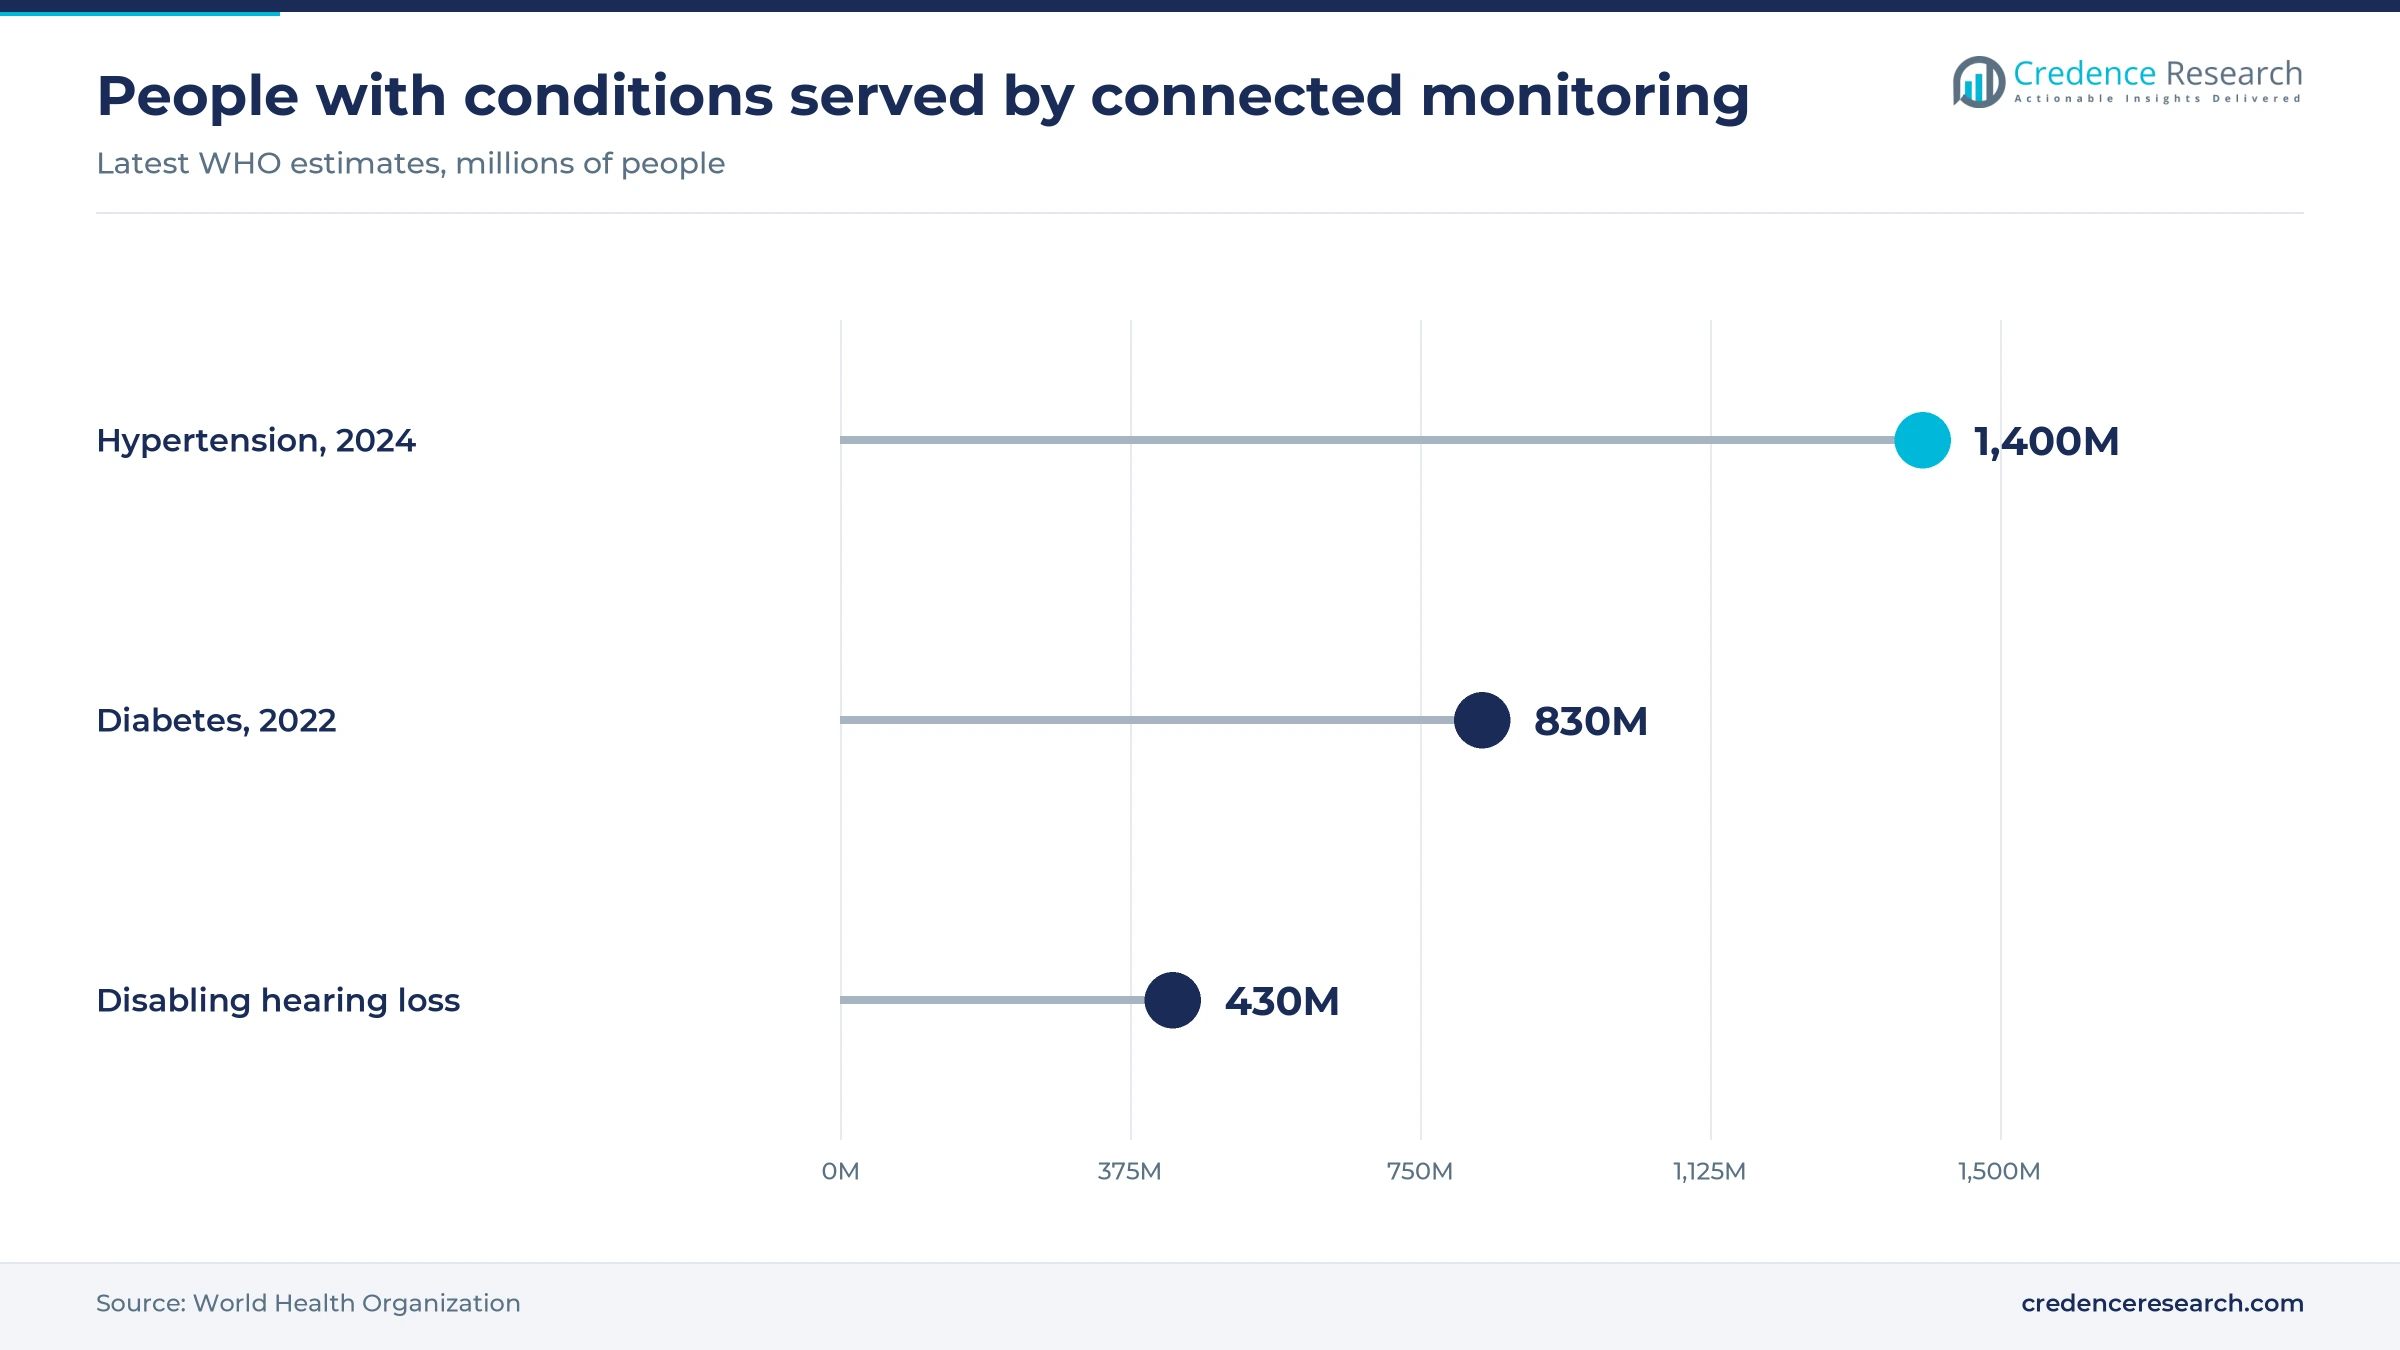
Rising diabetes prevalence is the largest demand driver, because people with diabetes need frequent glucose readings to adjust diet, medicine and insulin. The World Health Organization reports that the number of people living with diabetes rose from 200 million in 1990 to 830 million in 2022. In 2021, diabetes and related kidney disease caused more than 2 million deaths worldwide. Sensor makers are scaling up to meet this need, and Abbott says its FreeStyle Libre technology serves about 6 million people in more than 60 countries. As a result, continuous glucose monitoring anchors the leading indication, which grows at 8.16% a year.
Why does uncontrolled hypertension favor home monitoring?
Uncontrolled hypertension favors home monitoring, because blood pressure must be checked often to guide treatment and prevent strokes. The WHO estimates that 1.4 billion adults aged 30 to 79 had hypertension in 2024, about 33% of that age group. Roughly 600 million of them were unaware of their condition, and only about 320 million had it under control. Connected cuffs from companies such as Microlife and Beurer send readings to apps and clinicians between visits. Doctors can then adjust medicine without waiting for the next appointment. In turn, home blood pressure monitoring supports growth in home care settings, which held 40.0% of 2025 value.
How does hearing loss widen demand for connected aids?
Hearing loss widens demand, because most people who need hearing support still go without it, and connected aids now stream sound from phones. The WHO estimates that 430 million people need rehabilitation for disabling hearing loss today, rising to more than 700 million by 2050. In September 2024, the FDA authorized the first over-the-counter hearing aid software for compatible earbuds, intended for adults with mild to moderate hearing loss. About 30 million U.S. adults experience some degree of hearing loss. As a result, makers of hearing aids such as Demant and WS Audiology face both wider demand and new consumer competition.
Why do over-the-counter clearances open new buyers?
Over-the-counter clearances open new buyers, because adults who do not use insulin can now buy glucose sensors without a prescription. In March 2024, the FDA cleared Dexcom Stelo as the first over-the-counter continuous glucose monitor, worn for up to 15 days. In June 2024, Abbott received clearance for two more over-the-counter systems, Lingo for wellness users and Libre Rio for adults with type 2 diabetes not using insulin. Abbott notes that about 38.4 million people in the United States live with diabetes. In turn, the online channel grows at 9.36% a year as these products sell directly to consumers.
OTC sensors, longer wear and AI predictions
How is the shift to longer-wear sensors changing use?
A shift to longer-wear sensors is changing use, because fewer replacements lower cost and improve comfort for daily wearers. In April 2025, the FDA cleared the Dexcom G7 15 Day system for adults with type 1 or type 2 diabetes. The sensor lasts up to 15 days plus a 12-hour grace period, for about 15.5 days in total. Its mean absolute relative difference was 8%, compared with 8.2% for the earlier G7. Roche's Accu-Chek SmartGuide sensor, which gained a CE mark in July 2024, also offers 14 days of wear. As a result, diagnostics and monitoring devices held 62.0% of 2025 value.
Is the rise of AI prediction moving care from reaction to prevention?
A rise in AI prediction is moving care from reaction to prevention, because algorithms can warn patients before a dangerous event occurs. In July 2024, Roche announced a CE mark for its Accu-Chek SmartGuide system, which predicts hypoglycemia risk within the next 30 minutes. The system also estimates the risk of low glucose overnight, when patients cannot react on their own. The FDA's list of AI-enabled devices reached 1,247 products as of July 10, 2025, showing how widely regulators now clear such software. In turn, makers that pair sensors with predictive apps gain an edge in home care, which grows at 8.81% a year.
Where can connected insulin delivery open new demand?
Connected insulin delivery offers a clear opening, because linking sensors to pumps lets algorithms adjust doses automatically. In April 2025, Medtronic announced FDA approval of its Simplera Sync sensor for the MiniMed 780G system. The disposable, all-in-one sensor was tested in a study of 243 participants, who reported it was smaller and lighter than other sensors. Medtronic planned a limited U.S. launch of the sensor in fall 2025. Dexcom is also working with pump partners to connect the G7 15 Day with automated insulin delivery. As a result, insulin pumps gain value as connected therapy spreads across North America and Europe.
Can remote monitoring programs expand beyond diabetes?
Remote monitoring programs offer an opening, because hospitals want to discharge patients sooner while still tracking their recovery. Hypertension affects 1.4 billion adults, and only about 23% have it under control, so home readings fill a large gap. Hearing loss affects 430 million people who need rehabilitation, and over-the-counter hearing software now reaches them through consumer earbuds. Specialists such as Masimo, Smartcardia and Adherium link oxygen, cardiac and inhaler data to clinicians. In turn, remote patient monitoring services widen device demand, while hospitals across Asia Pacific add new home programs for chronic patients. Payers also favor these programs when they cut readmissions and shorten hospital stays.
Cybersecurity, reimbursement and data accuracy limits
How do cybersecurity risks slow hospital adoption?
Cybersecurity risks slow hospital adoption, because every connected product adds a possible entry point to clinical networks. Regulators now expect makers to document security controls and patch plans before clearance. Hospitals must also test each product against their own systems before deployment. As a result, procurement cycles lengthen and smaller suppliers face higher costs to prove their products are secure and maintainable. Makers also need to support software updates for many years after launch.
Why does uneven reimbursement limit access?
Uneven reimbursement limits access, because many insurers cover glucose sensors only for patients who use insulin. Over-the-counter sensors help, but buyers then pay the full price themselves each month. Coverage for connected hearing aids and blood pressure monitors varies widely between countries and plans. In turn, uptake stays lower among older and lower-income patients who would benefit most from regular readings. Clear evidence of fewer emergencies and hospital stays could persuade more payers to widen coverage.
How do accuracy concerns affect trust?
Accuracy concerns affect trust, because doctors act on sensor readings when they adjust insulin or blood pressure medicine. Consumer-grade products may not meet the same accuracy standards as prescription devices. Readings can also drift with poor placement, skin contact or low battery. As a result, clinicians often ask for confirmation with a standard test before changing treatment, which slows the shift to fully remote care. Published accuracy data, such as Dexcom's 8% figure, help build confidence.
Why does data overload strain care teams?
Data overload strains care teams, because continuous sensors produce thousands of readings for each patient every month. Clinics often lack staff to review this information and respond to alerts quickly. Without good triage software, important warnings can be missed among routine data. However, AI tools that flag only urgent changes are helping hospitals and clinics manage larger patient groups with the same staff. Remote monitoring services also take on part of this review work for busy clinics.
North America leads value as Asia Pacific grows fastest
| Region | Value, 2025 (USD billion) | Share, 2025 | CAGR, 2026–2035 |
|---|---|---|---|
| North America | 22.93 | 39.0% | 7.41% |
| Europe | 15.29 | 26.0% | 7.31% |
| Asia Pacific | 15.29 | 26.0% | 9.11% |
| Latin America | 2.94 | 5.0% | 8.51% |
| Middle East & Africa | 2.35 | 4.0% | 8.61% |
Why does North America hold the largest regional share?
North America held a 39.0% share of 2025 value and grows at 7.41% a year through 2035. The United States cleared the first over-the-counter glucose sensors in 2024 and the first over-the-counter hearing aid software later that year. Insurers and Medicare cover sensors and insulin pumps for many patients. Dexcom, Abbott and Medtronic lead connected diabetes care across the region. Canada adds demand through provincial programs that fund glucose sensors for many patients with diabetes.
How fast is Asia Pacific adding users?
Asia Pacific held a 26.0% share of 2025 value and is the fastest-growing region at 9.11% a year. China and India have the largest diabetes populations in the world, and both are expanding home health services. Local makers such as Shenzhen Ztsense supply lower-cost connected products. Japan adds demand through its aging population and strong uptake of hearing support. Australia and South Korea add demand through strong digital health programs and wide smartphone use.
What shapes demand across Europe?
Europe held a 26.0% share of 2025 value and grows at 7.31% a year through 2035. CE marking allowed Roche to introduce its AI-enabled SmartGuide sensor in 2024. National health systems in Germany, France and the United Kingdom reimburse glucose sensors for many patients with diabetes. However, slower purchasing cycles in public hospitals keep regional growth below the global pace. Medical device regulation in the European Union also raises the cost of bringing new products to market.
Where is Latin America adding demand?
Latin America held a 5.0% share of 2025 value and grows at 8.51% a year through 2035. Brazil and Mexico lead regional demand, with private patients buying glucose sensors and blood pressure monitors through pharmacies and online stores.
What limits growth in the Middle East and Africa?
The Middle East and Africa held a 4.0% share of 2025 value and grows at 8.61% a year through 2035. Gulf states fund digital hospitals and diabetes programs, while much of Africa still lacks reimbursement for connected home products.
Clearances and launches in glucose care since 2024
| Development | Status and market relevance |
|---|---|
| In March 2024, the FDA cleared Dexcom Stelo as the first over-the-counter continuous glucose monitor. | Cleared; adults not using insulin |
| In June 2024, Abbott received FDA clearance for its Lingo and Libre Rio over-the-counter glucose systems. | Cleared; wellness and type 2 diabetes users |
| In July 2024, Roche announced a CE mark for its AI-enabled Accu-Chek SmartGuide glucose system. | CE marked; predicts low glucose within 30 minutes |
| In April 2025, the FDA cleared the Dexcom G7 15 Day system for adults with diabetes. | Cleared; launch in second half of 2025 |
| In April 2025, Medtronic announced FDA approval of its Simplera Sync sensor for the MiniMed 780G system. | Approved; limited U.S. launch in fall 2025 |
Sensors, algorithms and links changing patient care
- Continuous glucose sensors measure glucose every few minutes through a small filament under the skin, which removes most fingerstick tests.
- Predictive algorithms forecast low glucose or other risks before they happen, which lets patients act earlier and avoid emergencies.
- Automated insulin delivery links sensors with pumps so that software adjusts doses, which reduces the daily burden on people with diabetes.
- Self-fitting hearing software lets adults tune hearing support on consumer earbuds, which lowers the cost of first treatment.
- Bluetooth and cloud links send readings from cuffs, oximeters and inhaler sensors to apps and clinicians, which supports remote monitoring programs.
Need a Custom Version of This Report?
Tailor the scope, geography, or segments to your exact requirements.
- Custom geography or segment scope
- Direct access to our analyst team
Diabetes and hearing specialists compete on platforms
Competition in the market centers on diabetes specialists, hearing companies and monitoring makers that build complete platforms of sensors, apps and data services. Abbott, Dexcom, Medtronic and Roche compete on sensor accuracy, wear time and links with insulin pumps, and all four gained new clearances or marks in 2024 or 2025. LifeScan and ARKRAY supply connected glucose meters for patients who still use fingerstick testing. Demant and WS Audiology compete on connected hearing aids, while consumer electronics brands now offer over-the-counter hearing software. Masimo and Drägerwerk supply connected monitoring for hospitals, and Microlife and Beurer sell home blood pressure cuffs. Smaller firms such as Smartcardia, Adherium, Sensoria and Shenzhen Ztsense focus on wearable patches, inhaler sensors and low-cost products. However, payer coverage and clinical evidence still decide which platforms win large contracts.
Companies profiled and their roles in this market
| Company | Type | Role in the market |
|---|---|---|
| Abbott Laboratories | Diabetes care | FreeStyle Libre, Lingo and Libre Rio glucose sensors |
| Dexcom, Inc. | Diabetes care | G7, G7 15 Day and Stelo glucose sensors |
| Medtronic plc | Diabetes and therapy | MiniMed 780G insulin pump and Simplera Sync sensor |
| F. Hoffmann-La Roche Ltd | Diabetes care | Accu-Chek SmartGuide AI-enabled glucose sensor |
| Masimo | Patient monitoring | Connected monitoring for hospital and home use |
| Drägerwerk AG & Co. KGaA | Acute care | Connected monitoring and therapy for hospitals |
| LifeScan, Inc. | Diabetes care | Connected blood glucose meters |
| ARKRAY, Inc | Diabetes care | Blood glucose meters and diagnostic products |
| Microlife Corporation | Home monitoring | Connected blood pressure monitors |
| Beurer GmbH | Home monitoring | Connected blood pressure and health products |
| Demant A/S | Hearing care | Connected hearing aids |
| WS Audiology | Hearing care | Connected hearing aids |
| Adherium | Respiratory | Connected inhaler sensors |
| Smartcardia | Cardiac monitoring | Wearable vital sign patches |
Home monitoring carries growth through 2035
Credence Research's view is that home monitoring, rather than hospital equipment, will carry most growth through 2035. The market grows at 7.95% a year as diabetes, hypertension and hearing loss add patients who need regular readings. Over-the-counter clearances and longer-wear sensors widen the buyer base, while AI prediction raises the clinical value of each reading. The strongest openings sit in connected insulin delivery, remote monitoring programs and online sales, while reimbursement gaps and cybersecurity rules remain the main brakes.
How Credence Research built the connected care model
The report uses 2025 as the base year and 2026 to 2035 as the forecast period. Market values come from the Credence Research model, which builds spending by indication, end user and distribution channel. Regional and segment splits are Credence Research estimates informed by World Health Organization statistics, FDA clearance information, company releases and medical trade press. No primary interviews or surveys were used in preparing this edition of the report.
Connected monitoring and therapy outlook to 2035
By 2035, the smart medical devices market is projected to reach USD 126.41 billion, with growth led by Asia Pacific, home care and online sales. Glucose sensors will remain the core product as diabetes keeps rising worldwide. Connected insulin delivery, home blood pressure programs and self-fitting hearing support will add new users each year. North America keeps the highest spending per patient, while Asia Pacific adds the most new users over the decade. Makers that combine accurate sensors, predictive software and broad payer coverage will gain the most share.
Frequently Asked Questions
How big is the global smart medical devices market?
Which region leads the smart medical devices market?
Which indication leads the market?
Which end user holds the largest share?
What are over-the-counter glucose monitors?
How fast is the online channel growing?
Who are the leading smart medical devices companies?
How many people could use connected glucose sensors?
Table of Content
Chapter 1 Market Segmentation
- 1.1 Segmentation Framework
- 1.1.1 Product and Service Classification
- 1.1.2 Application and End-Use Classification
- 1.1.3 Technology and Solution Classification
- 1.1.4 Customer and Distribution Channel Classification
- 1.1.5 Geographic Segmentation
- 1.1.6 Market Segment Definitions and Boundaries
- 1.2 By Indication
- 1.2.1 Diagnostics and Monitoring Devices
- 1.2.2 Therapeutic Devices
- 1.3 By End User
- 1.3.1 Hospitals
- 1.3.2 Ambulatory Surgical Centers
- 1.3.3 Specialty Clinics
- 1.3.4 Home Care Settings
- 1.3.5 Others
Chapter 2 Introduction
- 2.1 Report Objectives and Scope
- 2.2 Product Definition and Industry Terminology
- 2.3 Market Inclusions and Exclusions
- 2.4 Research Process
- 2.4.1 Primary Research and Expert Interviews
- 2.4.2 Secondary Research and Source Review
- 2.4.3 Top-Down and Bottom-Up Estimation
- 2.4.4 Data Triangulation and Verification
- 2.5 Market Size Measurement Basis
- 2.5.1 2025: USD 58.80 billion → 2035: USD 126.41 billion
- 2.6 Historical and Forecast Reference Periods
- 2.6.1 Historical Period: 2018-2025
- 2.6.2 Base Year: 2025
- 2.6.3 Forecast Period: 2025-2035
- 2.7 Research Assumptions and Limitations
Chapter 3 Executive Summary
- 3.1 Market Snapshot and Key Findings
- 3.2 Base-Year Market Size, 2025
- 3.3 Forecast Market Size, 2035
- 3.4 Revenue and Volume Growth Outlook
- 3.5 Key Demand and Supply Indicators
- 3.6 Leading Market Segments
- 3.7 Fastest-Growing Market Opportunities
- 3.8 Regional Performance Highlights
- 3.9 Technology and Industry Transformation
- 3.10 Competitive Landscape Summary
- 3.11 Analyst View and Strategic Implications
Chapter 4 Global Smart Medical Devices Market Trends and Developments
- 4.1 Historical Industry Development, 2018-2025
- 4.2 Recent Market Trends and Developments
- 4.3 Demand and Customer Behavior Trends
- 4.4 Technology and Product Innovation
- 4.5 Artificial Intelligence, Automation and Digitalization
- 4.6 Local Manufacturing and Supply Chain Realignment
- 4.7 Industry Partnerships, Mergers and Acquisitions
- 4.8 Sustainability and Circular Economy Developments
- 4.9 Government and Private Sector Investment Trends
- 4.10 Emerging Business Models and Commercialization
- 4.11 Industry Developments and Announcements
Chapter 5 Global Smart Medical Devices Market Production, Supply and Demand Analysis
- 5.1 Demand Trend and Consumption Analysis, 2018-2025
- 5.2 Demand Forecast, 2025-2035
- 5.3 Production and Output Trend, 2018-2025
- 5.4 Production and Output Forecast, 2025-2035
- 5.5 Installed Capacity and Capacity Utilization
- 5.6 Company-Wise Production Plants and Statistics
- 5.6.1 Installed Production Capacity
- 5.6.2 Actual Production
- 5.6.3 Planned Capacity and Expansion Targets
- 5.7 Supply Chain Structure and Procurement Trends
- 5.8 Supply-Demand Gap and Bottlenecks
- 5.9 Import Dependence and Sourcing Structure
- 5.10 Contract Manufacturing and Outsourcing
- 5.11 Regional Supply and Demand Concentration
Chapter 6 Global Smart Medical Devices Market Pricing Analysis
- 6.1 Pricing Structure and Measurement
- 6.2 Historical Pricing Trends, 2018-2025
- 6.3 Pricing Outlook, 2025-2035
- 6.4 Average Selling Price and Unit Economics
- 6.5 Pricing by Product and Market Segment
- 6.6 Geographic Pricing Differences
- 6.7 Key Input, Energy, Labor and Logistics Costs
- 6.8 Contract Pricing and Purchasing Models
- 6.9 Pricing Sensitivity and Competitive Positioning
- 6.10 Price, Margin and Profitability Implications
Chapter 7 Global Smart Medical Devices Market Dynamics
- 7.1 Market Growth Drivers
- 7.1.1 Demand-Side Drivers
- 7.1.2 Technology and Innovation Drivers
- 7.1.3 Infrastructure and Investment Drivers
- 7.1.4 Regulatory and Policy Drivers
- 7.2 Market Restraints
- 7.2.1 Cost and Affordability Constraints
- 7.2.2 Technology and Adoption Barriers
- 7.2.3 Supply Chain and Operational Constraints
- 7.3 Market Challenges
- 7.3.1 Competitive Pressure and Margin Erosion
- 7.3.2 Skills, Infrastructure and Implementation Gaps
- 7.4 Emerging Market Opportunities
- 7.5 Market Dynamics Impact and Time-Horizon Assessment
Chapter 8 Global Smart Medical Devices Value Chain Analysis
- 8.1 Industry Value Chain Overview
- 8.2 Upstream Suppliers and Critical Inputs
- 8.3 Technology and Component Providers
- 8.4 Manufacturing or Service Delivery
- 8.5 Distribution, Channel Partners and Integrators
- 8.6 Downstream Applications and End Users
- 8.7 Value Addition and Profit Pools
- 8.8 Vertical Integration and Outsourcing
- 8.9 Supplier Concentration and Risk
- 8.10 Supply Chain Localization and Resilience
Chapter 9 Global Smart Medical Devices Market Regulations and Policies
- 9.1 Relevant Laws, Standards and Compliance Frameworks
- 9.2 Product, Service, Safety and Quality Requirements
- 9.3 Government Policies, Incentives and Subsidies
- 9.4 Imports, Exports and Trade Barriers
- 9.5 Public Procurement and Local Content Requirements
- 9.6 Environmental and Sustainability Compliance
- 9.7 Upcoming Policy Changes and Market Implications
Chapter 10 Global Smart Medical Devices Market Hotspots and Opportunities
- 10.1 Market Opportunity Mapping and Growth Hotspots
- 10.2 High-Growth Applications and Customer Groups
- 10.3 Underserved Markets and White-Space Opportunities
- 10.4 Emerging Technology and Product Opportunities
- 10.5 New Capacity and Investment Hotspots
- 10.6 Market Entry and Expansion Opportunities
- 10.7 Distribution and Partnership Opportunities
- 10.8 Near-Term and Long-Term Commercial Potential
- 10.9 Opportunity Attractiveness and Execution Risks
Chapter 11 Global Smart Medical Devices Market Outlook, 2025-2035
- 11.1 Market Size and Analysis
- 11.1.1 Revenue (Market Measurement: 2025: USD 58.80 billion → 2035: USD 126.41 billion)
- 11.1.2 Market Volume and Quantity Sold
- 11.1.3 Historical Market Size, 2018-2025
- 11.1.4 Base-Year Market Size, 2025
- 11.2 Market Forecast, 2025-2035
- 11.2.1 Revenue Forecast to 2035
- 11.2.2 Volume Forecast to 2035
- 11.2.3 CAGR and Year-on-Year Growth
- 11.2.4 Incremental Revenue Opportunity
- 11.3 Forecast Assumptions and Scenario Analysis
- 11.3.1 Base-Case Forecast
- 11.3.2 Optimistic and Conservative Scenarios
- 11.3.3 Technology, Pricing and Policy Sensitivities
- 11.4 Market Attractiveness and Growth Outlook
Chapter 12 Global Smart Medical Devices Market Segmentation and Outlook
- 12.1 Segmentation Summary and Market Shares, 2025
- 12.2 Largest and Fastest-Growing Segments
- 12.3 By Indication - Market Size and Forecast, 2025-2035
- 12.3.1 Segment Definition and Scope
- 12.3.2 Historical Market Size, 2018-2025
- 12.3.3 Revenue Forecast, 2025-2035
- 12.3.4 Volume Forecast, 2025-2035
- 12.3.5 Base-Year Market Share, 2025
- 12.3.6 Segment CAGR and Growth Drivers
- 12.3.7 Subsegment Market Size and Forecast
- 12.3.7.1 Diagnostics and Monitoring Devices
- 12.3.7.2 Therapeutic Devices
- 12.3.8 Subsegment Pricing and Adoption Trends
- 12.3.9 Leading Suppliers and Competition
- 12.3.10 Regional Demand and Opportunities
- 12.4 By End User - Market Size and Forecast, 2025-2035
- 12.4.1 Segment Definition and Scope
- 12.4.2 Historical Market Size, 2018-2025
- 12.4.3 Revenue Forecast, 2025-2035
- 12.4.4 Volume Forecast, 2025-2035
- 12.4.5 Base-Year Market Share, 2025
- 12.4.6 Segment CAGR and Growth Drivers
- 12.4.7 Subsegment Market Size and Forecast
- 12.4.7.1 Hospitals
- 12.4.7.2 Ambulatory Surgical Centers
- 12.4.7.3 Specialty Clinics
- 12.4.7.4 Home Care Settings
- 12.4.7.5 Others
- 12.4.8 Subsegment Pricing and Adoption Trends
- 12.4.9 Leading Suppliers and Competition
- 12.4.10 Regional Demand and Opportunities
- 12.5 Segment Growth Comparison
- 12.6 Segment Attractiveness and Priority Matrix
Chapter 13 Global Smart Medical Devices End-Use and Application Market Outlook
- 13.1 End-Use Industry and Customer Demand Structure
- 13.2 Leading Applications and Customer Groups
- 13.3 End-Use Market Size, Share and Forecast
- 13.4 Major End-Use Industry Deep Dives
- 13.4.1 Customer Requirements and Use Cases
- 13.4.2 Demand and Replacement Cycles
- 13.4.3 Technical and Regulatory Considerations
- 13.4.4 Purchasing and Procurement Models
- 13.4.5 Leading Vendors and Distribution Channels
- 13.4.6 Forecast and Commercial Opportunities
- 13.5 Emerging Applications and Cross-Segment Demand
- 13.6 End-Use Industry Investment Priorities
Chapter 14 Global Smart Medical Devices Geographic Market Outlook, 2025-2035
- 14.1 Regional Market Size and Share, 2025
- 14.2 Regional Market Forecast, 2025-2035
- 14.3 Regional Pricing, Production and Demand Differences
- 14.4 North America
- 14.4.1 United States
- 14.4.2 Canada
- 14.4.3 Mexico
- 14.5 Europe
- 14.5.1 Germany
- 14.5.2 France
- 14.5.3 Italy
- 14.5.4 United Kingdom
- 14.5.5 Spain
- 14.5.6 Poland
- 14.5.7 Russia
- 14.5.8 Netherlands
- 14.5.9 Belgium
- 14.5.10 Sweden
- 14.5.11 Denmark
- 14.5.12 Norway
- 14.5.13 Rest of Europe
- 14.6 Asia Pacific
- 14.6.1 China
- 14.6.2 India
- 14.6.3 Japan
- 14.6.4 South Korea
- 14.6.5 Thailand
- 14.6.6 Indonesia
- 14.6.7 Vietnam
- 14.6.8 Malaysia
- 14.6.9 Australia
- 14.6.10 Rest of Asia Pacific
- 14.7 Latin America
- 14.7.1 Brazil
- 14.7.2 Argentina
- 14.7.3 Colombia
- 14.7.4 Chile
- 14.7.5 Rest of Latin America
- 14.8 Middle East
- 14.8.1 Saudi Arabia
- 14.8.2 United Arab Emirates
- 14.8.3 Turkey
- 14.8.4 Israel
- 14.8.5 Iran
- 14.8.6 Rest of the Middle East
- 14.9 Africa
- 14.9.1 South Africa
- 14.9.2 Egypt
- 14.9.3 Nigeria
- 14.9.4 Morocco
- 14.9.5 Rest of Africa
- 14.10 Regional Investment, Policy and Supply Chain Differences
- 14.11 Regional Competitive Landscape
- 14.12 Geographic Growth Hotspots
Chapter 15 Global Smart Medical Devices Technology, Innovation and Sustainability Outlook
- 15.1 Technology Landscape and Maturity
- 15.2 Product, Process and Service Innovation
- 15.3 AI, Automation and Digital Tools in the Industry
- 15.4 Technology Adoption and Performance Benchmarking
- 15.5 Innovation Pipeline and R&D Investment
- 15.6 Patent and Intellectual Property Trends
- 15.7 Energy Efficiency and Resource Management
- 15.8 Sustainability, Recycling and Circularity
- 15.9 Technology Roadmap, 2025-2035
- 15.10 Risks of Obsolescence and Technology Substitution
Chapter 16 Global Smart Medical Devices Market Key Strategic Imperatives
- 16.1 Growth and Market Entry Priorities
- 16.2 High-Return Products and Segments
- 16.3 Pricing, Profitability and Cost Optimization
- 16.4 Technology Investment and Product Differentiation
- 16.5 Supply Chain Localization and Resilience
- 16.6 Distribution and Customer Acquisition
- 16.7 Partnership, Acquisition and Capacity Strategy
- 16.8 Regional Expansion Priorities
- 16.9 Short-, Medium- and Long-Term Actions
Chapter 17 Competition Outlook
- 17.1 Industry Competition Characteristics
- 17.2 Market Structure and Concentration
- 17.3 Market Share and Competitive Positioning, 2025
- 17.4 Company-Wise Revenue and Product Benchmarking
- 17.5 Production and Service Capacity Benchmarking
- 17.6 Technology, Pricing and Differentiation
- 17.7 Regional Footprint and Distribution Strength
- 17.8 Mergers, Acquisitions and Strategic Alliances
- 17.9 New Entrants and Competitive Threats
- 17.10 Porter's Five Forces and Industry Attractiveness
- 17.11 Competitive Outlook, 2025-2035
Chapter 18 Company Profiles
- 18.1 Company Coverage and Selection Criteria
- 18.2 Abbott Laboratories
- 18.2.1 Business Description
- 18.2.2 Company Ownership and Geographic Presence
- 18.2.3 Product and Service Portfolio
- 18.2.4 Manufacturing and Operating Footprint
- 18.2.5 Production Capacity and Expansion Plans
- 18.2.6 Financial Performance and Investment
- 18.2.7 Market Share and Competitive Position
- 18.2.8 Technology and Innovation Capabilities
- 18.2.9 Strategic Alliances or Partnerships
- 18.2.10 Recent Developments
- 18.2.11 Growth Strategy and Outlook
- 18.3 Medtronic plc
- 18.4 F. Hoffmann-La Roche Ltd
- 18.5 Dexcom, Inc.
- 18.6 Masimo
- 18.7 Drägerwerk AG & Co. KGaA
- 18.8 Shenzhen Ztsense Hi Tech Co., Ltd
- 18.9 Smartcardia
- 18.10 Microlife Corporation
- 18.11 Beurer GmbH
- 18.12 Adherium
- 18.13 LifeScan, Inc.
- 18.14 ARKRAY, Inc
- 18.15 Sensoria
- 18.16 Demant A/S
- 18.17 WS Audiology
- 18.18 Other Relevant Market Participants
Note: Every listed company is profiled on the structure shown under the first company. The company list is preliminary and may change based on research findings, market developments, data availability and client requirements.
Chapter 19 Disclaimer
- 19.1 Research and Forecast Disclaimer
- 19.2 Data Source and Estimation Limitations
Note: The depth of individual sections depends on data availability for this market. Volume, capacity, trade and other unit-based metrics are included where applicable.

