
COPD and sleep apnea keep breathing equipment in demand
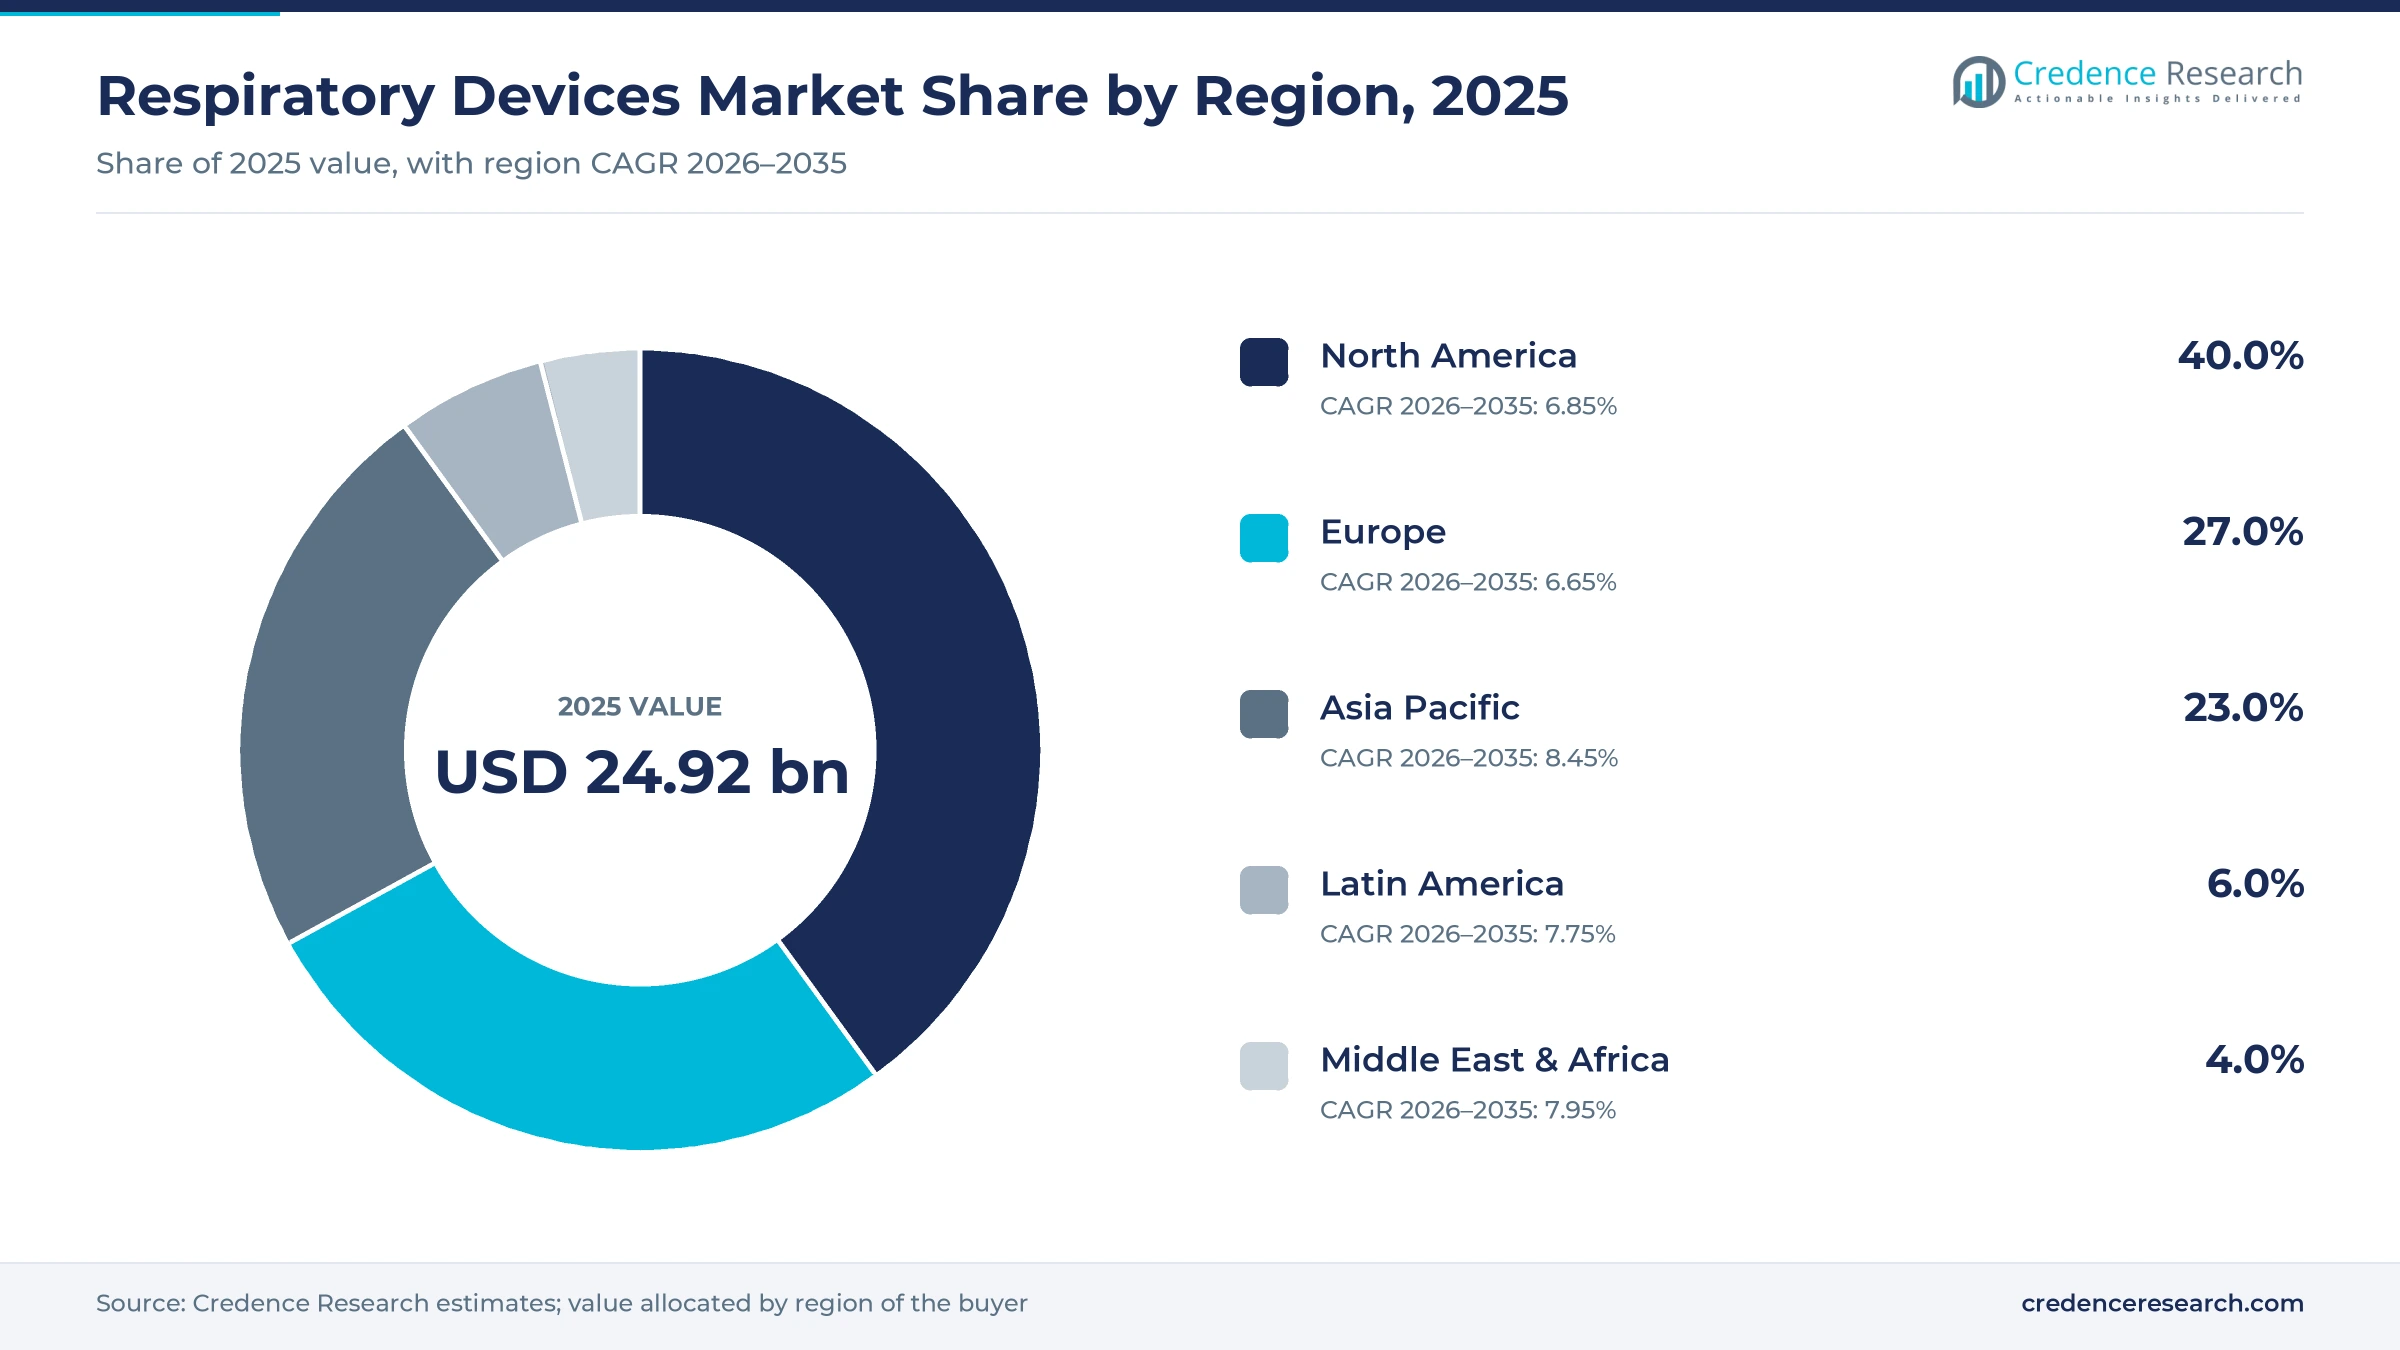
The global respiratory devices market was valued at USD 24.92 billion in 2025 and is projected to increase from USD 26.74 billion in 2026 to USD 50.33 billion by 2035, registering a CAGR of 7.28% during 2026–2035. Demand comes from a large and aging population with chronic obstructive pulmonary disease, asthma and obstructive sleep apnea, together with steady hospital spending on ventilators and oxygen therapy. North America held the largest regional share, 40.0% in 2025, because the United States combines high diagnosis rates for sleep apnea with broad home equipment coverage. Asia Pacific is the fastest-growing region at 8.45% a year, as China and India expand hospital capacity and home oxygen services. The competitive picture changed in April 2024, when a U.S. court entered a consent decree that restricts Philips Respironics from selling new sleep and breathing machines from several U.S. facilities. As a result, other suppliers gained room in the U.S. sleep therapy channel.
Which breathing care products does this analysis cover?
The analysis counts positive airway pressure machines, ventilators, humidifiers, oxygen concentrators, spirometers, peak flow meters, masks and related equipment used to diagnose, monitor and treat breathing disorders. Values are based on manufacturer selling prices, including masks and other consumables sold for use with each platform.
Inhaled medicines, medical gas supply, sleep clinic services and home care staffing sit outside the scope of this analysis. The value chain runs from sensor, blower and component makers through device manufacturers and distributors to hospitals, ambulatory surgery centers, clinics and home equipment providers that set up machines and replace supplies.

Respiratory Devices Market Insights
- The respiratory devices market grows from USD 24.92 billion in 2025 to USD 50.33 billion by 2035, a 7.28% CAGR, as chronic lung disease and sleep apnea care expand.
- North America held 40.0% of global respiratory devices value in 2025, supported by high sleep apnea diagnosis and home equipment coverage.
- PAP devices led product spending with 22.0% of 2025 value, while oxygen concentrators grow fastest at 8.04% a year.
- In April 2024, a U.S. court entered a consent decree that restricts Philips Respironics sales of new sleep and breathing machines in the United States.
- In May 2025, ResMed acquired VirtuOx, a home diagnostic testing company, which links sleep testing more closely with therapy equipment.
PAP devices lead while oxygen concentrators grow fastest
Why do PAP machines lead product spending?
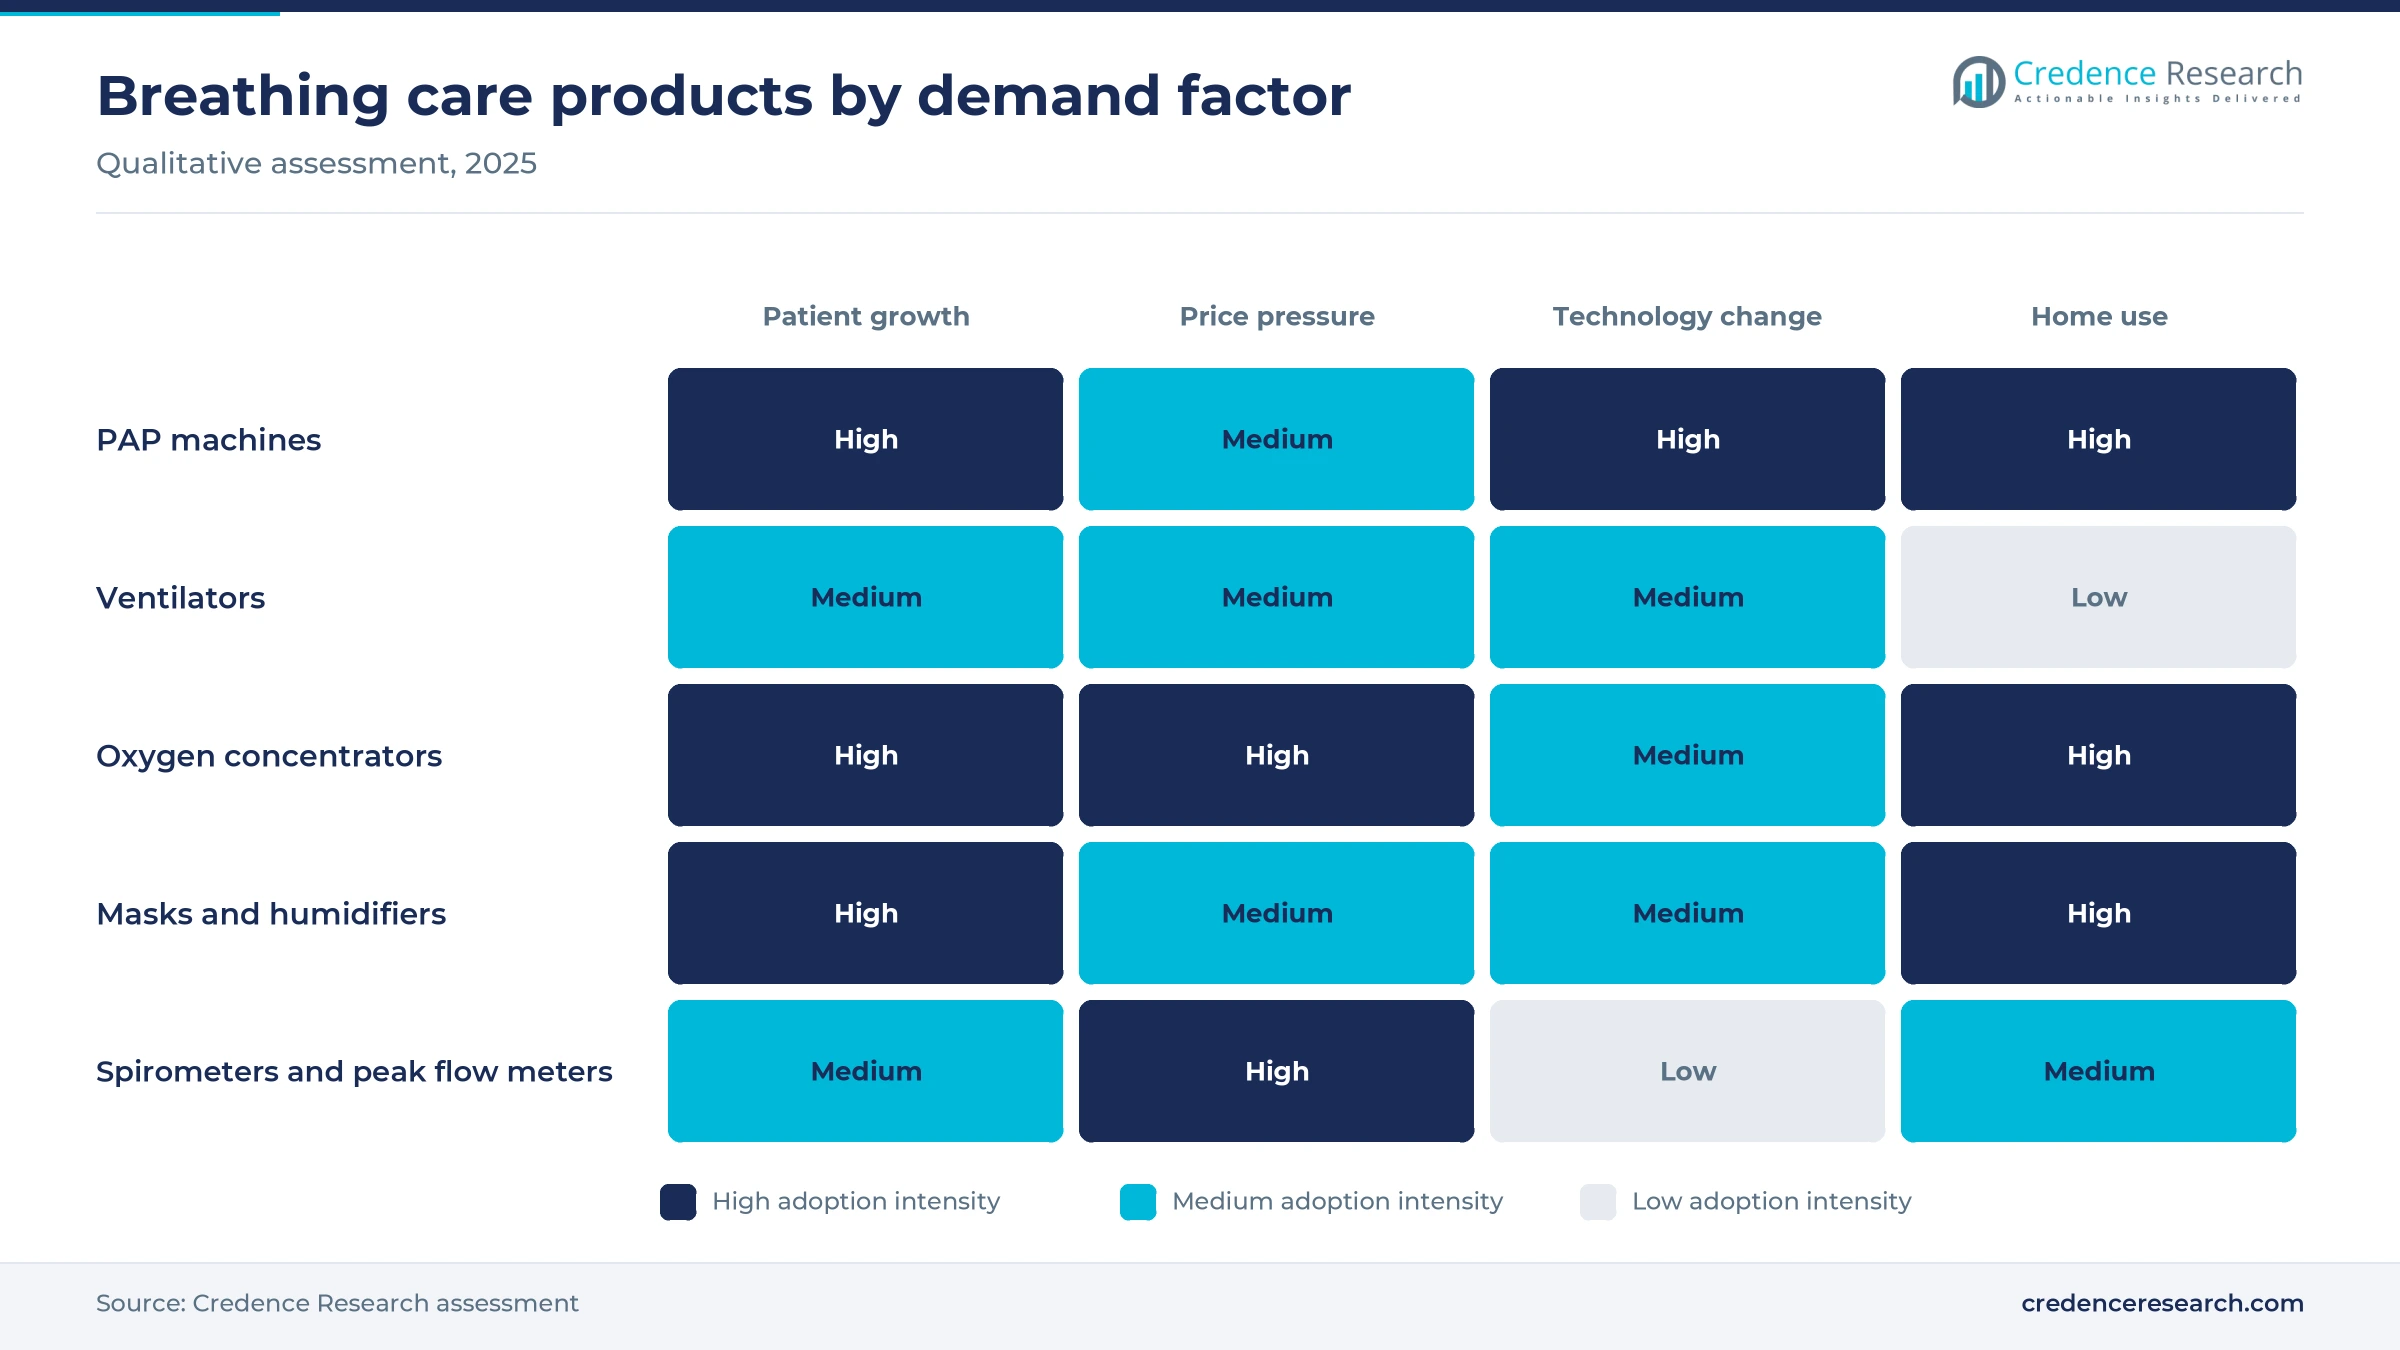
Based on product, the market is categorized into PAP devices, ventilators, humidifiers, oxygen concentrators, spirometers, peak flow meters, masks and others. PAP Devices led with a 22.0% share of 2025 value, because each sleep apnea patient needs a machine and regular replacement of masks and tubing. Oxygen Concentrators grow fastest at 8.04% a year, as home programs for chronic lung disease expand. Hospitals also keep buying mechanical ventilators for intensive care units.
Which conditions drive most equipment use?
Based on application, the market is categorized into COPD, sleep apnea, asthma, infectious diseases and others. COPD led with a 34.0% share of 2025 value, because patients with advanced disease need oxygen, ventilation and lung function testing for many years. Sleep Apnea grows fastest at 7.86% a year, as home sleep testing finds more untreated patients. Asthma care relies mostly on spirometers and peak flow meters for monitoring.
Where are breathing care machines used most often?
Based on end user, the market is categorized into hospitals and ambulatory surgery centers, clinics, home care settings and others. Hospitals & ASCs led with a 52.0% share of 2025 value, because intensive care, emergency and surgical units run ventilators, humidifiers and monitors around the clock. Home Care Settings grow fastest at 8.22% a year, as more patients receive sleep therapy and oxygen at home under remote supervision.
| Segment Group | Leading Sub-segment | Share, 2025 | Fastest-growing Sub-segment | CAGR, 2026–2035 |
|---|---|---|---|---|
| By Product | PAP Devices | 22.0% | Oxygen Concentrators | 8.04% |
| By Application | COPD | 34.0% | Sleep Apnea | 7.86% |
| By End User | Hospitals & ASCs | 52.0% | Home Care Settings | 8.22% |
Request a Free Sample
Fill in your details and we'll send you a free sample report.
- Sample data tables & charts
- Research methodology
Lung disease burden and untreated sleep apnea lift demand
How does chronic obstructive pulmonary disease sustain demand?
Chronic obstructive pulmonary disease sustains demand, because patients need diagnosis, monitoring and often oxygen for the rest of their lives. The World Health Organization ranks COPD as the third leading cause of death worldwide, with 3.4 million deaths in 2023, or about 6% of all deaths. The same source states that oxygen is used for people with severe or long-standing COPD, which ties disease progression to equipment demand. As a result, COPD accounted for 34.0% of 2025 application value, the largest share of any condition. In turn, hospitals and home providers keep adding oxygen and ventilation capacity in most regions through 2035.
Why does undiagnosed sleep apnea create a large treatment pool?
Undiagnosed sleep apnea creates a large treatment pool, because most affected adults have never received a sleep test. A literature-based analysis estimated that 936 million adults aged 30 to 69 have mild to severe obstructive sleep apnea worldwide. The same analysis put moderate to severe cases at 425 million, with the highest numbers in China, the United States, Brazil and India. Moderate to severe patients are the main candidates for positive airway pressure therapy. As a result, sleep apnea grows at 7.86% a year, the fastest rate among applications. In turn, sleep apnea therapy remains the largest home equipment category.
How does aging raise the need for breathing support at home?
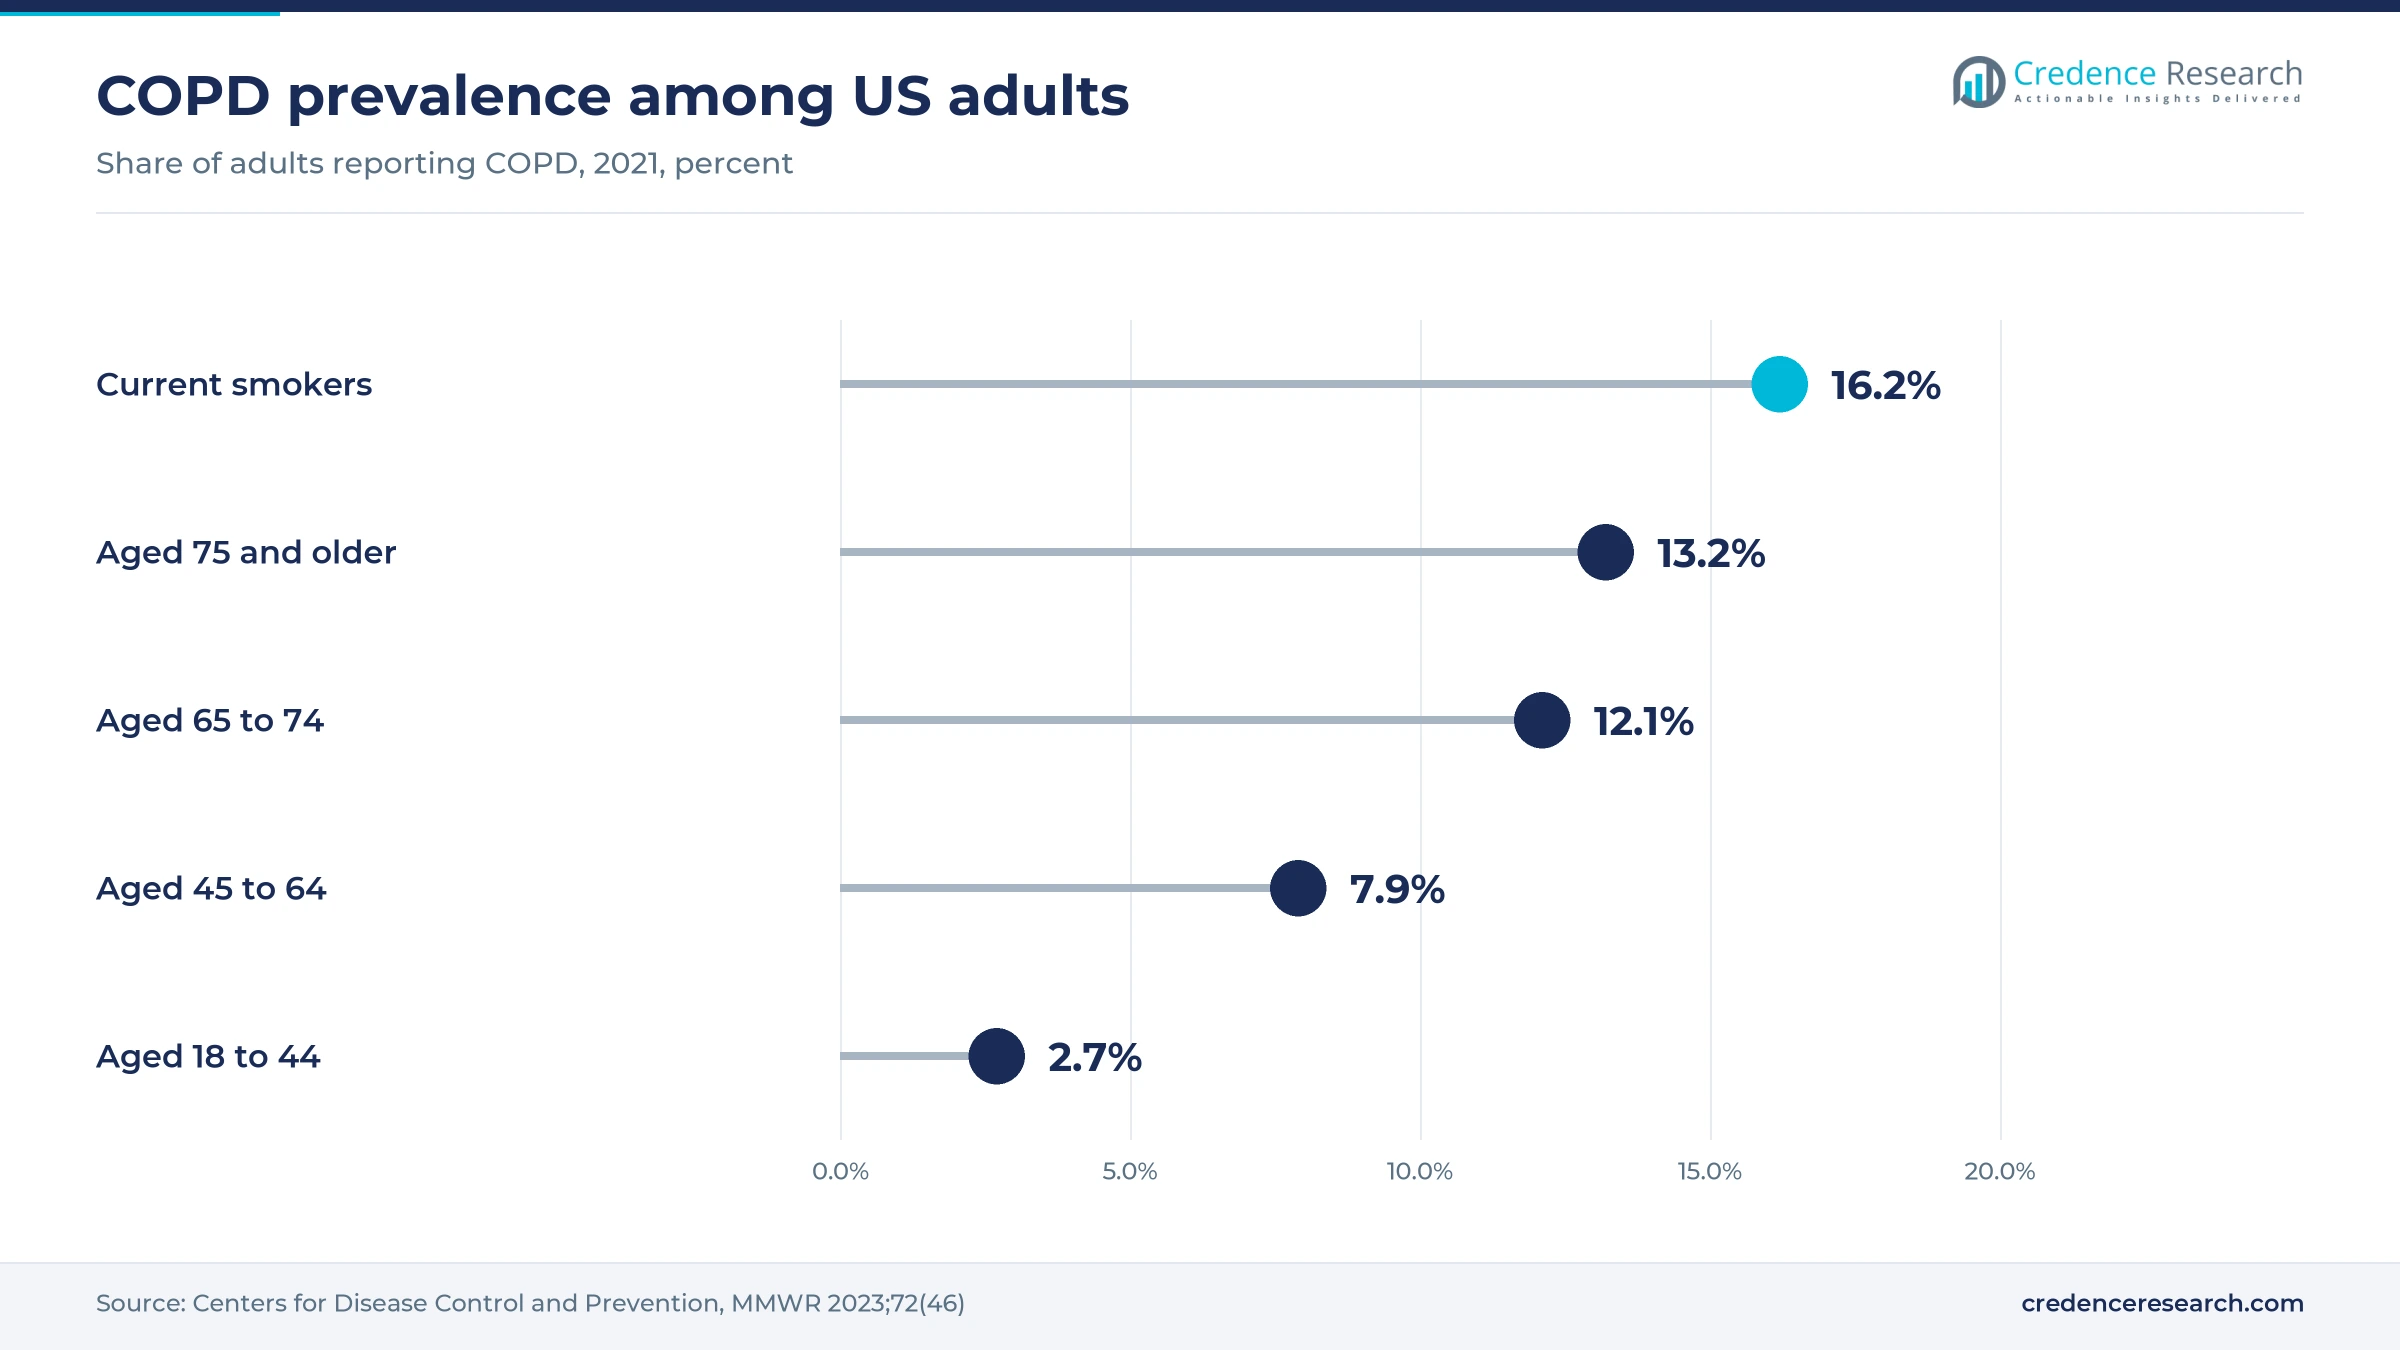
Aging raises the need for breathing support at home, because chronic lung disease becomes more common in later life. The Centers for Disease Control and Prevention reported COPD prevalence of 6.5% among U.S. adults in 2021, or about 14.2 million people. Prevalence reached 12.1% among adults aged 65 to 74 and 13.2% among those aged 75 and older, compared with 2.7% among adults aged 18 to 44. The same report found that prevalence rose among adults aged 75 and older between 2011 and 2021. As a result, home care settings grow at 8.22% a year, faster than any other end user.
Why does the oxygen access gap support concentrator demand?
The oxygen access gap supports concentrator demand, because many hospitals in poorer countries still lack a reliable oxygen supply. The Lancet Global Health Commission on medical oxygen security found that more than 5 billion people lack access to safe, quality and affordable medical oxygen services. The commission also estimated that 306 million of the 374 million people who need oxygen live in low- and middle-income countries. Closing this gap favors concentrators, which produce oxygen on site from room air in hospitals and homes without regular cylinder deliveries. As a result, oxygen concentrators grow at 8.04% a year, the fastest pace of any product.
Home testing, AI therapy tools and oxygen access gain pace
How is home testing shifting the path to sleep therapy?
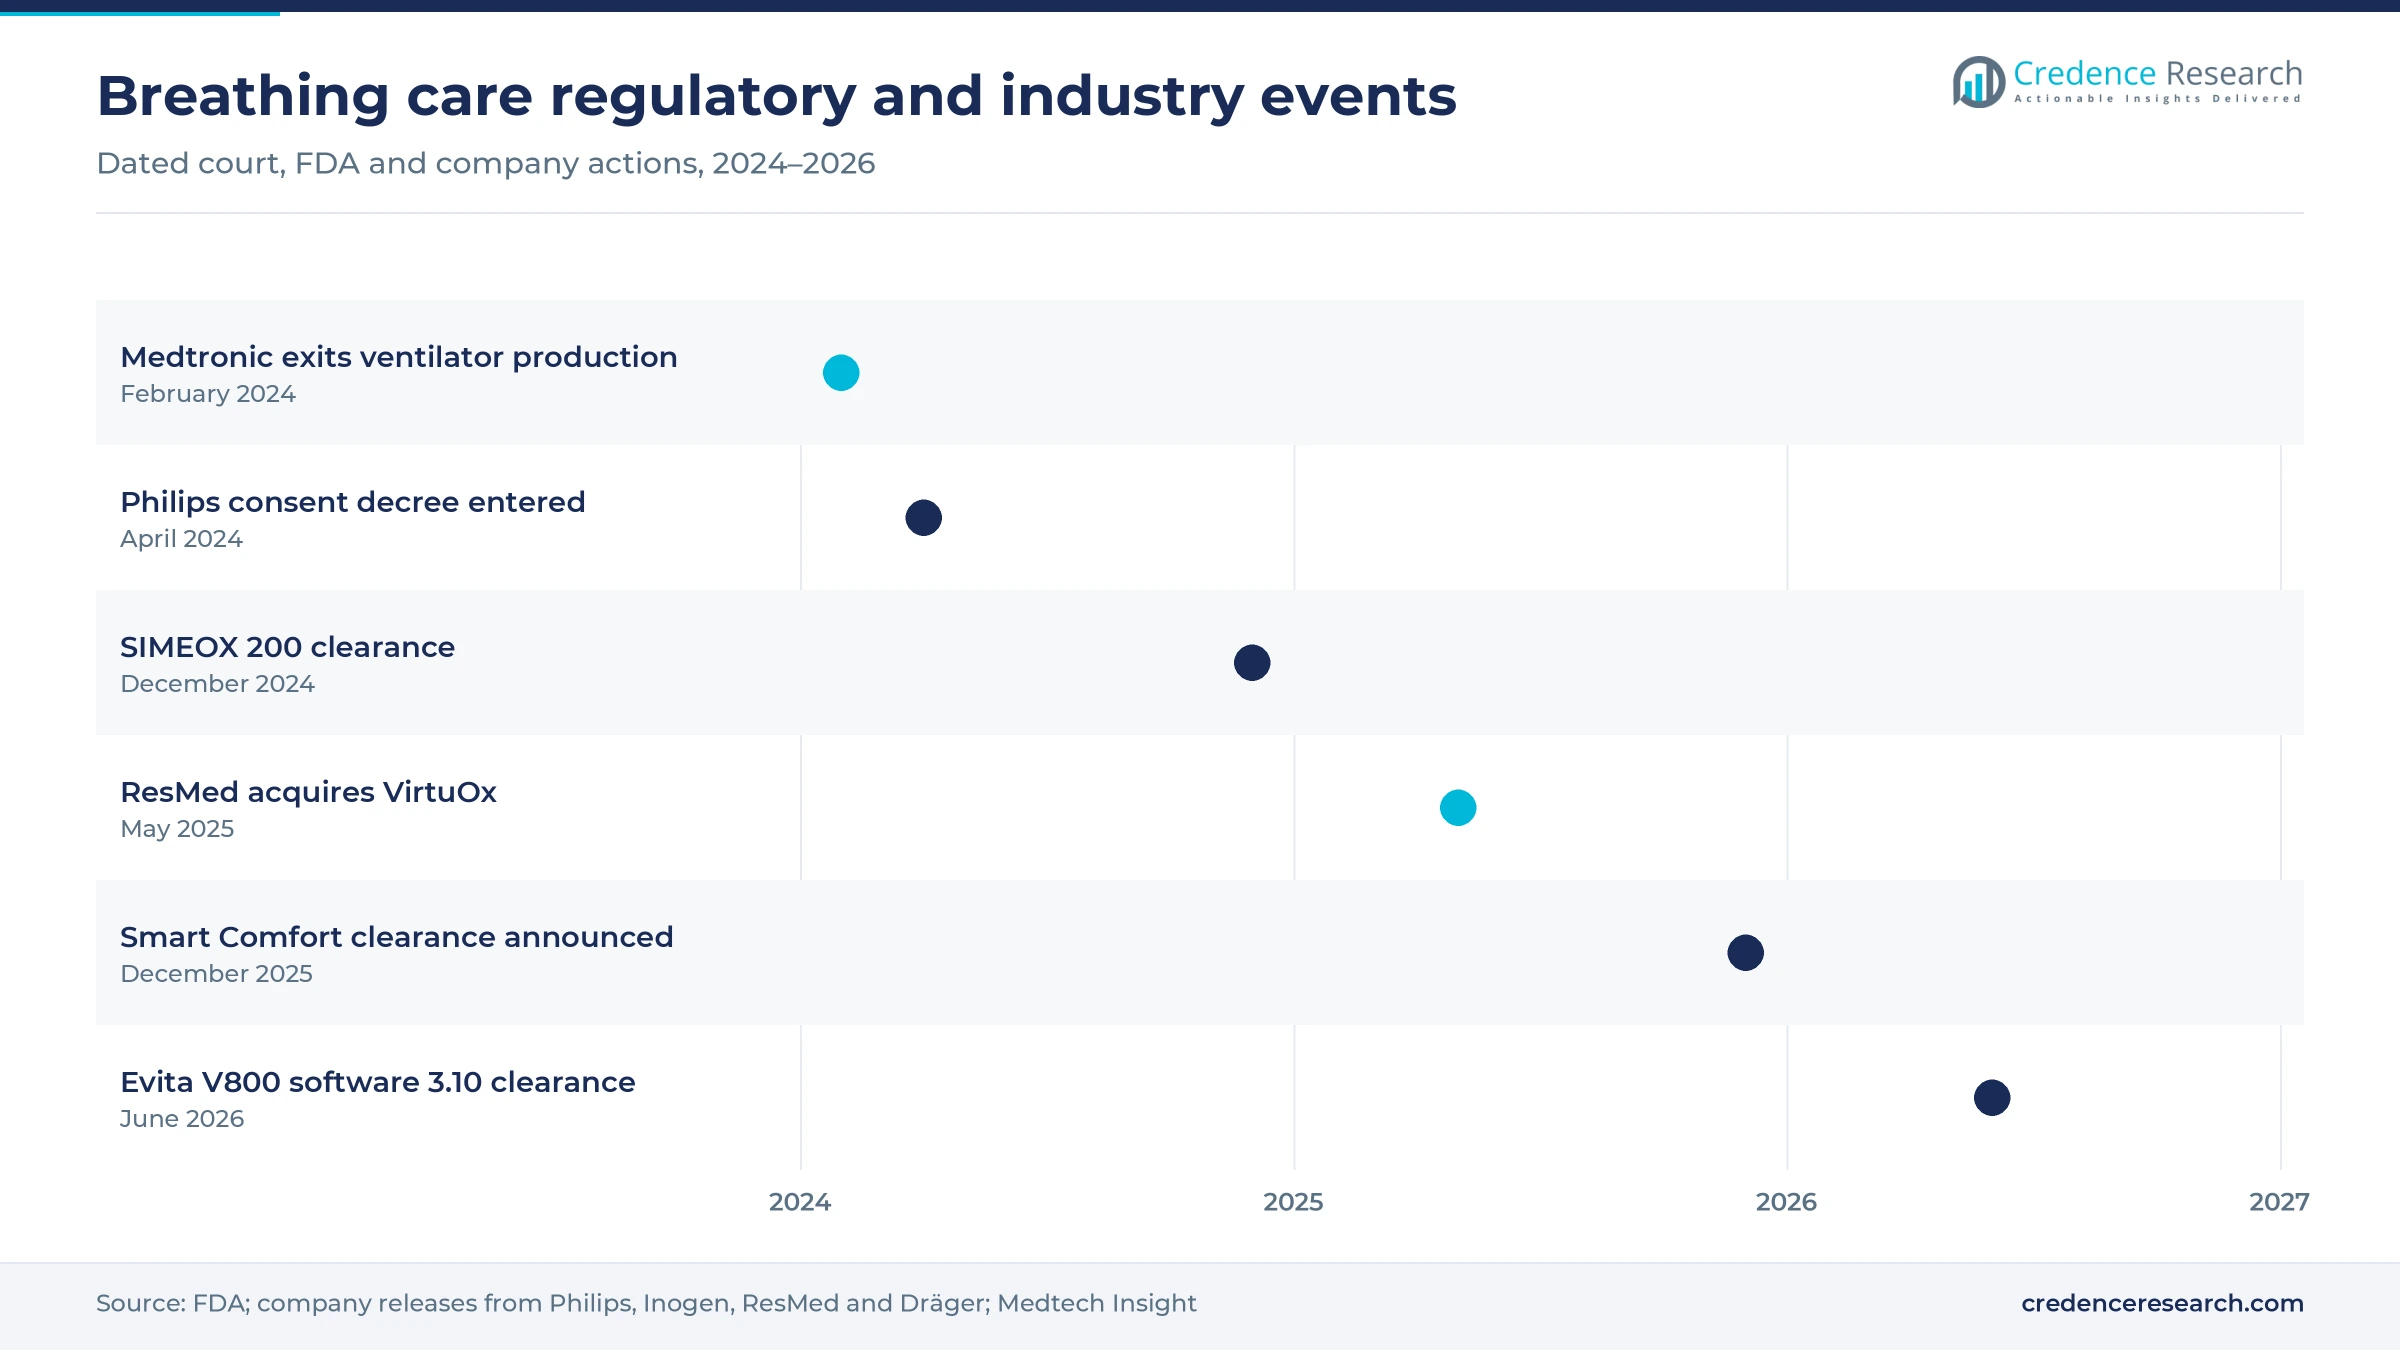
Home testing is shifting the path to sleep therapy, because patients can now complete diagnosis without an overnight clinic stay. In May 2025, ResMed acquired VirtuOx, an independent diagnostic testing facility that supports at-home and remote sleep, breathing and heart testing across the United States. The deal places testing and therapy equipment under one supplier, which shortens the time between diagnosis and a first machine. Home testing also reaches patients in rural areas who live far from sleep laboratories, and the pool of untreated adults is large, with 425 million moderate to severe cases among 936 million affected adults. The CDC also counts about 14.2 million U.S. adults with COPD. As a result, home testing supports growth in home care settings, the fastest-growing end user.
Why are AI tools rising in importance for PAP therapy?
AI tools are rising in importance for PAP therapy, because many patients stop using their machines in the first weeks. In December 2025, ResMed announced FDA clearance for Smart Comfort, an AI-enabled tool that recommends personalized comfort settings for people starting or continuing CPAP therapy. The company planned a limited U.S. beta in early 2026 for new myAir app users with an AirSense 11 machine, with a broader rollout later in 2026. Better comfort supports regular use and steady mask and supply replacement, which matters because masks are replaced several times a year. As a result, PAP devices kept a 22.0% share of 2025 product value, and Latin America, growing at 7.75% a year, offers a newer user base.
Can lung protective ventilation software open hospital upgrades?
Ventilator makers have a clear opening in lung protective software, because hospitals can upgrade installed fleets without replacing every machine. In June 2026, Dräger announced FDA 510(k) clearance for software release 3.10 of its Evita V800 ventilator. The update adds decelerating flow in volume control, PEEP and oxygen guidance maps, and a driving pressure calculation for patients with acute lung injury. Medtronic, by contrast, decided in February 2024 to stop producing ventilators. As a result, remaining suppliers can compete for replacement and upgrade contracts in intensive care units, where hospitals and ambulatory surgery centers held 52.0% of 2025 end-user value. Europe, a mature ventilator buyer, still grows at 6.65% a year.
Where can airway clearance and portable oxygen add value?
Airway clearance and portable oxygen give suppliers room to add value, because patients with chronic lung disease want treatment that fits daily life. In December 2024, Inogen received FDA 510(k) clearance for the SIMEOX 200 airway clearance device for patients with bronchiectasis, COPD and cystic fibrosis. Lightweight portable oxygen concentrators also let patients travel and work while on therapy. The CDC reports that COPD remains common among older adults, which keeps the patient base large. In turn, suppliers that pair oxygen, clearance and monitoring can deepen ties with home equipment providers and with hospital discharge teams that plan care at home.
Recalls, reimbursement and access gaps slow adoption
How do product recalls weaken trust in sleep therapy?
Product recalls weaken trust in sleep therapy, because patients and providers worry about the safety of machines they use every night. The U.S. Food and Drug Administration states that a federal court entered the Philips consent decree on April 9, 2024, after a large recall of foam-containing machines. Some patients delayed therapy or stopped using machines during the recall period. As a result, suppliers now invest more in testing, materials and patient communication.
Why do payment limits slow home equipment upgrades?
Payment limits slow home equipment upgrades, because insurers pay fixed amounts for machines and resupply over set periods. Home equipment providers with tight margins often extend machine lives and limit mask replacement to the minimum covered schedule. Several countries in Asia and Latin America cover home therapy only partly, so patients pay part of the cost. In turn, value growth in these markets trails the growth in diagnosed patients.
How does low spirometry access delay diagnosis?
Low spirometry access delays diagnosis, because COPD cannot be confirmed without a breathing test. The World Health Organization notes that spirometry is often unavailable in low- and middle-income countries, so the diagnosis may be missed. Patients then reach hospitals with advanced disease and need oxygen or ventilation urgently. As a result, demand for spirometers in primary care matters for earlier and cheaper treatment.
Why could new drug options reduce some PAP demand?
New drug options could reduce some PAP demand, because weight loss improves sleep apnea in many patients with obesity. In December 2024, Eli Lilly announced U.S. approval of Zepbound for moderate to severe obstructive sleep apnea in adults with obesity. Some patients may delay starting machine therapy while they try medication first. However, many patients will still need PAP therapy, and drug users must be diagnosed first, which supports home testing.
North America leads as Asia Pacific expands fastest
| Region | Value, 2025 (USD billion) | Share, 2025 | CAGR, 2026–2035 |
|---|---|---|---|
| North America | 9.97 | 40.0% | 6.85% |
| Europe | 6.73 | 27.0% | 6.65% |
| Asia Pacific | 5.73 | 23.0% | 8.45% |
| Latin America | 1.50 | 6.0% | 7.75% |
| Middle East & Africa | 1.00 | 4.0% | 7.95% |
Why does North America hold the largest regional share?
North America held a 40.0% share of 2025 value and grows at 6.85% a year through 2035. The United States drives this position, because high sleep apnea diagnosis rates and broad home equipment coverage support steady PAP and mask sales. The Philips consent decree reshaped U.S. sleep therapy supply after April 2024, which shifted volumes toward other suppliers. Home testing and AI-enabled comfort tools add further growth in the region.
Why do China and India drive Asia Pacific growth?
Asia Pacific held a 23.0% share of 2025 value and is the fastest-growing region at 8.45% a year. China and India have large populations with COPD and sleep apnea, and both countries are adding hospital beds and intensive care units. Japan contributes demand for ventilators and monitors, supported by domestic suppliers such as Nihon Kohden Corporation. This mix of volume growth and new capacity keeps competition intense across the region.
What shapes demand across Europe?
Europe held a 27.0% share of 2025 value and grows at 6.65% a year, the slowest pace of the five regions. Germany, France, Italy and the United Kingdom account for much of the spending, and Dräger is a leading ventilator supplier in the region. National health systems buy through tenders that reward price and service. However, long machine lives keep value growth below the global average.
Where is Latin America adding demand?
Latin America held a 6.0% share of 2025 value and grows at 7.75% a year through 2035. Brazil leads regional demand, because it has one of the largest populations with sleep apnea and a growing private hospital network. However, coverage gaps still limit access to home therapy in poorer rural areas.
What limits growth in the Middle East and Africa?
The Middle East and Africa held a 4.0% share of 2025 value and grows at 7.95% a year through 2035. Gulf states fund modern intensive care units, while much of Africa still lacks reliable medical oxygen. Concentrators and oxygen programs therefore offer the largest growth opening.
Consent decrees, clearances and deals since 2024
| Development | Status and market relevance |
|---|---|
| In February 2024, Medtronic decided to stop producing ventilators and to combine its remaining monitoring and breathing products into a new acute care and monitoring business. | Completed; reduces the number of ventilator suppliers |
| In April 2024, a U.S. federal court entered a consent decree that restricts Philips Respironics production and sale of new CPAP and BiPAP machines from several U.S. facilities. | In force; Philips stated in May 2026 that U.S. sales resume only when requirements are met |
| In December 2024, Inogen received FDA 510(k) clearance for the SIMEOX 200 airway clearance device. | Cleared; limited U.S. launch planned for 2025 |
| In May 2025, ResMed acquired VirtuOx, a home diagnostic testing company for sleep, breathing and heart conditions. | Completed; links diagnosis with therapy equipment |
| In June 2026, Dräger announced FDA 510(k) clearance for software release 3.10 of the Evita V800 ventilator. | Cleared; adds lung protective ventilation tools for intensive care |
Connected PAP, smarter ventilation and portable oxygen
- Connected PAP machines send nightly usage data to clinicians and patient apps, which helps providers spot problems early and meet coverage rules.
- AI comfort settings recommend pressure and comfort changes for new users, which can improve early use and reduce therapy dropout.
- Lung protective ventilation software guides pressure, flow and oxygen settings for patients with acute lung injury, which may reduce ventilator-induced injury.
- Portable oxygen concentrators produce oxygen from room air in a light unit, which lets patients travel without heavy cylinders.
- Home sleep testing records breathing and oxygen levels at home, which shortens the time from symptoms to diagnosis and treatment.
Need a Custom Version of This Report?
Tailor the scope, geography, or segments to your exact requirements.
- Custom geography or segment scope
- Direct access to our analyst team
Sleep and critical care suppliers compete on service
Competition splits into sleep therapy, critical care ventilation and monitoring, with a few companies active across several areas. ResMed Inc. and Fisher & Paykel Healthcare Limited compete strongly in PAP machines, masks and humidification, and ResMed added home diagnostic testing through VirtuOx in May 2025. Koninklijke Philips N.V. remains a large global supplier, although its U.S. sales of new sleep and breathing machines stay restricted under the 2024 consent decree. Dragerwerk AG & Co. KGaA, Hamilton Medical, GE Healthcare and Nihon Kohden Corporation lead in hospital ventilators, while Medtronic stopped producing ventilators in 2024. Masimo, Nonin and ICU Medical, Inc. serve oximetry and related monitoring, and Rotech Healthcare, Inc. supplies home oxygen and equipment. As a result, buyers favor suppliers with reliable service, data tools and broad consumable ranges.
Companies profiled and their roles in this market
| Company | Type | Role in the market |
|---|---|---|
| ResMed Inc. | Specialist | PAP machines, masks, connected care software and home sleep testing |
| Koninklijke Philips N.V. | Diversified | Sleep and breathing machines, with U.S. sales restricted under the consent decree |
| Fisher & Paykel Healthcare Limited | Specialist | Humidifiers, masks and nasal high flow therapy |
| Dragerwerk AG & Co. KGaA | Diversified | Evita V800 and other intensive care ventilators |
| Hamilton Medical | Specialist | Intensive care and transport ventilators |
| GE Healthcare | Diversified | Ventilation and monitoring for hospitals |
| Nihon Kohden Corporation | Diversified | Ventilators and patient monitors with a strong base in Japan |
| Medtronic | Diversified | Acute care monitoring after its exit from ventilator production |
| Masimo | Specialist | Pulse oximetry and breathing rate monitoring |
| Nonin | Specialist | Fingertip and wearable pulse oximeters |
| ICU Medical, Inc. | Diversified | Hospital consumables and related breathing care products |
| Rotech Healthcare, Inc. | Provider | Home oxygen, PAP equipment and supplies |
Home care and oxygen access set the growth pace
Credence Research's view is that home care and oxygen access will set the pace of growth through 2035, because hospitals and payers want more patients treated outside intensive care. The overall market grows at 7.28% a year, supported by COPD, untreated sleep apnea and aging populations. Oxygen concentrators and home care settings grow faster than hospital ventilation. Companies that combine testing, connected therapy, masks and service will win the most provider contracts, while recall risk will keep quality systems under close review.
How Credence Research sized breathing care equipment
The report uses 2025 as the base year and 2026 to 2035 as the forecast period. Market values come from the Credence Research model, which builds spending by product, application, end user and region. Regional and segment splits are Credence Research estimates informed by World Health Organization data, U.S. public health statistics, peer-reviewed studies, U.S. regulator records and company press releases. No primary interviews or surveys were used in preparing this edition of the report.
Breathing care equipment outlook to 2035
By 2035, the respiratory devices market is projected to reach USD 50.33 billion, with growth led by oxygen concentrators, connected PAP therapy and home testing. PAP devices will remain the largest product area, as diagnosed sleep apnea patients renew machines and buy masks on regular schedules. North America keeps the highest spending, while Asia Pacific adds the most new capacity. Home settings will take a larger share of value, because payers and patients prefer treatment outside hospitals. As a result, advantage will depend on safety, comfort and service.
Frequently Asked Questions
How big is the global respiratory devices market?
Which product leads respiratory devices spending?
Which region leads spending on breathing care equipment?
Which condition accounts for most equipment use?
How did the Philips consent decree affect the U.S. market?
What recent clearances affect breathing care equipment?
Who are the leading respiratory devices companies?
What restrains growth in breathing care equipment?
Table of Content
Chapter 1 Market Segmentation
- 1.1 Segmentation Framework
- 1.1.1 Product and Service Classification
- 1.1.2 Application and End-Use Classification
- 1.1.3 Technology and Solution Classification
- 1.1.4 Customer and Distribution Channel Classification
- 1.1.5 Geographic Segmentation
- 1.1.6 Market Segment Definitions and Boundaries
- 1.2 By Product
- 1.2.1 PAP Devices
- 1.2.2 Ventilators
- 1.2.3 Humidifiers
- 1.2.4 Oxygen Concentrators
- 1.2.5 Spirometers
- 1.2.6 Peak Flow Meters
- 1.2.7 Masks
- 1.2.8 Others
- 1.3 By Application
- 1.3.1 COPD
- 1.3.2 Sleep Apnea
- 1.3.3 Asthma
- 1.3.4 Infectious Diseases
- 1.3.5 Others
- 1.4 By End User
- 1.4.1 Hospitals & ASCs
- 1.4.2 Clinics
- 1.4.3 Home Care Settings
- 1.4.4 Others
Chapter 2 Introduction
- 2.1 Report Objectives and Scope
- 2.2 Product Definition and Industry Terminology
- 2.3 Market Inclusions and Exclusions
- 2.4 Research Process
- 2.4.1 Primary Research and Expert Interviews
- 2.4.2 Secondary Research and Source Review
- 2.4.3 Top-Down and Bottom-Up Estimation
- 2.4.4 Data Triangulation and Verification
- 2.5 Market Size Measurement Basis
- 2.5.1 2025: USD 24.92 billion → 2035: USD 50.33 billion
- 2.6 Historical and Forecast Reference Periods
- 2.6.1 Historical Period: 2018-2025
- 2.6.2 Base Year: 2025
- 2.6.3 Forecast Period: 2025-2035
- 2.7 Research Assumptions and Limitations
Chapter 3 Executive Summary
- 3.1 Market Snapshot and Key Findings
- 3.2 Base-Year Market Size, 2025
- 3.3 Forecast Market Size, 2035
- 3.4 Revenue and Volume Growth Outlook
- 3.5 Key Demand and Supply Indicators
- 3.6 Leading Market Segments
- 3.7 Fastest-Growing Market Opportunities
- 3.8 Regional Performance Highlights
- 3.9 Technology and Industry Transformation
- 3.10 Competitive Landscape Summary
- 3.11 Analyst View and Strategic Implications
Chapter 4 Global Respiratory Devices Market Trends and Developments
- 4.1 Historical Industry Development, 2018-2025
- 4.2 Recent Market Trends and Developments
- 4.3 Demand and Customer Behavior Trends
- 4.4 Technology and Product Innovation
- 4.5 Artificial Intelligence, Automation and Digitalization
- 4.6 Local Manufacturing and Supply Chain Realignment
- 4.7 Industry Partnerships, Mergers and Acquisitions
- 4.8 Sustainability and Circular Economy Developments
- 4.9 Government and Private Sector Investment Trends
- 4.10 Emerging Business Models and Commercialization
- 4.11 Industry Developments and Announcements
Chapter 5 Global Respiratory Devices Market Production, Supply and Demand Analysis
- 5.1 Demand Trend and Consumption Analysis, 2018-2025
- 5.2 Demand Forecast, 2025-2035
- 5.3 Production and Output Trend, 2018-2025
- 5.4 Production and Output Forecast, 2025-2035
- 5.5 Installed Capacity and Capacity Utilization
- 5.6 Company-Wise Production Plants and Statistics
- 5.6.1 Installed Production Capacity
- 5.6.2 Actual Production
- 5.6.3 Planned Capacity and Expansion Targets
- 5.7 Supply Chain Structure and Procurement Trends
- 5.8 Supply-Demand Gap and Bottlenecks
- 5.9 Import Dependence and Sourcing Structure
- 5.10 Contract Manufacturing and Outsourcing
- 5.11 Regional Supply and Demand Concentration
Chapter 6 Global Respiratory Devices Market Pricing Analysis
- 6.1 Pricing Structure and Measurement
- 6.2 Historical Pricing Trends, 2018-2025
- 6.3 Pricing Outlook, 2025-2035
- 6.4 Average Selling Price and Unit Economics
- 6.5 Pricing by Product and Market Segment
- 6.6 Geographic Pricing Differences
- 6.7 Key Input, Energy, Labor and Logistics Costs
- 6.8 Contract Pricing and Purchasing Models
- 6.9 Pricing Sensitivity and Competitive Positioning
- 6.10 Price, Margin and Profitability Implications
Chapter 7 Global Respiratory Devices Market Dynamics
- 7.1 Market Growth Drivers
- 7.1.1 Demand-Side Drivers
- 7.1.2 Technology and Innovation Drivers
- 7.1.3 Infrastructure and Investment Drivers
- 7.1.4 Regulatory and Policy Drivers
- 7.2 Market Restraints
- 7.2.1 Cost and Affordability Constraints
- 7.2.2 Technology and Adoption Barriers
- 7.2.3 Supply Chain and Operational Constraints
- 7.3 Market Challenges
- 7.3.1 Competitive Pressure and Margin Erosion
- 7.3.2 Skills, Infrastructure and Implementation Gaps
- 7.4 Emerging Market Opportunities
- 7.5 Market Dynamics Impact and Time-Horizon Assessment
Chapter 8 Global Respiratory Devices Value Chain Analysis
- 8.1 Industry Value Chain Overview
- 8.2 Upstream Suppliers and Critical Inputs
- 8.3 Technology and Component Providers
- 8.4 Manufacturing or Service Delivery
- 8.5 Distribution, Channel Partners and Integrators
- 8.6 Downstream Applications and End Users
- 8.7 Value Addition and Profit Pools
- 8.8 Vertical Integration and Outsourcing
- 8.9 Supplier Concentration and Risk
- 8.10 Supply Chain Localization and Resilience
Chapter 9 Global Respiratory Devices Market Regulations and Policies
- 9.1 Relevant Laws, Standards and Compliance Frameworks
- 9.2 Product, Service, Safety and Quality Requirements
- 9.3 Government Policies, Incentives and Subsidies
- 9.4 Imports, Exports and Trade Barriers
- 9.5 Public Procurement and Local Content Requirements
- 9.6 Environmental and Sustainability Compliance
- 9.7 Upcoming Policy Changes and Market Implications
Chapter 10 Global Respiratory Devices Market Hotspots and Opportunities
- 10.1 Market Opportunity Mapping and Growth Hotspots
- 10.2 High-Growth Applications and Customer Groups
- 10.3 Underserved Markets and White-Space Opportunities
- 10.4 Emerging Technology and Product Opportunities
- 10.5 New Capacity and Investment Hotspots
- 10.6 Market Entry and Expansion Opportunities
- 10.7 Distribution and Partnership Opportunities
- 10.8 Near-Term and Long-Term Commercial Potential
- 10.9 Opportunity Attractiveness and Execution Risks
Chapter 11 Global Respiratory Devices Market Outlook, 2025-2035
- 11.1 Market Size and Analysis
- 11.1.1 Revenue (Market Measurement: 2025: USD 24.92 billion → 2035: USD 50.33 billion)
- 11.1.2 Market Volume and Quantity Sold
- 11.1.3 Historical Market Size, 2018-2025
- 11.1.4 Base-Year Market Size, 2025
- 11.2 Market Forecast, 2025-2035
- 11.2.1 Revenue Forecast to 2035
- 11.2.2 Volume Forecast to 2035
- 11.2.3 CAGR and Year-on-Year Growth
- 11.2.4 Incremental Revenue Opportunity
- 11.3 Forecast Assumptions and Scenario Analysis
- 11.3.1 Base-Case Forecast
- 11.3.2 Optimistic and Conservative Scenarios
- 11.3.3 Technology, Pricing and Policy Sensitivities
- 11.4 Market Attractiveness and Growth Outlook
Chapter 12 Global Respiratory Devices Market Segmentation and Outlook
- 12.1 Segmentation Summary and Market Shares, 2025
- 12.2 Largest and Fastest-Growing Segments
- 12.3 By Product - Market Size and Forecast, 2025-2035
- 12.3.1 Segment Definition and Scope
- 12.3.2 Historical Market Size, 2018-2025
- 12.3.3 Revenue Forecast, 2025-2035
- 12.3.4 Volume Forecast, 2025-2035
- 12.3.5 Base-Year Market Share, 2025
- 12.3.6 Segment CAGR and Growth Drivers
- 12.3.7 Subsegment Market Size and Forecast
- 12.3.7.1 PAP Devices
- 12.3.7.2 Ventilators
- 12.3.7.3 Humidifiers
- 12.3.7.4 Oxygen Concentrators
- 12.3.7.5 Spirometers
- 12.3.7.6 Peak Flow Meters
- 12.3.7.7 Masks
- 12.3.7.8 Others
- 12.3.8 Subsegment Pricing and Adoption Trends
- 12.3.9 Leading Suppliers and Competition
- 12.3.10 Regional Demand and Opportunities
- 12.4 By Application - Market Size and Forecast, 2025-2035
- 12.4.1 Segment Definition and Scope
- 12.4.2 Historical Market Size, 2018-2025
- 12.4.3 Revenue Forecast, 2025-2035
- 12.4.4 Volume Forecast, 2025-2035
- 12.4.5 Base-Year Market Share, 2025
- 12.4.6 Segment CAGR and Growth Drivers
- 12.4.7 Subsegment Market Size and Forecast
- 12.4.7.1 COPD
- 12.4.7.2 Sleep Apnea
- 12.4.7.3 Asthma
- 12.4.7.4 Infectious Diseases
- 12.4.7.5 Others
- 12.4.8 Subsegment Pricing and Adoption Trends
- 12.4.9 Leading Suppliers and Competition
- 12.4.10 Regional Demand and Opportunities
- 12.5 By End User - Market Size and Forecast, 2025-2035
- 12.5.1 Segment Definition and Scope
- 12.5.2 Historical Market Size, 2018-2025
- 12.5.3 Revenue Forecast, 2025-2035
- 12.5.4 Volume Forecast, 2025-2035
- 12.5.5 Base-Year Market Share, 2025
- 12.5.6 Segment CAGR and Growth Drivers
- 12.5.7 Subsegment Market Size and Forecast
- 12.5.7.1 Hospitals & ASCs
- 12.5.7.2 Clinics
- 12.5.7.3 Home Care Settings
- 12.5.7.4 Others
- 12.5.8 Subsegment Pricing and Adoption Trends
- 12.5.9 Leading Suppliers and Competition
- 12.5.10 Regional Demand and Opportunities
- 12.6 Segment Growth Comparison
- 12.7 Segment Attractiveness and Priority Matrix
Chapter 13 Global Respiratory Devices End-Use and Application Market Outlook
- 13.1 End-Use Industry and Customer Demand Structure
- 13.2 Leading Applications and Customer Groups
- 13.3 End-Use Market Size, Share and Forecast
- 13.4 Major End-Use Industry Deep Dives
- 13.4.1 Customer Requirements and Use Cases
- 13.4.2 Demand and Replacement Cycles
- 13.4.3 Technical and Regulatory Considerations
- 13.4.4 Purchasing and Procurement Models
- 13.4.5 Leading Vendors and Distribution Channels
- 13.4.6 Forecast and Commercial Opportunities
- 13.5 Emerging Applications and Cross-Segment Demand
- 13.6 End-Use Industry Investment Priorities
Chapter 14 Global Respiratory Devices Geographic Market Outlook, 2025-2035
- 14.1 Regional Market Size and Share, 2025
- 14.2 Regional Market Forecast, 2025-2035
- 14.3 Regional Pricing, Production and Demand Differences
- 14.4 North America
- 14.4.1 United States
- 14.4.2 Canada
- 14.4.3 Mexico
- 14.5 Europe
- 14.5.1 Germany
- 14.5.2 France
- 14.5.3 Italy
- 14.5.4 United Kingdom
- 14.5.5 Spain
- 14.5.6 Poland
- 14.5.7 Russia
- 14.5.8 Netherlands
- 14.5.9 Belgium
- 14.5.10 Sweden
- 14.5.11 Denmark
- 14.5.12 Norway
- 14.5.13 Rest of Europe
- 14.6 Asia Pacific
- 14.6.1 China
- 14.6.2 India
- 14.6.3 Japan
- 14.6.4 South Korea
- 14.6.5 Thailand
- 14.6.6 Indonesia
- 14.6.7 Vietnam
- 14.6.8 Malaysia
- 14.6.9 Australia
- 14.6.10 Rest of Asia Pacific
- 14.7 Latin America
- 14.7.1 Brazil
- 14.7.2 Argentina
- 14.7.3 Colombia
- 14.7.4 Chile
- 14.7.5 Rest of Latin America
- 14.8 Middle East
- 14.8.1 Saudi Arabia
- 14.8.2 United Arab Emirates
- 14.8.3 Turkey
- 14.8.4 Israel
- 14.8.5 Iran
- 14.8.6 Rest of the Middle East
- 14.9 Africa
- 14.9.1 South Africa
- 14.9.2 Egypt
- 14.9.3 Nigeria
- 14.9.4 Morocco
- 14.9.5 Rest of Africa
- 14.10 Regional Investment, Policy and Supply Chain Differences
- 14.11 Regional Competitive Landscape
- 14.12 Geographic Growth Hotspots
Chapter 15 Global Respiratory Devices Technology, Innovation and Sustainability Outlook
- 15.1 Technology Landscape and Maturity
- 15.2 Product, Process and Service Innovation
- 15.3 AI, Automation and Digital Tools in the Industry
- 15.4 Technology Adoption and Performance Benchmarking
- 15.5 Innovation Pipeline and R&D Investment
- 15.6 Patent and Intellectual Property Trends
- 15.7 Energy Efficiency and Resource Management
- 15.8 Sustainability, Recycling and Circularity
- 15.9 Technology Roadmap, 2025-2035
- 15.10 Risks of Obsolescence and Technology Substitution
Chapter 16 Global Respiratory Devices Market Key Strategic Imperatives
- 16.1 Growth and Market Entry Priorities
- 16.2 High-Return Products and Segments
- 16.3 Pricing, Profitability and Cost Optimization
- 16.4 Technology Investment and Product Differentiation
- 16.5 Supply Chain Localization and Resilience
- 16.6 Distribution and Customer Acquisition
- 16.7 Partnership, Acquisition and Capacity Strategy
- 16.8 Regional Expansion Priorities
- 16.9 Short-, Medium- and Long-Term Actions
Chapter 17 Competition Outlook
- 17.1 Industry Competition Characteristics
- 17.2 Market Structure and Concentration
- 17.3 Market Share and Competitive Positioning, 2025
- 17.4 Company-Wise Revenue and Product Benchmarking
- 17.5 Production and Service Capacity Benchmarking
- 17.6 Technology, Pricing and Differentiation
- 17.7 Regional Footprint and Distribution Strength
- 17.8 Mergers, Acquisitions and Strategic Alliances
- 17.9 New Entrants and Competitive Threats
- 17.10 Porter's Five Forces and Industry Attractiveness
- 17.11 Competitive Outlook, 2025-2035
Chapter 18 Company Profiles
- 18.1 Company Coverage and Selection Criteria
- 18.2 Koninklijke Philips N.V.
- 18.2.1 Business Description
- 18.2.2 Company Ownership and Geographic Presence
- 18.2.3 Product and Service Portfolio
- 18.2.4 Manufacturing and Operating Footprint
- 18.2.5 Production Capacity and Expansion Plans
- 18.2.6 Financial Performance and Investment
- 18.2.7 Market Share and Competitive Position
- 18.2.8 Technology and Innovation Capabilities
- 18.2.9 Strategic Alliances or Partnerships
- 18.2.10 Recent Developments
- 18.2.11 Growth Strategy and Outlook
- 18.3 Medtronic
- 18.4 ResMed Inc.
- 18.5 Fisher & Paykel Healthcare Limited
- 18.6 Dragerwerk AG & Co. KGaA
- 18.7 Masimo
- 18.8 Nihon Kohden Corporation
- 18.9 GE Healthcare
- 18.10 ICU Medical, Inc.
- 18.11 Hamilton Medical
- 18.12 Rotech Healthcare, Inc.
- 18.13 Nonin
- 18.14 Other Relevant Market Participants
Note: Every listed company is profiled on the structure shown under the first company. The company list is preliminary and may change based on research findings, market developments, data availability and client requirements.
Chapter 19 Disclaimer
- 19.1 Research and Forecast Disclaimer
- 19.2 Data Source and Estimation Limitations
Note: The depth of individual sections depends on data availability for this market. Volume, capacity, trade and other unit-based metrics are included where applicable.

