
General dentists and digital scans widen aligner access
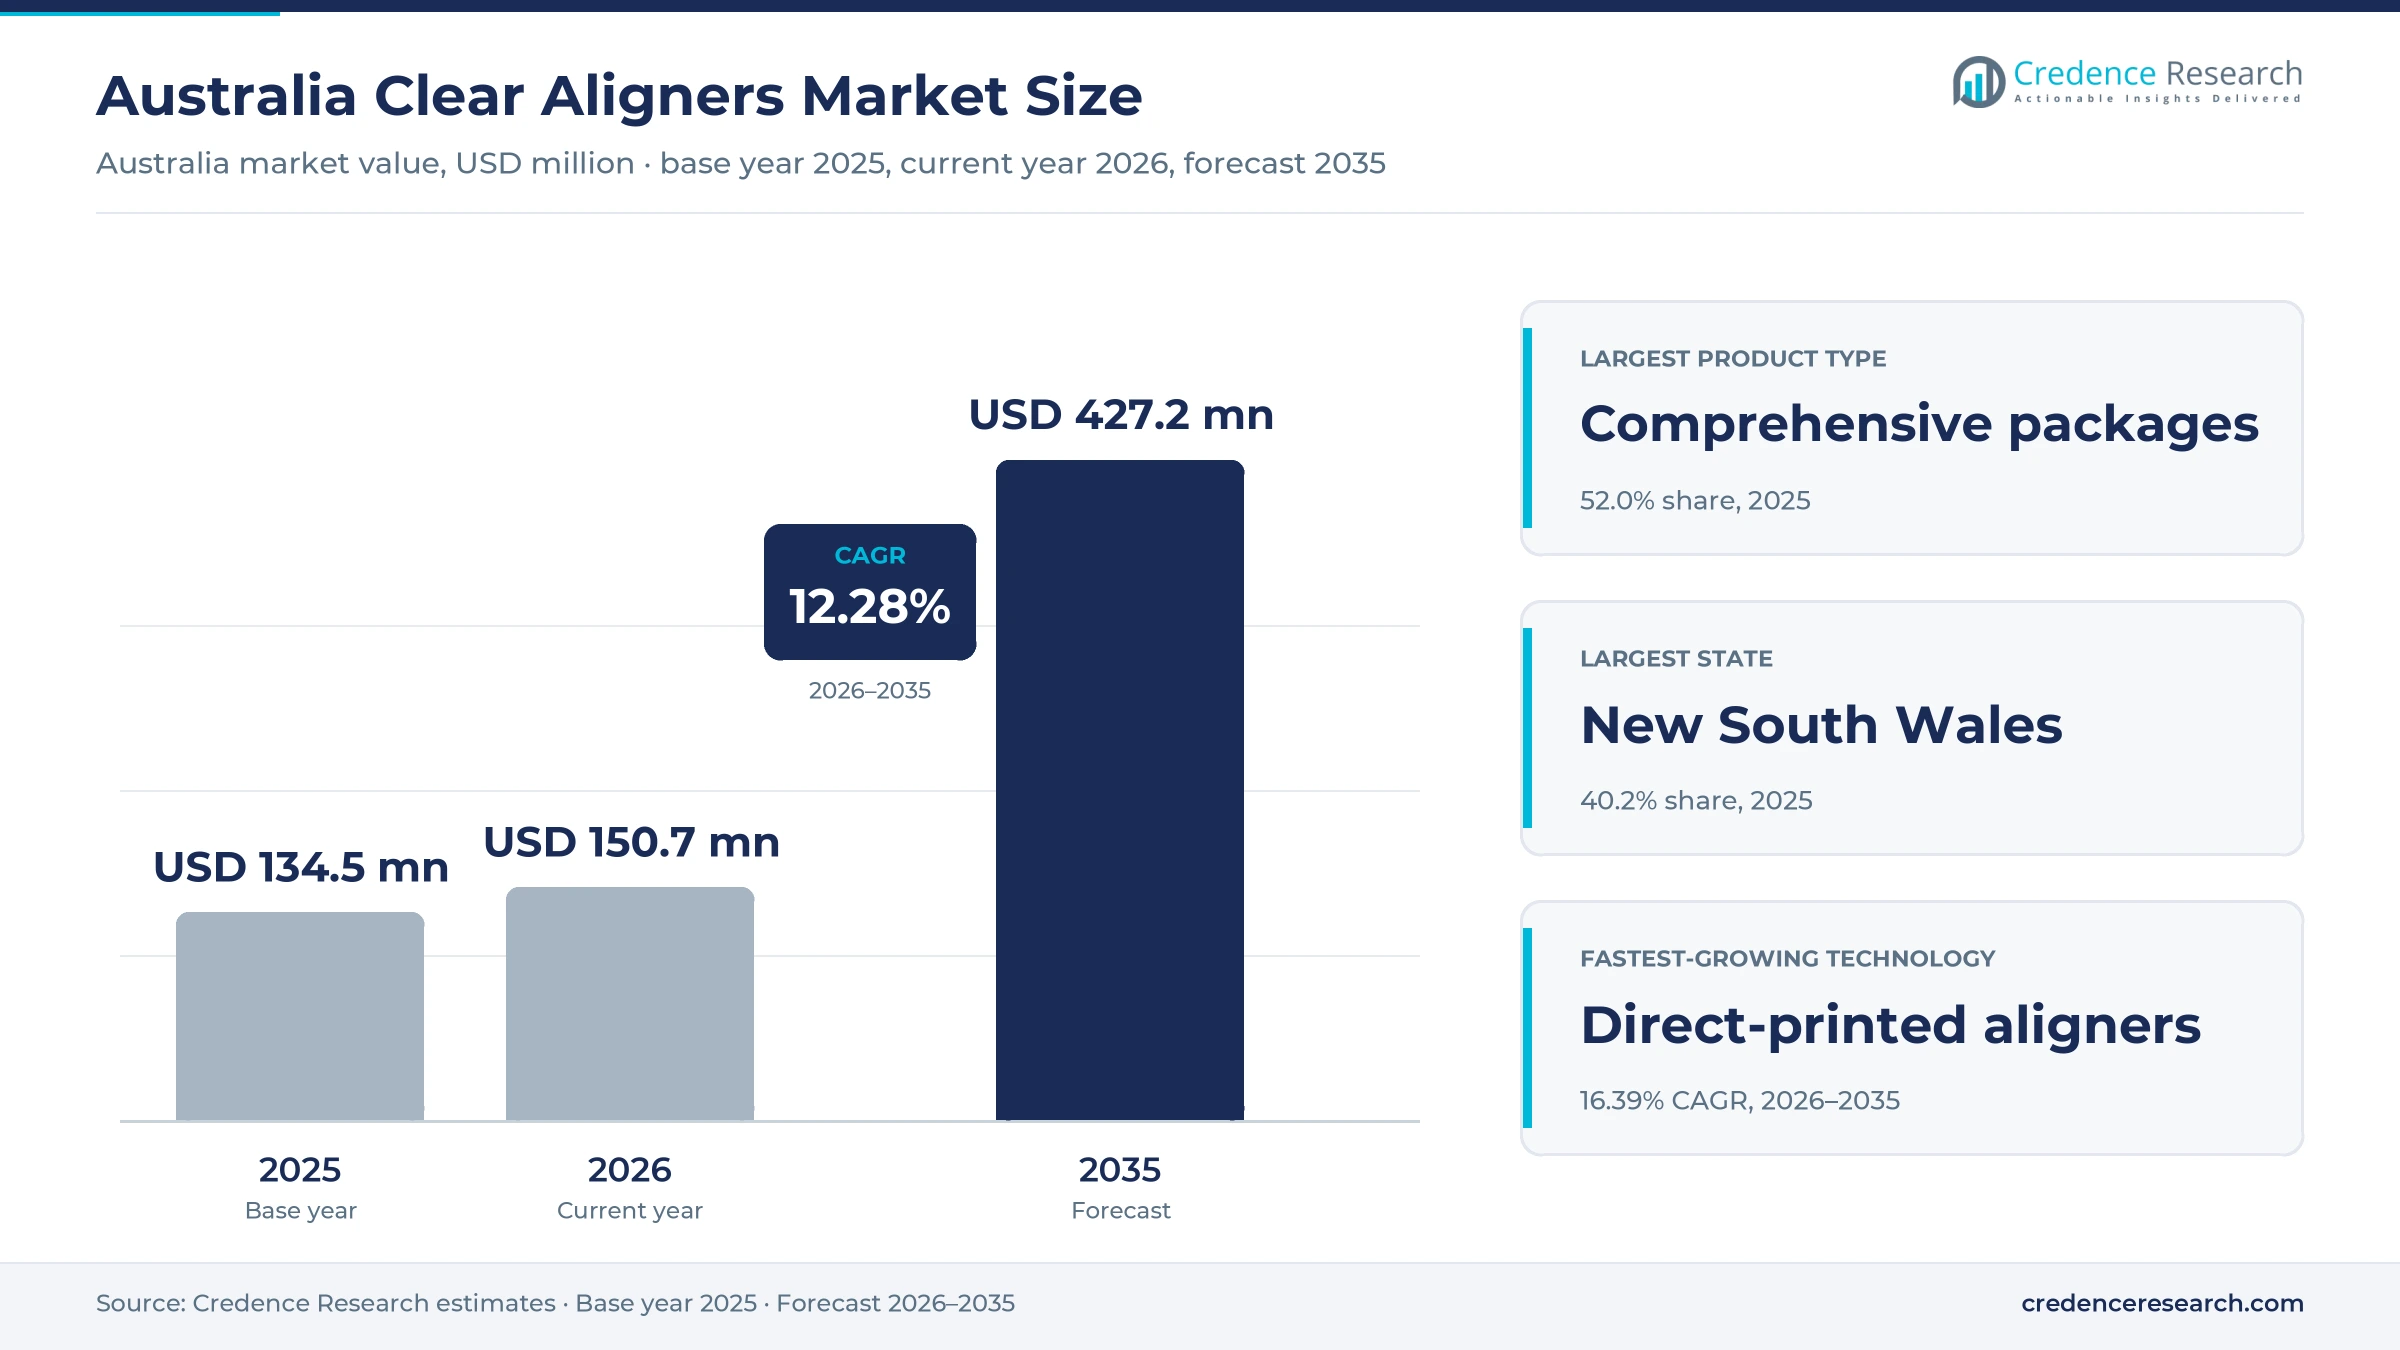
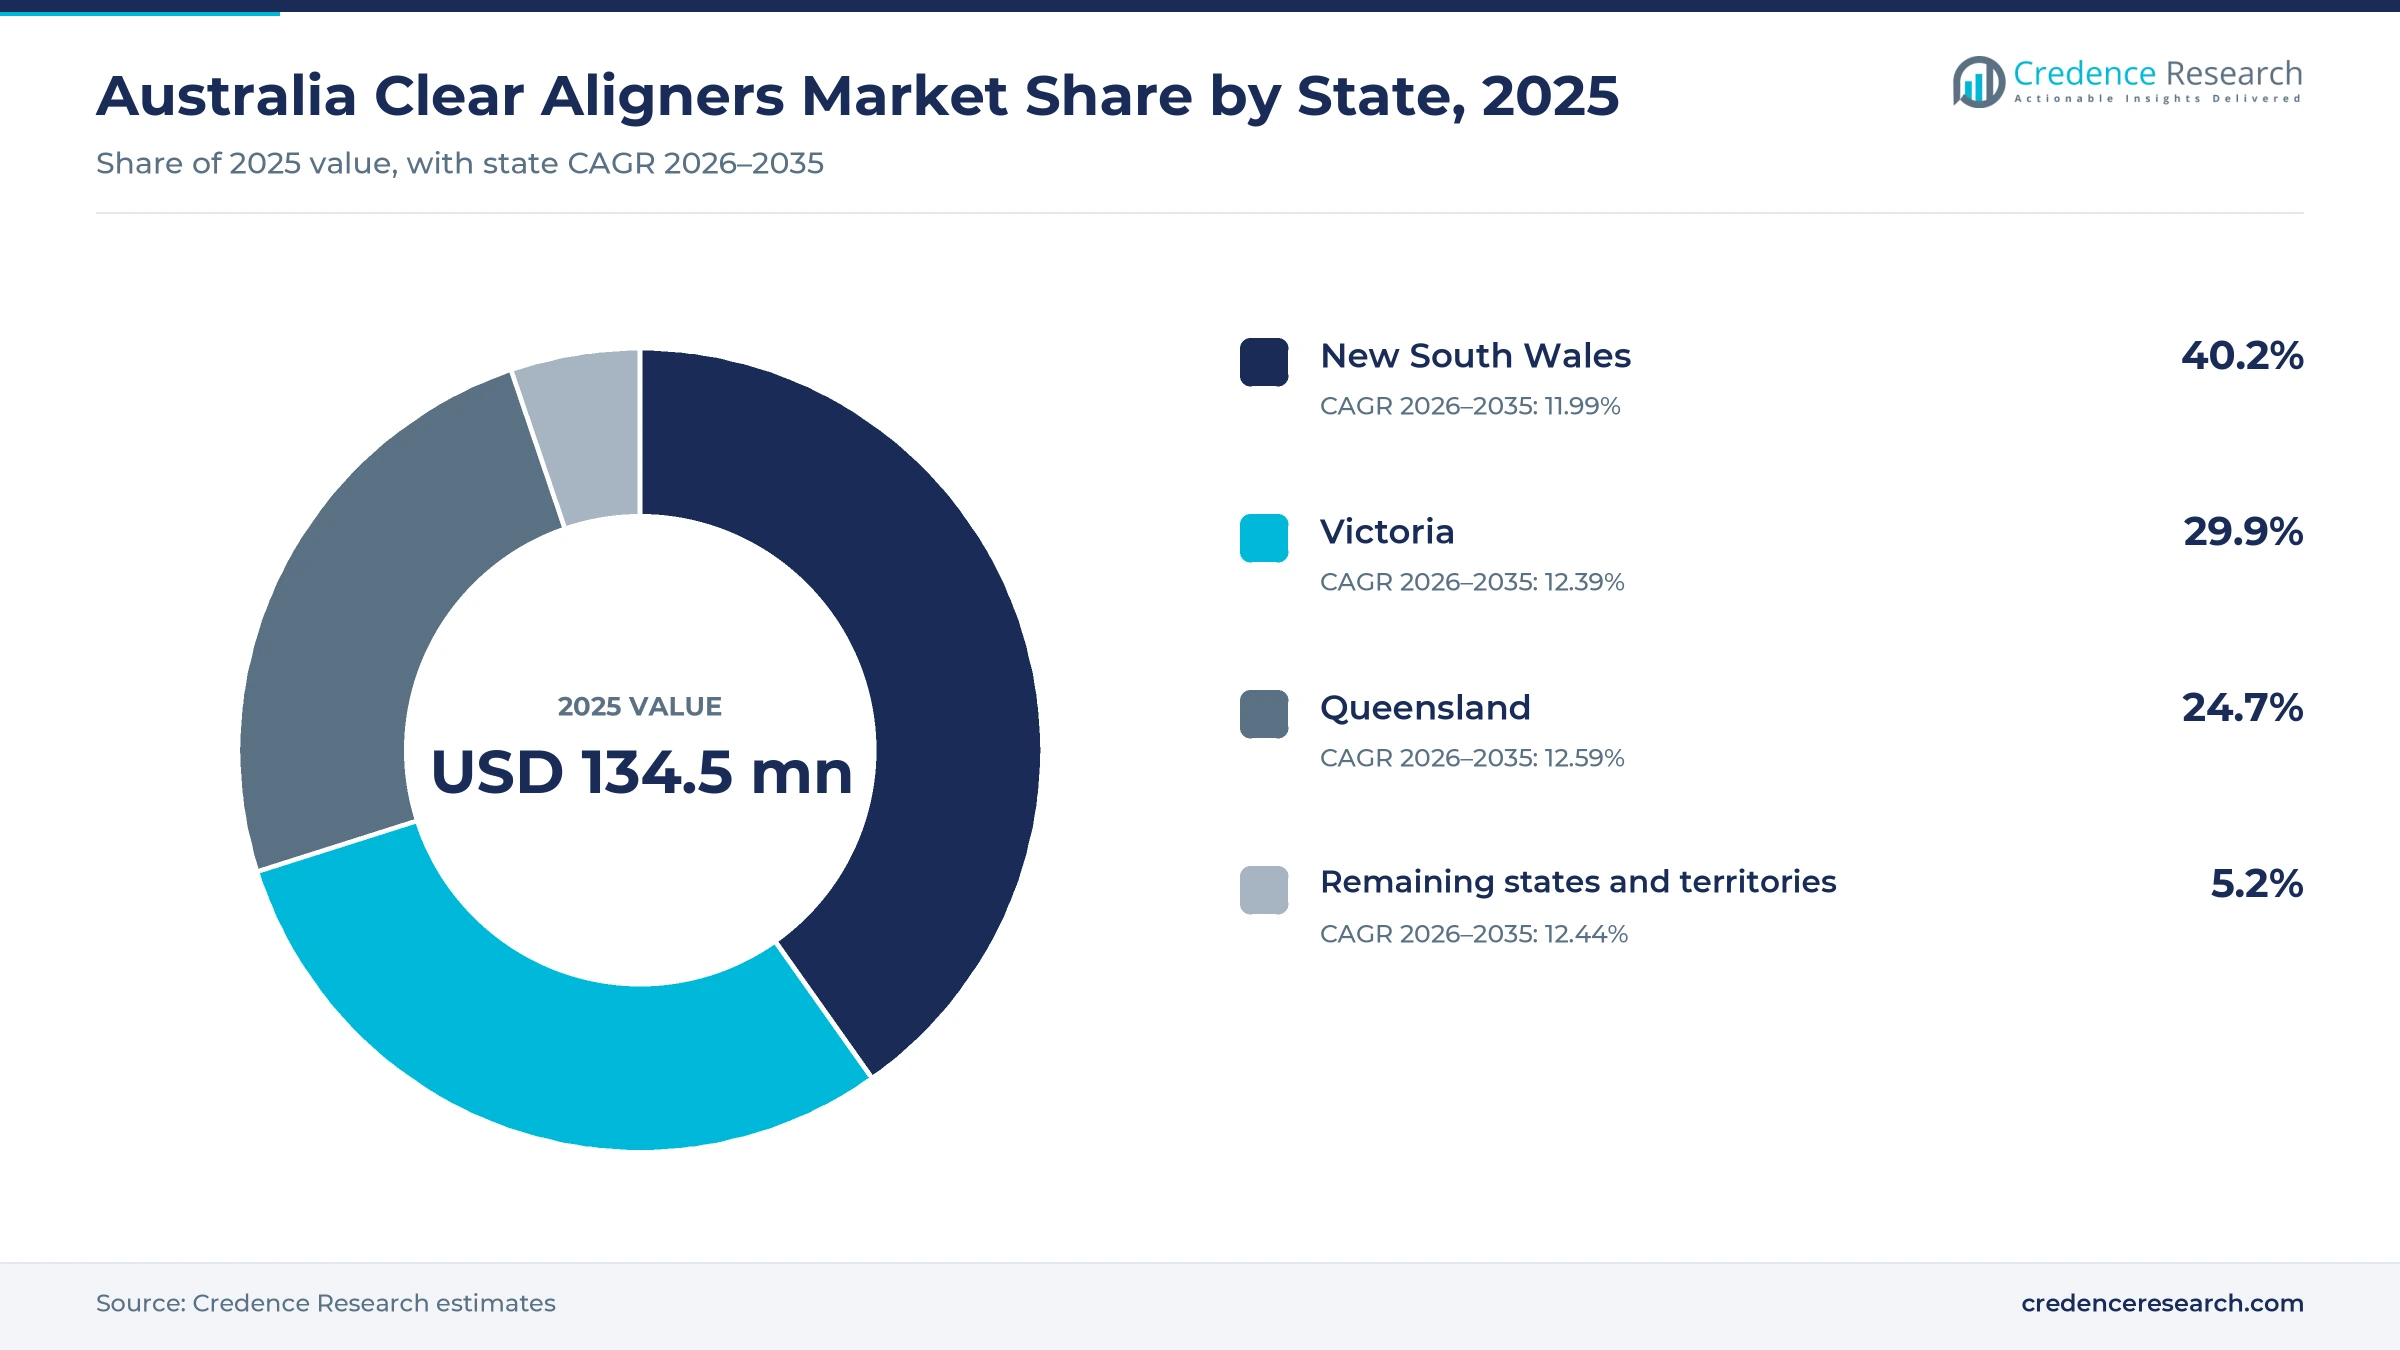
The Australia clear aligners market was valued at USD 134.5 million in 2025 and is projected to increase from USD 150.7 million in 2026 to USD 427.2 million by 2035, registering a CAGR of 12.28% during 2026–2035. Demand comes from specialist orthodontists and general dentists who prescribe custom tray series for crowding, spacing and bite problems, paid mostly by patients and partly by private extras cover. New South Wales held the largest state share, 40.2% in 2025, because Sydney has the biggest concentration of practices and adult patients in the country. Queensland is the fastest-growing state at 12.59% a year, as its population expands faster than the national average. However, the care model is changing, because the main mail-order provider left the country in December 2023 and dental bodies now insist on in-person examination before any orthodontic treatment begins.
Which aligner treatments and buyers does the estimate cover?
The estimate measures the value of custom clear aligner treatment supplied in Australia, including comprehensive, moderate and limited treatment packages sold to orthodontic and general dental practices or directly to patients. It counts thermoformed and direct-printed trays, together with the digital treatment planning included in the case fee charged by each manufacturer.
The estimate excludes fixed braces, stock retainers, whitening trays, intraoral scanner hardware and the clinical fees that practices add on top of the manufacturer price. The value chain runs from material and software suppliers through aligner manufacturers and dental laboratories to the clinicians and patients who use the trays.
Australia Clear Aligners Market Insights
- The Australia clear aligners market was valued at USD 134.5 million in 2025 and is projected to reach USD 427.2 million by 2035, registering a CAGR of 12.28% during 2026–2035.
- New South Wales held a 40.2% share of 2025 value, because the state had about 8.67 million residents at March 31, 2026, the largest population in Australia.
- Comprehensive treatment packages led with a 52.0% share of 2025 value, because specialist orthodontists use full tray series for moderate and severe malocclusion.
- A 2024 survey of 264 registered general dentists found that 65.2% already provide clear aligner therapy, with most cases focused on mild crowding.
- Direct-printed aligners grow fastest at 16.39% a year during 2026–2035, as manufacturers move from thermoforming toward direct 3D printing of appliances.
Comprehensive cases lead while limited packages grow fastest
Why do comprehensive packages hold the largest value?
Based on product type, the market is categorized into comprehensive treatment packages, moderate treatment packages and limited treatment packages. Comprehensive treatment packages led with a 52.0% share of 2025 value, because specialists treat complex crowding and bite cases with long tray series and refinements. Limited treatment packages grow fastest at 13.09% a year, as general dentists favor short courses for mild crowding.
How do specialist practices anchor treatment value?
Based on care setting, the market is categorized into specialist orthodontic practices, general dental practices and remote-led care networks. Specialist orthodontic practices led with a 50.0% share of 2025 value, because orthodontists handle most comprehensive cases. General dental practices grow fastest at 13.10% a year, as manufacturers train family dentists and supply scan-based ordering systems.
Why do young adults account for the most value?
Based on end user, the market is categorized into children under 13, adolescents aged 13-17, adults aged 18-34 and adults aged 35 and above. Adults aged 18-34 led with a 38.0% share of 2025 value, because working adults pay for discreet treatment themselves. Children under 13 grow fastest at 13.51% a year, as printed expanders and early treatment systems reach younger patients.
How does thermoforming still dominate production?
Based on technology, the market is categorized into single-layer thermoformed aligners, multilayer thermoformed aligners and direct-printed aligners. Single-layer thermoformed aligners led with a 62.0% share of 2025 value, because most brands still press sheets over printed models. Direct-printed aligners grow fastest at 16.39% a year, as printing removes the model step and adds design freedom.
| Segment Group | Leading Sub-segment | Share, 2025 | Fastest-growing Sub-segment | CAGR, 2026–2035 |
|---|---|---|---|---|
| By Product Type | Comprehensive treatment packages | 52.0% | Limited treatment packages | 13.09% |
| By Care Setting | Specialist orthodontic practices | 50.0% | General dental practices | 13.10% |
| By End User | Adults aged 18-34 | 38.0% | Children under 13 | 13.51% |
| By Technology | Single-layer thermoformed aligners | 62.0% | Direct-printed aligners | 16.39% |
Request a Free Sample
Fill in your details and we'll send you a free sample report.
- Sample data tables & charts
- Research methodology
Dentist uptake, scanning and younger patients lift demand
How does general dental practice activation widen access?
Family dentists now start a large share of aligner cases, which takes treatment beyond the limited number of specialist clinics. A 2024 study of 264 registered general dentists, published through the University of Adelaide, found that 65.2% already provide clear aligner therapy. Invisalign was the most used system at 61.2%, while 41.7% of these dentists used more than one brand. Straumann also ran a fully booked ClearCorrect certification day in Perth in May 2025 and another in Sydney in October 2025 at A$500 a seat. Align Technology markets Invisalign Go packages specifically to general practitioners. As a result, general dental practices grow fastest at 13.10% a year during 2026–2035, because each trained dentist can convert existing recall patients into aligner cases.
Why does digital treatment planning integration speed adoption?
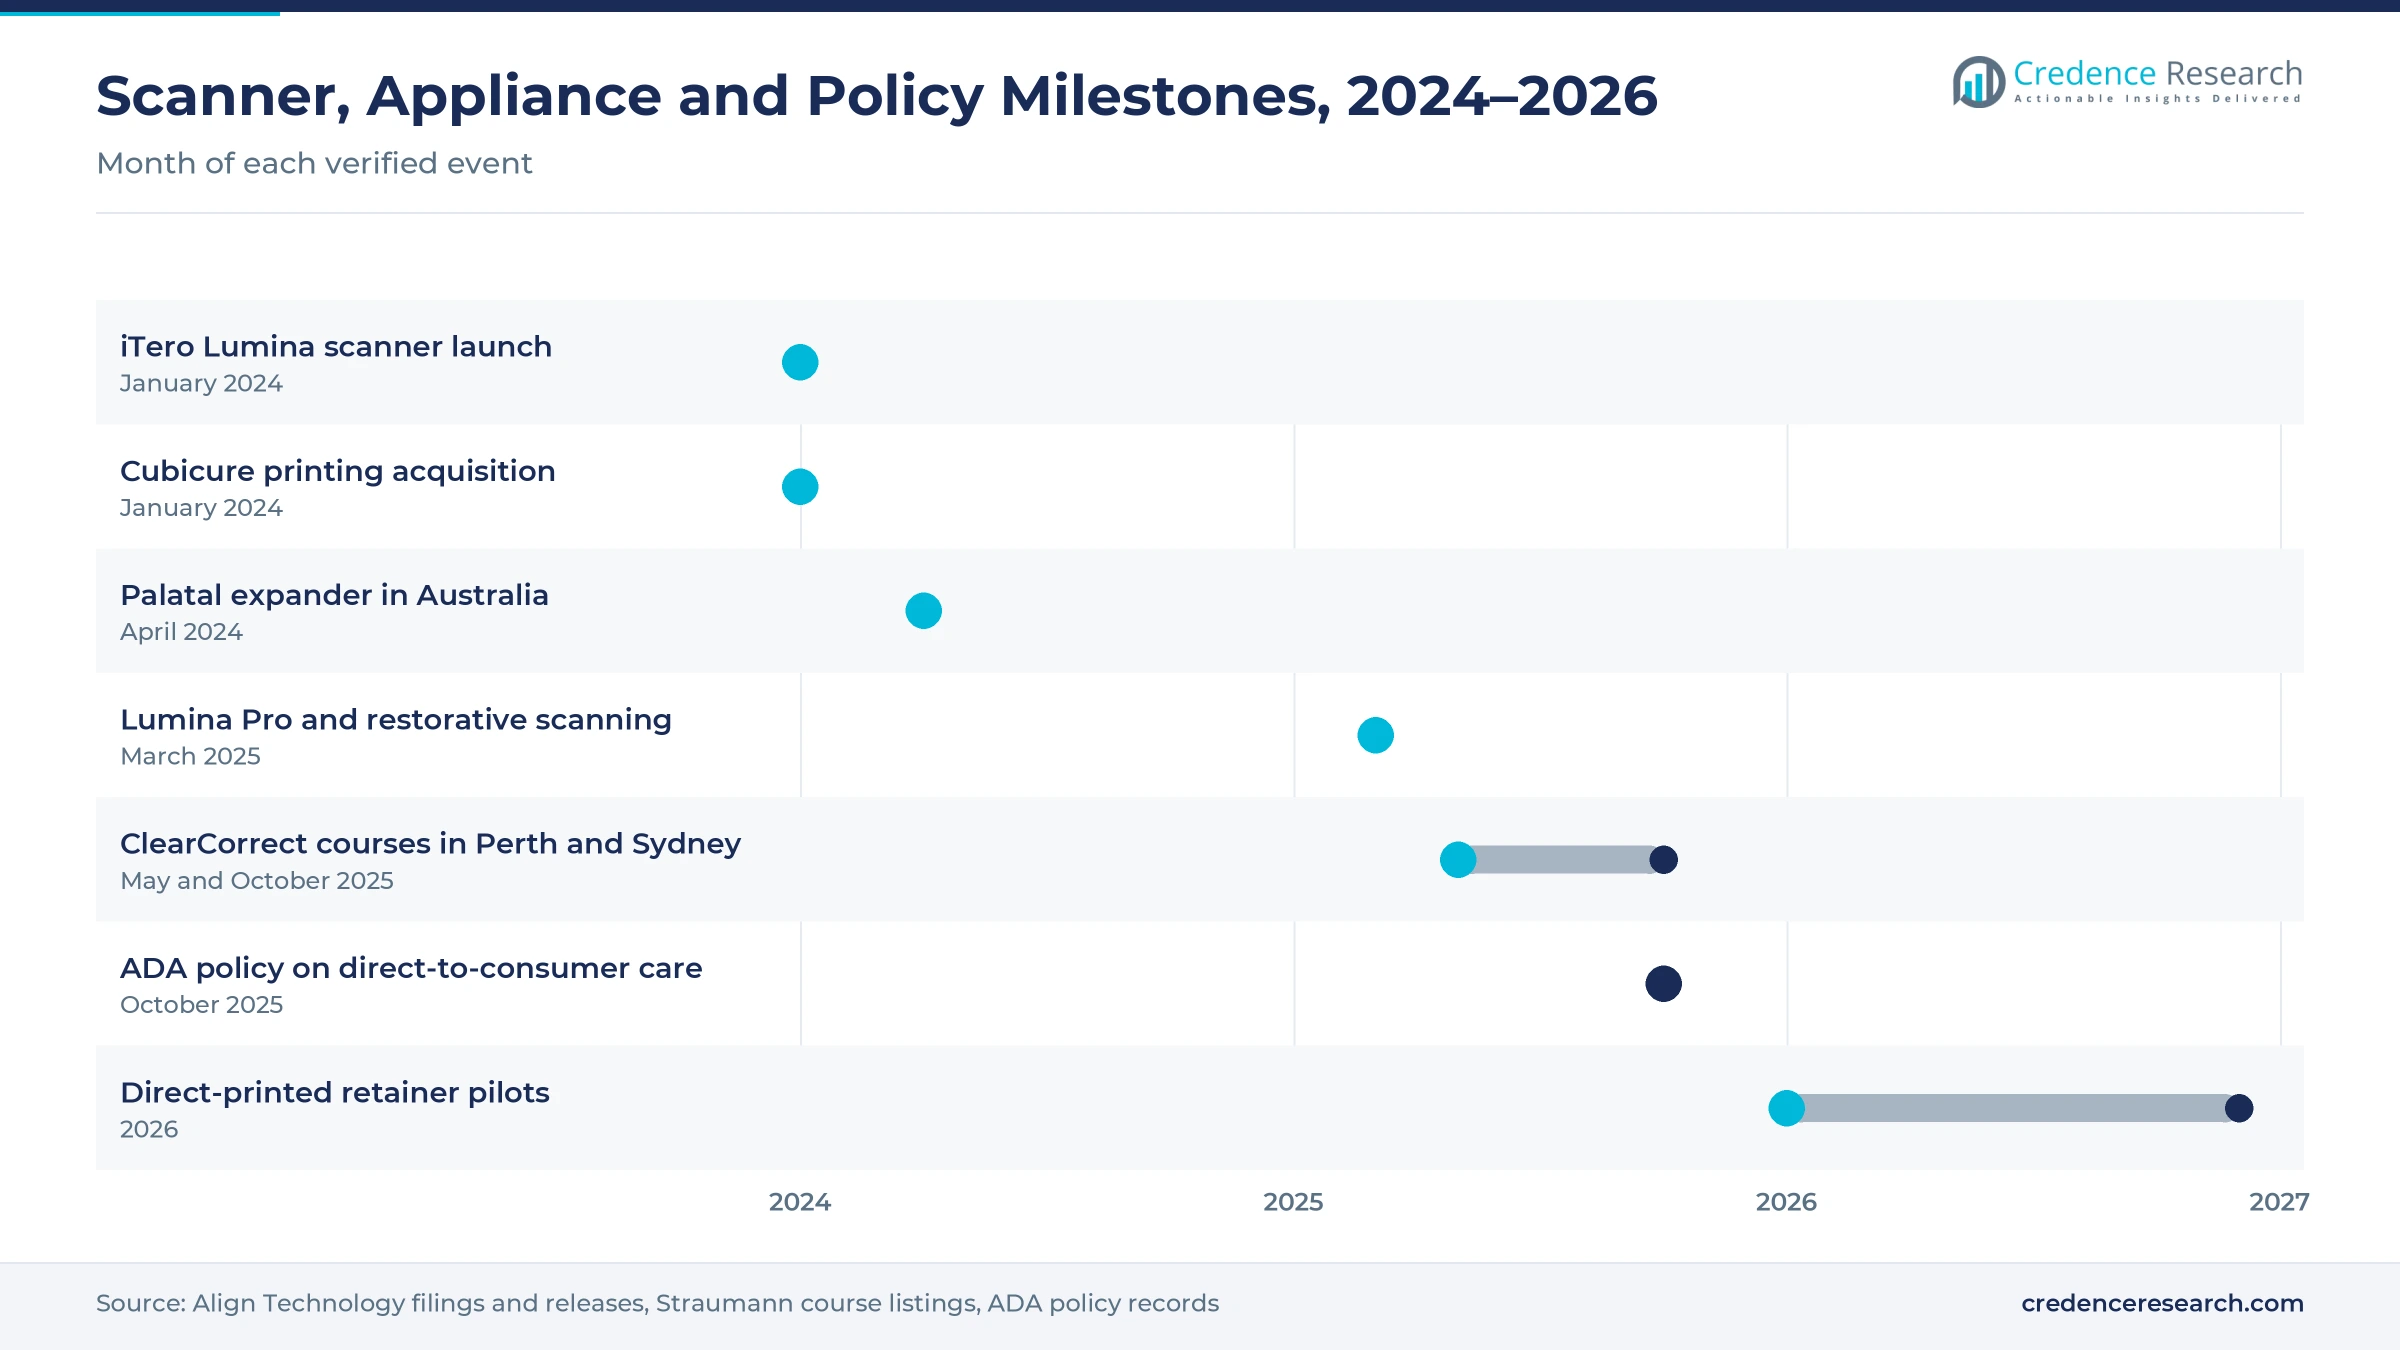
Scan-based planning shortens the path from consultation to tray order, which makes aligners easier to offer in busy practices. Align Technology launched the iTero Lumina scanner in January 2024 with a wand about 50% smaller than its earlier model, then added Lumina Pro in March 2025. Practices that buy intraoral scanners can send digital impressions straight into planning software instead of posting physical molds. uLab Systems offers AI-assisted uDesign planning that takes about 10 minutes, or a concierge plan in under three business days. Dentsply Sirona also added a SureSmile simulator to its DS Core platform, so patients see a predicted result in the chair. In turn, faster planning lifts case acceptance in general practices.
How is the addressable patient base expanding?
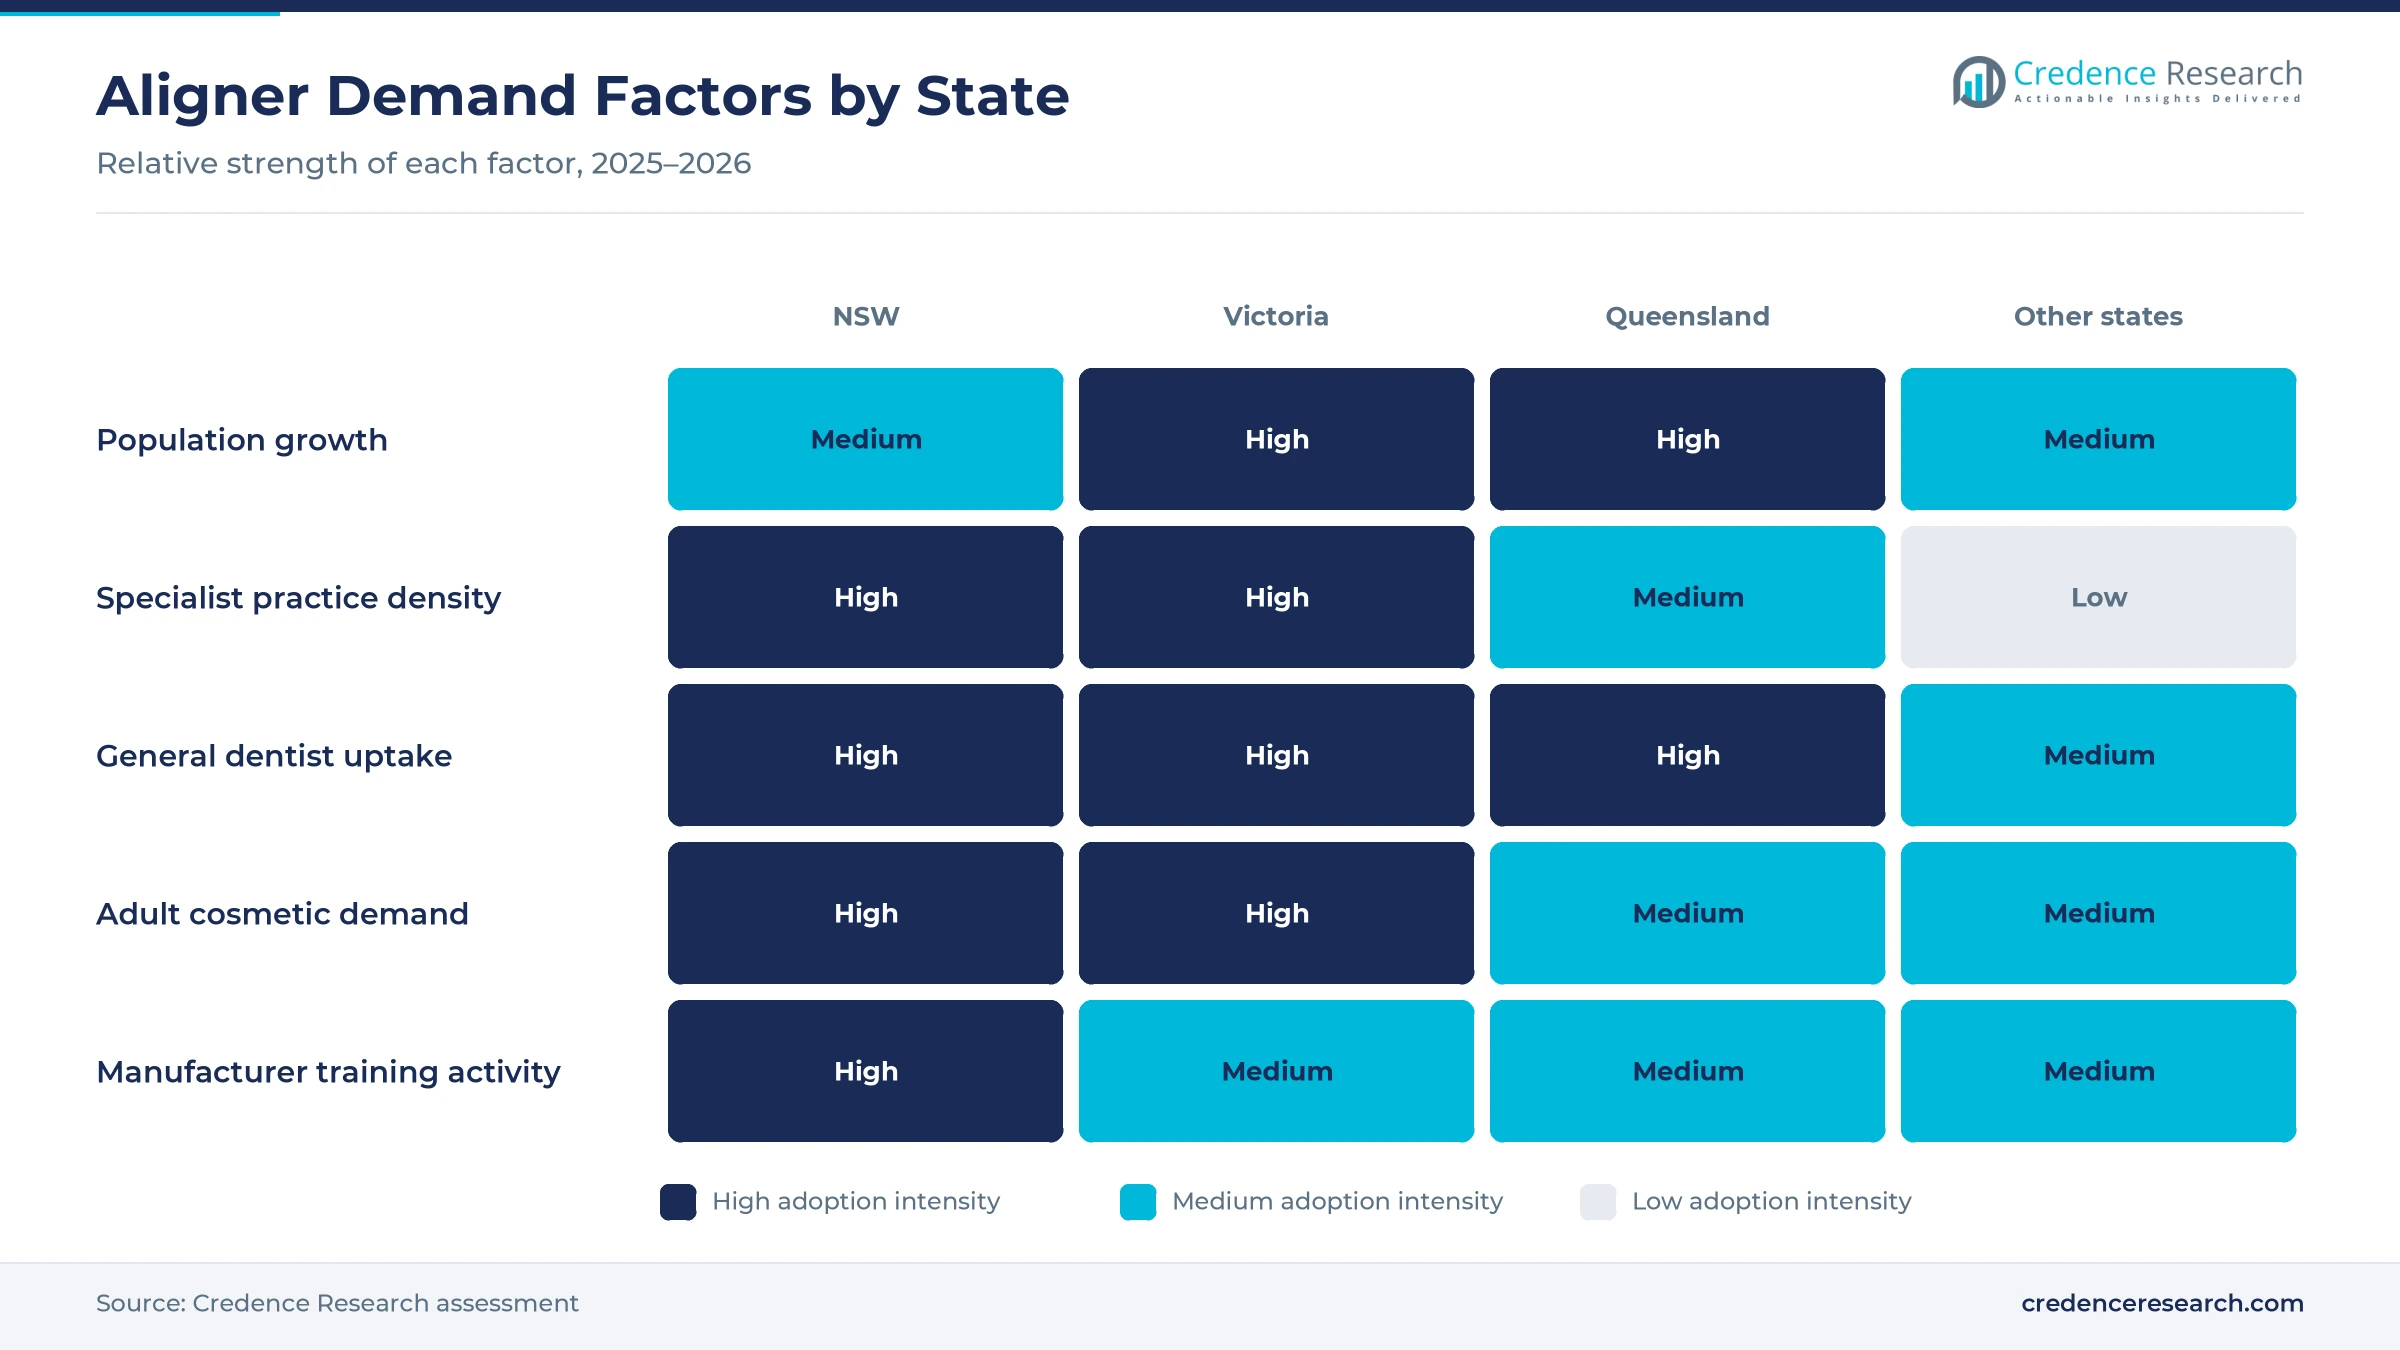
The pool of treatable patients is widening at both ends of the age range, because new appliances now reach growing children and adults who once avoided braces. Children aged 0 to 14 made up 17.7% of the population in 2025, about 4.88 million people, according to World Bank data. Align made its direct-printed Invisalign Palatal Expander available in Australia in April 2024 after inclusion on the national device register. The company says early interceptive treatment accounts for about 20% of orthodontic case starts, typically at ages 6 to 10. Australia also added 392,700 residents in the year to March 2026. As a result, children under 13 grow fastest at 13.51% a year during 2026–2035.
Why does private extras cover support treatment spending?
More than half of Australians hold insurance that pays part of orthodontic bills, which makes longer aligner courses easier to accept. At June 30, 2026, 15,525,399 people, or 55.5% of the population, held some form of general treatment cover, according to the prudential regulator. Insurers paid A$1,001.79 million in dental benefits in the June 2026 quarter across about 14.7 million dental services. The average dental benefit was A$68 per service, so patients still fund most of an aligner course themselves. However, most funds pay orthodontic items only after a face-to-face consultation. In turn, specialist orthodontic practices hold 50.0% of 2025 value, because insured patients favor clinic-based treatment.
Supervised care and printed appliances reshape supply
How is the shift toward clinician-supervised care reshaping demand?
Mail-order treatment has lost ground to practice-based care, because enforcement action and a high-profile exit weakened the remote model. The Federal Court ordered SmileDirectClub to pay A$3.5 million in penalties in November 2022, according to the competition regulator, after at least 26,300 Australians signed up for treatment priced between A$2,499 and A$3,155. The regulator said insurers representing 98.5% of the private health insurance market did not cover that remote treatment. SmileDirectClub then closed its Australian operations on Dec. 9, 2023, according to a SmilePath statement. As a result, remote-led care networks hold the smallest care-setting share, while practices absorb patients who still want discreet treatment.
Why is the rise of printed appliances and new resins notable?
Manufacturers are moving from pressed sheets to printed and layered designs, which changes how trays are made and how much force they hold. Align Technology acquired the direct 3D printing company Cubicure in January 2024 and plans limited pilots of direct-printed retainers and attachments in 2026, according to its 2025 annual filing. Its palatal expander, already sold in Australia, is a direct-printed device. Ormco says orthodontists in Australia helped develop and pilot its Spark aligners, which use a multilayer TruGEN material. Demand for dental printing resins rises with each of these manufacturing programs. In turn, direct-printed aligners grow fastest at 16.39% a year during 2026–2035.
Can general dentists close specialist gaps outside capitals?
Family dentists in regional towns can reach patients that specialists rarely see, because the orthodontist workforce is small, metropolitan and aging. A 2024 survey of Australian Society of Orthodontists members, published in the Australasian Orthodontic Journal in April 2025, invited 514 qualified orthodontists. Of those who responded, 48.3% worked only in metropolitan areas and 29.9% planned to retire within five years. The same survey found that 43.6% worked mostly as solo practice owners, which limits capacity to absorb new patients. Western Australia also grew its population 2.1% in the year to March 2026. As a result, manufacturers that train regional dentists and support them with remote specialist review can reach patients far from city clinics.
Is there room to grow in limited packages for mild cases?
Short tray series give general practices a clear opening, because most dentists feel comfortable with simple cases but avoid complex ones. The University of Adelaide study found that 98.4% of responding dentists were comfortable treating mild crowding, while 73.4% were not comfortable with severe crowding. uLab Systems entered Australia in July 2022 with pay-per-aligner pricing from A$35 and a case fee ceiling of A$1,750. ClearCorrect also sells limited options of up to six and up to 12 tray sets. In turn, limited treatment packages grow fastest at 13.09% a year during 2026–2035, because they match the case mix that general practices treat confidently.
Remote-care risk, workforce gaps and cost limit uptake
How does remote-care risk weigh on patient trust?
Failed mail-order treatments created remedial work for orthodontists and negative publicity for the whole category. The Australian Dental Association amended its policy on direct-to-consumer dentistry on Oct. 24, 2025, and it still calls for an in-person examination before orthodontic treatment. SmileDirectClub alone signed up at least 26,300 Australian customers between May 2019 and October 2020. As a result, remote-led networks face higher compliance costs and limited insurer support. Providers respond by adding clinic checks, registered clinician oversight and clearer consent.
Why do orthodontist workforce gaps slow complex cases?
Comprehensive aligner treatment still needs specialist planning and supervision, which few regional towns can offer locally. Many specialists work only in capital cities, and a large group plans to retire within five years. The same 2024 workforce survey invited only 46 orthodontic trainees, which points to a small pipeline of new specialists. In turn, patients in regional towns face long travel or waiting times for complex bite correction. Practices respond with visiting clinics, shared care with general dentists and remote specialist review of treatment plans.
How does case complexity limit general practice outcomes?
Severe crowding and skeletal bite problems need diagnostic and biomechanical skills that many general dentists lack. Poorly selected cases can need refinements, extra trays or a later switch to fixed braces. The Adelaide study found that 73.4% of responding dentists were not comfortable treating severe crowding. As a result, practices risk cost overruns and unhappy patients when they treat beyond their experience. Manufacturers respond with case difficulty scoring, mentoring programs and referral pathways to specialists.
Why do cost and insurance gaps restrain uptake?
Aligner treatment is elective, so patients usually pay most of the bill themselves rather than through their insurers. Extras cover pays only a small part of a typical course, and annual limits reset each year. Even the mail-order courses sold before 2023 cost patients several thousand dollars per treatment. In turn, price-sensitive families may delay or choose shorter treatment. Practices respond with payment plans, staged packages and limited treatment options that lower the first payment for patients.
New South Wales leads while Queensland grows fastest
| State | Value, 2025 (USD million) | Share, 2025 | CAGR, 2026–2035 |
|---|---|---|---|
| New South Wales | 54.1 | 40.2% | 11.99% |
| Victoria | 40.2 | 29.9% | 12.39% |
| Queensland | 33.2 | 24.7% | 12.59% |
| Remaining states and territories | 7.0 | 5.2% | 12.44% |
New South Wales leads, but what drives its top share?
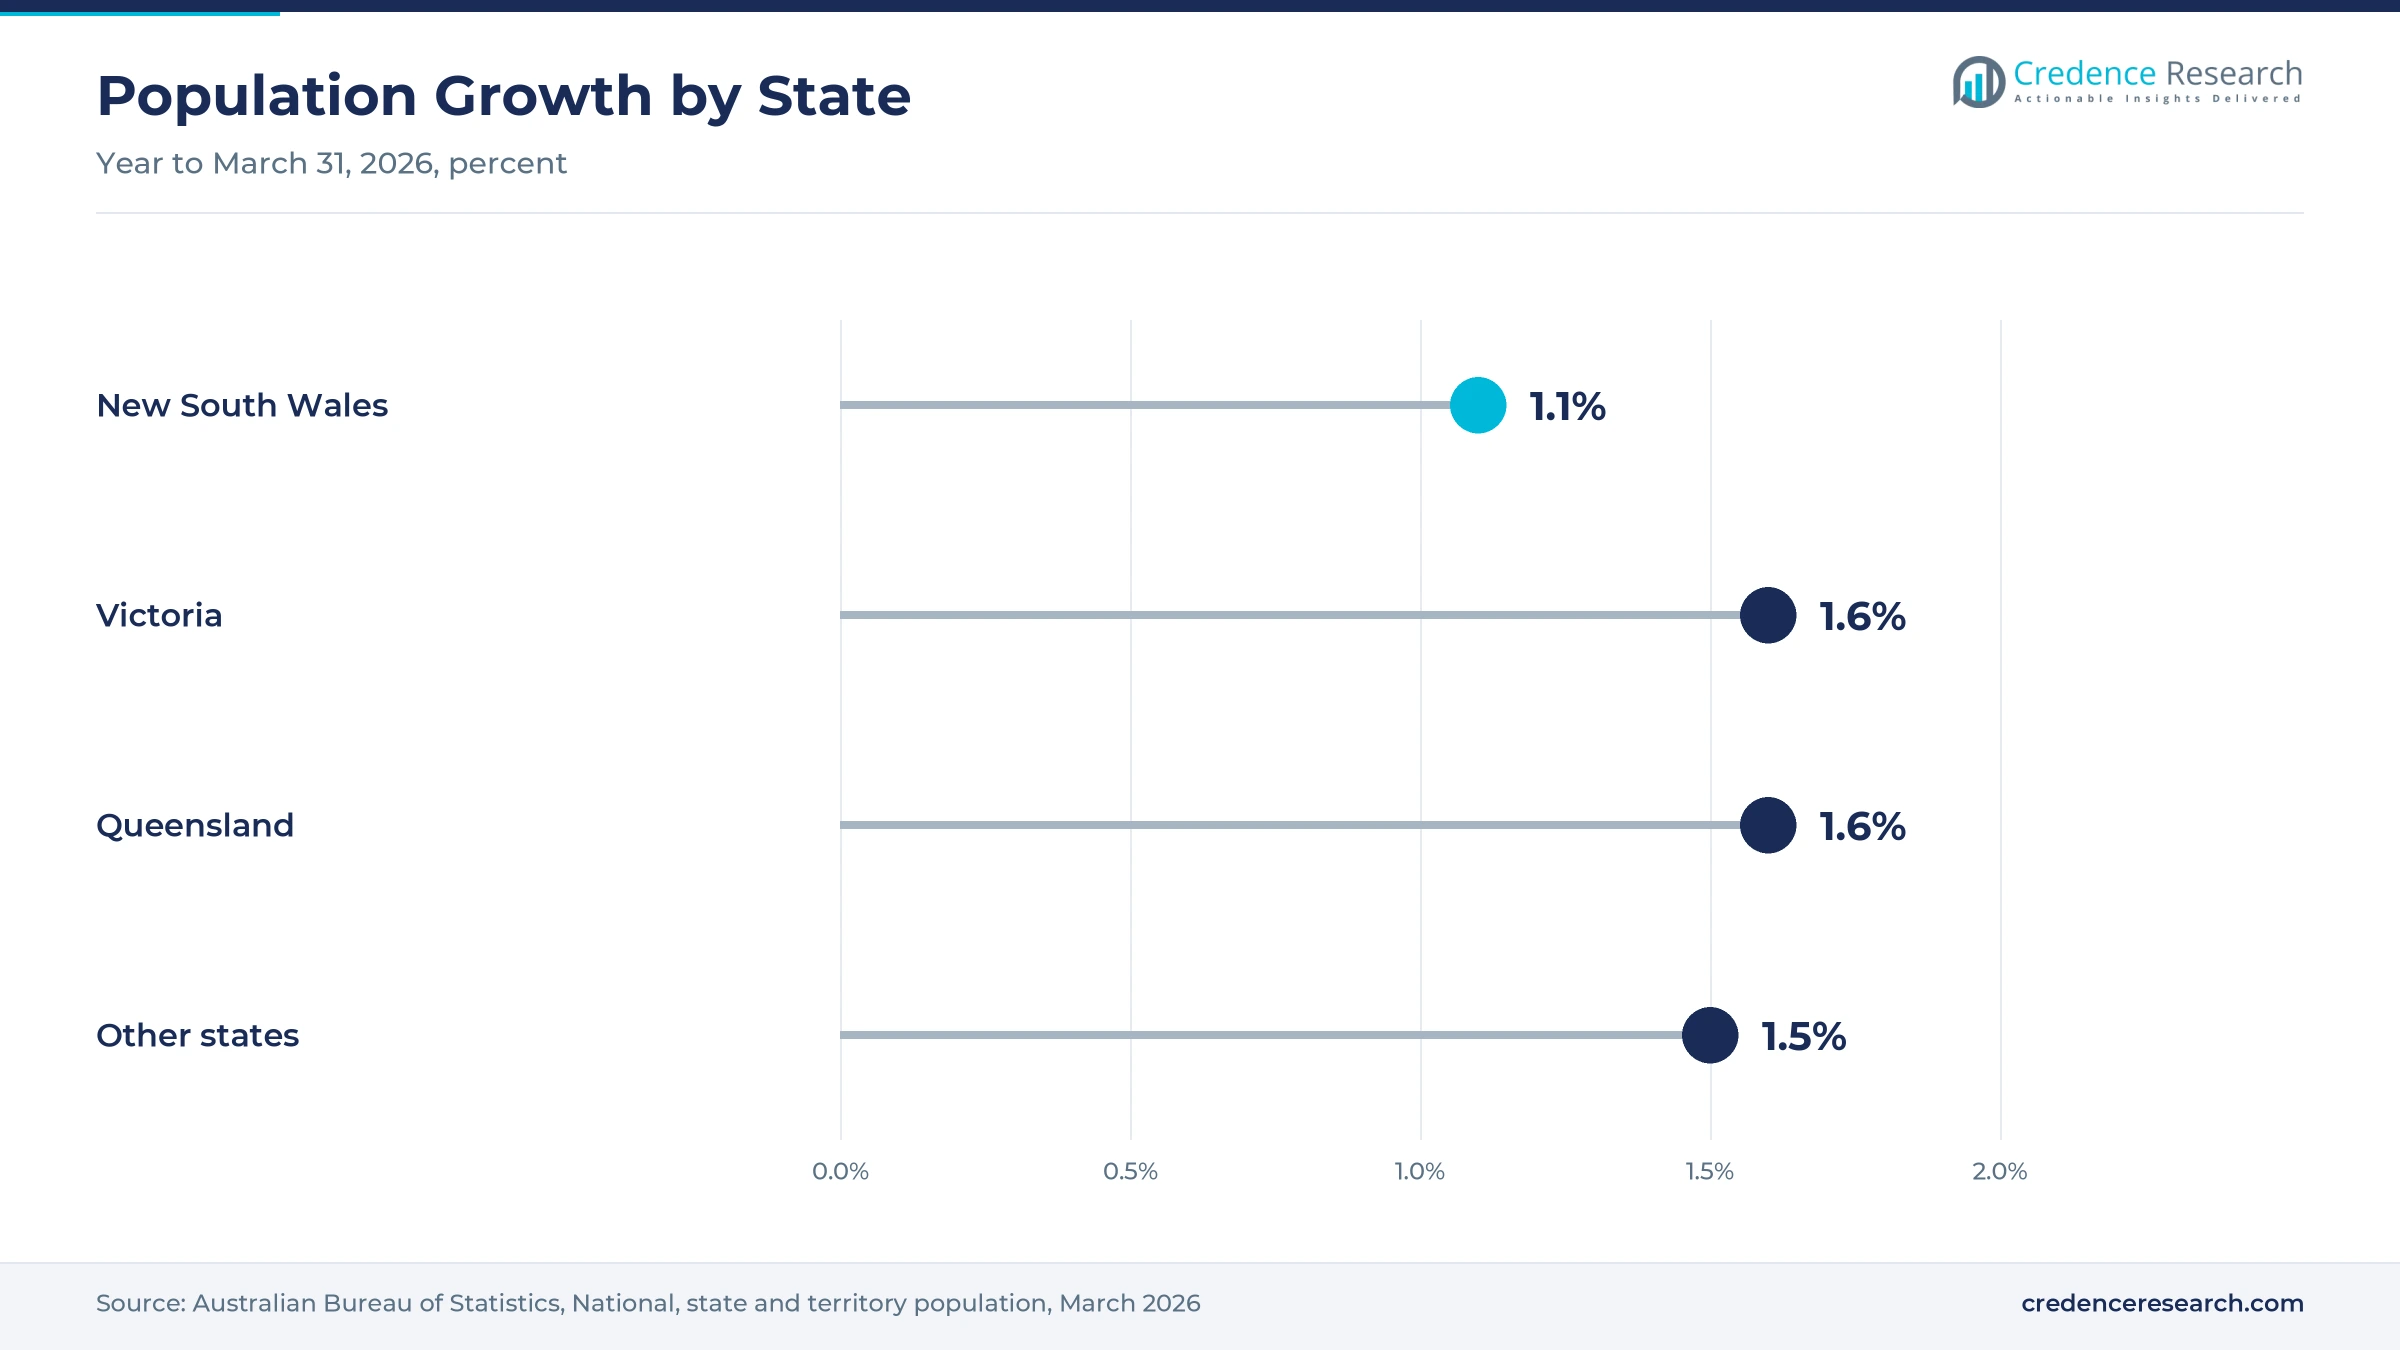
New South Wales held a 40.2% share of 2025 value and grows at 11.99% a year, because the state had about 8.67 million residents at March 31, 2026. Greater Sydney is the largest city in the country, which concentrates adult demand for discreet treatment. Straumann also held a ClearCorrect certification course in central Sydney in October 2025 for 25 participants. As a result, the state leads adult demand even though its population grew only 1.1% in the latest year.
How does Victoria support aligner demand?
Victoria held a 29.9% share of 2025 value and grows at 12.39% a year, because the state added 109,500 residents in the year to March 2026, the largest gain in the country. Melbourne is home to SmileStories, a concierge service founded in 2022 that partnered with ClearCorrect in June 2023 to match patients with clinicians. In turn, Victoria combines strong population growth with an active network of practices that offer aligners to working adults.
Why is Queensland growing fastest?
Queensland held a 24.7% share of 2025 value and grows fastest at 12.59% a year, because the state added 90,100 residents in the year to March 2026, a growth rate of 1.6%. Population growth across Brisbane and the Gold Coast adds families, which raises demand for adolescent and early treatment. Regional towns also rely heavily on general dentists for orthodontic care. As a result, Queensland gains the most from dentist-led aligner programs.
What drives demand in the remaining states and territories?
The remaining states and territories held a 5.2% share of 2025 value and grow at 12.44% a year during 2026–2035. Western Australia grew its population fastest at 2.1% in the year to March 2026, and a Perth ClearCorrect course in May 2025 was fully booked. South Australia, Tasmania and the territories grew more slowly, so practice expansion there depends on training and remote specialist support.
Scanner, expander and policy milestones since 2024
| Development | Status and market relevance |
|---|---|
| In January 2024, Align Technology launched the iTero Lumina intraoral scanner with a wand about 50% smaller than its predecessor. | Speeds digital impressions for aligner cases |
| In April 2024, Align Technology made the direct-printed Invisalign Palatal Expander available in Australia and New Zealand. | Extends aligner treatment to growing children |
| In March 2025, Align Technology added restorative capability and the Lumina Pro model to its scanner range. | Links aligner planning with general dental workflows |
| In May 2025, Straumann ran a fully booked ClearCorrect certification course in Perth for local dentists. | Shows training demand among general dentists |
| In October 2025, the Australian Dental Association amended its policy on direct-to-consumer dentistry. | Reinforces in-person examination before treatment |
Scanning, planning software and new resins steer cases
- Intraoral scanning replaces putty impressions with digital models, which lets practices send cases to planning software within minutes and shortens the time to the first tray.
- Treatment planning software stages each tooth movement and shows patients a predicted smile, which helps dentists explain options and lifts case acceptance in the chair. Practices often pair it with dental imaging to check roots and bone before movement starts.
- Multilayer thermoforming materials combine stiff and soft layers in one sheet, which holds force longer and improves comfort compared with older single-layer trays.
- Direct 3D printing builds appliances straight from the digital design without a printed model, which cuts waste and allows shapes such as palatal expanders that thermoforming cannot easily make.
Need a Custom Version of This Report?
Tailor the scope, geography, or segments to your exact requirements.
- Custom geography or segment scope
- Direct access to our analyst team
Global brands compete for dentists and orthodontists
Competition centers on global brands that sell treatment systems to specialist orthodontists and general dentists, supported by scanners, software and training. Align Technology leads with Invisalign, iTero scanners and a direct-printed palatal expander sold in Australia, and it reported about 130,015 active trained doctors worldwide at the end of 2025. Straumann Group competes through ClearCorrect and runs certification courses in Sydney and Perth. Ormco markets Spark aligners in Australia, while Dentsply Sirona sells SureSmile through its DS Core platform. uLab Systems competes on pay-per-aligner pricing, and Modern Dental Pacific holds a national register listing for a progressive orthodontic appliance system. SmilePath sells at-home treatment under its listed ClearPath brand, which is registered as a progressive appliance system. Companies compete on clinical results, planning speed, price per case, training and the ability to integrate with the scanners that practices already own.
Which aligner suppliers are active in Australian practices?
| Company | Type | Role in the market |
|---|---|---|
| Align Technology | Global aligner and scanner maker | Sells Invisalign, iTero and the palatal expander in Australia |
| Straumann Group | Global dental group | Runs ClearCorrect certification courses in Sydney and Perth |
| Ormco | Orthodontic products maker | Markets Spark aligners piloted with Australian orthodontists |
| Dentsply Sirona | Dental equipment and consumables maker | Offers SureSmile aligners with a DS Core simulator |
| uLab Systems | Aligner software and supply company | Entered Australia in July 2022 with pay-per-aligner pricing |
| Modern Dental Pacific | Dental laboratory group | Holds a register listing for a progressive appliance system |
| SmilePath | At-home treatment provider | Sells ClearPath trays listed on the national device register |
Credence Research view on Australian aligner care
Credence Research's view is that Australian aligner demand will grow strongly because general dentists, digital scanning and early treatment keep widening the patient pool. Comprehensive packages remain the largest value pool, while limited packages and general practices grow fastest as trained dentists treat mild crowding. The exit of the main mail-order provider pushed demand back toward supervised care. Suppliers that combine reliable planning, strong training and fair case pricing should gain the most share by 2035, while Queensland offers the fastest state growth.
How the national aligner estimate was built
The report uses 2025 as the base year on a calendar basis, and market values come from the Credence Research model. That model combines official population statistics, private health insurance data, practitioner registration data, published clinical surveys and company releases and filings. State shares, segment splits and state growth rates are Credence Research estimates based on population, insurance and practitioner data. Sources used are official statistics, regulator data, peer-reviewed surveys and company materials, and no interviews or surveys were conducted for this report.
Dentist uptake and early treatment carry growth to 2035
The Australia clear aligners market is expected to reach USD 427.2 million by 2035, a 12.28% CAGR during 2026–2035, as general dentists, scan-based planning and early treatment widen access. Growth should be strongest in limited packages, general dental practices, direct-printed aligners and Queensland, because these areas gain most from training and new appliance designs. Workforce gaps, case complexity and out-of-pocket costs could slow some practices, while supervised care and better planning tools should keep treatment quality high.
Frequently Asked Questions
How big is the Australia clear aligners market?
Which product type leads aligner value?
Which state leads the market?
How many general dentists offer clear aligner therapy?
Does private health insurance cover clear aligners?
What happened to mail-order aligners in Australia?
Who are the leading aligner suppliers in Australia?
What are the main challenges for aligner providers?
Table of Content
Chapter 1 Market Segmentation
- 1.1 Segmentation Framework
- 1.1.1 Product and Service Classification
- 1.1.2 Application and End-Use Classification
- 1.1.3 Technology and Solution Classification
- 1.1.4 Customer and Distribution Channel Classification
- 1.1.5 Geographic Segmentation
- 1.1.6 Market Segment Definitions and Boundaries
- 1.2 By Product Type
- 1.2.1 Comprehensive treatment packages
- 1.2.2 Moderate treatment packages
- 1.2.3 Limited treatment packages
- 1.3 By Care Setting
- 1.3.1 Specialist orthodontic practices
- 1.3.2 General dental practices
- 1.3.3 Remote-led care networks
- 1.4 By End User
- 1.4.1 Children under 13
- 1.4.2 Adolescents aged 13-17
- 1.4.3 Adults aged 18-34
- 1.4.4 Adults aged 35 and above
- 1.5 By Technology
- 1.5.1 Single-layer thermoformed aligners
- 1.5.2 Multilayer thermoformed aligners
- 1.5.3 Direct-printed aligners
- 1.6 By State
- 1.6.1 New South Wales
- 1.6.2 Victoria
- 1.6.3 Queensland
- 1.6.4 Remaining states and territories
Chapter 2 Introduction
- 2.1 Report Objectives and Scope
- 2.2 Product Definition and Industry Terminology
- 2.3 Market Inclusions and Exclusions
- 2.4 Research Process
- 2.4.1 Primary Research and Expert Interviews
- 2.4.2 Secondary Research and Source Review
- 2.4.3 Top-Down and Bottom-Up Estimation
- 2.4.4 Data Triangulation and Verification
- 2.5 Market Size Measurement Basis
- 2.5.1 2025: USD 134.5 million → 2035: USD 427.2 million
- 2.6 Historical and Forecast Reference Periods
- 2.6.1 Historical Period: 2018-2025
- 2.6.2 Base Year: 2025
- 2.6.3 Forecast Period: 2025-2035
- 2.7 Research Assumptions and Limitations
Chapter 3 Executive Summary
- 3.1 Market Snapshot and Key Findings
- 3.2 Base-Year Market Size, 2025
- 3.3 Forecast Market Size, 2035
- 3.4 Revenue and Volume Growth Outlook
- 3.5 Key Demand and Supply Indicators
- 3.6 Leading Market Segments
- 3.7 Fastest-Growing Market Opportunities
- 3.8 Regional Performance Highlights
- 3.9 Technology and Industry Transformation
- 3.10 Competitive Landscape Summary
- 3.11 Analyst View and Strategic Implications
Chapter 4 Australia Clear Aligners Market Trends and Developments
- 4.1 Historical Industry Development, 2018-2025
- 4.2 Recent Market Trends and Developments
- 4.3 Demand and Customer Behavior Trends
- 4.4 Technology and Product Innovation
- 4.5 Artificial Intelligence, Automation and Digitalization
- 4.6 Local Manufacturing and Supply Chain Realignment
- 4.7 Industry Partnerships, Mergers and Acquisitions
- 4.8 Sustainability and Circular Economy Developments
- 4.9 Government and Private Sector Investment Trends
- 4.10 Emerging Business Models and Commercialization
- 4.11 Industry Developments and Announcements
Chapter 5 Australia Clear Aligners Market Production, Supply and Demand Analysis
- 5.1 Demand Trend and Consumption Analysis, 2018-2025
- 5.2 Demand Forecast, 2025-2035
- 5.3 Production and Output Trend, 2018-2025
- 5.4 Production and Output Forecast, 2025-2035
- 5.5 Installed Capacity and Capacity Utilization
- 5.6 Company-Wise Production Plants and Statistics
- 5.6.1 Installed Production Capacity
- 5.6.2 Actual Production
- 5.6.3 Planned Capacity and Expansion Targets
- 5.7 Supply Chain Structure and Procurement Trends
- 5.8 Supply-Demand Gap and Bottlenecks
- 5.9 Import Dependence and Sourcing Structure
- 5.10 Contract Manufacturing and Outsourcing
- 5.11 Regional Supply and Demand Concentration
Chapter 6 Australia Clear Aligners Market Pricing Analysis
- 6.1 Pricing Structure and Measurement
- 6.2 Historical Pricing Trends, 2018-2025
- 6.3 Pricing Outlook, 2025-2035
- 6.4 Average Selling Price and Unit Economics
- 6.5 Pricing by Product and Market Segment
- 6.6 Geographic Pricing Differences
- 6.7 Key Input, Energy, Labor and Logistics Costs
- 6.8 Contract Pricing and Purchasing Models
- 6.9 Pricing Sensitivity and Competitive Positioning
- 6.10 Price, Margin and Profitability Implications
Chapter 7 Australia Clear Aligners Market Dynamics
- 7.1 Market Growth Drivers
- 7.1.1 Demand-Side Drivers
- 7.1.2 Technology and Innovation Drivers
- 7.1.3 Infrastructure and Investment Drivers
- 7.1.4 Regulatory and Policy Drivers
- 7.2 Market Restraints
- 7.2.1 Cost and Affordability Constraints
- 7.2.2 Technology and Adoption Barriers
- 7.2.3 Supply Chain and Operational Constraints
- 7.3 Market Challenges
- 7.3.1 Competitive Pressure and Margin Erosion
- 7.3.2 Skills, Infrastructure and Implementation Gaps
- 7.4 Emerging Market Opportunities
- 7.5 Market Dynamics Impact and Time-Horizon Assessment
Chapter 8 Australia Clear Aligners Value Chain Analysis
- 8.1 Industry Value Chain Overview
- 8.2 Upstream Suppliers and Critical Inputs
- 8.3 Technology and Component Providers
- 8.4 Manufacturing or Service Delivery
- 8.5 Distribution, Channel Partners and Integrators
- 8.6 Downstream Applications and End Users
- 8.7 Value Addition and Profit Pools
- 8.8 Vertical Integration and Outsourcing
- 8.9 Supplier Concentration and Risk
- 8.10 Supply Chain Localization and Resilience
Chapter 9 Australia Clear Aligners Market Regulations and Policies
- 9.1 Relevant Laws, Standards and Compliance Frameworks
- 9.2 Product, Service, Safety and Quality Requirements
- 9.3 Government Policies, Incentives and Subsidies
- 9.4 Imports, Exports and Trade Barriers
- 9.5 Public Procurement and Local Content Requirements
- 9.6 Environmental and Sustainability Compliance
- 9.7 Upcoming Policy Changes and Market Implications
Chapter 10 Australia Clear Aligners Market Hotspots and Opportunities
- 10.1 Market Opportunity Mapping and Growth Hotspots
- 10.2 High-Growth Applications and Customer Groups
- 10.3 Underserved Markets and White-Space Opportunities
- 10.4 Emerging Technology and Product Opportunities
- 10.5 New Capacity and Investment Hotspots
- 10.6 Market Entry and Expansion Opportunities
- 10.7 Distribution and Partnership Opportunities
- 10.8 Near-Term and Long-Term Commercial Potential
- 10.9 Opportunity Attractiveness and Execution Risks
Chapter 11 Australia Clear Aligners Market Outlook, 2025-2035
- 11.1 Market Size and Analysis
- 11.1.1 Revenue (Market Measurement: 2025: USD 134.5 million → 2035: USD 427.2 million)
- 11.1.2 Market Volume and Quantity Sold
- 11.1.3 Historical Market Size, 2018-2025
- 11.1.4 Base-Year Market Size, 2025
- 11.2 Market Forecast, 2025-2035
- 11.2.1 Revenue Forecast to 2035
- 11.2.2 Volume Forecast to 2035
- 11.2.3 CAGR and Year-on-Year Growth
- 11.2.4 Incremental Revenue Opportunity
- 11.3 Forecast Assumptions and Scenario Analysis
- 11.3.1 Base-Case Forecast
- 11.3.2 Optimistic and Conservative Scenarios
- 11.3.3 Technology, Pricing and Policy Sensitivities
- 11.4 Market Attractiveness and Growth Outlook
Chapter 12 Australia Clear Aligners Market Segmentation and Outlook
- 12.1 Segmentation Summary and Market Shares, 2025
- 12.2 Largest and Fastest-Growing Segments
- 12.3 By Product Type - Market Size and Forecast, 2025-2035
- 12.3.1 Segment Definition and Scope
- 12.3.2 Historical Market Size, 2018-2025
- 12.3.3 Revenue Forecast, 2025-2035
- 12.3.4 Volume Forecast, 2025-2035
- 12.3.5 Base-Year Market Share, 2025
- 12.3.6 Segment CAGR and Growth Drivers
- 12.3.7 Subsegment Market Size and Forecast
- 12.3.7.1 Comprehensive treatment packages
- 12.3.7.2 Moderate treatment packages
- 12.3.7.3 Limited treatment packages
- 12.3.8 Subsegment Pricing and Adoption Trends
- 12.3.9 Leading Suppliers and Competition
- 12.3.10 Regional Demand and Opportunities
- 12.4 By Care Setting - Market Size and Forecast, 2025-2035
- 12.4.1 Segment Definition and Scope
- 12.4.2 Historical Market Size, 2018-2025
- 12.4.3 Revenue Forecast, 2025-2035
- 12.4.4 Volume Forecast, 2025-2035
- 12.4.5 Base-Year Market Share, 2025
- 12.4.6 Segment CAGR and Growth Drivers
- 12.4.7 Subsegment Market Size and Forecast
- 12.4.7.1 Specialist orthodontic practices
- 12.4.7.2 General dental practices
- 12.4.7.3 Remote-led care networks
- 12.4.8 Subsegment Pricing and Adoption Trends
- 12.4.9 Leading Suppliers and Competition
- 12.4.10 Regional Demand and Opportunities
- 12.5 By End User - Market Size and Forecast, 2025-2035
- 12.5.1 Segment Definition and Scope
- 12.5.2 Historical Market Size, 2018-2025
- 12.5.3 Revenue Forecast, 2025-2035
- 12.5.4 Volume Forecast, 2025-2035
- 12.5.5 Base-Year Market Share, 2025
- 12.5.6 Segment CAGR and Growth Drivers
- 12.5.7 Subsegment Market Size and Forecast
- 12.5.7.1 Children under 13
- 12.5.7.2 Adolescents aged 13-17
- 12.5.7.3 Adults aged 18-34
- 12.5.7.4 Adults aged 35 and above
- 12.5.8 Subsegment Pricing and Adoption Trends
- 12.5.9 Leading Suppliers and Competition
- 12.5.10 Regional Demand and Opportunities
- 12.6 By Technology - Market Size and Forecast, 2025-2035
- 12.6.1 Segment Definition and Scope
- 12.6.2 Historical Market Size, 2018-2025
- 12.6.3 Revenue Forecast, 2025-2035
- 12.6.4 Volume Forecast, 2025-2035
- 12.6.5 Base-Year Market Share, 2025
- 12.6.6 Segment CAGR and Growth Drivers
- 12.6.7 Subsegment Market Size and Forecast
- 12.6.7.1 Single-layer thermoformed aligners
- 12.6.7.2 Multilayer thermoformed aligners
- 12.6.7.3 Direct-printed aligners
- 12.6.8 Subsegment Pricing and Adoption Trends
- 12.6.9 Leading Suppliers and Competition
- 12.6.10 Regional Demand and Opportunities
- 12.7 By State - Market Size and Forecast, 2025-2035
- 12.7.1 Segment Definition and Scope
- 12.7.2 Historical Market Size, 2018-2025
- 12.7.3 Revenue Forecast, 2025-2035
- 12.7.4 Volume Forecast, 2025-2035
- 12.7.5 Base-Year Market Share, 2025
- 12.7.6 Segment CAGR and Growth Drivers
- 12.7.7 Subsegment Market Size and Forecast
- 12.7.7.1 New South Wales
- 12.7.7.2 Victoria
- 12.7.7.3 Queensland
- 12.7.7.4 Remaining states and territories
- 12.7.8 Subsegment Pricing and Adoption Trends
- 12.7.9 Leading Suppliers and Competition
- 12.7.10 Regional Demand and Opportunities
- 12.8 Segment Growth Comparison
- 12.9 Segment Attractiveness and Priority Matrix
Chapter 13 Australia Clear Aligners End-Use and Application Market Outlook
- 13.1 End-Use Industry and Customer Demand Structure
- 13.2 Leading Applications and Customer Groups
- 13.3 End-Use Market Size, Share and Forecast
- 13.4 Major End-Use Industry Deep Dives
- 13.4.1 Customer Requirements and Use Cases
- 13.4.2 Demand and Replacement Cycles
- 13.4.3 Technical and Regulatory Considerations
- 13.4.4 Purchasing and Procurement Models
- 13.4.5 Leading Vendors and Distribution Channels
- 13.4.6 Forecast and Commercial Opportunities
- 13.5 Emerging Applications and Cross-Segment Demand
- 13.6 End-Use Industry Investment Priorities
Chapter 14 Australia Clear Aligners Geographic Market Outlook, 2025-2035
- 14.1 Domestic Market Distribution and Demand Clusters
- 14.2 State- or Province-Wise Market Size and Forecast, 2025-2035
- 14.3 City and Metropolitan Market Outlook
- 14.4 Industrial, Manufacturing and Commercial Clusters
- 14.5 Geographic Concentration of Key End Users
- 14.6 Local Pricing and Purchasing Differences
- 14.7 Domestic Production Facilities and Capacity Map
- 14.8 Local Infrastructure and Project Pipeline
- 14.9 State-Level Policy and Incentive Differences
- 14.10 Subnational Investment Hotspots and Opportunities
- 14.11 Distribution and Logistics Networks
- 14.12 Domestic Competitive Footprint
Chapter 15 Australia Clear Aligners Technology, Innovation and Sustainability Outlook
- 15.1 Technology Landscape and Maturity
- 15.2 Product, Process and Service Innovation
- 15.3 AI, Automation and Digital Tools in the Industry
- 15.4 Technology Adoption and Performance Benchmarking
- 15.5 Innovation Pipeline and R&D Investment
- 15.6 Patent and Intellectual Property Trends
- 15.7 Energy Efficiency and Resource Management
- 15.8 Sustainability, Recycling and Circularity
- 15.9 Technology Roadmap, 2025-2035
- 15.10 Risks of Obsolescence and Technology Substitution
Chapter 16 Australia Clear Aligners Market Key Strategic Imperatives
- 16.1 Growth and Market Entry Priorities
- 16.2 High-Return Products and Segments
- 16.3 Pricing, Profitability and Cost Optimization
- 16.4 Technology Investment and Product Differentiation
- 16.5 Supply Chain Localization and Resilience
- 16.6 Distribution and Customer Acquisition
- 16.7 Partnership, Acquisition and Capacity Strategy
- 16.8 Regional Expansion Priorities
- 16.9 Short-, Medium- and Long-Term Actions
Chapter 17 Competition Outlook
- 17.1 Industry Competition Characteristics
- 17.2 Market Structure and Concentration
- 17.3 Market Share and Competitive Positioning, 2025
- 17.4 Company-Wise Revenue and Product Benchmarking
- 17.5 Production and Service Capacity Benchmarking
- 17.6 Technology, Pricing and Differentiation
- 17.7 Regional Footprint and Distribution Strength
- 17.8 Mergers, Acquisitions and Strategic Alliances
- 17.9 New Entrants and Competitive Threats
- 17.10 Porter's Five Forces and Industry Attractiveness
- 17.11 Competitive Outlook, 2025-2035
Chapter 18 Company Profiles
- 18.1 Company Coverage and Selection Criteria
- 18.2 Align Technology
- 18.2.1 Business Description
- 18.2.2 Company Ownership and Geographic Presence
- 18.2.3 Product and Service Portfolio
- 18.2.4 Manufacturing and Operating Footprint
- 18.2.5 Production Capacity and Expansion Plans
- 18.2.6 Financial Performance and Investment
- 18.2.7 Market Share and Competitive Position
- 18.2.8 Technology and Innovation Capabilities
- 18.2.9 Strategic Alliances or Partnerships
- 18.2.10 Recent Developments
- 18.2.11 Growth Strategy and Outlook
- 18.3 Straumann Group
- 18.4 Ormco
- 18.5 Dentsply Sirona
- 18.6 SmilePath
- 18.7 Dr Clear Aligners
- 18.8 uLab Systems
- 18.9 Angelalign Technology
- 18.10 Modern Dental Pacific
- 18.11 SmileTRU International
- 18.12 Other Relevant Market Participants
Note: Every listed company is profiled on the structure shown under the first company. The company list is preliminary and may change based on research findings, market developments, data availability and client requirements.
Chapter 19 Disclaimer
- 19.1 Research and Forecast Disclaimer
- 19.2 Data Source and Estimation Limitations
Note: The depth of individual sections depends on data availability for this market. Volume, capacity, trade and other unit-based metrics are included where applicable.

