
Diabetes care and home use shape jet injection demand
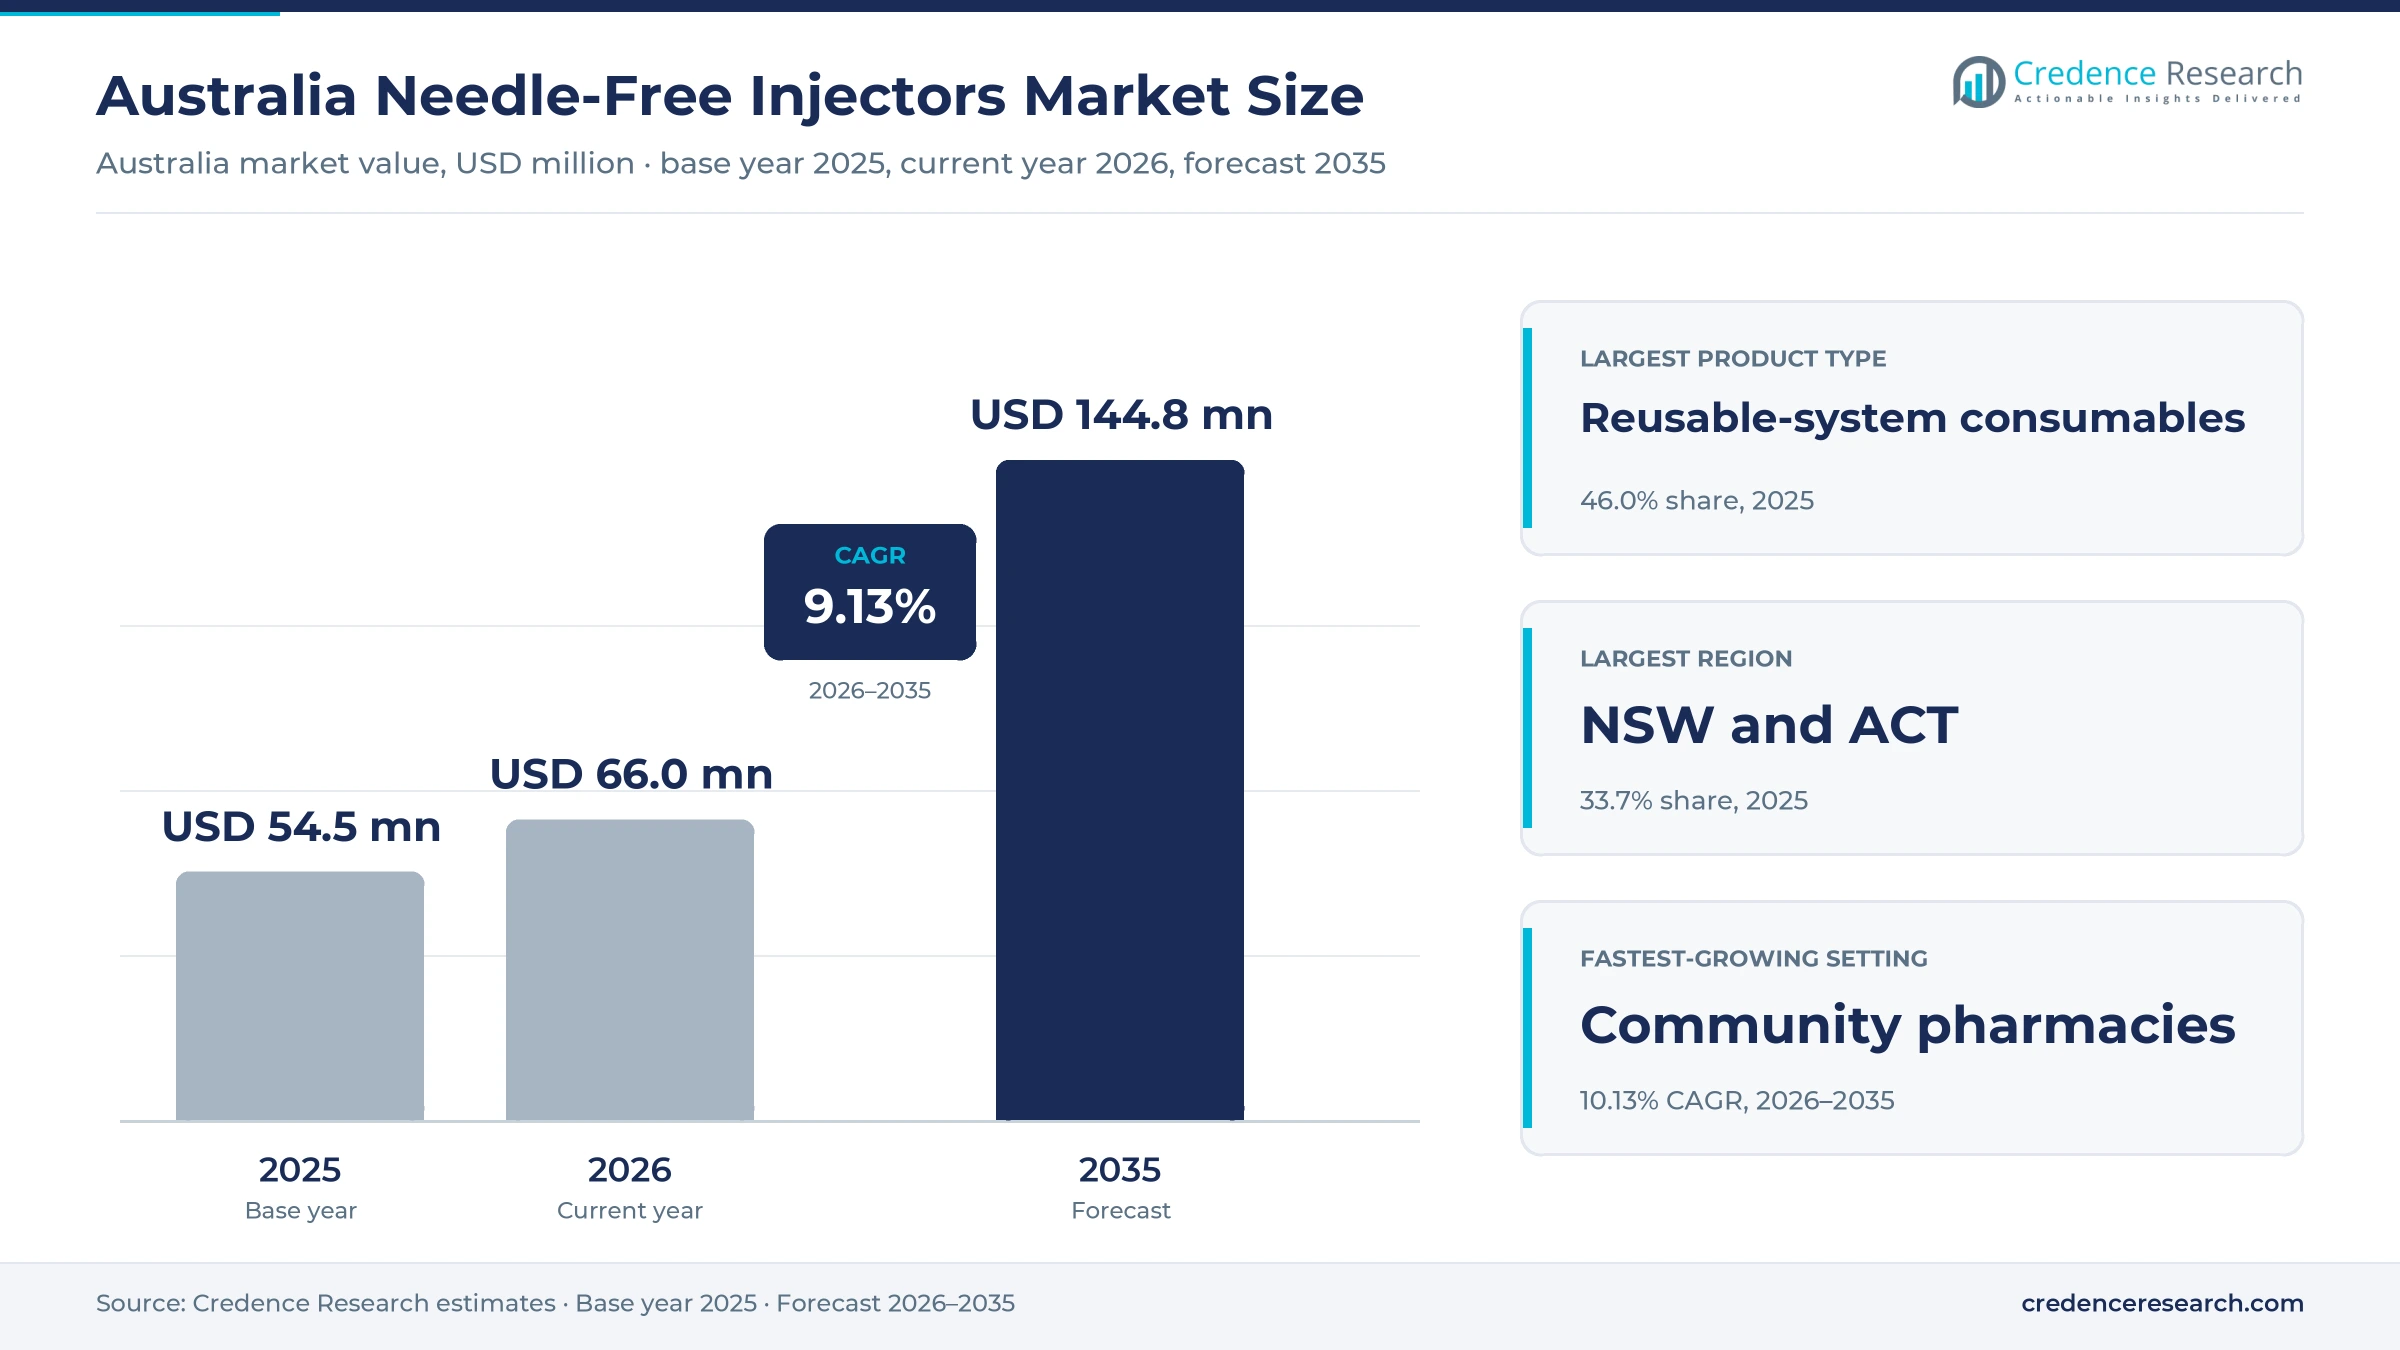
The Australia needle-free injectors market was valued at USD 54.5 million in 2025 and is projected to increase from USD 66.0 million in 2026 to USD 144.8 million by 2035, registering a CAGR of 9.13% during 2026–2035. Demand comes from adults and children who inject insulin, growth hormone and other medicines at home, and from clinics that want to avoid needlestick injuries. New South Wales and the Australian Capital Territory held the largest regional share, 33.7% in 2025, because the zone has the largest population and specialist network. Western Australia, South Australia and the Northern Territory form the fastest-growing region at 9.41% a year, as Western Australia adds residents quickly. In turn, pharmacies gained a federal payment for vaccinations in January 2024, which widens professional channels for needle-free delivery.
Which jet injection products does the estimate cover?
The estimate measures the value of needle-free jet injectors sold in Australia, including reusable injector bodies, the consumables these systems use and single-use injection assemblies. It counts purchases by patients, hospitals, specialist clinics and pharmacies through specialist distributors, direct patient sales, pharmacy dispensing and hospital procurement.
The estimate excludes needle-based syringes, pen injectors, autoinjectors, insulin pumps and the medicines that patients inject. The value chain runs from overseas device makers through Australian sponsors and distributors to diabetes educators, endocrinologists, pharmacists and patients.
Australia Needle-Free Injectors Market Insights
- The Australia needle-free injectors market was valued at USD 54.5 million in 2025 and is projected to reach USD 144.8 million by 2035, registering a CAGR of 9.13% during 2026–2035.
- New South Wales and the Australian Capital Territory held a 33.7% share of 2025 value, because the zone has the most patients.
- Reusable-system consumables led with a 46.0% share of 2025 value, because each injector needs regular adapters and nozzles.
- About 1.5 million Australians had diagnosed diabetes and about 500,000 more had undiagnosed diabetes, according to national safety and quality data published in 2025.
- Community pharmacies grow fastest at 10.13% a year during 2026–2035, as pharmacists take on more vaccination and injection services.
Consumables lead while single-use assemblies grow fastest
Why do consumables lead product value?
Based on product type, the market is categorized into reusable injector bodies, reusable-system consumables and single-use injection assemblies. Reusable-system Consumables led with a 46.0% share of 2025 value, because each reusable injector needs regular nozzles, adapters and vial connectors. Single-use Injection Assemblies grow fastest at 9.92% a year, as clinics and vaccine users prefer prefilled or disposable formats.
How do home care and pharmacies split use?
Based on care setting, the market is categorized into home care, hospitals, specialist outpatient clinics and community pharmacies. Home Care led with a 52.0% share of 2025 value, because most users inject insulin or hormones themselves every day. Community Pharmacies grow fastest at 10.13% a year, as pharmacists give more vaccinations and train patients on new devices.
Why does diabetes lead disease areas?
Based on disease area, the market is categorized into diabetes, endocrine disorders, vaccine-preventable diseases and specialist treatment indications. Diabetes led with a 58.0% share of 2025 value, because insulin users inject several times a day. Specialist Treatment Indications grow fastest at 9.90% a year, as device makers license jet injectors for other subcutaneous biologic and weight-management therapies.
How fast are powered systems gaining share?
Based on technology, the market is categorized into spring-powered jet systems, pneumatic jet systems and electrically powered jet systems. Spring-powered Jet Systems led with a 74.0% share of 2025 value, because mechanically powered insulin and growth hormone injectors are the main products on sale. Electrically Powered Jet Systems grow fastest at 10.36% a year, as dose control and data recording improve.
| Segment Group | Leading Sub-segment | Share, 2025 | Fastest-growing Sub-segment | CAGR, 2026–2035 |
|---|---|---|---|---|
| By Product Type | Reusable-system Consumables | 46.0% | Single-use Injection Assemblies | 9.92% |
| By Care Setting | Home Care | 52.0% | Community Pharmacies | 10.13% |
| By Disease Area | Diabetes | 58.0% | Specialist Treatment Indications | 9.90% |
| By Technology | Spring-powered Jet Systems | 74.0% | Electrically Powered Jet Systems | 10.36% |
Request a Free Sample
Fill in your details and we'll send you a free sample report.
- Sample data tables & charts
- Research methodology
Diabetes, patient choice and pharmacy access lift demand
How does recurring diabetes treatment lift device demand?
Recurring diabetes treatment lifts device demand, because people who use insulin inject one or more times every day for life. Diabetes affected 7.4% of Australians aged 20 to 79 in 2024, according to the World Bank. About 1.5 million Australians had diagnosed diabetes and about 500,000 more were undiagnosed, according to the Australian Commission on Safety and Quality in Health Care. Type 1 diabetes reached 117,932 cases in 2025, with 4,207 new cases that year. Diabetes also costs the health system more than $9.1 billion a year. As a result, diabetes holds 58.0% of 2025 value, and jet injectors compete with other diabetes care devices for patient spending.
Why do patient choice and clinical differentiation matter?
Patient-centered delivery and clinical differentiation matter, because some patients avoid or delay injections when they fear needles. The InsuJet injector has been listed on the Australian Register of Therapeutic Goods as a Class IIb device since March 7, 2011, under entry 180917. European Pharma Group named Meditrend International as its Australian distributor for InsuJet version 5 and its consumables from July 2021, according to the Australian Diabetes Educator. The device is described as suitable for all types of insulin. Ferring also lists the ZOMAJET needle-free device for its 10 mg growth hormone product in Australia. In turn, endocrine disorders hold a steady share of value.
How do accessible professional channels expand use?
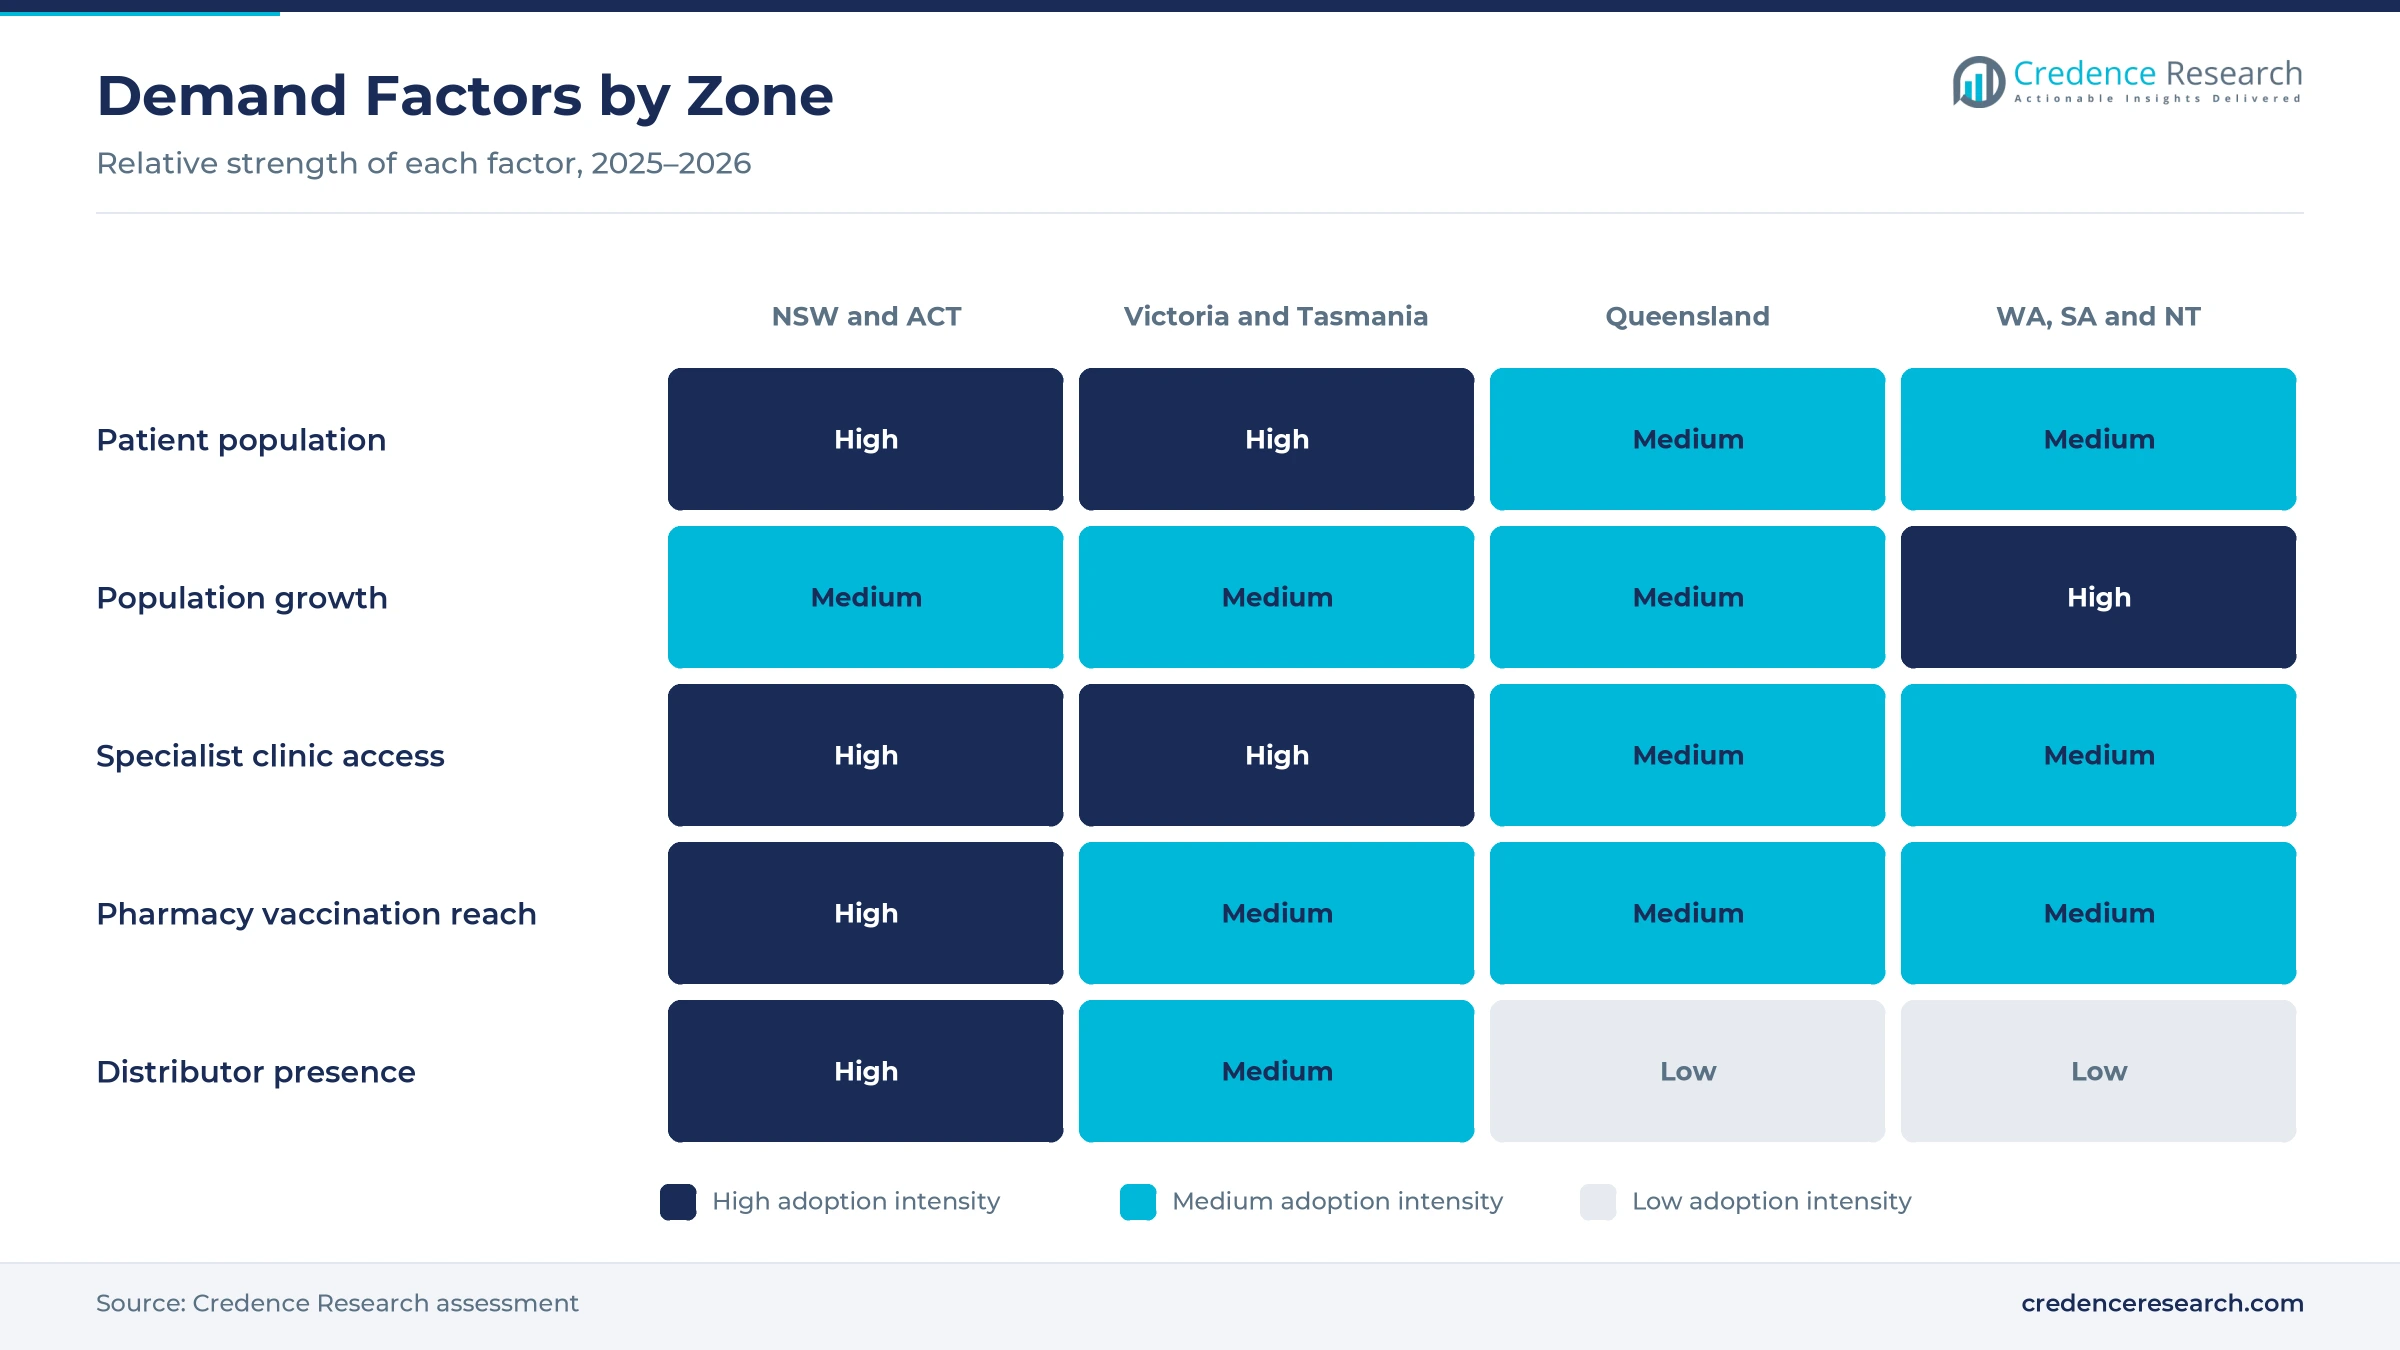
Expansion of accessible professional channels widens use, because pharmacists and nurses can show patients how to use jet injectors at the point of care. The federal National Immunisation Program Vaccinations in Pharmacy program launched on Jan. 1, 2024, paying pharmacies $18.85 for each eligible vaccination. The payment covers people aged 5 and over, while state and territory laws decide which vaccines pharmacists give. PharmaJet's Stratis needle-free system was also chosen in 2020 for an Australian vaccine trial with 150 volunteers at sites in Sydney, Perth and Adelaide. As a result, community pharmacies grow fastest at 10.13% a year.
How do population growth and aging add patients?
Population growth and aging add patients, because older people are more likely to need injected medicines for diabetes and hormone conditions. Australia had 27,921,150 residents at March 31, 2026, after annual growth of 392,700 people, or 1.4%, according to the Australian Bureau of Statistics. Western Australia had the fastest growth rate of any state, at 2.1%, while Tasmania had the slowest, at 0.6%. People aged 65 and over also made up 18.1% of the population in 2025, up from 17.7% in 2024. In turn, the western and central zone grows faster than the national market, as new residents in Perth and regional centers add patients.
Home dosing, consumables and pharmacy vaccines gain ground
How is the shift to needle-free home dosing changing care?
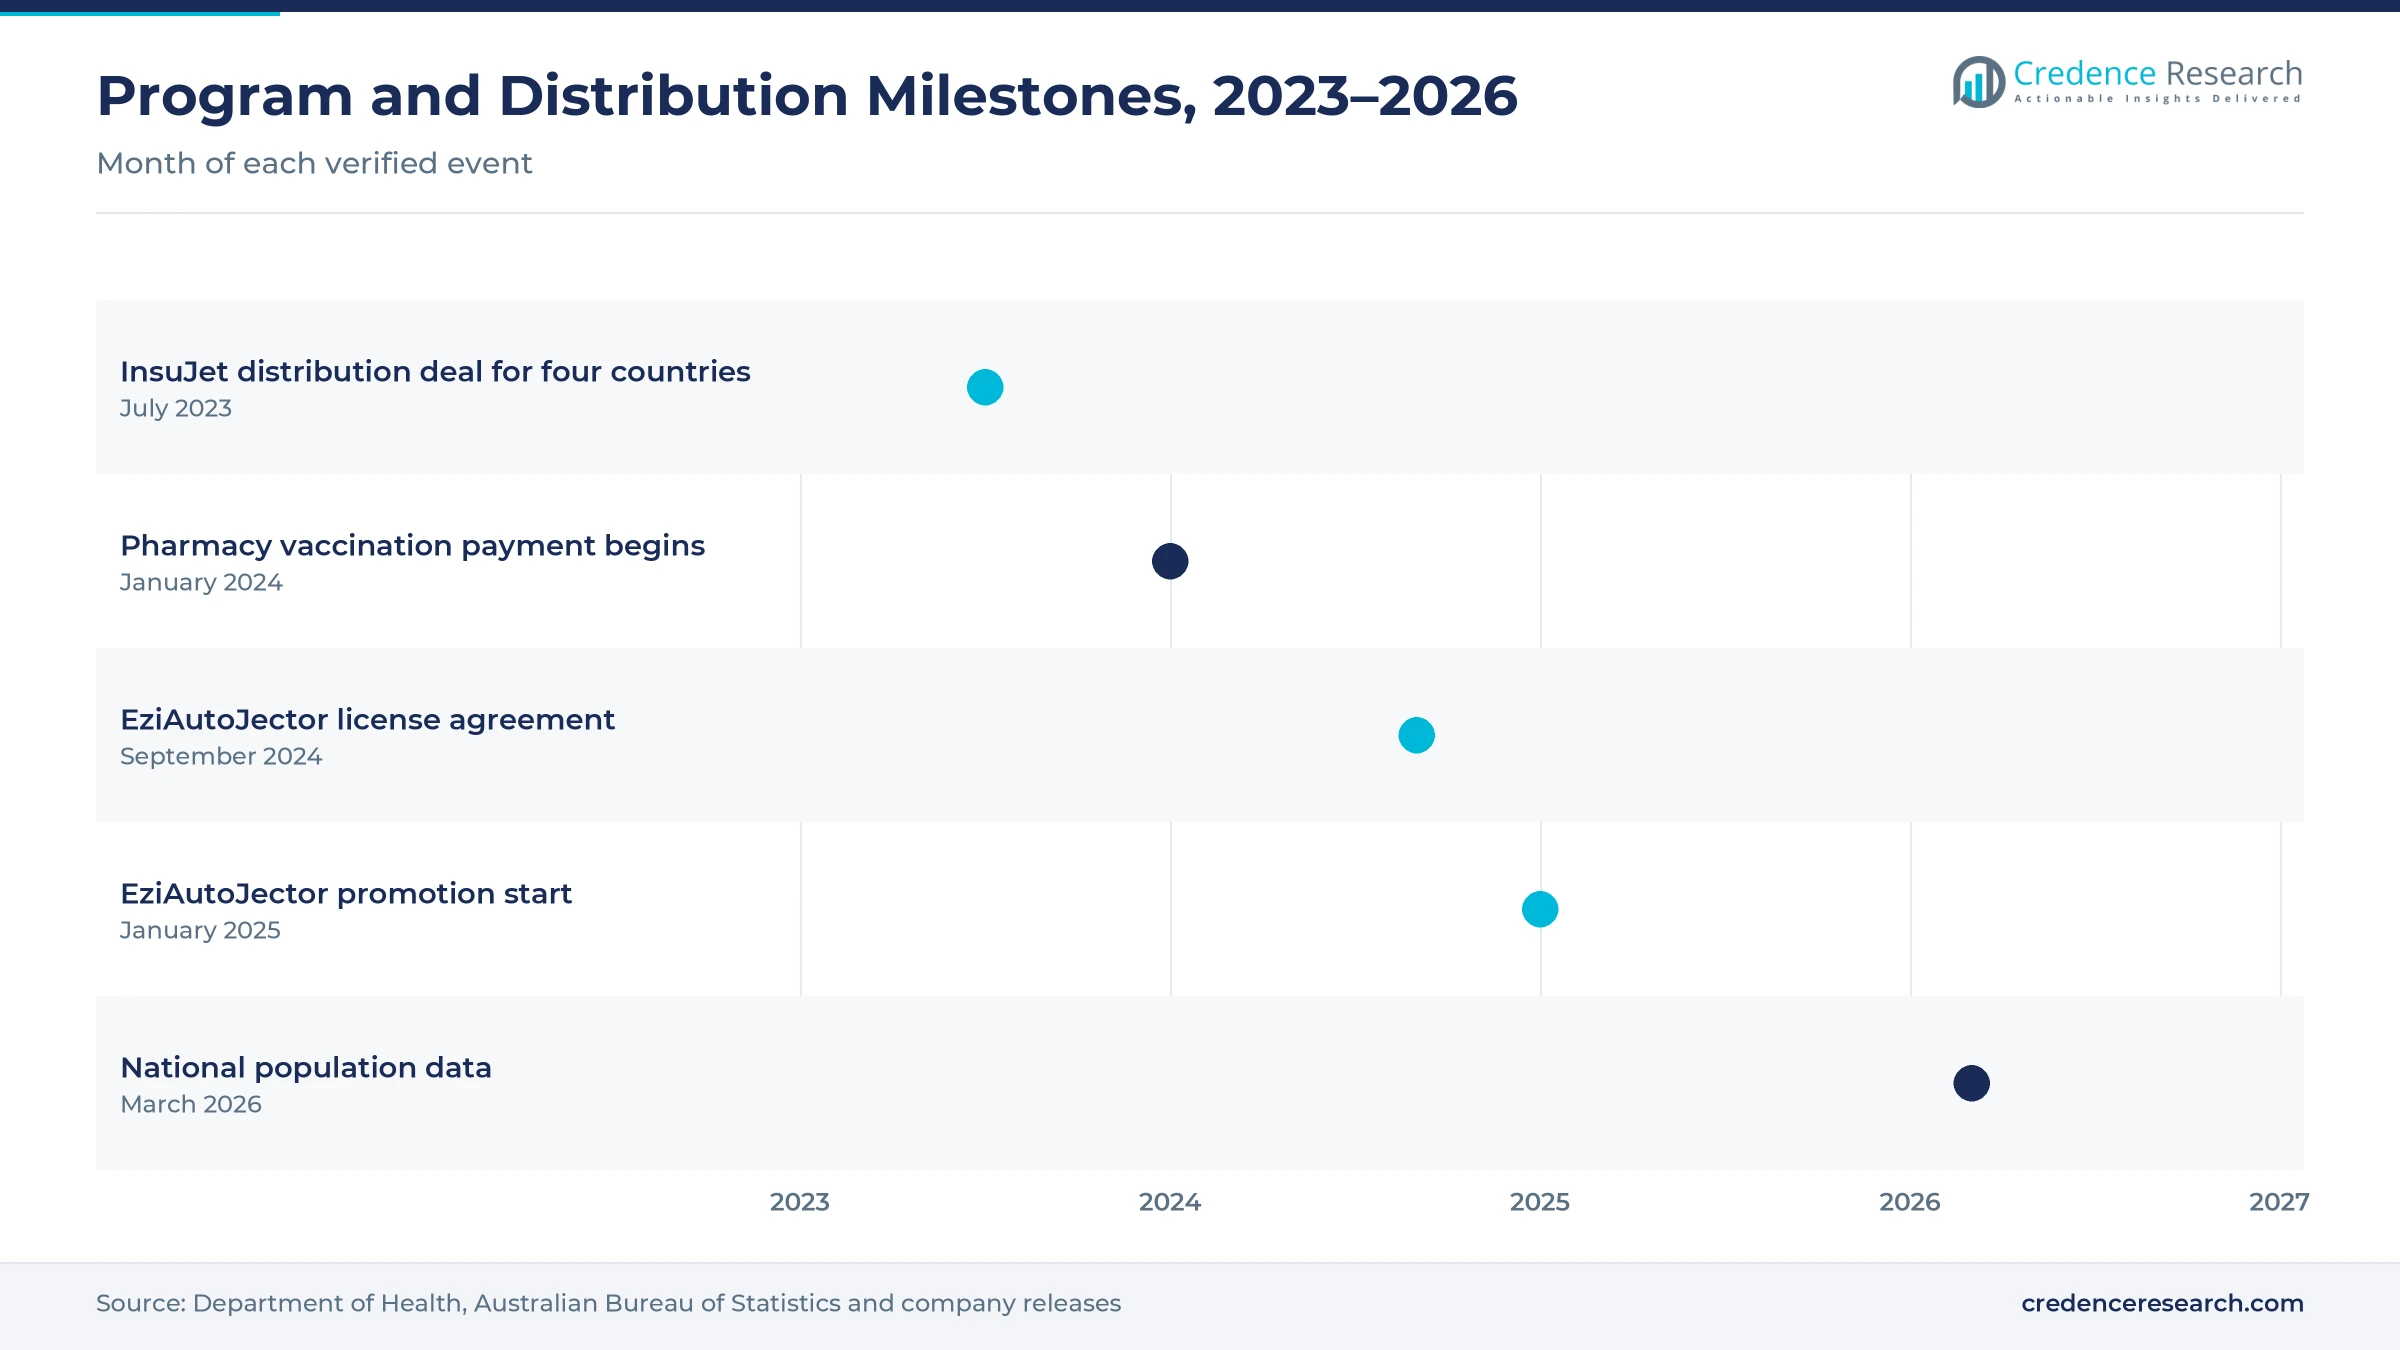
The shift to needle-free home dosing is changing care, because patients who fear needles can inject insulin without a sharp. InsuJet uses a fine liquid jet to send insulin through the skin and is described as suitable for people with needle phobia. About 1.5 million Australians live with diagnosed diabetes, which gives home dosing a large base. NuGen said in July 2023 that InsuJet was approved for sale as a medical device in 42 countries. The company also signed a five-year distribution agreement with SOL-Millennium Medical in July 2023 for Canada, Brazil, France and Spain. As a result, home care holds 52.0% of 2025 value, and Australian patients gain access to devices with wider global support and training material.
Why is the rise of licensed injector brands notable?
The rise of licensed injector brands is notable, because device owners now partner with other companies that sell under their own names. NuGen signed a license, supply and distribution agreement with EziAutoJector on Sept. 27, 2024, and announced it on Oct. 25, 2024. The first purchase order covered 5,000 injectors with consumables, and promotion was planned from January 2025 for long-term weight loss therapy in the United Kingdom and Germany. The device works with U-100 insulin and other subcutaneous biosimilar protein products. In turn, specialist treatment indications grow fastest at 9.90% a year, as jet injectors move into therapies beyond insulin.
Can pharmacy vaccination open needle-free volume?
Pharmacy vaccination can open needle-free volume, because pharmacists give large numbers of vaccines each season and value faster, sharps-free delivery. The pharmacy vaccination payment began on Jan. 1, 2024, at $18.85 for each eligible dose for people aged 5 and over. PharmaJet Stratis holds FDA 510(k) clearance, a CE Mark and WHO prequalification certification. Its use in a 150-person Australian vaccine trial at the University of Sydney, the Telethon Kids Institute and the University of Adelaide showed that local researchers already test jet delivery with new vaccines. As a result, vaccine-preventable diseases form a small but growing share, and single-use assemblies grow at 9.92% a year.
Is there room to grow in pediatric endocrine care?
Pediatric endocrine care offers room to grow, because children who need daily insulin or growth hormone often find needles hard to accept. Australia recorded 4,207 new type 1 diabetes cases in 2025, many of them in children and young people. Ferring's ZOMAJET Vision X device is listed for use with its 10 mg growth hormone product, registered as AUST R 156226. Type 1 diabetes prevalence across the Australian population reached 0.44% in 2025. In turn, specialist clinics and diabetes educators can introduce jet injectors early, and suppliers that offer training and child-friendly devices can win long-term users across smart insulin pens and jet systems.
Device cost, limited subsidies and training slow adoption
How do device costs slow adoption?
Device costs slow adoption, because a reusable jet injector costs far more than a box of syringes or pen needles. As a result, many patients stay with needles that national diabetes programs supply at low or no cost. Suppliers respond with trial programs, payment plans and bundled consumables, which help patients compare the full cost over a year of daily injections and see whether fewer missed doses justify the higher upfront price.
Why do limited subsidies hold back demand?
Limited subsidies hold back demand, because public schemes mainly fund needles, syringes and glucose monitoring rather than jet injectors. In turn, most users pay for devices and consumables themselves or through private health insurance. Suppliers respond with clinical data and patient case studies, which support future subsidy applications and help clinicians justify the device for patients with needle phobia, injection site pain or a history of skipped doses.
How does training need limit uptake?
Training needs limit uptake, because patients must learn how to load the device, set the dose and hold it against the skin correctly. As a result, diabetes educators and nurses spend extra time with each new user. Suppliers respond with video guides, educator kits and phone support, which shorten training time and reduce the number of patients who stop using the device during the first few weeks of home treatment.
Why does drug compatibility narrow use?
Drug compatibility narrows use, because each medicine must be tested with a jet injector before clinicians recommend it. In turn, many biologics, vaccines and long-acting drugs remain available only in syringes, pens or autoinjectors. Suppliers respond with partnerships and licensing deals with drug makers, which add approved medicines and widen the range of therapies patients can take without a needle at home or in specialist clinics.
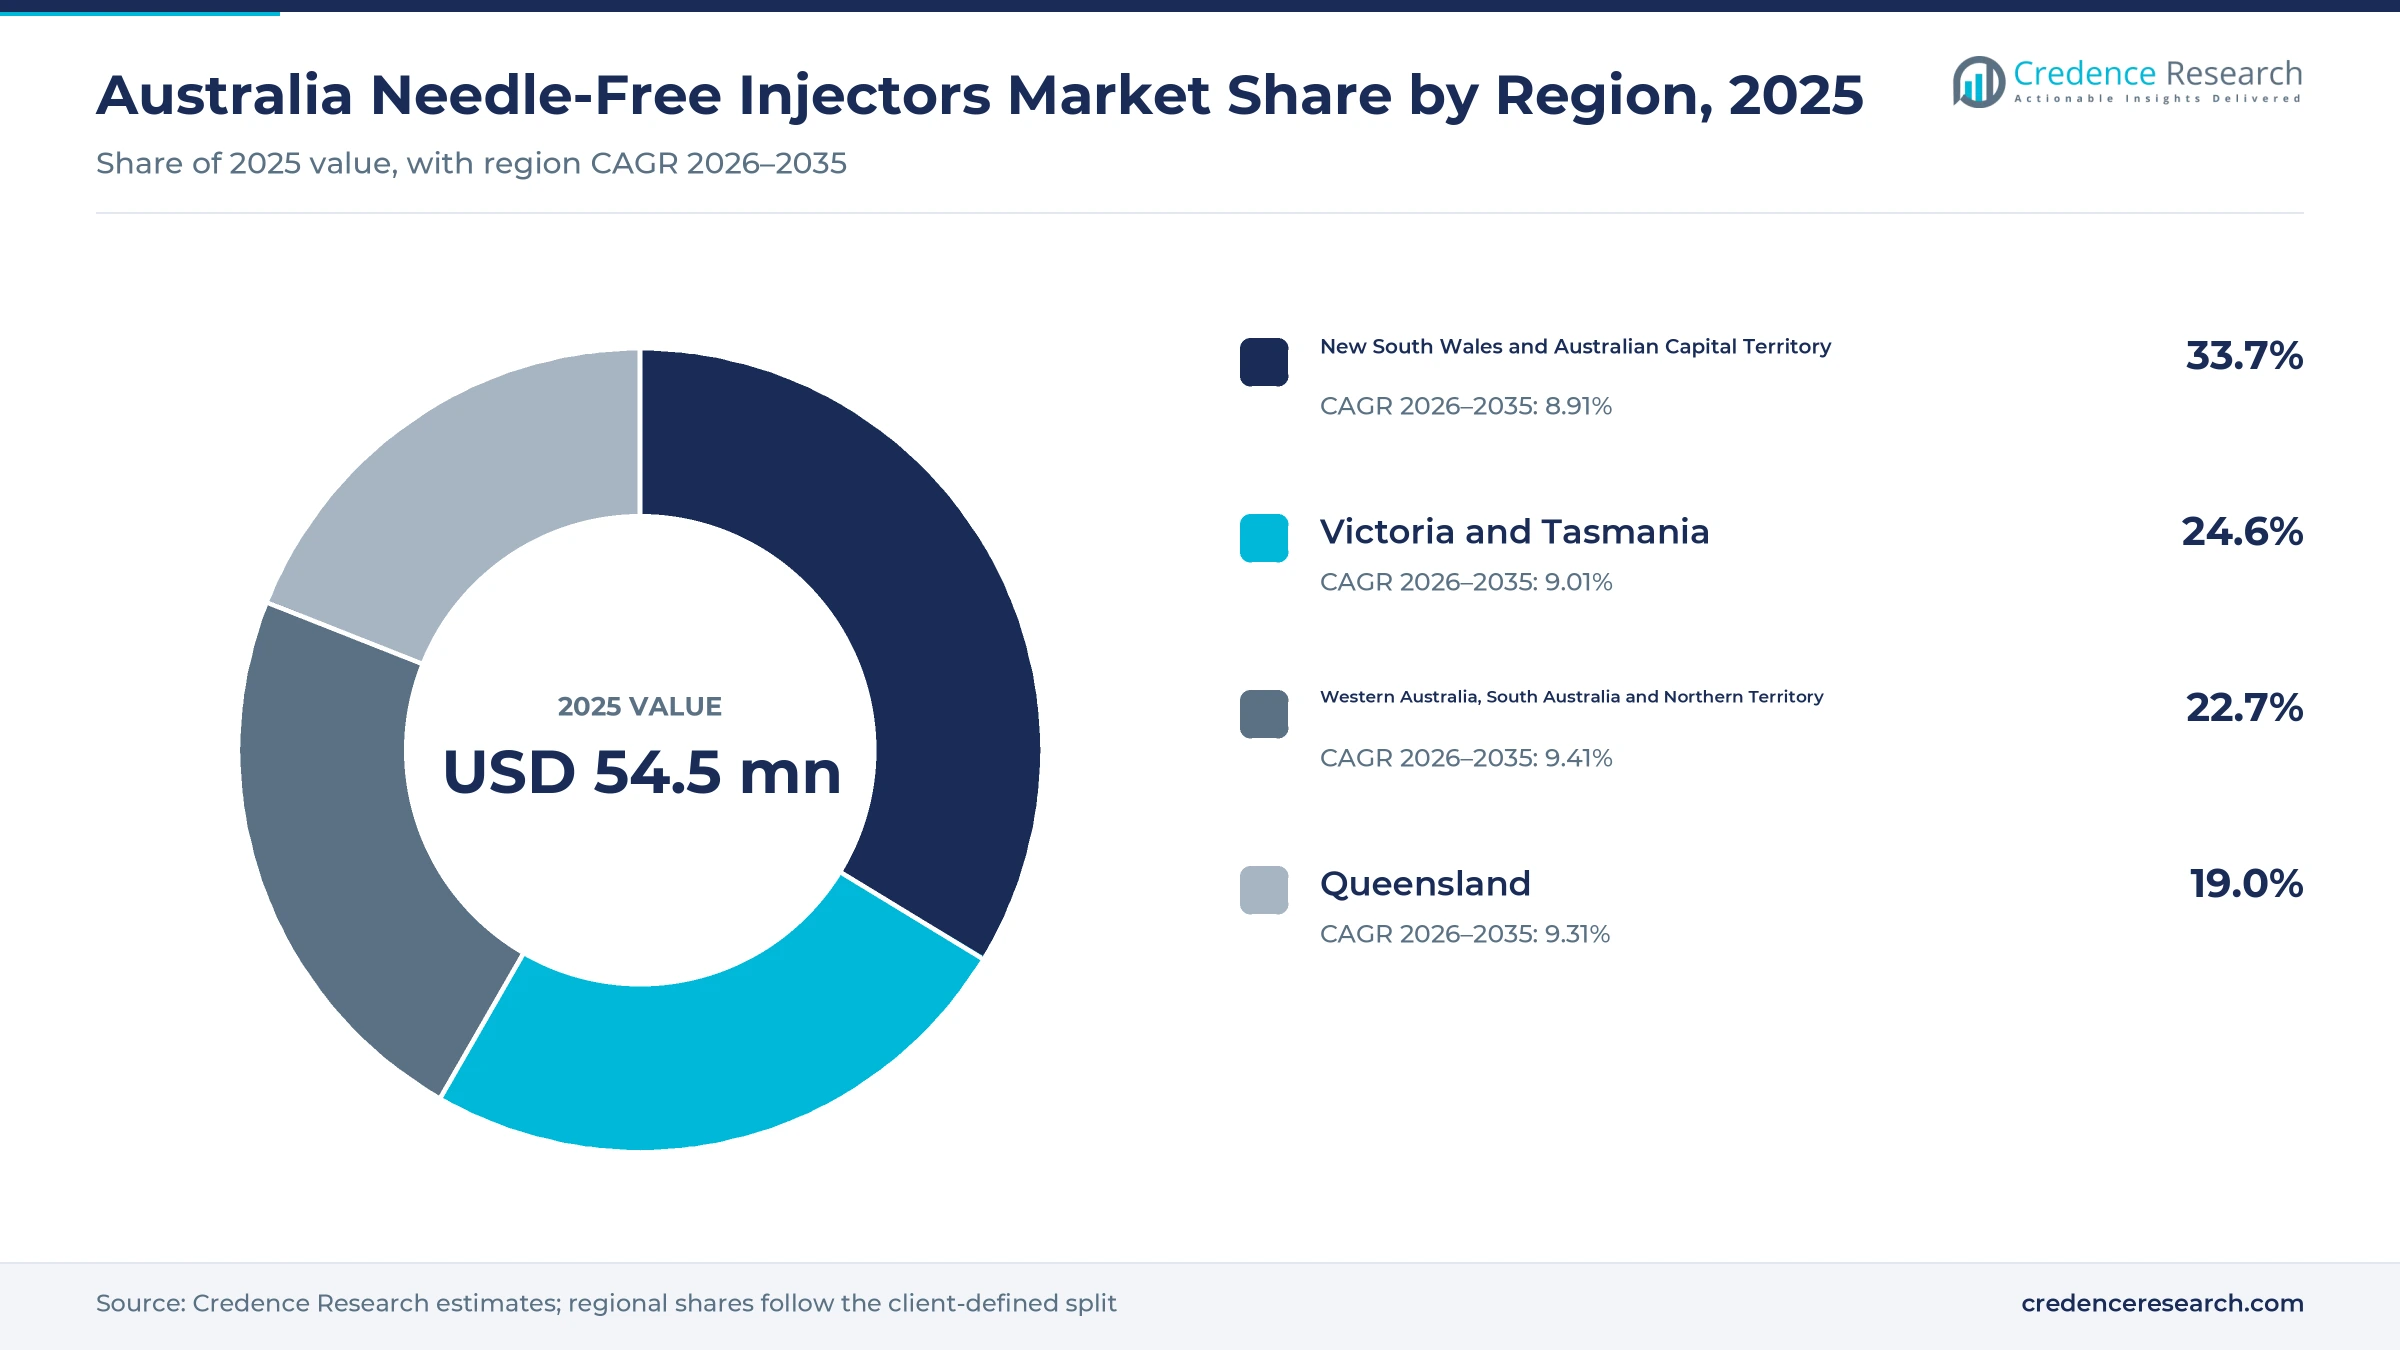
NSW and ACT lead as western and central states grow fastest
| Region | Value, 2025 (USD million) | Share, 2025 | CAGR, 2026–2035 |
|---|---|---|---|
| New South Wales and Australian Capital Territory | 18.4 | 33.7% | 8.91% |
| Victoria and Tasmania | 13.4 | 24.6% | 9.01% |
| Western Australia, South Australia and Northern Territory | 12.4 | 22.7% | 9.41% |
| Queensland | 10.4 | 19.0% | 9.31% |
Why do new South Wales and the ACT hold the top share?
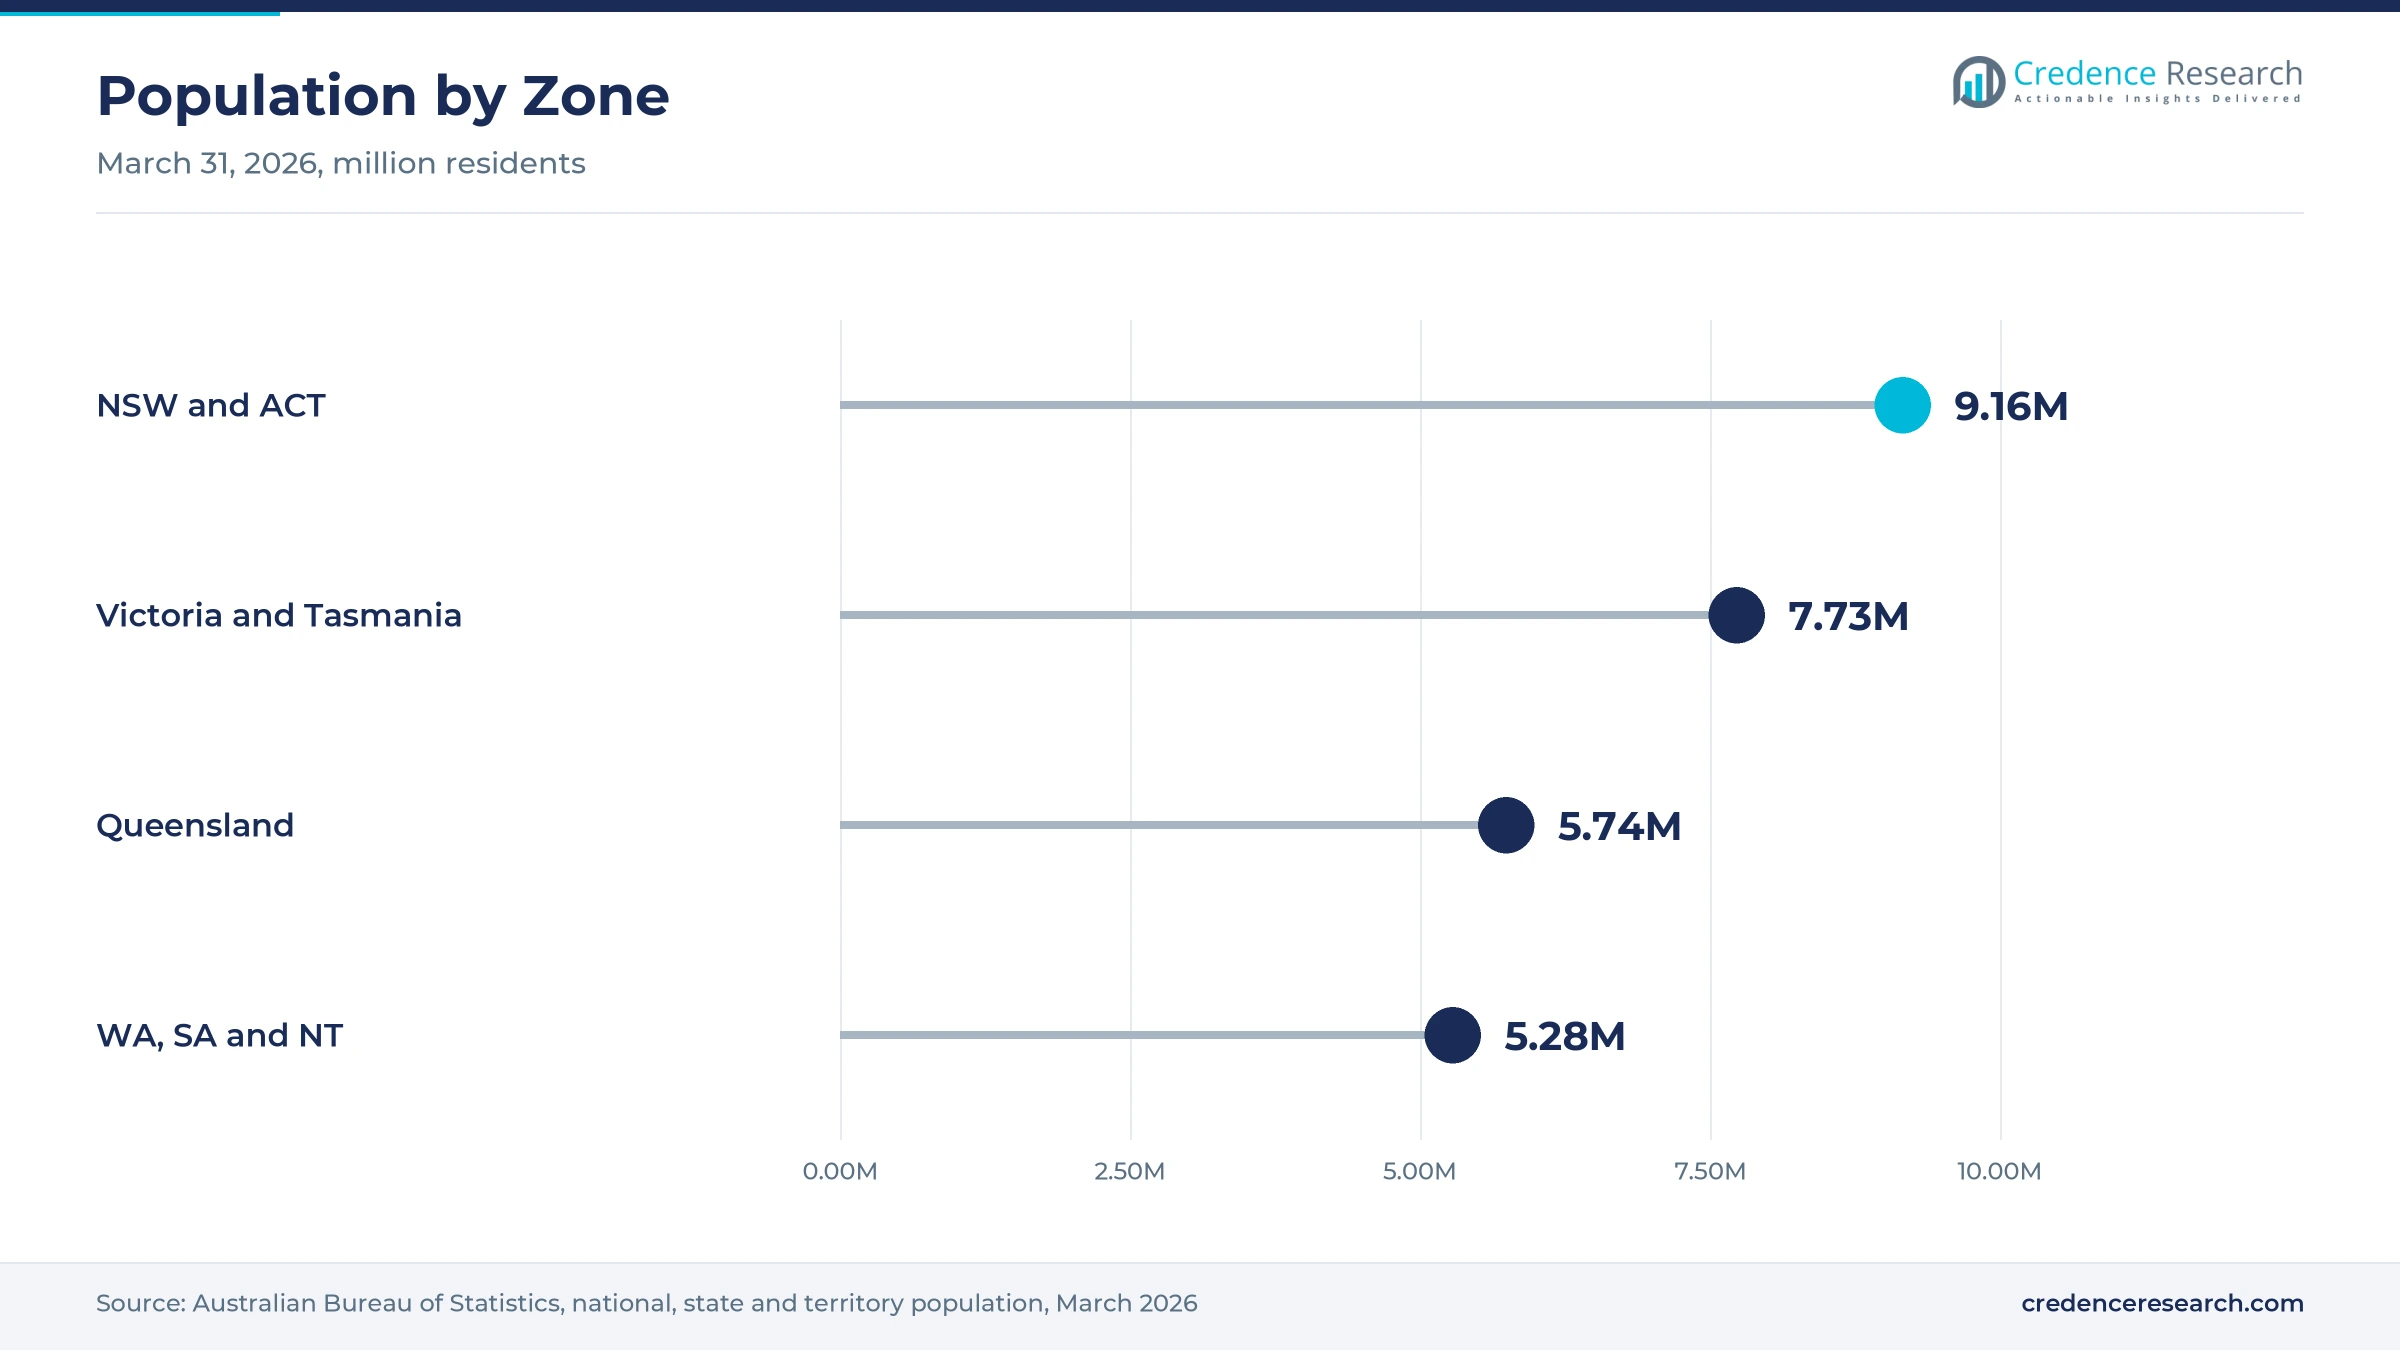
New South Wales and the Australian Capital Territory held a 33.7% share of 2025 value and grow at 8.91% a year, because the zone had about 9.16 million residents in March 2026. New South Wales alone had about 8.67 million people, the most of any state. Sydney also hosts many endocrinology clinics, diabetes educators and specialist distributors. As a result, the zone leads home care and clinic demand for jet injectors.
How do Victoria and Tasmania support demand?
Victoria and Tasmania held a 24.6% share of 2025 value and grow at 9.01% a year, because Melbourne has a dense network of hospitals and specialist clinics. The zone had about 7.73 million residents in March 2026, including about 580,000 in Tasmania. However, Tasmania had the slowest population growth of any state, at 0.6%. As a result, Victoria drives most growth in the zone through hospital and pharmacy channels.
Why are the western and central states growing fastest?
Western Australia, South Australia and the Northern Territory held a 22.7% share of 2025 value and grow fastest at 9.41% a year, because Western Australia had the fastest population growth of any state, at 2.1%, in the year to March 2026. The zone had about 5.28 million residents in total across the three jurisdictions. In turn, Perth and Adelaide add new patients and pharmacy demand each year.
What shapes demand in Queensland?
Queensland held a 19.0% share of 2025 value and grows at 9.31% a year, because the state had about 5.74 million residents in March 2026. Brisbane and south-east Queensland add hospital, pharmacy and home care demand as the population rises.
Registration, distribution and program milestones
| Development | Status and market relevance |
|---|---|
| In January 2024, the federal government launched a payment of $18.85 for each eligible vaccination given in community pharmacies. | Expands professional injection channels |
| In January 2025, EziAutoJector was scheduled to begin promoting and distributing InsuJet devices under its own brand after its 2024 license from NuGen. | Extends jet injection beyond insulin |
| In November 2025, the Australian Commission on Safety and Quality in Health Care published data showing about 1.5 million Australians with diagnosed diabetes. | Confirms a large insulin user base |
| In September 2026, the Australian Bureau of Statistics reported 27,921,150 residents at March 31, 2026, with Western Australia growing fastest at 2.1%. | Supports patient growth in the western zone |
| In October 2026, the World Bank updated its indicators, keeping Australian diabetes prevalence at 7.4% of adults aged 20 to 79 for 2024. | Sustains recurring treatment demand |
Spring, gas and electric power define jet delivery
- Spring-powered jet systems store energy in a spring that the user winds before each dose, which keeps the device simple, portable and free of batteries or gas.
- Pneumatic jet systems use compressed gas to drive the dose, which suits clinics and vaccination sessions that give many injections in a row.
- Electrically powered jet systems use a motor to control pressure and dose, which allows more precise delivery and can record each injection for patients and clinicians.
Need a Custom Version of This Report?
Tailor the scope, geography, or segments to your exact requirements.
- Custom geography or segment scope
- Direct access to our analyst team
Specialist distributors compete on access and training
Competition is led by a small group of overseas device makers that reach Australian patients through local sponsors and specialist distributors. Meditrend International is the sponsor of the InsuJet entry on the Australian Register of Therapeutic Goods, and European Pharma Group named it Australian distributor for InsuJet version 5 in July 2021. NuGen Medical Devices owns InsuJet and signs licensing and distribution deals, including agreements with SOL-Millennium Medical in 2023 and EziAutoJector in 2024. Ferring supplies its ZOMAJET device with growth hormone in Australia. Rivals compete on ease of use, drug compatibility, training support and consumable costs. Because most users pay for devices themselves, suppliers that work with diabetes educators, pharmacies and endocrinologists win more patients. Distributors also help brands reach hypodermic syringes buyers who want a sharps-free option.
Which companies supply Australian users?
| Company | Type | Role in the market |
|---|---|---|
| Meditrend International | Australian sponsor and distributor | Sponsor of the InsuJet ARTG entry and Australian distributor |
| European Pharma Group | Device supplier | Named Meditrend as Australian distributor for InsuJet version 5 in 2021 |
| NuGen Medical Devices | Device owner | Owns InsuJet and licenses it to distribution partners |
Credence Research view on jet injection uptake
Credence Research's view is that Australian demand for needle-free injectors will grow quickly from a small base because diabetes, hormone therapy and vaccination create daily or seasonal injection needs. Reusable-system consumables remain the largest value pool, while pharmacies and single-use assemblies add the fastest growth. Subsidy decisions will shape how fast patients move away from needles. Suppliers with strong educator networks, pharmacy reach and wider drug compatibility should gain the most, while device costs keep adoption selective.
How the national jet injection estimate was built
The report uses 2025 as the base year on a calendar basis, and market values come from the Credence Research model. That model combines diabetes statistics, population data, device registration records, government program information and company announcements. Segment splits and zone growth rates are Credence Research estimates, while zone shares follow the client-defined split. Sources used are official statistics, government publications, professional association publications and company releases, and no interviews or surveys were used.
Home care and pharmacy channels carry growth to 2035
The Australia needle-free injectors market is expected to reach USD 144.8 million by 2035, a 9.13% CAGR during 2026–2035, as more Australians manage diabetes and hormone conditions at home. Growth should be strongest in community pharmacies, single-use assemblies and therapies beyond insulin, because pharmacists give more injections and device makers license new uses. Public subsidy for jet injectors would speed the shift away from needles, while high device costs and training needs could slow it.
Frequently Asked Questions
How big is the Australia needle-free injectors market?
Which product type leads Australian value?
Which region leads the Australian market?
How many Australians have diabetes?
Which needle-free injectors are registered in Australia?
Which care setting is growing fastest?
Who are the leading companies in the Australian market?
What are the main challenges for suppliers?
Table of Content
Chapter 1 Market Segmentation
- 1.1 Segmentation Framework
- 1.1.1 Product and Service Classification
- 1.1.2 Application and End-Use Classification
- 1.1.3 Technology and Solution Classification
- 1.1.4 Customer and Distribution Channel Classification
- 1.1.5 Geographic Segmentation
- 1.1.6 Market Segment Definitions and Boundaries
- 1.2 By Product Type
- 1.2.1 Reusable Injector Bodies
- 1.2.2 Reusable-system Consumables
- 1.2.3 Single-use Injection Assemblies
- 1.3 By Care Setting
- 1.3.1 Home Care
- 1.3.2 Hospitals
- 1.3.3 Specialist Outpatient Clinics
- 1.3.4 Community Pharmacies
- 1.4 By Disease Area
- 1.4.1 Diabetes
- 1.4.2 Endocrine Disorders
- 1.4.3 Vaccine-preventable Diseases
- 1.4.4 Specialist Treatment Indications
- 1.5 By Technology
- 1.5.1 Spring-powered Jet Systems
- 1.5.2 Pneumatic Jet Systems
- 1.5.3 Electrically Powered Jet Systems
Chapter 2 Introduction
- 2.1 Report Objectives and Scope
- 2.2 Product Definition and Industry Terminology
- 2.3 Market Inclusions and Exclusions
- 2.4 Research Process
- 2.4.1 Primary Research and Expert Interviews
- 2.4.2 Secondary Research and Source Review
- 2.4.3 Top-Down and Bottom-Up Estimation
- 2.4.4 Data Triangulation and Verification
- 2.5 Market Size Measurement Basis
- 2.5.1 2025: USD 54.5 million → 2035: USD 144.8 million
- 2.6 Historical and Forecast Reference Periods
- 2.6.1 Historical Period: 2018-2025
- 2.6.2 Base Year: 2025
- 2.6.3 Forecast Period: 2025-2035
- 2.7 Research Assumptions and Limitations
Chapter 3 Executive Summary
- 3.1 Market Snapshot and Key Findings
- 3.2 Base-Year Market Size, 2025
- 3.3 Forecast Market Size, 2035
- 3.4 Revenue and Volume Growth Outlook
- 3.5 Key Demand and Supply Indicators
- 3.6 Leading Market Segments
- 3.7 Fastest-Growing Market Opportunities
- 3.8 Regional Performance Highlights
- 3.9 Technology and Industry Transformation
- 3.10 Competitive Landscape Summary
- 3.11 Analyst View and Strategic Implications
Chapter 4 Australia Needle-Free Injectors Market Trends and Developments
- 4.1 Historical Industry Development, 2018-2025
- 4.2 Recent Market Trends and Developments
- 4.3 Demand and Customer Behavior Trends
- 4.4 Technology and Product Innovation
- 4.5 Artificial Intelligence, Automation and Digitalization
- 4.6 Local Manufacturing and Supply Chain Realignment
- 4.7 Industry Partnerships, Mergers and Acquisitions
- 4.8 Sustainability and Circular Economy Developments
- 4.9 Government and Private Sector Investment Trends
- 4.10 Emerging Business Models and Commercialization
- 4.11 Industry Developments and Announcements
Chapter 5 Australia Needle-Free Injectors Market Production, Supply and Demand Analysis
- 5.1 Demand Trend and Consumption Analysis, 2018-2025
- 5.2 Demand Forecast, 2025-2035
- 5.3 Production and Output Trend, 2018-2025
- 5.4 Production and Output Forecast, 2025-2035
- 5.5 Installed Capacity and Capacity Utilization
- 5.6 Company-Wise Production Plants and Statistics
- 5.6.1 Installed Production Capacity
- 5.6.2 Actual Production
- 5.6.3 Planned Capacity and Expansion Targets
- 5.7 Supply Chain Structure and Procurement Trends
- 5.8 Supply-Demand Gap and Bottlenecks
- 5.9 Import Dependence and Sourcing Structure
- 5.10 Contract Manufacturing and Outsourcing
- 5.11 Regional Supply and Demand Concentration
Chapter 6 Australia Needle-Free Injectors Market Pricing Analysis
- 6.1 Pricing Structure and Measurement
- 6.2 Historical Pricing Trends, 2018-2025
- 6.3 Pricing Outlook, 2025-2035
- 6.4 Average Selling Price and Unit Economics
- 6.5 Pricing by Product and Market Segment
- 6.6 Geographic Pricing Differences
- 6.7 Key Input, Energy, Labor and Logistics Costs
- 6.8 Contract Pricing and Purchasing Models
- 6.9 Pricing Sensitivity and Competitive Positioning
- 6.10 Price, Margin and Profitability Implications
Chapter 7 Australia Needle-Free Injectors Market Dynamics
- 7.1 Market Growth Drivers
- 7.1.1 Demand-Side Drivers
- 7.1.2 Technology and Innovation Drivers
- 7.1.3 Infrastructure and Investment Drivers
- 7.1.4 Regulatory and Policy Drivers
- 7.2 Market Restraints
- 7.2.1 Cost and Affordability Constraints
- 7.2.2 Technology and Adoption Barriers
- 7.2.3 Supply Chain and Operational Constraints
- 7.3 Market Challenges
- 7.3.1 Competitive Pressure and Margin Erosion
- 7.3.2 Skills, Infrastructure and Implementation Gaps
- 7.4 Emerging Market Opportunities
- 7.5 Market Dynamics Impact and Time-Horizon Assessment
Chapter 8 Australia Needle-Free Injectors Value Chain Analysis
- 8.1 Industry Value Chain Overview
- 8.2 Upstream Suppliers and Critical Inputs
- 8.3 Technology and Component Providers
- 8.4 Manufacturing or Service Delivery
- 8.5 Distribution, Channel Partners and Integrators
- 8.6 Downstream Applications and End Users
- 8.7 Value Addition and Profit Pools
- 8.8 Vertical Integration and Outsourcing
- 8.9 Supplier Concentration and Risk
- 8.10 Supply Chain Localization and Resilience
Chapter 9 Australia Needle-Free Injectors Market Regulations and Policies
- 9.1 Relevant Laws, Standards and Compliance Frameworks
- 9.2 Product, Service, Safety and Quality Requirements
- 9.3 Government Policies, Incentives and Subsidies
- 9.4 Imports, Exports and Trade Barriers
- 9.5 Public Procurement and Local Content Requirements
- 9.6 Environmental and Sustainability Compliance
- 9.7 Upcoming Policy Changes and Market Implications
Chapter 10 Australia Needle-Free Injectors Market Hotspots and Opportunities
- 10.1 Market Opportunity Mapping and Growth Hotspots
- 10.2 High-Growth Applications and Customer Groups
- 10.3 Underserved Markets and White-Space Opportunities
- 10.4 Emerging Technology and Product Opportunities
- 10.5 New Capacity and Investment Hotspots
- 10.6 Market Entry and Expansion Opportunities
- 10.7 Distribution and Partnership Opportunities
- 10.8 Near-Term and Long-Term Commercial Potential
- 10.9 Opportunity Attractiveness and Execution Risks
Chapter 11 Australia Needle-Free Injectors Market Outlook, 2025-2035
- 11.1 Market Size and Analysis
- 11.1.1 Revenue (Market Measurement: 2025: USD 54.5 million → 2035: USD 144.8 million)
- 11.1.2 Market Volume and Quantity Sold
- 11.1.3 Historical Market Size, 2018-2025
- 11.1.4 Base-Year Market Size, 2025
- 11.2 Market Forecast, 2025-2035
- 11.2.1 Revenue Forecast to 2035
- 11.2.2 Volume Forecast to 2035
- 11.2.3 CAGR and Year-on-Year Growth
- 11.2.4 Incremental Revenue Opportunity
- 11.3 Forecast Assumptions and Scenario Analysis
- 11.3.1 Base-Case Forecast
- 11.3.2 Optimistic and Conservative Scenarios
- 11.3.3 Technology, Pricing and Policy Sensitivities
- 11.4 Market Attractiveness and Growth Outlook
Chapter 12 Australia Needle-Free Injectors Market Segmentation and Outlook
- 12.1 Segmentation Summary and Market Shares, 2025
- 12.2 Largest and Fastest-Growing Segments
- 12.3 By Product Type - Market Size and Forecast, 2025-2035
- 12.3.1 Segment Definition and Scope
- 12.3.2 Historical Market Size, 2018-2025
- 12.3.3 Revenue Forecast, 2025-2035
- 12.3.4 Volume Forecast, 2025-2035
- 12.3.5 Base-Year Market Share, 2025
- 12.3.6 Segment CAGR and Growth Drivers
- 12.3.7 Subsegment Market Size and Forecast
- 12.3.7.1 Reusable Injector Bodies
- 12.3.7.2 Reusable-system Consumables
- 12.3.7.3 Single-use Injection Assemblies
- 12.3.8 Subsegment Pricing and Adoption Trends
- 12.3.9 Leading Suppliers and Competition
- 12.3.10 Regional Demand and Opportunities
- 12.4 By Care Setting - Market Size and Forecast, 2025-2035
- 12.4.1 Segment Definition and Scope
- 12.4.2 Historical Market Size, 2018-2025
- 12.4.3 Revenue Forecast, 2025-2035
- 12.4.4 Volume Forecast, 2025-2035
- 12.4.5 Base-Year Market Share, 2025
- 12.4.6 Segment CAGR and Growth Drivers
- 12.4.7 Subsegment Market Size and Forecast
- 12.4.7.1 Home Care
- 12.4.7.2 Hospitals
- 12.4.7.3 Specialist Outpatient Clinics
- 12.4.7.4 Community Pharmacies
- 12.4.8 Subsegment Pricing and Adoption Trends
- 12.4.9 Leading Suppliers and Competition
- 12.4.10 Regional Demand and Opportunities
- 12.5 By Disease Area - Market Size and Forecast, 2025-2035
- 12.5.1 Segment Definition and Scope
- 12.5.2 Historical Market Size, 2018-2025
- 12.5.3 Revenue Forecast, 2025-2035
- 12.5.4 Volume Forecast, 2025-2035
- 12.5.5 Base-Year Market Share, 2025
- 12.5.6 Segment CAGR and Growth Drivers
- 12.5.7 Subsegment Market Size and Forecast
- 12.5.7.1 Diabetes
- 12.5.7.2 Endocrine Disorders
- 12.5.7.3 Vaccine-preventable Diseases
- 12.5.7.4 Specialist Treatment Indications
- 12.5.8 Subsegment Pricing and Adoption Trends
- 12.5.9 Leading Suppliers and Competition
- 12.5.10 Regional Demand and Opportunities
- 12.6 By Technology - Market Size and Forecast, 2025-2035
- 12.6.1 Segment Definition and Scope
- 12.6.2 Historical Market Size, 2018-2025
- 12.6.3 Revenue Forecast, 2025-2035
- 12.6.4 Volume Forecast, 2025-2035
- 12.6.5 Base-Year Market Share, 2025
- 12.6.6 Segment CAGR and Growth Drivers
- 12.6.7 Subsegment Market Size and Forecast
- 12.6.7.1 Spring-powered Jet Systems
- 12.6.7.2 Pneumatic Jet Systems
- 12.6.7.3 Electrically Powered Jet Systems
- 12.6.8 Subsegment Pricing and Adoption Trends
- 12.6.9 Leading Suppliers and Competition
- 12.6.10 Regional Demand and Opportunities
- 12.7 Segment Growth Comparison
- 12.8 Segment Attractiveness and Priority Matrix
Chapter 13 Australia Needle-Free Injectors Geographic Market Outlook, 2025-2035
- 13.1 Domestic Market Distribution and Demand Clusters
- 13.2 State- or Province-Wise Market Size and Forecast, 2025-2035
- 13.3 City and Metropolitan Market Outlook
- 13.4 Industrial, Manufacturing and Commercial Clusters
- 13.5 Geographic Concentration of Key End Users
- 13.6 Local Pricing and Purchasing Differences
- 13.7 Domestic Production Facilities and Capacity Map
- 13.8 Local Infrastructure and Project Pipeline
- 13.9 State-Level Policy and Incentive Differences
- 13.10 Subnational Investment Hotspots and Opportunities
- 13.11 Distribution and Logistics Networks
- 13.12 Domestic Competitive Footprint
Chapter 14 Australia Needle-Free Injectors Technology, Innovation and Sustainability Outlook
- 14.1 Technology Landscape and Maturity
- 14.2 Product, Process and Service Innovation
- 14.3 AI, Automation and Digital Tools in the Industry
- 14.4 Technology Adoption and Performance Benchmarking
- 14.5 Innovation Pipeline and R&D Investment
- 14.6 Patent and Intellectual Property Trends
- 14.7 Energy Efficiency and Resource Management
- 14.8 Sustainability, Recycling and Circularity
- 14.9 Technology Roadmap, 2025-2035
- 14.10 Risks of Obsolescence and Technology Substitution
Chapter 15 Australia Needle-Free Injectors Market Key Strategic Imperatives
- 15.1 Growth and Market Entry Priorities
- 15.2 High-Return Products and Segments
- 15.3 Pricing, Profitability and Cost Optimization
- 15.4 Technology Investment and Product Differentiation
- 15.5 Supply Chain Localization and Resilience
- 15.6 Distribution and Customer Acquisition
- 15.7 Partnership, Acquisition and Capacity Strategy
- 15.8 Regional Expansion Priorities
- 15.9 Short-, Medium- and Long-Term Actions
Chapter 16 Competition Outlook
- 16.1 Industry Competition Characteristics
- 16.2 Market Structure and Concentration
- 16.3 Market Share and Competitive Positioning, 2025
- 16.4 Company-Wise Revenue and Product Benchmarking
- 16.5 Production and Service Capacity Benchmarking
- 16.6 Technology, Pricing and Differentiation
- 16.7 Regional Footprint and Distribution Strength
- 16.8 Mergers, Acquisitions and Strategic Alliances
- 16.9 New Entrants and Competitive Threats
- 16.10 Porter's Five Forces and Industry Attractiveness
- 16.11 Competitive Outlook, 2025-2035
Chapter 17 Company Profiles
- 17.1 Company Coverage and Selection Criteria
- 17.2 NuGen Medical Devices
- 17.2.1 Business Description
- 17.2.2 Company Ownership and Geographic Presence
- 17.2.3 Product and Service Portfolio
- 17.2.4 Manufacturing and Operating Footprint
- 17.2.5 Production Capacity and Expansion Plans
- 17.2.6 Financial Performance and Investment
- 17.2.7 Market Share and Competitive Position
- 17.2.8 Technology and Innovation Capabilities
- 17.2.9 Strategic Alliances or Partnerships
- 17.2.10 Recent Developments
- 17.2.11 Growth Strategy and Outlook
- 17.3 European Pharma Group
- 17.4 SOL-Millennium Medical
- 17.5 Meditrend International
- 17.6 Mika Medical
- 17.7 Other Relevant Market Participants
Note: Every listed company is profiled on the structure shown under the first company. The company list is preliminary and may change based on research findings, market developments, data availability and client requirements.
Chapter 18 Disclaimer
- 18.1 Research and Forecast Disclaimer
- 18.2 Data Source and Estimation Limitations
Note: The depth of individual sections depends on data availability for this market. Volume, capacity, trade and other unit-based metrics are included where applicable.

