
Filament yarn and staple fiber anchor textile supply
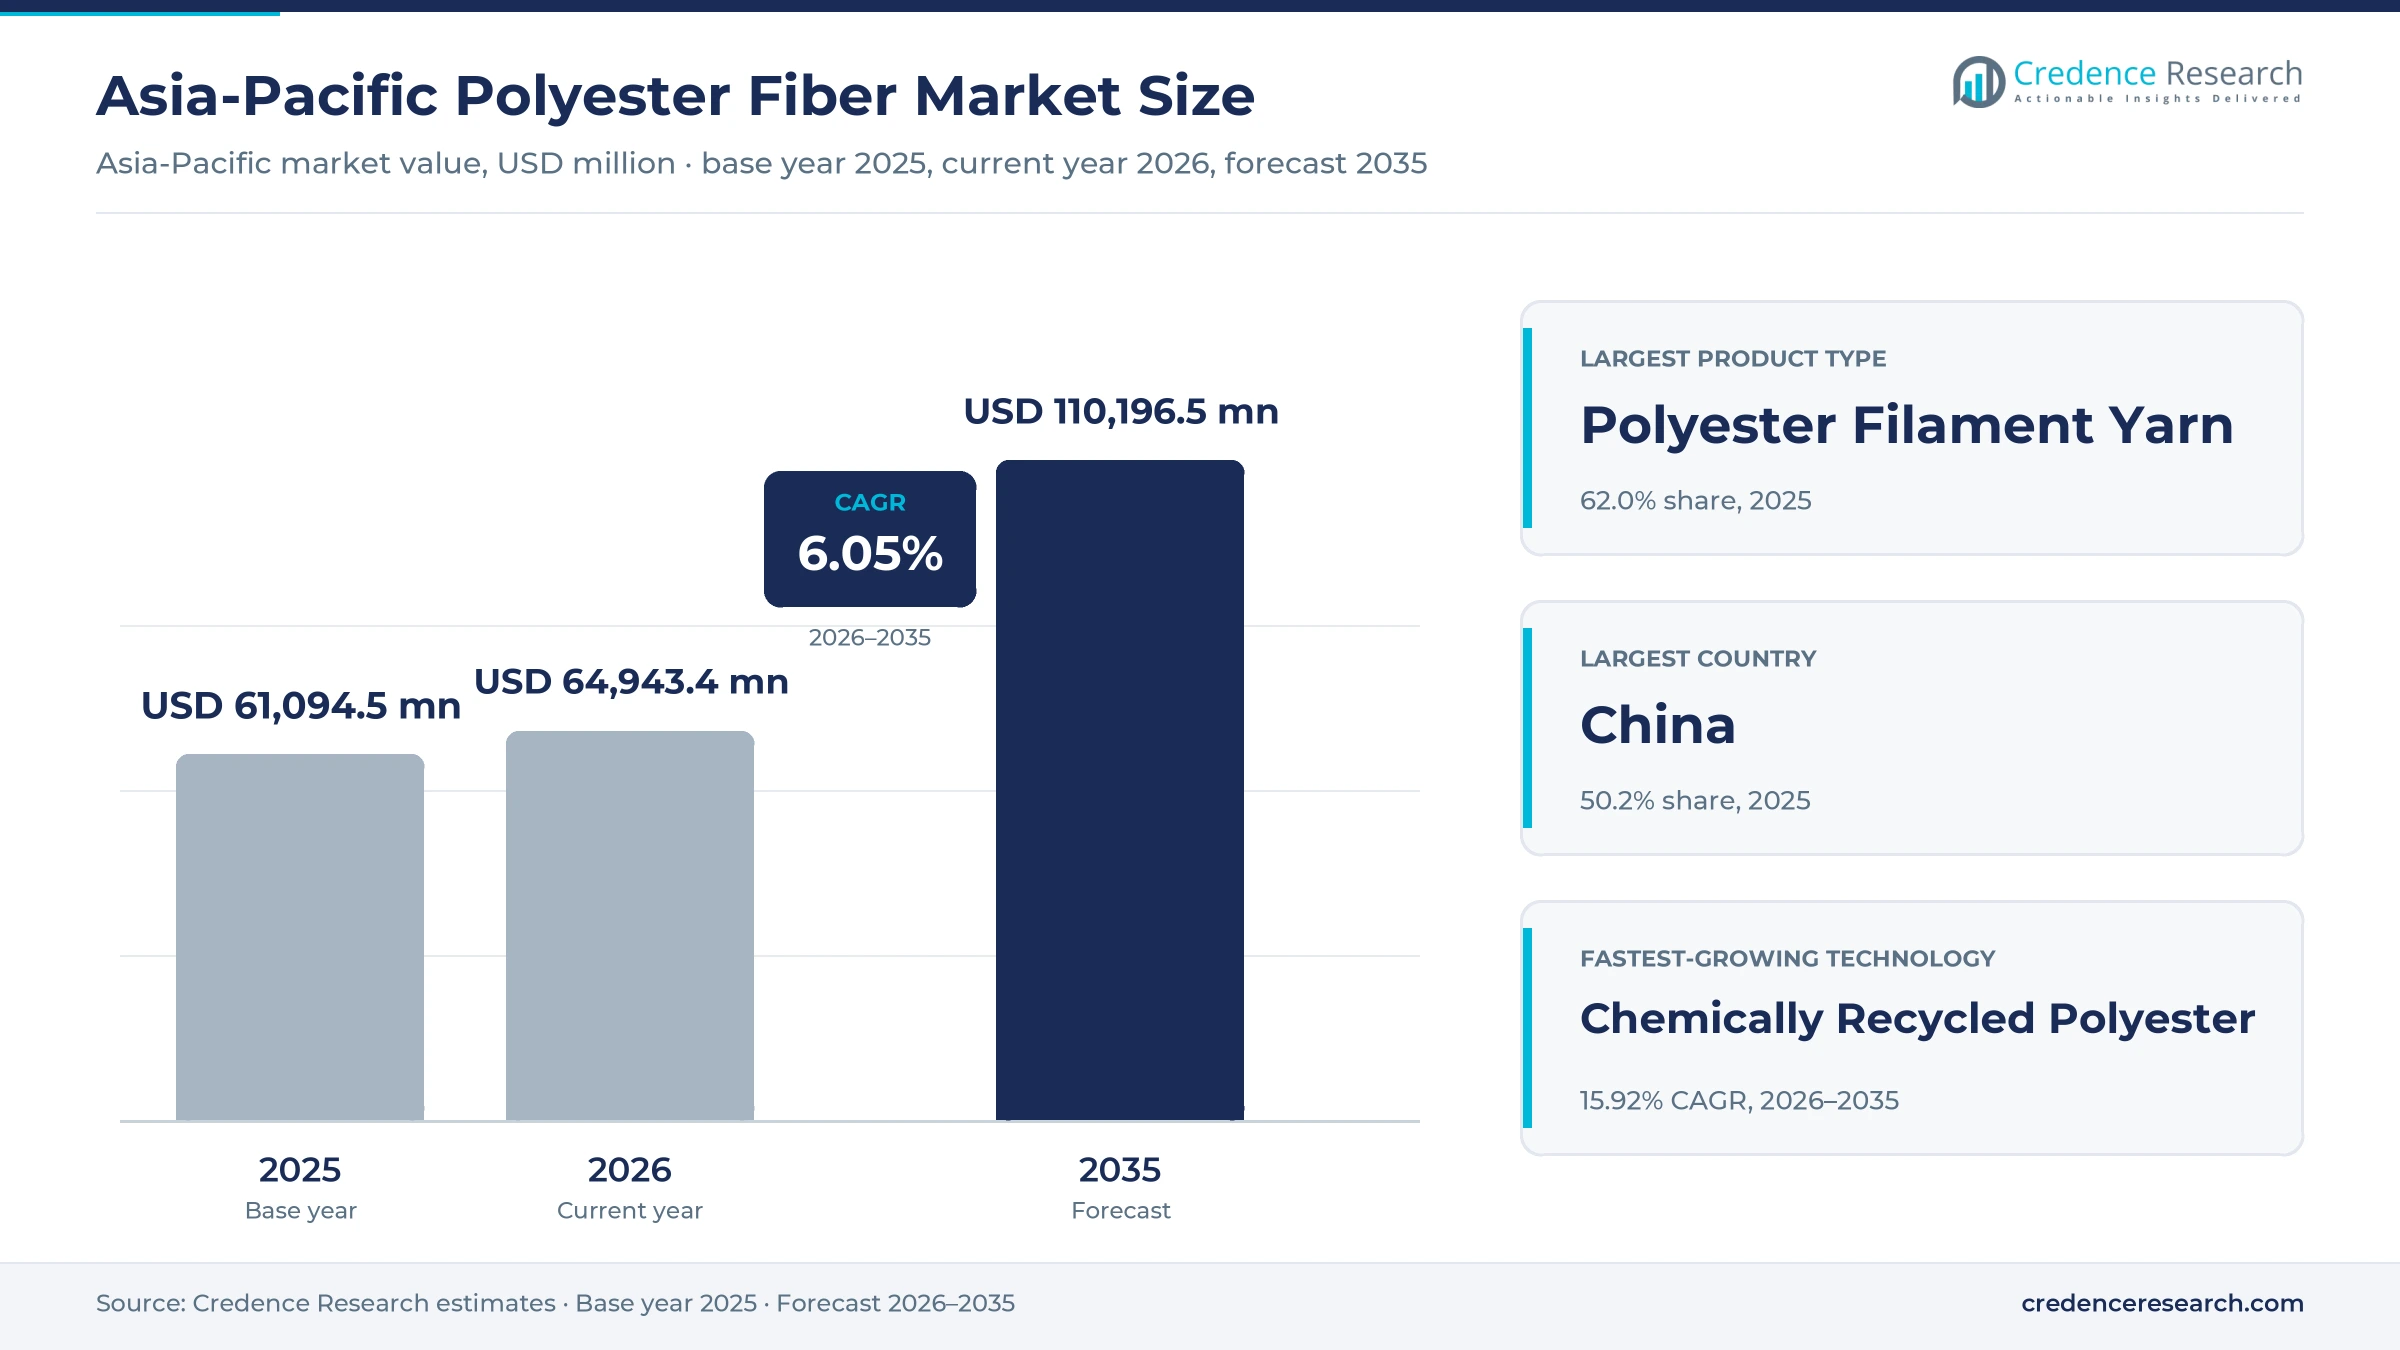
The Asia-Pacific polyester fiber market was valued at USD 61.09 billion in 2025 and is projected to increase from USD 64.94 billion in 2026 to USD 110.20 billion by 2035, registering a CAGR of 6.05% during 2026–2035. Demand comes from spinners, weavers, knitters, nonwoven converters and filling makers that turn filament yarn and staple fiber into apparel, home textiles, car interiors and hygiene products. China held the largest share, 50.2% in 2025, because its chemical fiber output reached about 87 million tons that year. India is the fastest-growing country at 7.66% a year, as man-made fibers now account for more than half of household textile spending there. The supply side is also changing, because producers are adding textile-to-textile recycling lines beside their bottle-based recycled grades. As a result, traceable recycled content is becoming a contract term for export garment makers rather than a niche premium.
Which fibers and yarns does the estimate count?
The estimate measures the value of solid and hollow staple fiber and filament yarn, including partially oriented, fully drawn, textured and industrial yarn, sold by producers across China, India, Japan, South Korea, Taiwan and the rest of the region. It covers virgin output and grades made from recycled bottles or textile waste.
The estimate excludes bottle-grade resin, film, chips sold for packaging and finished fabrics, which are counted in their own markets. The value chain runs from paraxylene and glycol producers through polymerization and spinning plants to yarn mills, fabric makers, nonwoven converters and filling manufacturers.
Asia-Pacific Polyester Fiber Market Insights
- The Asia-Pacific polyester fiber market was valued at USD 61.09 billion in 2025 and is projected to reach USD 110.20 billion by 2035, registering a CAGR of 6.05% during 2026–2035.
- China held 50.2% of 2025 value, because its chemical fiber output reached 87.01 million tons in 2025, up 4.9% from 2024.
- Polyester filament yarn led with 62.0% of 2025 value, as knitted and woven fabric makers rely on drawn and textured yarn.
- Indorama Ventures and Jiaren Chemical Recycling formed a joint venture in November 2025 targeting up to 100,000 tons a year of textile-recycled spinning capacity.
- India withdrew quality control orders on staple fiber, filament yarn, terephthalic acid and glycol on Nov. 12, 2025, which eased imports of inputs.
Filament yarn, apparel and virgin output lead value
Why does filament yarn carry most value?
Based on product type, the market is categorized into Solid Polyester Staple Fiber, Hollow Polyester Staple Fiber and Polyester Filament Yarn. Polyester Filament Yarn led with 62.0% of 2025 value, because Chinese direct-spun lines supply most knitted and woven fabric mills. Hollow Polyester Staple Fiber grows fastest at 6.87% a year, as pillow, quilt and padding makers switch to siliconized hollow grades that hold loft after washing.
How do apparel and technical uses compare?
Based on end-use industry, the market is categorized into Textile and Apparel, Home Furnishing, Automotive and Technical and Nonwoven Products. Textile and Apparel led with 58.0% of 2025 value, because garment exporters in China, Vietnam and India buy most yarn. Technical and Nonwoven Products grows fastest at 7.21% a year, as filtration, geotextile and hygiene producers of technical textiles expand capacity.
How fast are recycled grades gaining ground?
Based on technology, the market is categorized into Virgin Polyester Production, Mechanically Recycled Polyester and Chemically Recycled Polyester. Virgin Polyester Production led with 87.0% of 2025 value, because fossil feedstock still supplies most output across the region. Chemically Recycled Polyester grows fastest at 15.92% a year, as producers build depolymerization lines that turn discarded garments into yarn with virgin-like quality.
Why do direct contracts dominate fiber sales?
Based on sales channel, the market is categorized into Direct Contract Sales, Direct Spot Sales and Distributor-mediated Sales. Direct Contract Sales led with 55.0% of 2025 value, because large weaving and knitting groups lock in monthly volumes with integrated producers. Direct Contract Sales also grows fastest at 6.32% a year, as brands require certified recycled content that only contracted supply chains can document.
| Segment Group | Leading Sub-segment | Share, 2025 | Fastest-growing Sub-segment | CAGR, 2026–2035 |
|---|---|---|---|---|
| By Product Type | Polyester Filament Yarn | 62.0% | Hollow Polyester Staple Fiber | 6.87% |
| By End-Use Industry | Textile and Apparel | 58.0% | Technical and Nonwoven Products | 7.21% |
| By Technology | Virgin Polyester Production | 87.0% | Chemically Recycled Polyester | 15.92% |
| By Sales Channel | Direct Contract Sales | 55.0% | Direct Contract Sales | 6.32% |
Request a Free Sample
Fill in your details and we'll send you a free sample report.
- Sample data tables & charts
- Research methodology
Sourcing scale and integrated plants lift fiber demand
How does textile sourcing scale anchor demand?
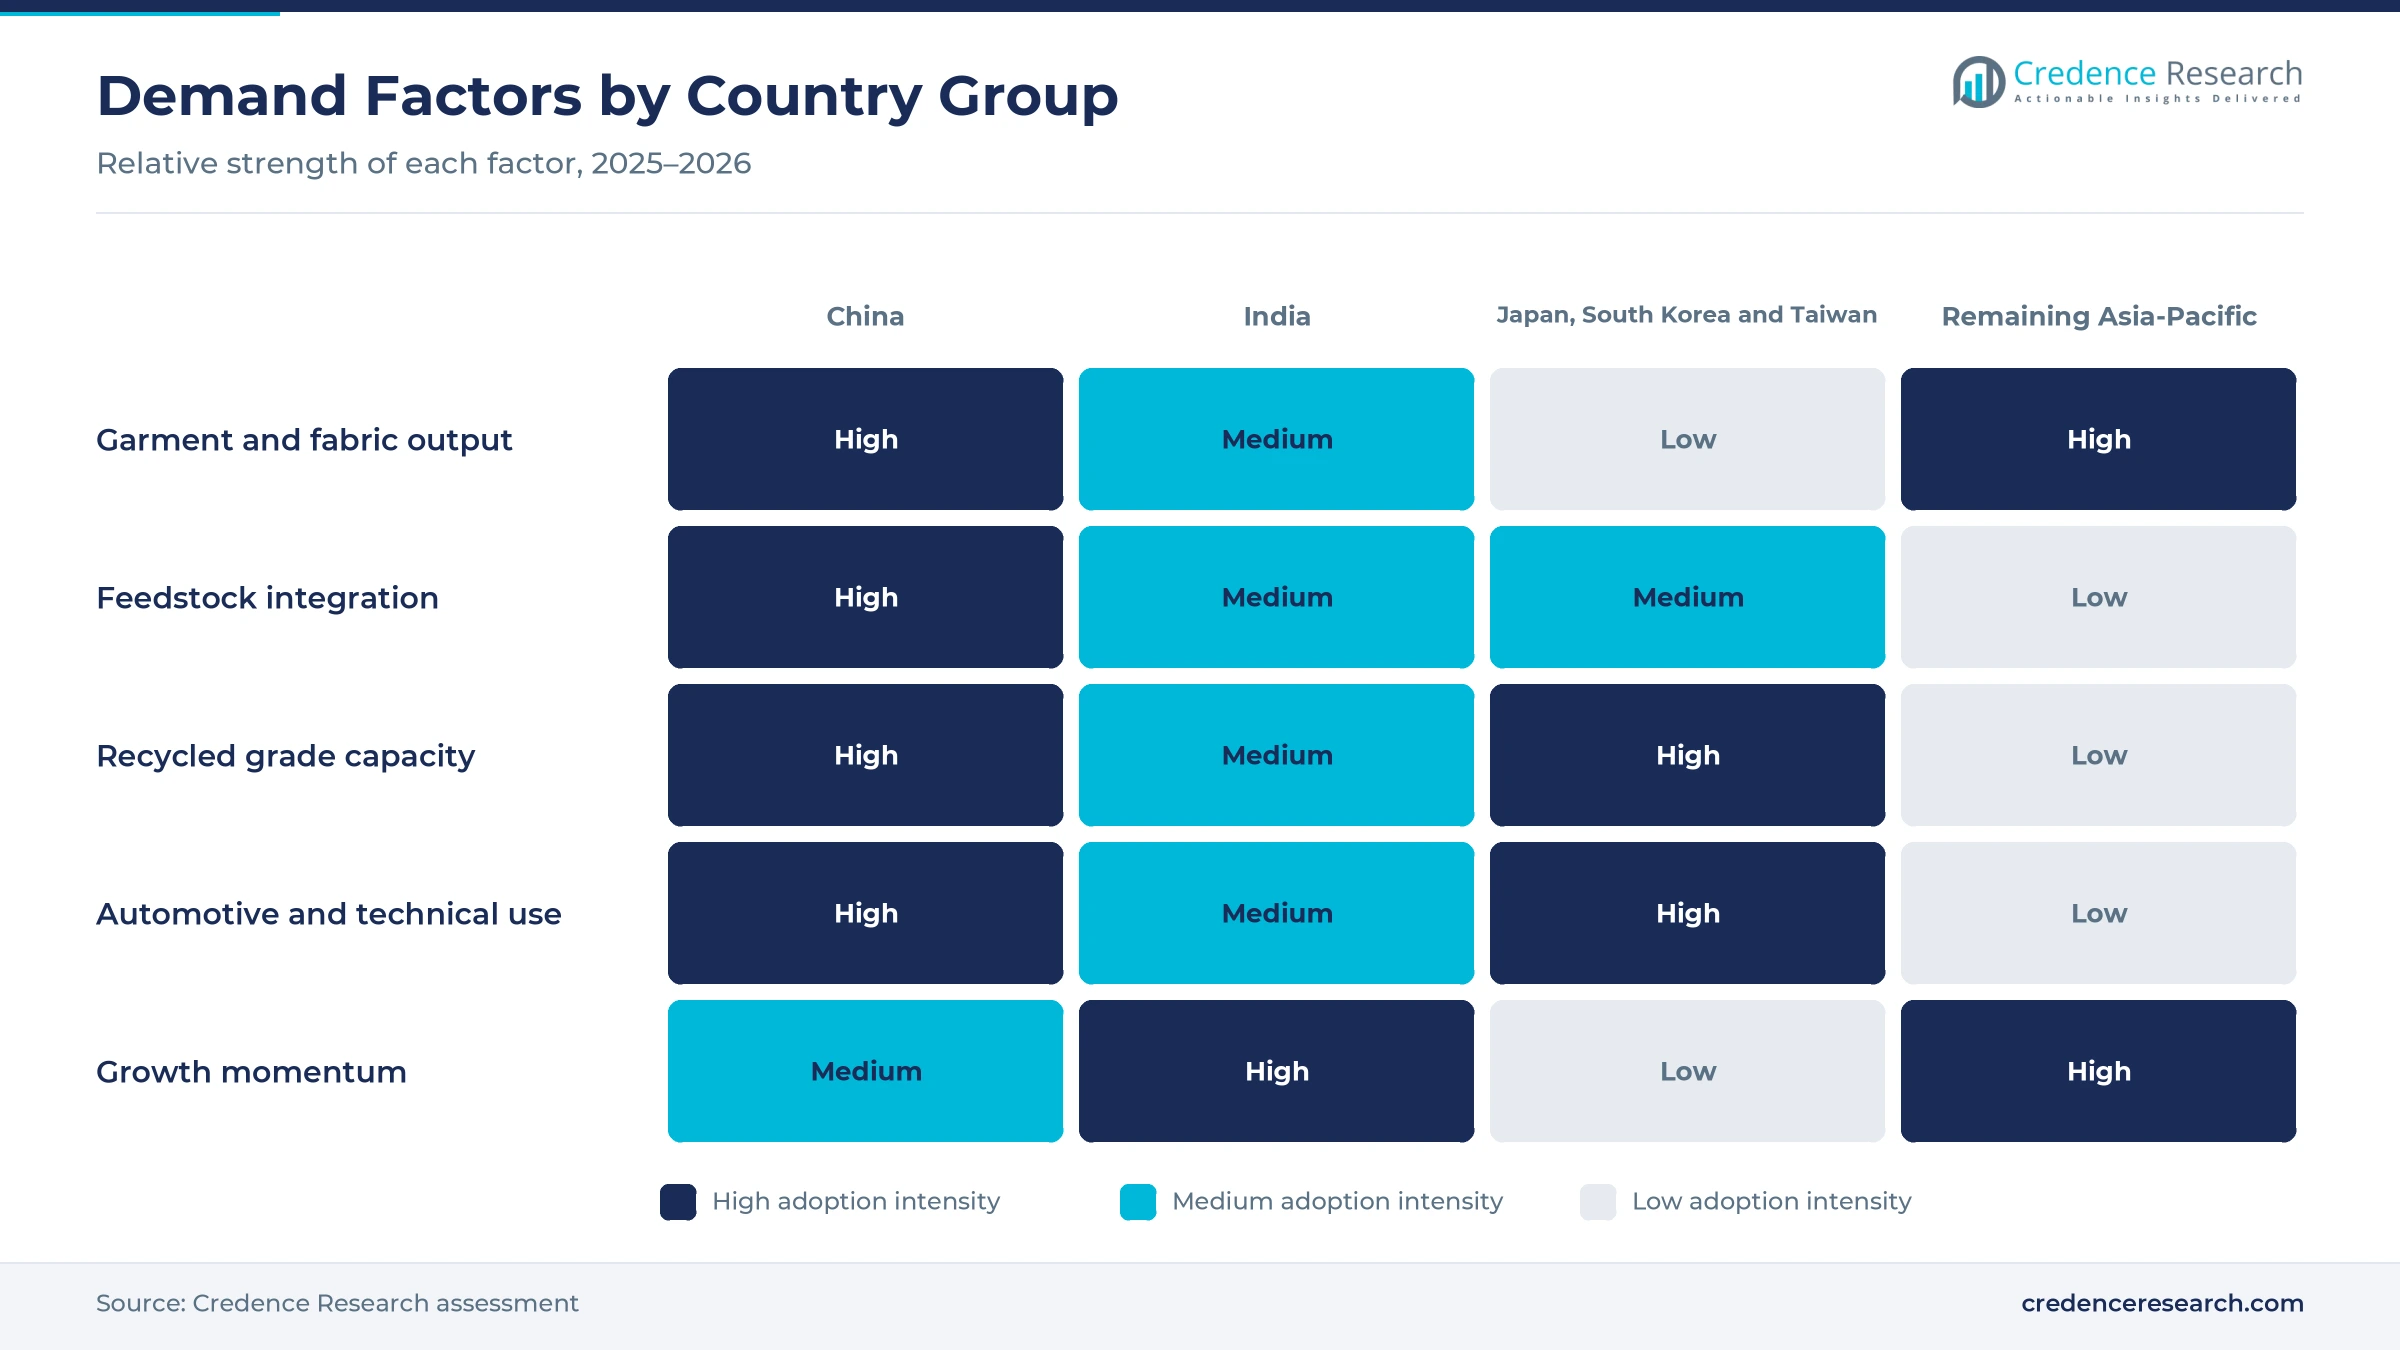
The region spins, weaves and sews most of the world's synthetic textiles, so fabric output translates directly into fiber orders. China produced 87.01 million tons of chemical fiber in 2025, up 4.9% from 2024, and 22.16 million tons of yarn, according to the National Bureau of Statistics of China. Vietnam expected textile and garment exports of USD 46 billion in 2025, up 5.6%, according to the Vietnam Textile and Apparel Association, as reported by Vietnam News. In India, a Ministry of Textiles household survey released in April 2026 found that man-made fibers and blends made up 52.2% of textile consumption in 2024. As a result, textile and apparel leads with 58.0% of 2025 value.
Why do integrated production platforms lift output?
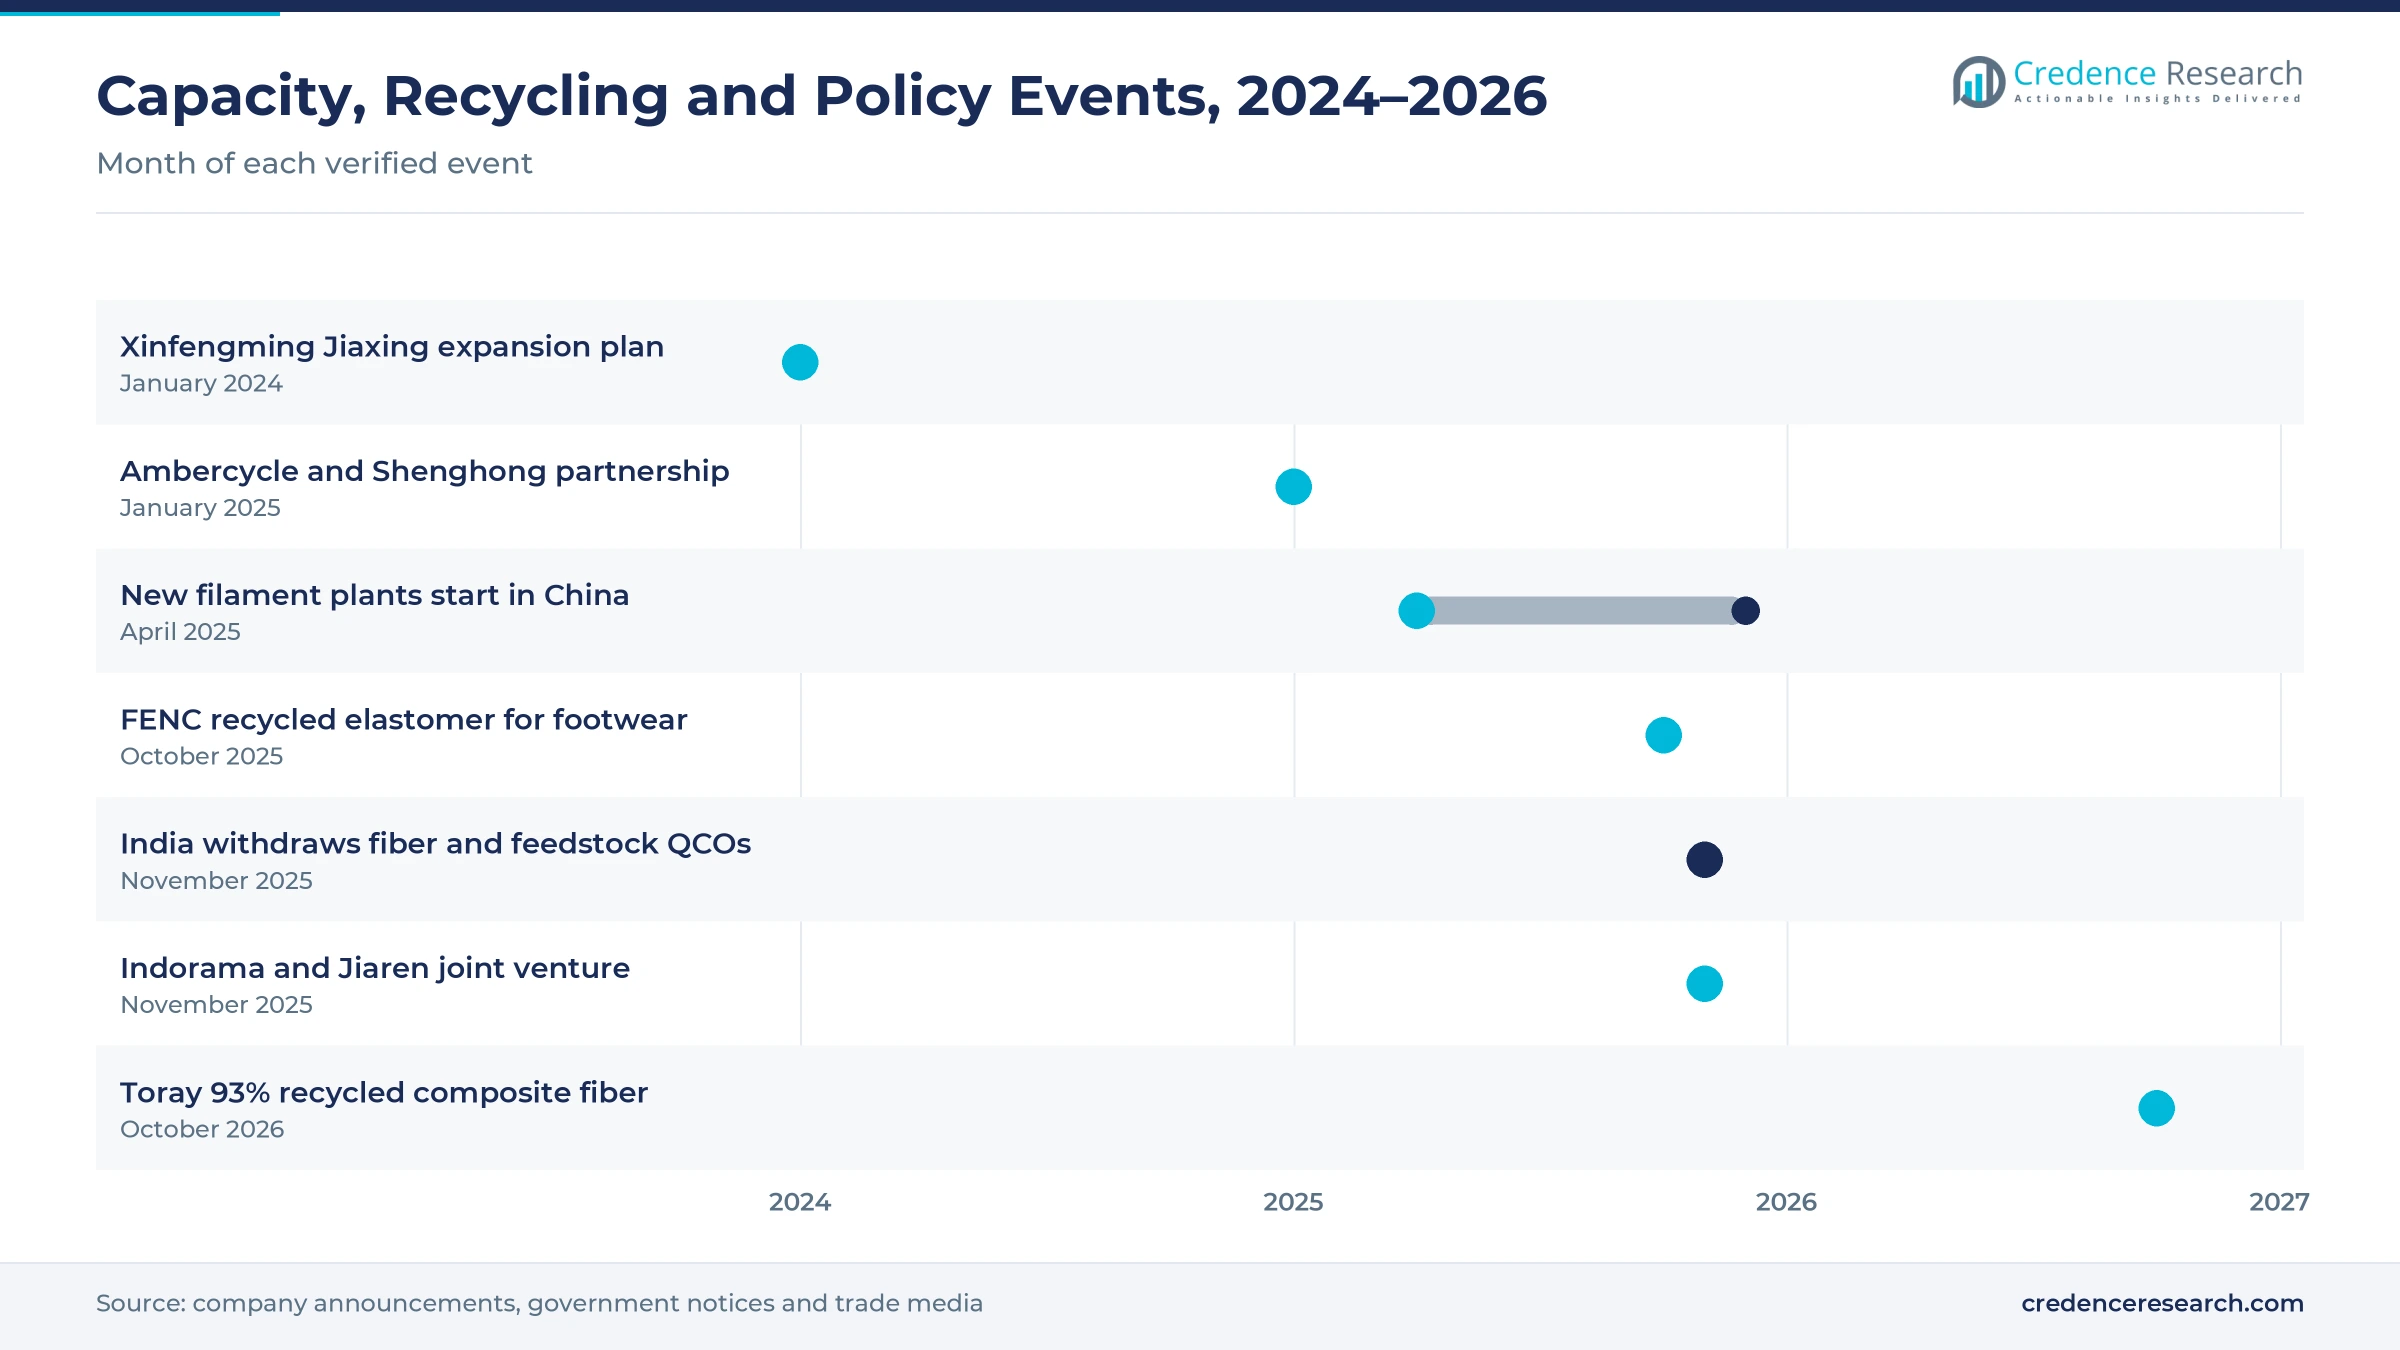
Producers that own paraxylene, purified terephthalic acid and polymer lines can run spinning plants at lower cost than buyers of merchant feedstock. Reliance Industries says it has 2.5 million tons a year of polyester fiber and yarn capacity in India and makes PET in a fully integrated chain from crude oil. Shenghong Group reported total capacity of 3.6 million tons a year of differentiated functional fibers, according to a January 2025 partnership release with Ambercycle. Xinfengming Group announced on Jan. 10, 2024, a CNY 20 billion plan in Jiaxing for 2.5 million tons a year of new fiber capacity, Yicai Global reported. Therefore, filament yarn holds 62.0% of 2025 value across the region.
How is traceable recycled procurement shaping orders?
Apparel brands now ask fiber suppliers to prove recycled content through certified chains of custody, which pushes producers to build documented recycled lines. Global recycled polyester output reached about 9.3 million tons in 2024, but its share of polyester slipped to 12% from 12.5%, according to Textile Exchange. Shenghong Group runs about 600,000 tons a year of recycled polyester capacity, the largest such base, and makes bottle-to-textile yarn by direct melt spinning. Indorama Ventures said its deja range in May 2025 added fibers and yarns made only from textile waste, with eleven ISCC Plus certified sites. As a result, direct contract sales hold 55.0% of 2025 value.
Why do vehicle and technical uses add new volume?
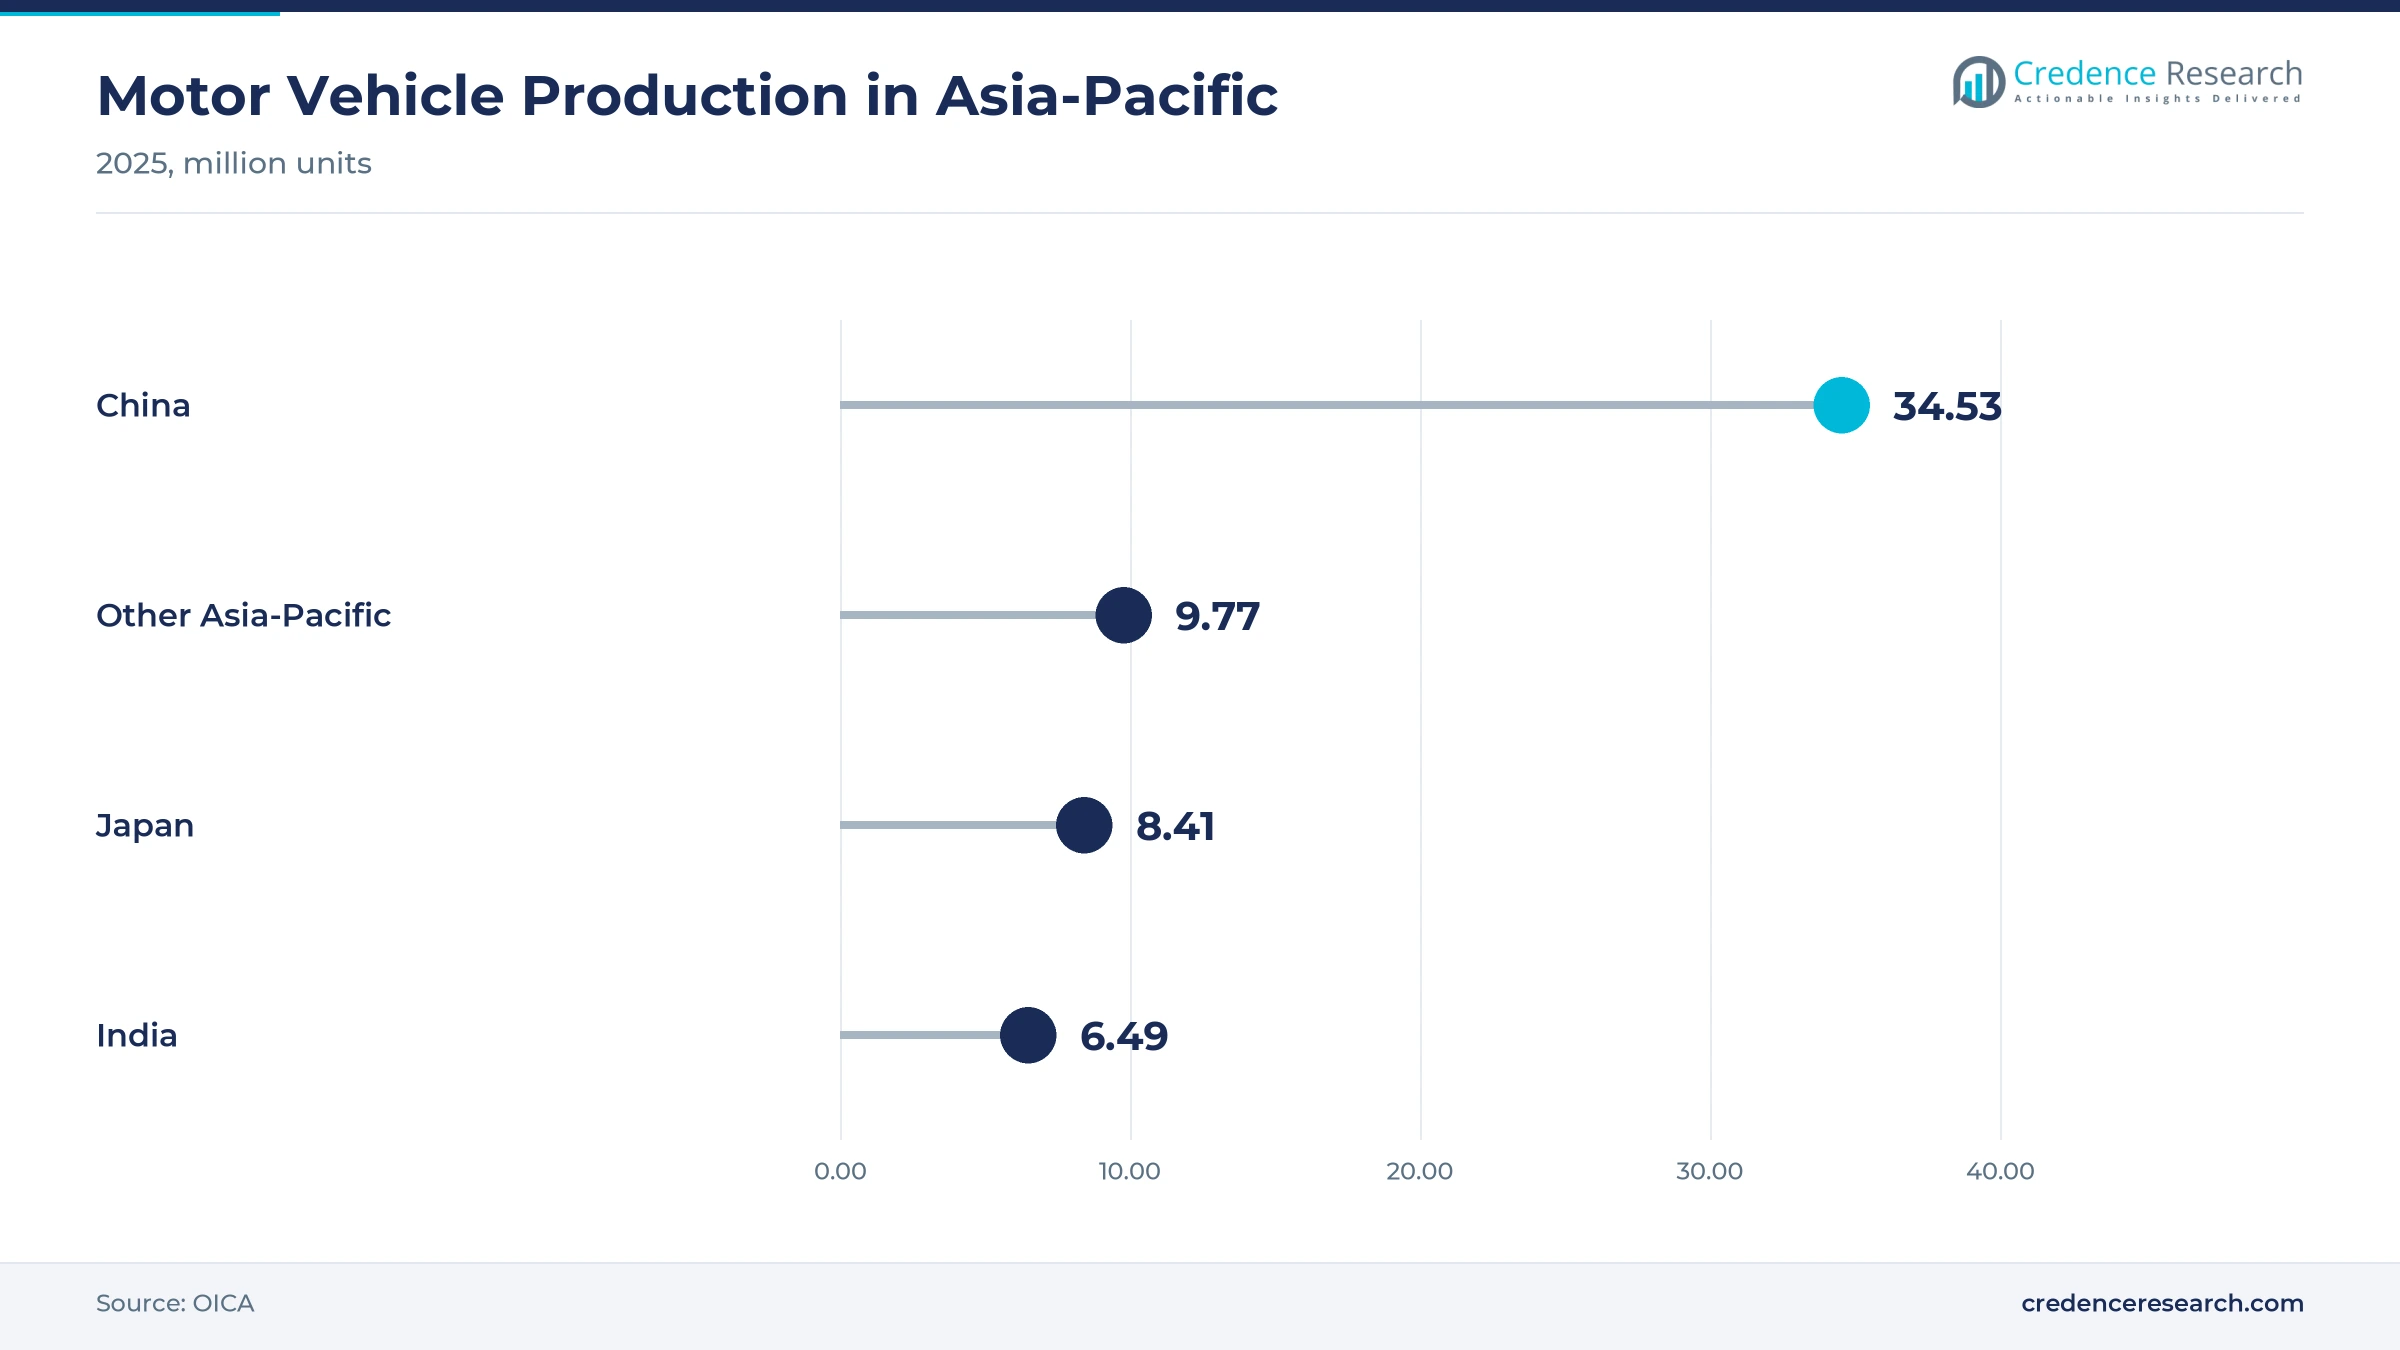
Car seats, headliners, carpets and filters use polyester yarn and staple fiber, so rising vehicle output in the region lifts technical demand beyond apparel. Asia-Pacific built about 59.2 million vehicles in 2025, up 7.6% and more than 61% of global output, according to OICA. China alone produced 34.53 million vehicles, while Japan made 8.41 million and India 6.49 million in the same year. Indorama Ventures markets its preventa FR flame-retardant fibers for automotive interiors, home textiles and apparel. Interior fabrics, seat belts and cabin filters each need specified polyester yarn grades that meet automaker flammability and durability tests. Therefore, technical and nonwoven products grow fastest at 7.21% a year, ahead of the apparel segment.
Textile recycling and Indian policy shifts reshape supply
How is textile-to-textile recycling changing supply?
Producers are moving beyond bottle flakes toward depolymerization of old garments, which creates a new feedstock that does not compete with packaging. Indorama Ventures and Jiaren Chemical Recycling formed a joint venture in November 2025, targeting up to 100,000 tons a year of textile-recycled spinning capacity, Hydrocarbon Processing reported. Ambercycle and Shenghong agreed on Jan. 7, 2025, to scale regenerated filament yarn made from end-of-life textiles in China. Toray said on Oct. 20, 2026, that it developed a polyester-nylon composite fiber with at least 93% recycled content for the fall 2027 season. As a result, chemically recycled polyester grows fastest at 15.92% a year.
Why is the shift in Indian input policy notable?
India removed several barriers to imported raw materials in late 2025, which lowered input costs for spinners and weavers that had faced certification delays. The government withdrew quality control orders on staple fiber, fully drawn yarn, partially oriented yarn, terephthalic acid and ethylene glycol on Nov. 12, 2025, according to Fibre2Fashion. The Ministry of Textiles approved 17 more applicants on Nov. 18, 2025, with committed investment of 2,374 crore rupees under its incentive scheme for man-made fiber products, News On AIR reported. Earlier rounds had approved 74 applicants across fabrics, apparel and technical textiles. Therefore, India is expected to grow faster than any other country group in the region.
Can southeast Asian garment hubs open new fiber demand?
Vietnam, Indonesia and neighboring garment exporters still import much of their yarn, which opens room for local and regional fiber plants. The Vietnam Textile and Apparel Association put the domestic localization rate at about 52% in November 2025 and set an export target of USD 64.5 billion by 2030, Vietnam News reported. Indorama Ventures showed recycled and flame-retardant fibers at Indo Intertex in Jakarta in April 2026 to serve customers through regional production. Far Eastern New Century also runs operations in Vietnam, Malaysia and the Philippines, according to its October 2025 release. As a result, Remaining Asia-Pacific grows at 7.06% a year.
Is the recycled content gap an opening for producers?
Brand targets for recycled fiber have run well ahead of supply, which leaves an opening for producers that can deliver certified grades at scale. Textile Exchange and the Fashion Industry Charter set a goal of 45% recycled polyester by 2025, with 85 brands and suppliers committed, and a longer aim of 90% by 2030. In practice, about 88% of polyester made in 2024 was still fossil-based, according to Textile Exchange. Reliance makes its R|Elan GreenGold fabric from recycled PET bottles using renewable energy. Therefore, recycled grades can win share in contracts where brands must close the gap.
Overcapacity and weak clothing exports squeeze margins
How does Chinese overcapacity weigh on prices?
New capacity in China keeps arriving faster than demand, which pushes down margins for spinners across the region. China's chemical fiber output rose 4.9% in 2025 while its yarn output slipped 0.1%, according to national statistics, which shows fiber supply growing faster than spinning demand. Xinfengming shares fell 10% on Jan. 11, 2024, on oversupply concerns after its expansion plan. In turn, smaller producers without feedstock integration face idle lines and tighter cash flow.
Why do weaker clothing exports hurt fiber orders?
Fiber demand depends on export garment orders, so softer clothing shipments from China reduce yarn purchases upstream. China's clothing and accessory exports fell 4.4% in 2025 to about CNY 1.08 trillion, while textile yarn and article exports rose only 1.0%, according to national statistics. As a result, mills cut operating rates and delay contract renewals when retail demand in Western markets slows. Producers respond by shifting sales toward home furnishing, nonwoven and automotive buyers.
Why is recycled feedstock hard to secure?
Recycled grades need clean bottles or sorted textile waste, and collection systems in many countries cannot supply enough consistent material. Textile Exchange found that recycled polyester fell to 12% of polyester output in 2024, down from 12.5% in 2023, even as total polyester volume grew. This means brands compete for limited certified flake and pay premiums that small mills cannot pass on. Investment in textile sorting and depolymerization is the main response, although new plants take years to scale.
How do feedstock swings and trade rules add risk?
Polyester prices follow paraxylene, terephthalic acid and glycol costs, so crude oil swings pass quickly through to fiber contracts. India kept changing its input rules between 2021 and 2025, issuing and then withdrawing quality control orders on key raw materials. In turn, buyers face sudden shifts in landed costs and import lead times. Producers with their own feedstock and plants in several countries manage this risk better than single-site spinners.
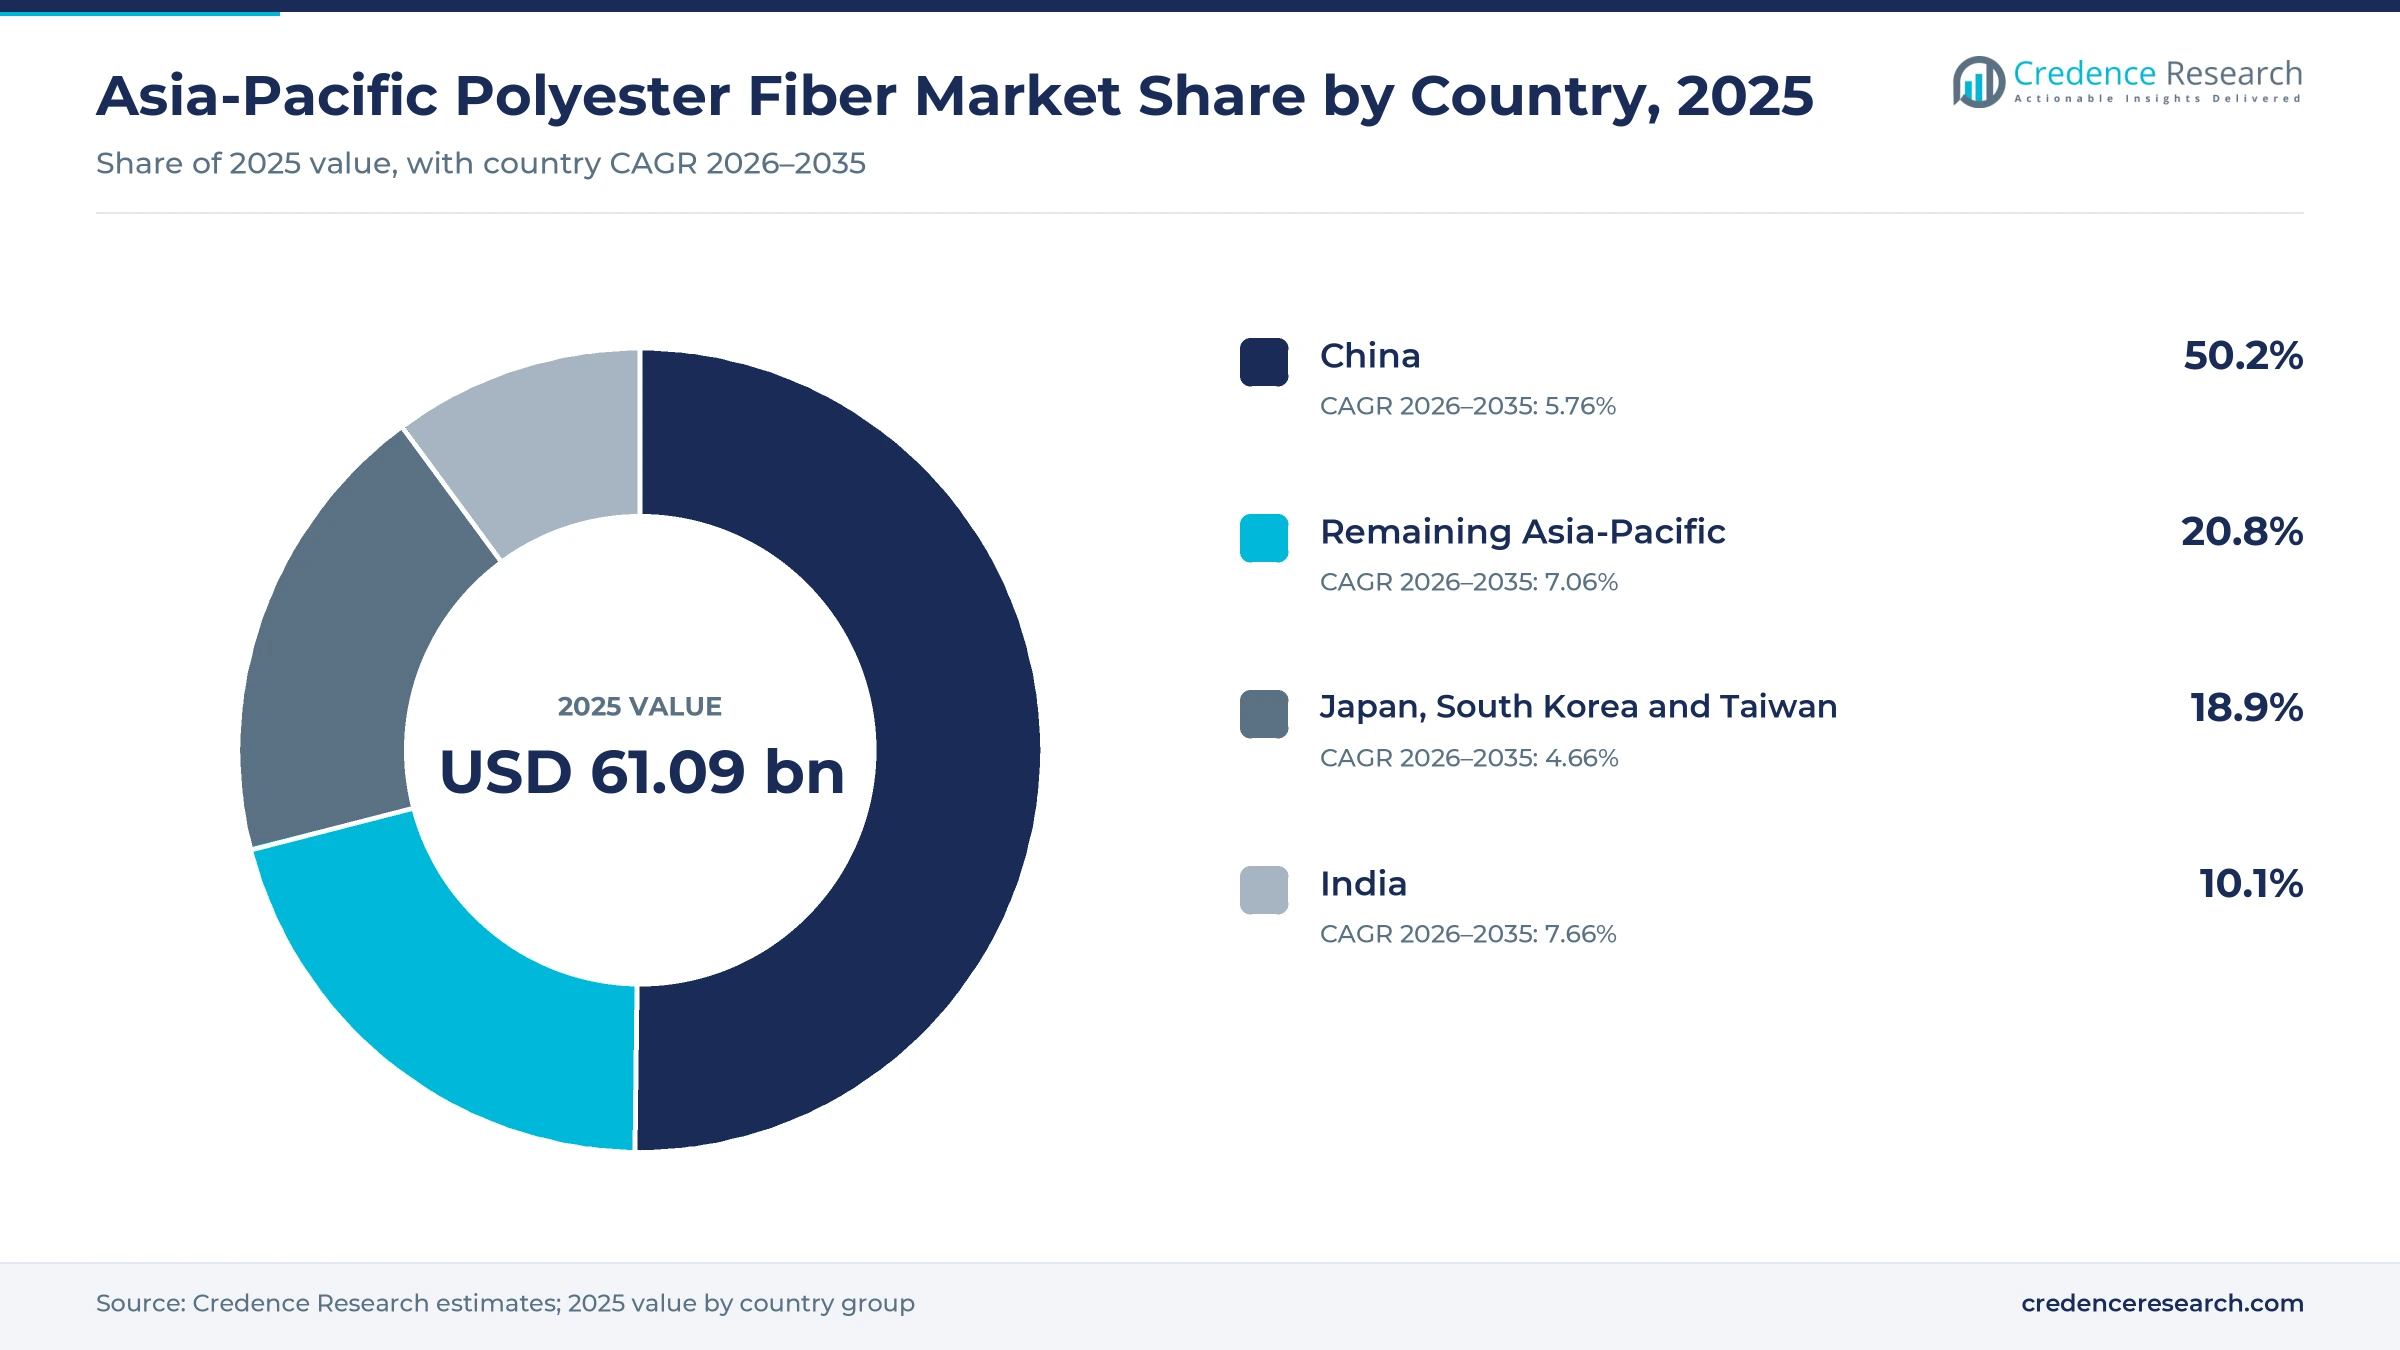
China leads while India grows fastest in the region
| Country | Value, 2025 (USD billion) | Share, 2025 | CAGR, 2026–2035 |
|---|---|---|---|
| China | 30.67 | 50.2% | 5.76% |
| Remaining Asia-Pacific | 12.71 | 20.8% | 7.06% |
| Japan, South Korea and Taiwan | 11.55 | 18.9% | 4.66% |
| India | 6.17 | 10.1% | 7.66% |
Why does China hold half of regional value?
China held 50.2% of 2025 value and grows at 5.76% a year, slightly below the regional rate. The country produced 87.01 million tons of chemical fiber and 30.67 billion meters of cloth in 2025, according to national statistics. Xinfengming reported 7.4 million tons of filament capacity and 1.2 million tons of staple fiber capacity in August 2023, and Shenghong runs bases in Suzhou and Suqian. As a result, China combines the largest spinning base with the deepest feedstock integration in the region.
Why are Japan, South Korea and Taiwan growing slowly?
Japan, South Korea and Taiwan held 18.9% of 2025 value and grows at 4.66% a year. These producers focus on specialty and functional grades rather than commodity volume, because labor and energy costs are higher. Toray develops high-recycled-content composite fibers in Japan, while Far Eastern New Century in Taiwan turns post-consumer bottles into recycled elastomer for footwear. Japan also built 8.41 million vehicles in 2025, which supports seat and interior fabric demand.
Why is Remaining Asia-Pacific gaining share?
Remaining Asia-Pacific held 20.8% of 2025 value and grows at 7.06% a year. Vietnam expected USD 46 billion of textile and garment exports in 2025, and Indonesia hosts large spinning and weaving clusters that buy regional fiber. Indorama Ventures, based in Thailand, serves these customers through production in the region. Demand for home textile products such as bedding and curtains also adds staple fiber volume in these economies.
Why is India the fastest-growing country?
India held 10.1% of 2025 value and grows fastest at 7.66% a year. Reliance Industries runs 2.5 million tons a year of polyester fiber and yarn capacity, and the country withdrew quality control orders on fiber, yarn and feedstock in November 2025. Imports of monoethylene glycol and terephthalic acid became easier after that change. Man-made fibers already make up more than half of household textile consumption, which supports steady domestic growth.
Capacity, recycling and policy moves from 2024 to 2026
| Development | Status and market relevance |
|---|---|
| In January 2024, Xinfengming Group announced a CNY 20 billion plan for 2.5 million tons a year of new fiber capacity in Jiaxing, China. | Phase one covers 650,000 tons over about three years |
| In January 2025, Ambercycle and Shenghong Group formed a partnership to scale regenerated filament yarn from end-of-life textiles in China. | Brings textile-derived feedstock into Chinese yarn supply |
| In October 2025, Far Eastern New Century said it commercialized recycled elastomer made from post-consumer PET bottles for footwear. | Supplied to a French sports brand for midsoles |
| In November 2025, Indorama Ventures and Jiaren Chemical Recycling formed a joint venture for textile-to-textile recycling. | Targets up to 100,000 tons a year of spinning capacity |
| In October 2026, Toray Industries developed a polyester-nylon composite fiber with at least 93% recycled content. | Fabric launch planned for the fall and winter 2027 season |
Direct melt spinning and depolymerization reshape output
- Direct melt spinning feeds molten polymer straight to spinnerets without chipping, which cuts energy use and lets Shenghong make bottle-to-textile yarn at scale.
- Depolymerization breaks discarded polyester garments back into monomers, which lets the Indorama and Jiaren venture make yarn from textile waste.
- Hollow conjugate spinning forms fibers with air channels and crimp, which gives pillows, quilts and padding more loft at lower weight.
- Flame-retardant polymer modification builds fire resistance into the fiber itself, which helps grades such as preventa FR meet automotive interior and home textile rules.
Need a Custom Version of This Report?
Tailor the scope, geography, or segments to your exact requirements.
- Custom geography or segment scope
- Direct access to our analyst team
Integrated Chinese groups compete with regional majors
Competition combines Chinese groups that integrate refining, terephthalic acid and spinning with Indian, Taiwanese, Japanese and Thai producers that focus on specialty and recycled grades. Shenghong Group reports 3.6 million tons a year of differentiated fiber capacity and about 600,000 tons of recycled capacity. Xinfengming Group announced a CNY 20 billion expansion in Jiaxing in January 2024. Reliance Industries runs 2.5 million tons a year of fiber and yarn capacity in India under the Recron brand. Far Eastern New Century and Toray Industries compete on recycled and functional innovation. Indorama Ventures sells its deja recycled range through plants across the region. Producers compete on feedstock cost, product range, certified recycled content and delivery reliability to large mills.
Companies profiled and their roles in this market
| Company | Type | Role in the market |
|---|---|---|
| Shenghong Group | Integrated Chinese producer | Reports 3.6 million tons a year of differentiated fiber capacity and about 600,000 tons of recycled capacity |
| Xinfengming Group | Chinese filament producer | Announced a CNY 20 billion plan for 2.5 million tons a year of new capacity in Jiaxing in January 2024 |
| Reliance Industries | Integrated Indian producer | Runs 2.5 million tons a year of fiber and yarn capacity under the Recron brand |
| Far Eastern New Century | Taiwanese producer | Commercialized bottle-derived recycled elastomer for footwear in October 2025 |
| Toray Industries | Japanese fiber maker | Developed a composite fiber with at least 93% recycled content in October 2026 |
| Indorama Ventures | Thai-based global producer | Formed a textile recycling joint venture with Jiaren Chemical Recycling in November 2025 |
Credence Research view on regional synthetic supply
Credence Research's view is that Asia-Pacific fiber demand will keep growing with garment, home textile and technical output, but value will shift toward certified recycled and specialty grades. China remains the anchor because of its integrated capacity, while India adds the most new growth after its input rules eased. Overcapacity in Chinese filament and staple lines will keep commodity margins thin for several years. Producers that combine feedstock integration with textile-to-textile recycling are best placed as brands tighten recycled content rules across the region.
How the regional estimate was built
The report uses 2025 as the base year and presents market values in USD billion through 2035. Market values come from the Credence Research model, and country, product type, end-use industry, technology and sales channel splits are Credence Research estimates. Country shares follow the Credence Research regional model, checked against chemical fiber output, garment export data and producer capacity for each group. Inputs include national statistics, industry association data, company press releases and trade media reports. No interviews or surveys were used in preparing these estimates.
Recycled grades and India lead growth to 2035
The Asia-Pacific polyester fiber market is expected to reach USD 110.20 billion by 2035, a 6.05% CAGR during 2026–2035, as garment, home textile, automotive and nonwoven producers keep buying more yarn and staple fiber. India and Remaining Asia-Pacific should gain share, while China stays the largest country market by a wide margin. Chemically recycled grades and technical uses are expected to grow faster than the regional average. Prolonged overcapacity would lower this outlook, while faster brand adoption of recycled content would raise it.
Frequently Asked Questions
How big is the Asia-Pacific polyester fiber market?
Which country leads regional demand?
Which country grows fastest?
Which product type holds the largest share?
Which technology grows fastest?
How much polyester is recycled today?
Which end-use industry leads the market?
Who are the main companies in the market?
Table of Content
Chapter 1 Market Segmentation
- 1.1 Segmentation Framework
- 1.1.1 Product and Service Classification
- 1.1.2 Application and End-Use Classification
- 1.1.3 Technology and Solution Classification
- 1.1.4 Customer and Distribution Channel Classification
- 1.1.5 Geographic Segmentation
- 1.1.6 Market Segment Definitions and Boundaries
- 1.2 By Product Type
- 1.2.1 Polyester Filament Yarn
- 1.2.2 Solid Polyester Staple Fiber
- 1.2.3 Hollow Polyester Staple Fiber
- 1.3 By End-Use Industry
- 1.3.1 Textile and Apparel
- 1.3.2 Home Furnishing
- 1.3.3 Automotive
- 1.3.4 Technical and Nonwoven Products
- 1.4 By Technology
- 1.4.1 Virgin Polyester Production
- 1.4.2 Mechanically Recycled Polyester
- 1.4.3 Chemically Recycled Polyester
- 1.5 By Sales Channel
- 1.5.1 Direct Contract Sales
- 1.5.2 Direct Spot Sales
- 1.5.3 Distributor-mediated Sales
- 1.6 By Country
- 1.6.1 China
- 1.6.2 India
- 1.6.3 Japan, South Korea and Taiwan
- 1.6.4 Remaining Asia-Pacific
Chapter 2 Introduction
- 2.1 Report Objectives and Scope
- 2.2 Product Definition and Industry Terminology
- 2.3 Market Inclusions and Exclusions
- 2.4 Research Process
- 2.4.1 Primary Research and Expert Interviews
- 2.4.2 Secondary Research and Source Review
- 2.4.3 Top-Down and Bottom-Up Estimation
- 2.4.4 Data Triangulation and Verification
- 2.5 Market Size Measurement Basis
- 2.5.1 2025: USD 61.09 billion → 2035: USD 110.20 billion
- 2.6 Historical and Forecast Reference Periods
- 2.6.1 Historical Period: 2018-2025
- 2.6.2 Base Year: 2025
- 2.6.3 Forecast Period: 2025-2035
- 2.7 Research Assumptions and Limitations
Chapter 3 Executive Summary
- 3.1 Market Snapshot and Key Findings
- 3.2 Base-Year Market Size, 2025
- 3.3 Forecast Market Size, 2035
- 3.4 Revenue and Volume Growth Outlook
- 3.5 Key Demand and Supply Indicators
- 3.6 Leading Market Segments
- 3.7 Fastest-Growing Market Opportunities
- 3.8 Regional Performance Highlights
- 3.9 Technology and Industry Transformation
- 3.10 Competitive Landscape Summary
- 3.11 Analyst View and Strategic Implications
Chapter 4 Asia-Pacific Polyester Fiber Market Trends and Developments
- 4.1 Historical Industry Development, 2018-2025
- 4.2 Recent Market Trends and Developments
- 4.3 Demand and Customer Behavior Trends
- 4.4 Technology and Product Innovation
- 4.5 Artificial Intelligence, Automation and Digitalization
- 4.6 Local Manufacturing and Supply Chain Realignment
- 4.7 Industry Partnerships, Mergers and Acquisitions
- 4.8 Sustainability and Circular Economy Developments
- 4.9 Government and Private Sector Investment Trends
- 4.10 Emerging Business Models and Commercialization
- 4.11 Industry Developments and Announcements
Chapter 5 Asia-Pacific Polyester Fiber Market Production, Supply and Demand Analysis
- 5.1 Demand Trend and Consumption Analysis, 2018-2025
- 5.2 Demand Forecast, 2025-2035
- 5.3 Production and Output Trend, 2018-2025
- 5.4 Production and Output Forecast, 2025-2035
- 5.5 Installed Capacity and Capacity Utilization
- 5.6 Company-Wise Production Plants and Statistics
- 5.6.1 Installed Production Capacity
- 5.6.2 Actual Production
- 5.6.3 Planned Capacity and Expansion Targets
- 5.7 Supply Chain Structure and Procurement Trends
- 5.8 Supply-Demand Gap and Bottlenecks
- 5.9 Import Dependence and Sourcing Structure
- 5.10 Contract Manufacturing and Outsourcing
- 5.11 Regional Supply and Demand Concentration
Chapter 6 Asia-Pacific Polyester Fiber Market Pricing Analysis
- 6.1 Pricing Structure and Measurement
- 6.2 Historical Pricing Trends, 2018-2025
- 6.3 Pricing Outlook, 2025-2035
- 6.4 Average Selling Price and Unit Economics
- 6.5 Pricing by Product and Market Segment
- 6.6 Geographic Pricing Differences
- 6.7 Key Input, Energy, Labor and Logistics Costs
- 6.8 Contract Pricing and Purchasing Models
- 6.9 Pricing Sensitivity and Competitive Positioning
- 6.10 Price, Margin and Profitability Implications
Chapter 7 Asia-Pacific Polyester Fiber Market Dynamics
- 7.1 Market Growth Drivers
- 7.1.1 Demand-Side Drivers
- 7.1.2 Technology and Innovation Drivers
- 7.1.3 Infrastructure and Investment Drivers
- 7.1.4 Regulatory and Policy Drivers
- 7.2 Market Restraints
- 7.2.1 Cost and Affordability Constraints
- 7.2.2 Technology and Adoption Barriers
- 7.2.3 Supply Chain and Operational Constraints
- 7.3 Market Challenges
- 7.3.1 Competitive Pressure and Margin Erosion
- 7.3.2 Skills, Infrastructure and Implementation Gaps
- 7.4 Emerging Market Opportunities
- 7.5 Market Dynamics Impact and Time-Horizon Assessment
Chapter 8 Asia-Pacific Polyester Fiber Value Chain Analysis
- 8.1 Industry Value Chain Overview
- 8.2 Upstream Suppliers and Critical Inputs
- 8.3 Technology and Component Providers
- 8.4 Manufacturing or Service Delivery
- 8.5 Distribution, Channel Partners and Integrators
- 8.6 Downstream Applications and End Users
- 8.7 Value Addition and Profit Pools
- 8.8 Vertical Integration and Outsourcing
- 8.9 Supplier Concentration and Risk
- 8.10 Supply Chain Localization and Resilience
Chapter 9 Asia-Pacific Polyester Fiber Market Regulations and Policies
- 9.1 Relevant Laws, Standards and Compliance Frameworks
- 9.2 Product, Service, Safety and Quality Requirements
- 9.3 Government Policies, Incentives and Subsidies
- 9.4 Imports, Exports and Trade Barriers
- 9.5 Public Procurement and Local Content Requirements
- 9.6 Environmental and Sustainability Compliance
- 9.7 Upcoming Policy Changes and Market Implications
Chapter 10 Asia-Pacific Polyester Fiber Market Hotspots and Opportunities
- 10.1 Market Opportunity Mapping and Growth Hotspots
- 10.2 High-Growth Applications and Customer Groups
- 10.3 Underserved Markets and White-Space Opportunities
- 10.4 Emerging Technology and Product Opportunities
- 10.5 New Capacity and Investment Hotspots
- 10.6 Market Entry and Expansion Opportunities
- 10.7 Distribution and Partnership Opportunities
- 10.8 Near-Term and Long-Term Commercial Potential
- 10.9 Opportunity Attractiveness and Execution Risks
Chapter 11 Asia-Pacific Polyester Fiber Market Outlook, 2025-2035
- 11.1 Market Size and Analysis
- 11.1.1 Revenue (Market Measurement: 2025: USD 61.09 billion → 2035: USD 110.20 billion)
- 11.1.2 Market Volume and Quantity Sold
- 11.1.3 Historical Market Size, 2018-2025
- 11.1.4 Base-Year Market Size, 2025
- 11.2 Market Forecast, 2025-2035
- 11.2.1 Revenue Forecast to 2035
- 11.2.2 Volume Forecast to 2035
- 11.2.3 CAGR and Year-on-Year Growth
- 11.2.4 Incremental Revenue Opportunity
- 11.3 Forecast Assumptions and Scenario Analysis
- 11.3.1 Base-Case Forecast
- 11.3.2 Optimistic and Conservative Scenarios
- 11.3.3 Technology, Pricing and Policy Sensitivities
- 11.4 Market Attractiveness and Growth Outlook
Chapter 12 Asia-Pacific Polyester Fiber Market Segmentation and Outlook
- 12.1 Segmentation Summary and Market Shares, 2025
- 12.2 Largest and Fastest-Growing Segments
- 12.3 By Product Type - Market Size and Forecast, 2025-2035
- 12.3.1 Segment Definition and Scope
- 12.3.2 Historical Market Size, 2018-2025
- 12.3.3 Revenue Forecast, 2025-2035
- 12.3.4 Volume Forecast, 2025-2035
- 12.3.5 Base-Year Market Share, 2025
- 12.3.6 Segment CAGR and Growth Drivers
- 12.3.7 Subsegment Market Size and Forecast
- 12.3.7.1 Polyester Filament Yarn
- 12.3.7.2 Solid Polyester Staple Fiber
- 12.3.7.3 Hollow Polyester Staple Fiber
- 12.3.8 Subsegment Pricing and Adoption Trends
- 12.3.9 Leading Suppliers and Competition
- 12.3.10 Regional Demand and Opportunities
- 12.4 By End-Use Industry - Market Size and Forecast, 2025-2035
- 12.4.1 Segment Definition and Scope
- 12.4.2 Historical Market Size, 2018-2025
- 12.4.3 Revenue Forecast, 2025-2035
- 12.4.4 Volume Forecast, 2025-2035
- 12.4.5 Base-Year Market Share, 2025
- 12.4.6 Segment CAGR and Growth Drivers
- 12.4.7 Subsegment Market Size and Forecast
- 12.4.7.1 Textile and Apparel
- 12.4.7.2 Home Furnishing
- 12.4.7.3 Automotive
- 12.4.7.4 Technical and Nonwoven Products
- 12.4.8 Subsegment Pricing and Adoption Trends
- 12.4.9 Leading Suppliers and Competition
- 12.4.10 Regional Demand and Opportunities
- 12.5 By Technology - Market Size and Forecast, 2025-2035
- 12.5.1 Segment Definition and Scope
- 12.5.2 Historical Market Size, 2018-2025
- 12.5.3 Revenue Forecast, 2025-2035
- 12.5.4 Volume Forecast, 2025-2035
- 12.5.5 Base-Year Market Share, 2025
- 12.5.6 Segment CAGR and Growth Drivers
- 12.5.7 Subsegment Market Size and Forecast
- 12.5.7.1 Virgin Polyester Production
- 12.5.7.2 Mechanically Recycled Polyester
- 12.5.7.3 Chemically Recycled Polyester
- 12.5.8 Subsegment Pricing and Adoption Trends
- 12.5.9 Leading Suppliers and Competition
- 12.5.10 Regional Demand and Opportunities
- 12.6 By Sales Channel - Market Size and Forecast, 2025-2035
- 12.6.1 Segment Definition and Scope
- 12.6.2 Historical Market Size, 2018-2025
- 12.6.3 Revenue Forecast, 2025-2035
- 12.6.4 Volume Forecast, 2025-2035
- 12.6.5 Base-Year Market Share, 2025
- 12.6.6 Segment CAGR and Growth Drivers
- 12.6.7 Subsegment Market Size and Forecast
- 12.6.7.1 Direct Contract Sales
- 12.6.7.2 Direct Spot Sales
- 12.6.7.3 Distributor-mediated Sales
- 12.6.8 Subsegment Pricing and Adoption Trends
- 12.6.9 Leading Suppliers and Competition
- 12.6.10 Regional Demand and Opportunities
- 12.7 By Country - Market Size and Forecast, 2025-2035
- 12.7.1 Segment Definition and Scope
- 12.7.2 Historical Market Size, 2018-2025
- 12.7.3 Revenue Forecast, 2025-2035
- 12.7.4 Volume Forecast, 2025-2035
- 12.7.5 Base-Year Market Share, 2025
- 12.7.6 Segment CAGR and Growth Drivers
- 12.7.7 Subsegment Market Size and Forecast
- 12.7.7.1 China
- 12.7.7.2 India
- 12.7.7.3 Japan, South Korea and Taiwan
- 12.7.7.4 Remaining Asia-Pacific
- 12.7.8 Subsegment Pricing and Adoption Trends
- 12.7.9 Leading Suppliers and Competition
- 12.7.10 Regional Demand and Opportunities
- 12.8 Segment Growth Comparison
- 12.9 Segment Attractiveness and Priority Matrix
Chapter 13 Asia-Pacific Polyester Fiber End-Use and Application Market Outlook
- 13.1 End-Use Industry and Customer Demand Structure
- 13.2 Leading Applications and Customer Groups
- 13.3 End-Use Market Size, Share and Forecast
- 13.4 Major End-Use Industry Deep Dives
- 13.4.1 Customer Requirements and Use Cases
- 13.4.2 Demand and Replacement Cycles
- 13.4.3 Technical and Regulatory Considerations
- 13.4.4 Purchasing and Procurement Models
- 13.4.5 Leading Vendors and Distribution Channels
- 13.4.6 Forecast and Commercial Opportunities
- 13.5 Emerging Applications and Cross-Segment Demand
- 13.6 End-Use Industry Investment Priorities
Chapter 14 Asia-Pacific Polyester Fiber Geographic Market Outlook, 2025-2035
- 14.1 Regional Market Size and Country-Level Shares, 2025
- 14.2 Country Market Size Comparison, 2025
- 14.3 Country Market Forecasts, 2025-2035
- 14.4 Subregional Industrial and Demand Clusters
- 14.5 Intra-Regional Pricing and Cost Differences
- 14.6 Cross-Border Trade and Supply Networks
- 14.7 Regional Supply and Demand Balances
- 14.8 Country Opportunity Comparison and Prioritization
Note: Every listed country is covered on the structure shown under the first country.
Chapter 15 Asia-Pacific Polyester Fiber Technology, Innovation and Sustainability Outlook
- 15.1 Technology Landscape and Maturity
- 15.2 Product, Process and Service Innovation
- 15.3 AI, Automation and Digital Tools in the Industry
- 15.4 Technology Adoption and Performance Benchmarking
- 15.5 Innovation Pipeline and R&D Investment
- 15.6 Patent and Intellectual Property Trends
- 15.7 Energy Efficiency and Resource Management
- 15.8 Sustainability, Recycling and Circularity
- 15.9 Technology Roadmap, 2025-2035
- 15.10 Risks of Obsolescence and Technology Substitution
Chapter 16 Asia-Pacific Polyester Fiber Market Key Strategic Imperatives
- 16.1 Growth and Market Entry Priorities
- 16.2 High-Return Products and Segments
- 16.3 Pricing, Profitability and Cost Optimization
- 16.4 Technology Investment and Product Differentiation
- 16.5 Supply Chain Localization and Resilience
- 16.6 Distribution and Customer Acquisition
- 16.7 Partnership, Acquisition and Capacity Strategy
- 16.8 Regional Expansion Priorities
- 16.9 Short-, Medium- and Long-Term Actions
Chapter 17 Competition Outlook
- 17.1 Industry Competition Characteristics
- 17.2 Market Structure and Concentration
- 17.3 Market Share and Competitive Positioning, 2025
- 17.4 Company-Wise Revenue and Product Benchmarking
- 17.5 Production and Service Capacity Benchmarking
- 17.6 Technology, Pricing and Differentiation
- 17.7 Regional Footprint and Distribution Strength
- 17.8 Mergers, Acquisitions and Strategic Alliances
- 17.9 New Entrants and Competitive Threats
- 17.10 Porter's Five Forces and Industry Attractiveness
- 17.11 Competitive Outlook, 2025-2035
Chapter 18 Company Profiles
- 18.1 Company Coverage and Selection Criteria
- 18.2 Hengli Petrochemical
- 18.2.1 Business Description
- 18.2.2 Company Ownership and Geographic Presence
- 18.2.3 Product and Service Portfolio
- 18.2.4 Manufacturing and Operating Footprint
- 18.2.5 Production Capacity and Expansion Plans
- 18.2.6 Financial Performance and Investment
- 18.2.7 Market Share and Competitive Position
- 18.2.8 Technology and Innovation Capabilities
- 18.2.9 Strategic Alliances or Partnerships
- 18.2.10 Recent Developments
- 18.2.11 Growth Strategy and Outlook
- 18.3 Tongkun Group
- 18.4 Zhejiang Hengyi Group
- 18.5 Shenghong Group
- 18.6 Xinfengming Group
- 18.7 Reliance Industries
- 18.8 Sinopec Yizheng Chemical Fibre
- 18.9 Far Eastern New Century
- 18.10 Toray Industries
- 18.11 Indorama Ventures
- 18.12 Other Relevant Market Participants
Note: Every listed company is profiled on the structure shown under the first company. The company list is preliminary and may change based on research findings, market developments, data availability and client requirements.
Chapter 19 Disclaimer
- 19.1 Research and Forecast Disclaimer
- 19.2 Data Source and Estimation Limitations
Note: The depth of individual sections depends on data availability for this market. Volume, capacity, trade and other unit-based metrics are included where applicable.

