
Food manufacturing and reformulation sustain demand
The Australia emulsifiers market was valued at USD 151.5 million in 2025 and is projected to increase from USD 165.0 million in 2026 to USD 245.2 million by 2035, registering a CAGR of 4.50% during 2026–2035. Demand comes from bakeries, dairy, confectionery, sauce and beverage makers that need stable textures, from cosmetic and personal-care formulators that blend creams and lotions, and from pharmaceutical and supplement producers. New South Wales and the Australian Capital Territory held the largest regional share, 34.1% in 2025, because the zone hosts the most food and personal-care plants and ingredient offices. Queensland is the fastest-growing region at 4.95% a year, as population growth and new food plants lift ingredient use. In turn, the national food regulator approved a new enzyme for degumming fats and oils in December 2025, which affects how vegetable oils and their by-products are refined.
Which emulsifying ingredients and buyers does the estimate cover?
The estimate measures the value of lecithin, mono- and diglycerides and their derivatives, sorbitan esters and polysorbates, and specialty blended systems sold to Australian manufacturers. It counts sales to food and beverage, personal-care, pharmaceutical, supplement and industrial users, whether supplied directly or through distributors.
The estimate excludes stabilizers and thickeners sold on their own, finished consumer products and exports of ingredients made in Australia. The value chain runs from oilseed crushers and global ingredient makers through technical distributors to brand owners and contract manufacturers in every state.
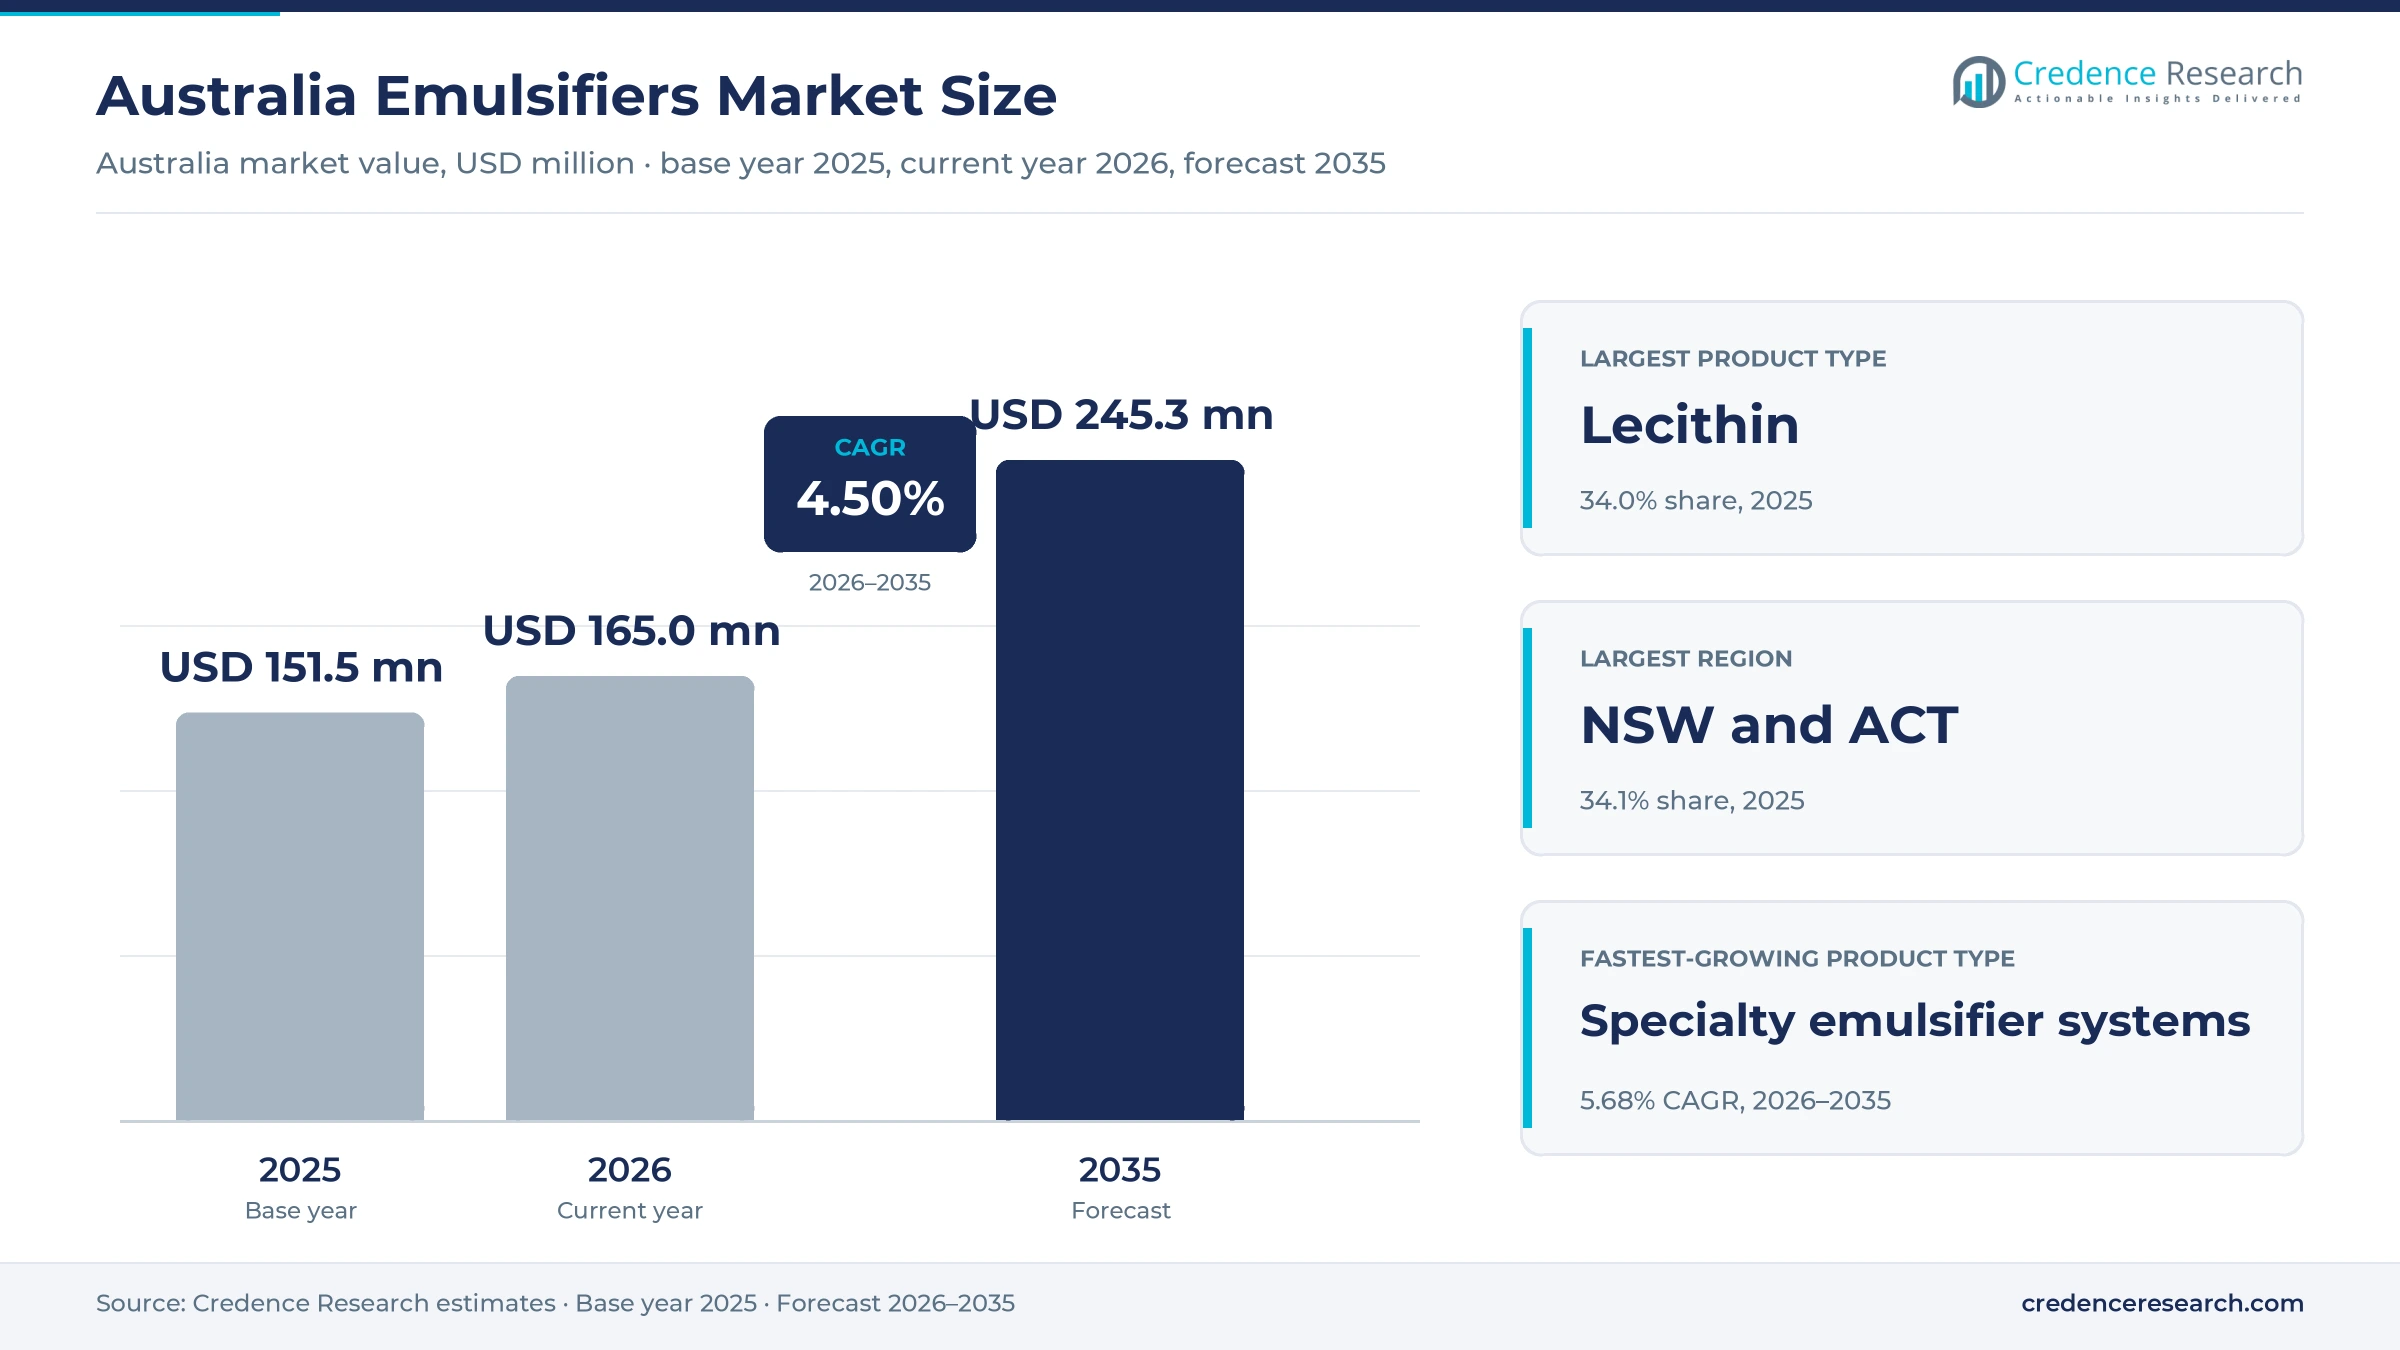
Australia Emulsifiers Market Insights
- The Australia emulsifiers market was valued at USD 151.5 million in 2025 and is projected to reach USD 245.2 million by 2035, registering a CAGR of 4.50% during 2026–2035.
- New South Wales and the Australian Capital Territory held a 34.1% share of 2025 value, because the zone hosts the most manufacturing plants.
- Lecithin led with a 34.0% share of 2025 value, because chocolate, bakery and instant powder makers use it at high volumes.
- BASF appointed Alchemy Agencies as its exclusive personal-care distributor for Australia and New Zealand from May 1, 2025.
- Specialty emulsifier systems grow fastest at 5.68% a year during 2026–2035, as manufacturers buy ready blends for complex recipes.
Lecithin leads while specialty systems grow fastest
Why does lecithin hold the largest share?
Based on product type, the market is categorized into lecithin, glycerides and derivatives, sorbitan esters and polysorbates, and specialty emulsifier systems. Lecithin led with a 34.0% share of 2025 value, because chocolate, bakery, margarine and instant powder makers use it at high volumes. Specialty Emulsifier Systems grow fastest at 5.68% a year, as manufacturers buy ready blends that solve texture, aeration and shelf-life problems in one step.
How do food makers and cosmetic formulators split demand?
Based on end-use industry, the market is categorized into food and beverage, personal care and cosmetics, pharmaceuticals and nutraceuticals, and industrial formulations. Food and Beverage led with a 62.0% share of 2025 value, because food and grocery manufacturing is the largest manufacturing sector in Australia. Personal Care and Cosmetics grows fastest at 5.30% a year, as local brands launch creams, sunscreens and lotions that need stable emulsions.
Why do brand owners still buy most volume?
Based on customer type, the market is categorized into brand-owned manufacturers, contract manufacturers and merchant formulators. Brand-Owned Manufacturers led with a 55.0% share of 2025 value, because large food, dairy and personal-care brands run their own plants. Contract Manufacturers grow fastest at 5.27% a year, as smaller brands outsource production of supplements, cosmetics and specialty foods to shared facilities.
How do direct sales and technical distributors reach buyers?
Based on sales channel, the market is categorized into direct manufacturer sales, exclusive technical distributors and multi-principal ingredient distributors. Direct Manufacturer Sales led with 45.0% of 2025 value, because large food plants buy lecithin and glycerides on annual contracts. Exclusive Technical Distributors grow fastest at 5.07% a year, as global makers hand local formulation support to specialist partners.
| Segment Group | Leading Sub-segment | Share, 2025 | Fastest-growing Sub-segment | CAGR, 2026–2035 |
|---|---|---|---|---|
| By Product Type | Lecithin | 34.0% | Specialty Emulsifier Systems | 5.68% |
| By End-Use Industry | Food and Beverage | 62.0% | Personal Care and Cosmetics | 5.30% |
| By Customer Type | Brand-Owned Manufacturers | 55.0% | Contract Manufacturers | 5.27% |
| By Sales Channel | Direct Manufacturer Sales | 45.0% | Exclusive Technical Distributors | 5.07% |
Request a Free Sample
Fill in your details and we'll send you a free sample report.
- Sample data tables & charts
- Research methodology
Food output, premium recipes and local know-how lift demand
How does recurring food manufacturing demand anchor volumes?
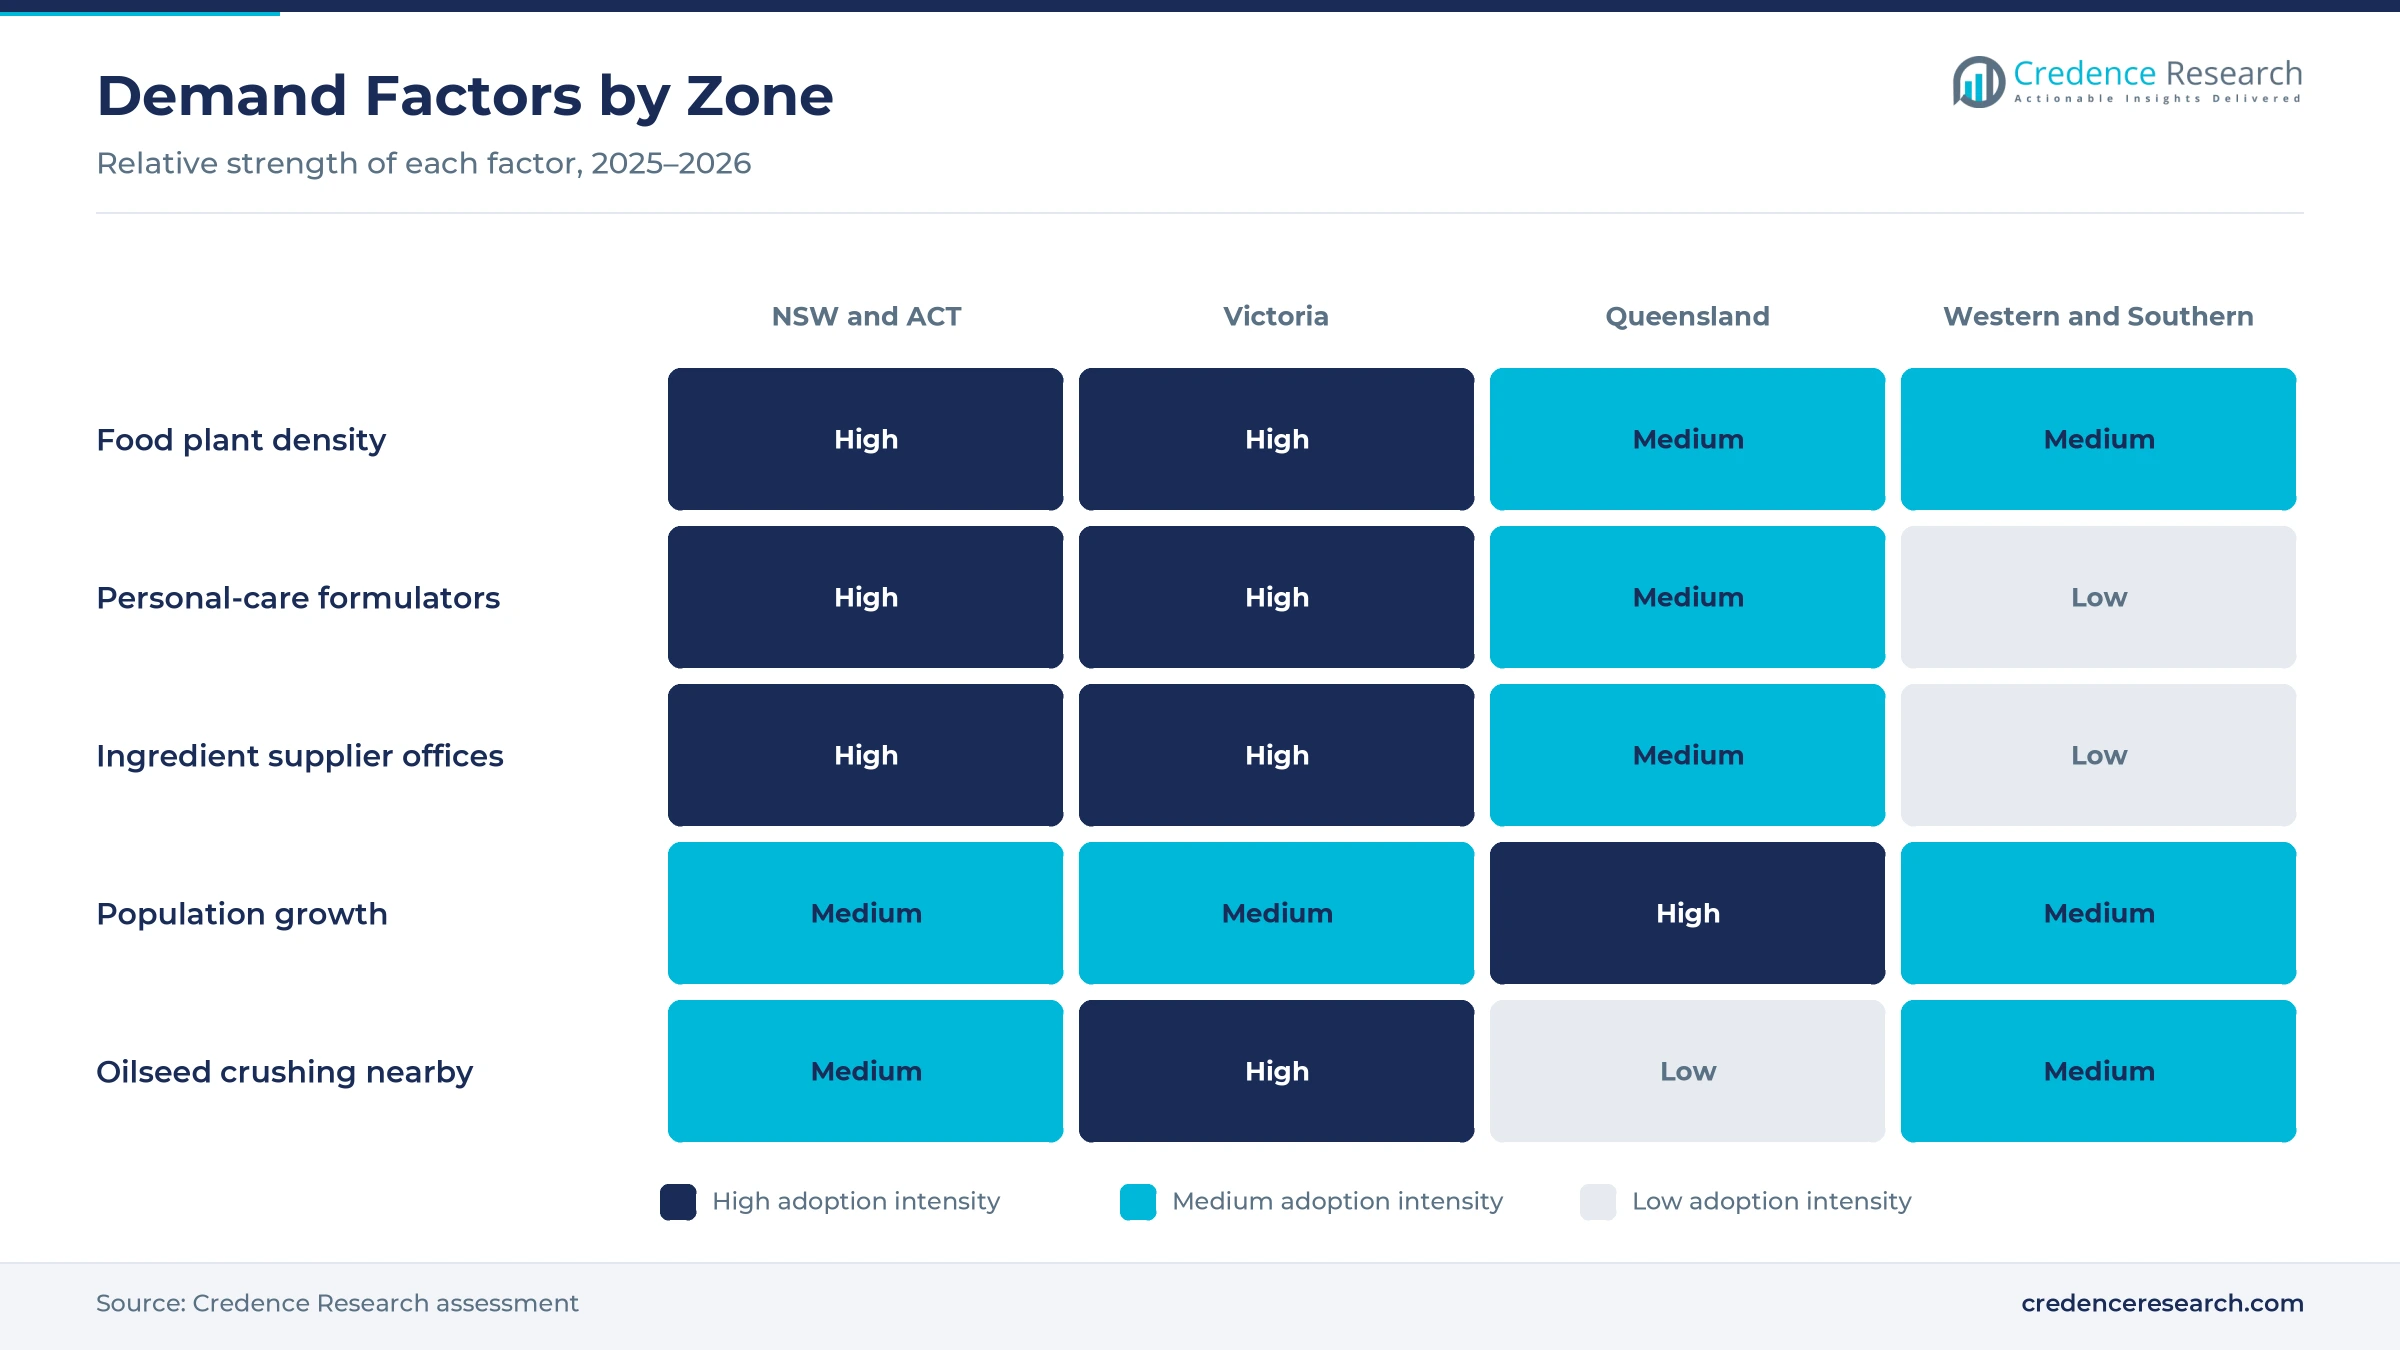
Recurring food manufacturing demand anchors volumes, because bread, chocolate, margarine, sauces and dairy products all need emulsifiers in every production run. Food and grocery manufacturing turnover reached AUD 182.6 billion in 2024-25, up 5.5% from AUD 173 billion a year earlier, according to the Australian Food and Grocery Council. The sector employed more than 301,000 workers, or one in three manufacturing jobs in Australia. Manufacturing added about 5.3% of gross domestic product in 2025, according to the World Bank. In turn, food and beverage holds 62.0% of 2025 value, while makers of frozen bakery products buy dough conditioners year round.
Why does performance-led premium formulation raise spending?
Performance-led premium formulation raises spending, because manufacturers pay more for ingredients that cut fat, stabilize foams or extend shelf life. The national food regulator published an application on Jan. 30, 2025, to extend polyglycerol esters of interesterified ricinoleic acid to sauces and toppings. It earlier approved polysorbate 20 on Sept. 5, 2018, for processed meat and fish at up to 500 mg per kg. Global maker Palsgaard runs six factories and 9 application centers that develop such systems. As a result, specialty emulsifier systems grow at 5.68% a year, the fastest product rate, while demand for polysorbate 80 rises in premium recipes.
How does local personal-care technical access support demand?
Local personal-care technical access supports demand, because cosmetic formulators need laboratory help to choose and blend emulsifiers for each product. BASF signed an exclusive agreement with Alchemy Agencies to distribute its personal-care range, including emulsifiers, in Australia and New Zealand from May 1, 2025, according to BASF. Croda has operated in Australia since 1968 and runs technical sales from Parramatta, while Evonik opened its first Australian sales office in 1956. Every cosmetic ingredient importer must also register with the national chemicals regulator for the year from Sept. 1, 2025. In turn, personal care and cosmetics grows at 5.30% a year, the fastest end-use rate.
Why does domestic oilseed crushing support lecithin supply?
Domestic oilseed crushing supports lecithin supply, because canola, cottonseed, sunflower and soybean oils yield phospholipids during refining. Cargill processes more than 680,000 metric tons of these seeds a year in Australia and announced a USD 50 million upgrade at Footscray, Newcastle and Narrabri in April 2023, according to Milling Middle East and Africa. The national food regulator approved a phospholipase C enzyme for degumming fats and oils on Dec. 10, 2025. As a result, lecithin keeps 34.0% of 2025 value, and local crushing at Footscray and Newcastle gives chocolate, bakery and margarine makers a domestic alternative to imported soy lecithin.
Exports, enzyme processing and contract makers shape buying
How is the rise of food exports changing ingredient needs?
The rise of food exports is changing ingredient needs, because products shipped to Asia need longer shelf life and stable textures in hot climates. Food and grocery exports reached AUD 52.6 billion in 2024-25, up 17.4% from the year before. Capital investment in the sector rose 16% to AUD 4.5 billion over the same period. More than a third of the food and grocery workforce is based in regional communities, where many export plants operate. As a result, brand-owned manufacturers keep 55.0% of 2025 value, while exporters specify emulsifier grades that meet both Australian and overseas food standards for each destination market.
Why is the shift to exclusive technical distributors notable?
The shift to exclusive technical distributors is notable, because global makers want local partners that can run trials and support small formulators. BASF moved its personal-care range to Alchemy Agencies under an exclusive agreement effective May 1, 2025, covering UV filters, actives, emollients, emulsifiers, polymers and surfactants. Ingredion runs its Australian office from North Ryde in Sydney and lists encapsulants and emulsifiers among its ingredient categories. Croda provides technical sales and warehousing for Australia, New Zealand and the Pacific Islands from Parramatta, after starting local operations in 1968. In turn, exclusive technical distributors grow at 5.07% a year, the fastest channel rate, while direct manufacturer sales still hold 45.0% of 2025 value.
Can enzyme-based oil processing open new lecithin supply?
Enzyme-based oil processing can open new supply options, because new enzymes change how phospholipids are removed from crude vegetable oils. The national food regulator called for submissions on a phospholipase C enzyme in July 2025 and its Board approved the change on Dec. 10, 2025, according to Food Standards Australia New Zealand. The enzyme is made from a genetically modified strain of Bacillus licheniformis and is used to degum fats and oils. Cargill already crushes more than 680,000 metric tons of oilseeds a year in Australia. As a result, crushers and refiners can choose processes that balance oil yield with lecithin output for specialty fats and oils customers.
Is there room to serve the growing contract manufacturing base?
Contract manufacturers offer room to grow, because new food, supplement and cosmetic brands often outsource production rather than build plants. Food and grocery capital investment rose 16% in 2024-25, which adds new capacity at shared and brand-owned sites. Kerry set up its Australia and New Zealand headquarters and application center in Brisbane in 2021, with pilot plants, laboratories and tasting facilities for local producers. Cosmetic ingredient introducers must renew registration by Aug. 31 each year, which favors suppliers that handle compliance. In turn, contract manufacturers grow at 5.27% a year, the fastest customer rate, as they buy ready blends that shorten product development.
Import reliance, labeling and price swings test suppliers
How does import reliance expose buyers to supply risk?
Import reliance exposes buyers to supply risk, because most glycerides, polysorbates and specialty blends are made overseas and shipped to Australia. Freight delays and currency swings therefore change landed costs quickly. As a result, food makers hold more safety stock and qualify second suppliers. Distributors respond with local warehousing and forward contracts that smooth deliveries and prices for smaller buyers across the year, while some buyers shift part of their volume to domestically made lecithin.
Why do labeling and clean-label demands complicate recipes?
Labeling and clean-label demands complicate recipes, because many shoppers check ingredient lists for additive numbers and chemical names. Every emulsifier must be permitted under the national food standards code and declared on the label. In turn, manufacturers try to cut the number of additives in each product. Suppliers respond with plant-based lecithin, simpler blends and enzyme-based alternatives that fit shorter labels, and they help brand owners explain each ingredient on packs and websites.
How do vegetable oil price swings squeeze margins?
Vegetable oil price swings squeeze margins, because lecithin and glycerides are made from soybean, canola, palm and sunflower oils. Weather, biofuel policy and trade disputes all move these prices from season to season. As a result, emulsifier makers adjust prices often and buyers resist increases. Suppliers respond with indexed contracts and a wider mix of oil sources that spreads the risk across several crops, which gives food makers more predictable costs over a full year.
Why do regulatory approvals slow new ingredient launches?
Regulatory approvals slow new ingredient launches, because a new emulsifier or a new food use needs an application to the national food regulator. Assessment, consultation and Board approval can take more than a year. In turn, global makers launch some products later in Australia than in larger markets. Suppliers respond by working with local applicants and trade groups to prepare complete safety files earlier, which shortens the time between a global launch and local sales.
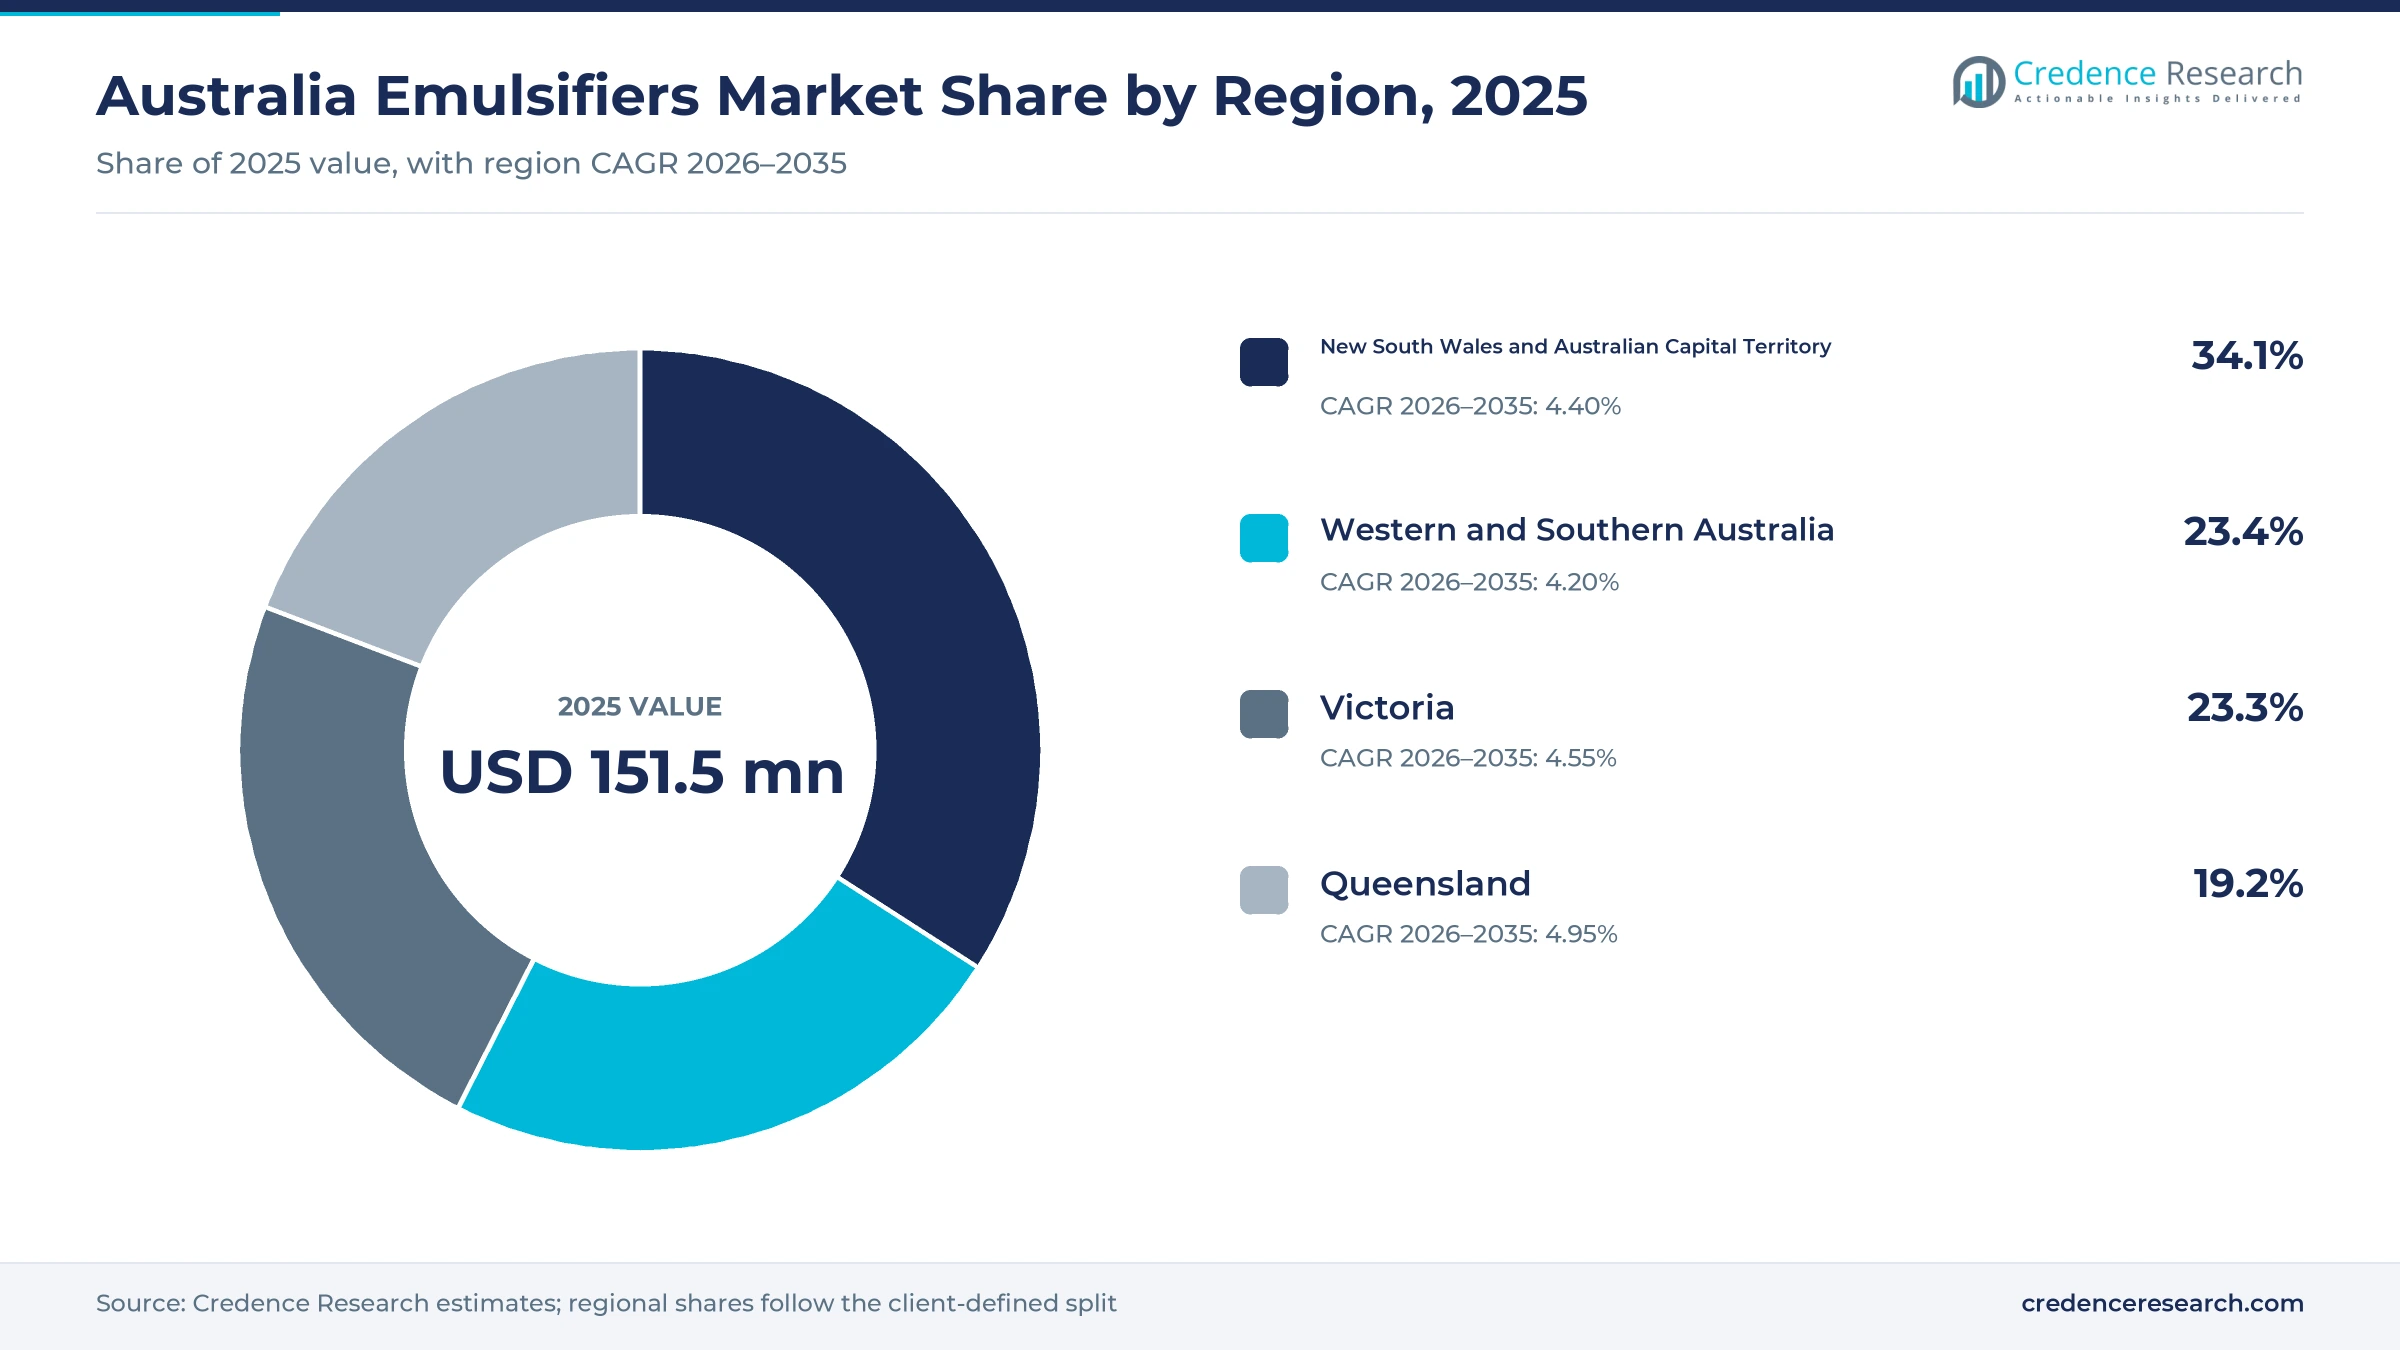
New South Wales leads as Queensland grows fastest
| Region | Value, 2025 (USD million) | Share, 2025 | CAGR, 2026–2035 |
|---|---|---|---|
| New South Wales and Australian Capital Territory | 51.7 | 34.1% | 4.40% |
| Western and Southern Australia | 35.5 | 23.4% | 4.20% |
| Victoria | 35.3 | 23.3% | 4.55% |
| Queensland | 29.1 | 19.2% | 4.95% |
Why does new South Wales and the ACT hold the top share?
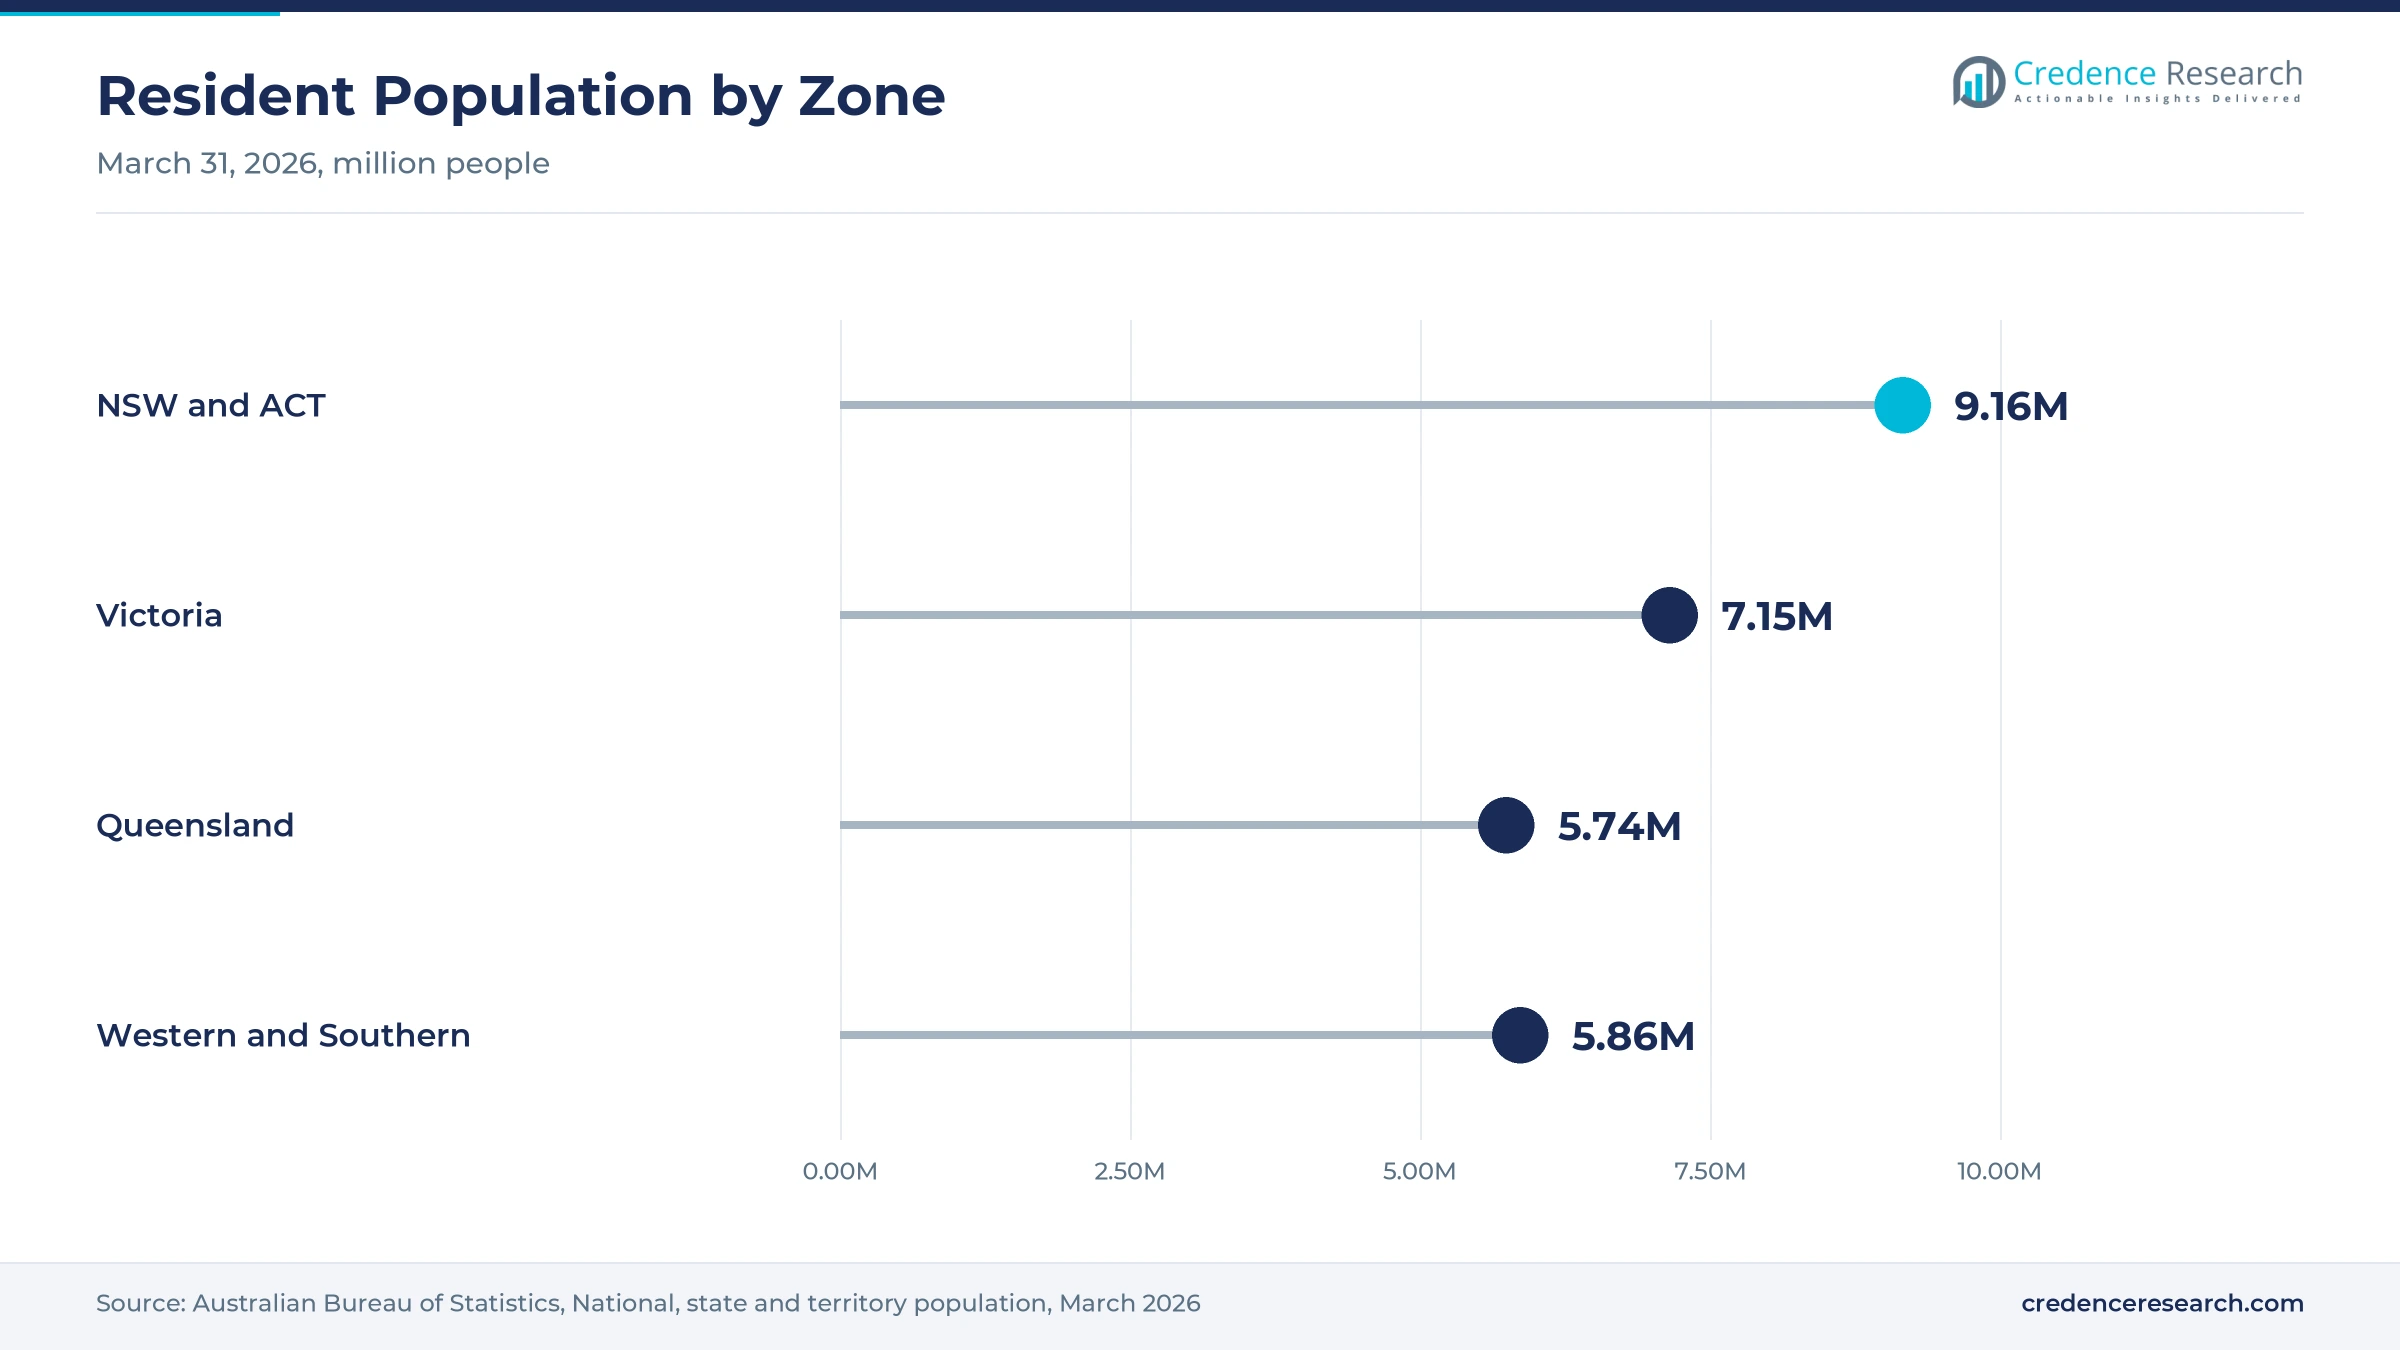
New South Wales and the Australian Capital Territory held a 34.1% share of 2025 value and grow at 4.40% a year, because the zone had about 9.16 million residents in March 2026. Sydney hosts the Australian offices of Ingredion and Croda, which serve food and personal-care plants across the state. As a result, the zone leads demand for both food emulsifiers and cosmetic ingredients.
How does Victoria support ingredient demand?
Victoria held a 23.3% share of 2025 value and grows at 4.55% a year, because Melbourne has a large base of dairy, bakery and confectionery plants. The state had about 7.15 million residents in March 2026, growing 1.6% over the year. Cargill crushes oilseeds at Footscray, and Evonik runs its Australian sales office in Mount Waverley. In turn, Victoria remains the second-largest zone for lecithin and glycerides.
Why is Queensland growing fastest?
Queensland held a 19.2% share of 2025 value and grows fastest at 4.95% a year, because it gains more people from other states than any other jurisdiction. The state added a net 14,718 interstate migrants in the year to March 2026. Kerry runs its Australia and New Zealand headquarters and application center in Brisbane. As a result, new food and beverage launches in the state lift ingredient demand.
What shapes demand in western and southern Australia?
Western and southern Australia held a 23.4% share of 2025 value and grows at 4.20% a year, because the zone combines Perth and Adelaide food plants with large farming areas. Western Australia had the fastest population growth at 2.1% in the year to March 2026. As a result, food processors in Perth and Adelaide drive most purchases in the zone.
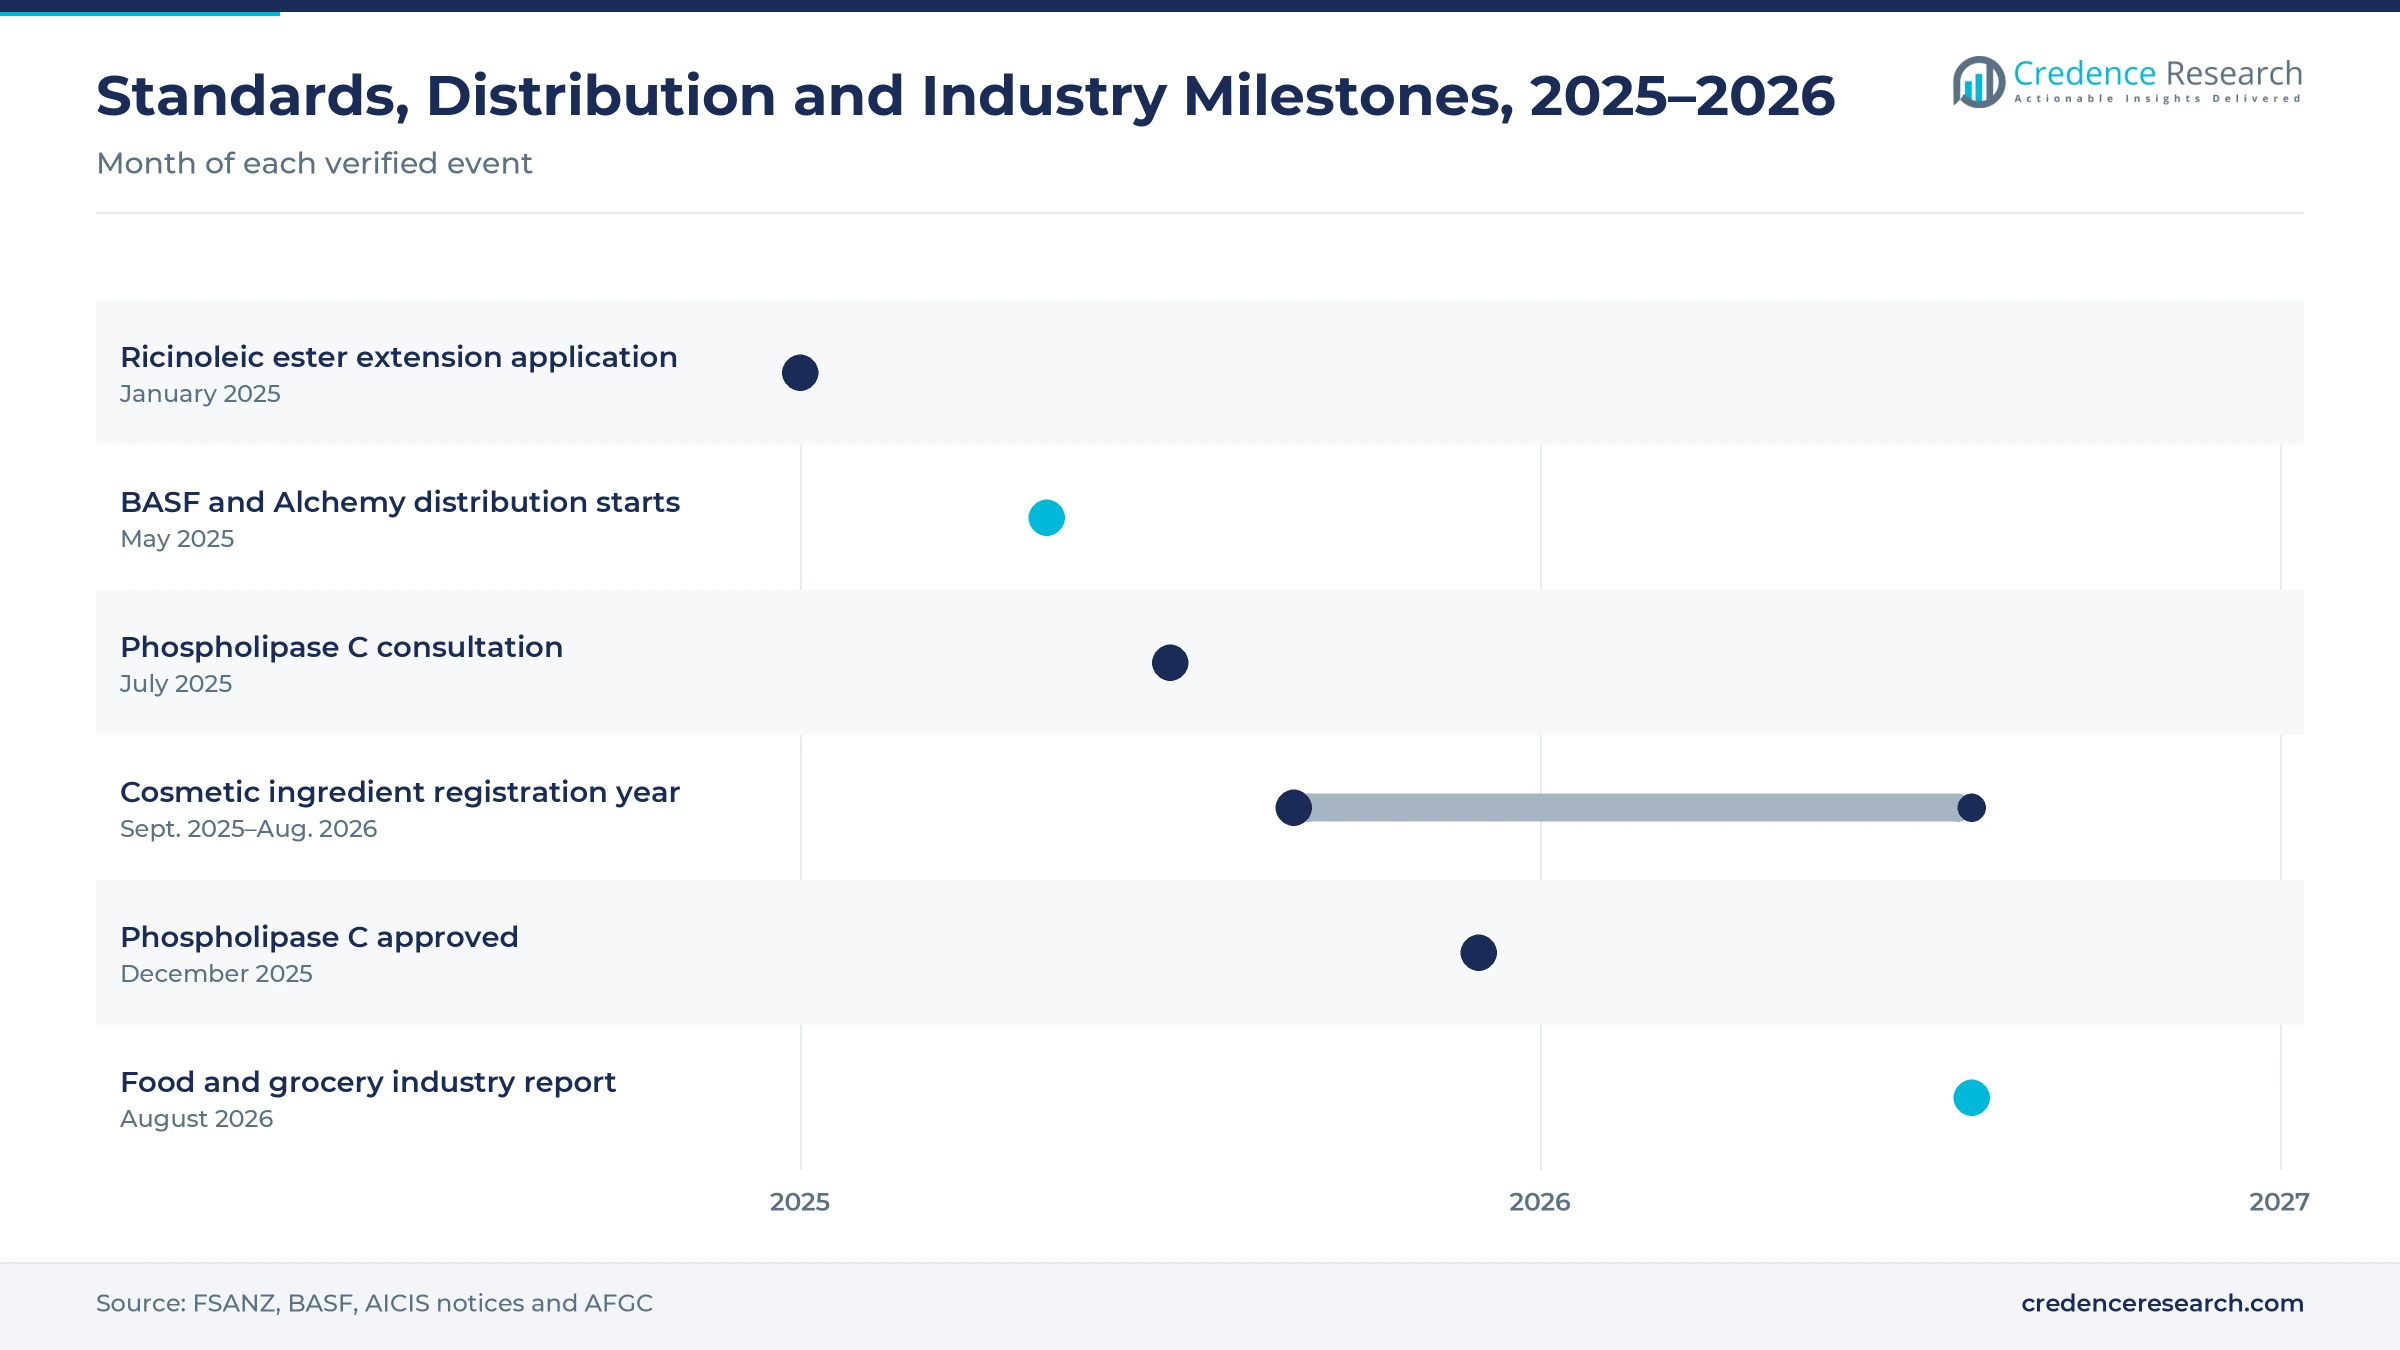
Standards, distribution and processing moves, 2025–2026
| Development | Status and market relevance |
|---|---|
| In January 2025, the national food regulator published an application to extend an emulsifier made from ricinoleic acid to sauces and toppings. | Would widen permitted uses in savory and dessert products |
| In May 2025, BASF began an exclusive agreement with Alchemy Agencies to distribute its personal-care range in Australia and New Zealand. | Covers emulsifiers, emollients, UV filters and surfactants |
| In September 2025, a new registration year began for importers and makers of cosmetic ingredients under the national chemicals scheme. | Runs from Sept. 1, 2025, to Aug. 31, 2026 |
| In December 2025, the national food regulator approved a phospholipase C enzyme for degumming fats and oils. | Changes how refiners handle phospholipids from crude oils |
| In August 2026, the Australian Food and Grocery Council reported AUD 182.6 billion in sector turnover for 2024-25. | Confirms steady growth in the main customer industry |
Refining, esterification and blending change supply
- Phospholipid refining separates lecithin from crude soybean, canola and sunflower oils during degumming, which gives food makers a plant-based emulsifier for chocolate and bakery.
- Esterification and ethoxylation combine fatty acids with glycerol, sorbitol or polyglycerol, which produces glycerides, sorbitan esters and polysorbates for foods, creams and drugs.
- Formulation and blending mixes several emulsifiers and stabilizers into ready systems, which helps manufacturers fix texture, aeration and shelf-life problems with one ingredient and supports food additives reformulation.
Need a Custom Version of This Report?
Tailor the scope, geography, or segments to your exact requirements.
- Custom geography or segment scope
- Direct access to our analyst team
Global ingredient groups and local distributors compete
Competition is split between global ingredient groups and the distributors that give them local technical reach. Cargill crushes more than 680,000 metric tons of oilseeds a year in Australia, which supports local lecithin supply. BASF moved its personal-care range, including emulsifiers, to Alchemy Agencies from May 1, 2025. Kerry runs its regional headquarters and application center in Brisbane, while Ingredion serves buyers from North Ryde. Croda provides technical sales from Parramatta, and Evonik manages its Australian business from Mount Waverley. Rivals compete on functional performance, label appeal, technical service, supply security and price. Because many buyers reformulate often, suppliers with local laboratories and trial support win more long-term contracts. Brand owners also prefer partners that can document every ingredient for food standards and chemicals registration.
Which companies supply emulsifying ingredients in Australia?
| Company | Type | Role in the market |
|---|---|---|
| Cargill Australia | Oilseed crusher and ingredient maker | Crushes more than 680,000 metric tons of oilseeds a year in Australia |
| BASF Australia | Global chemical maker | Personal-care range distributed by Alchemy Agencies from May 2025 |
| Kerry Ingredients Australia | Global ingredient maker | Brisbane headquarters and application center with pilot plants |
| Ingredion ANZ | Global ingredient maker | North Ryde office serving food and pharmaceutical buyers |
| Croda Australia | Global specialty chemical maker | Technical sales and warehousing from Parramatta, in Australia since 1968 |
| Evonik Australia | Global specialty chemical maker | Mount Waverley sales office for Australia and New Zealand |
Credence Research view on food and cosmetic additive demand
Credence Research's view is that Australian demand for emulsifying ingredients will grow steadily because food and grocery manufacturing keeps expanding and personal-care brands keep launching new creams and lotions. Lecithin and glycerides remain the largest value pools, while specialty blends add the fastest growth. Technical distributors and contract manufacturers are gaining influence over ingredient choice. Suppliers that combine local laboratory support with secure supply and clean-label options should gain share fastest across the Australia emulsifiers base over the next decade.
How the national emulsifying ingredient estimate was built
The report uses 2025 as the base year on a calendar basis, and market values come from the Credence Research model. That model combines food and grocery industry statistics, World Bank manufacturing data, population estimates, food regulator decisions and company announcements. Segment splits and zone growth rates are Credence Research estimates, while zone shares follow the client-defined split. Sources used are official statistics, regulator publications, industry association reports and company releases, and no interviews or surveys were used.
Specialty systems and contract making carry growth to 2035
Ingredient value is expected to reach USD 245.2 million by 2035, a 4.50% CAGR during 2026–2035, as food makers expand output and personal-care brands launch new products. Growth should come from specialty blends, contract manufacturing and export-oriented food plants. Stable oilseed supply would support lecithin, while higher freight and oil prices would squeeze margins for imported glycerides. Suppliers with local technical service and clean-label options are expected to gain the most as Australia emulsifiers demand shifts toward premium systems and ready blends.
Frequently Asked Questions
How big is the Australia emulsifiers market?
Which product type leads Australian emulsifier value?
Which region leads the Australian market?
How large is the food and grocery manufacturing sector?
What did the food regulator approve for oil processing?
Which end-use industry is growing fastest?
Who are the leading companies in the Australian market?
What are the main challenges for suppliers?
Table of Content
Chapter 1 Market Segmentation
- 1.1 Segmentation Framework
- 1.1.1 Product and Service Classification
- 1.1.2 Application and End-Use Classification
- 1.1.3 Technology and Solution Classification
- 1.1.4 Customer and Distribution Channel Classification
- 1.1.5 Geographic Segmentation
- 1.1.6 Market Segment Definitions and Boundaries
- 1.2 By Product Type
- 1.2.1 Lecithin
- 1.2.2 Glycerides and Derivatives
- 1.2.3 Sorbitan Esters and Polysorbates
- 1.2.4 Specialty Emulsifier Systems
- 1.3 By End-Use Industry
- 1.3.1 Food and Beverage
- 1.3.2 Personal Care and Cosmetics
- 1.3.3 Pharmaceuticals and Nutraceuticals
- 1.3.4 Industrial Formulations
- 1.4 By Customer Type
- 1.4.1 Brand-Owned Manufacturers
- 1.4.2 Contract Manufacturers
- 1.4.3 Merchant Formulators
- 1.5 By Sales Channel
- 1.5.1 Direct Manufacturer Sales
- 1.5.2 Exclusive Technical Distributors
- 1.5.3 Multi-Principal Ingredient Distributors
Chapter 2 Introduction
- 2.1 Report Objectives and Scope
- 2.2 Product Definition and Industry Terminology
- 2.3 Market Inclusions and Exclusions
- 2.4 Research Process
- 2.4.1 Primary Research and Expert Interviews
- 2.4.2 Secondary Research and Source Review
- 2.4.3 Top-Down and Bottom-Up Estimation
- 2.4.4 Data Triangulation and Verification
- 2.5 Market Size Measurement Basis
- 2.5.1 2025: USD 151.5 million → 2035: USD 245.2 million
- 2.6 Historical and Forecast Reference Periods
- 2.6.1 Historical Period: 2018-2025
- 2.6.2 Base Year: 2025
- 2.6.3 Forecast Period: 2025-2035
- 2.7 Research Assumptions and Limitations
Chapter 3 Executive Summary
- 3.1 Market Snapshot and Key Findings
- 3.2 Base-Year Market Size, 2025
- 3.3 Forecast Market Size, 2035
- 3.4 Revenue and Volume Growth Outlook
- 3.5 Key Demand and Supply Indicators
- 3.6 Leading Market Segments
- 3.7 Fastest-Growing Market Opportunities
- 3.8 Regional Performance Highlights
- 3.9 Technology and Industry Transformation
- 3.10 Competitive Landscape Summary
- 3.11 Analyst View and Strategic Implications
Chapter 4 Australia Emulsifiers Market Trends and Developments
- 4.1 Historical Industry Development, 2018-2025
- 4.2 Recent Market Trends and Developments
- 4.3 Demand and Customer Behavior Trends
- 4.4 Technology and Product Innovation
- 4.5 Artificial Intelligence, Automation and Digitalization
- 4.6 Local Manufacturing and Supply Chain Realignment
- 4.7 Industry Partnerships, Mergers and Acquisitions
- 4.8 Sustainability and Circular Economy Developments
- 4.9 Government and Private Sector Investment Trends
- 4.10 Emerging Business Models and Commercialization
- 4.11 Industry Developments and Announcements
Chapter 5 Australia Emulsifiers Market Production, Supply and Demand Analysis
- 5.1 Demand Trend and Consumption Analysis, 2018-2025
- 5.2 Demand Forecast, 2025-2035
- 5.3 Production and Output Trend, 2018-2025
- 5.4 Production and Output Forecast, 2025-2035
- 5.5 Installed Capacity and Capacity Utilization
- 5.6 Company-Wise Production Plants and Statistics
- 5.6.1 Installed Production Capacity
- 5.6.2 Actual Production
- 5.6.3 Planned Capacity and Expansion Targets
- 5.7 Supply Chain Structure and Procurement Trends
- 5.8 Supply-Demand Gap and Bottlenecks
- 5.9 Import Dependence and Sourcing Structure
- 5.10 Contract Manufacturing and Outsourcing
- 5.11 Regional Supply and Demand Concentration
Chapter 6 Australia Emulsifiers Market Pricing Analysis
- 6.1 Pricing Structure and Measurement
- 6.2 Historical Pricing Trends, 2018-2025
- 6.3 Pricing Outlook, 2025-2035
- 6.4 Average Selling Price and Unit Economics
- 6.5 Pricing by Product and Market Segment
- 6.6 Geographic Pricing Differences
- 6.7 Key Input, Energy, Labor and Logistics Costs
- 6.8 Contract Pricing and Purchasing Models
- 6.9 Pricing Sensitivity and Competitive Positioning
- 6.10 Price, Margin and Profitability Implications
Chapter 7 Australia Emulsifiers Market Dynamics
- 7.1 Market Growth Drivers
- 7.1.1 Demand-Side Drivers
- 7.1.2 Technology and Innovation Drivers
- 7.1.3 Infrastructure and Investment Drivers
- 7.1.4 Regulatory and Policy Drivers
- 7.2 Market Restraints
- 7.2.1 Cost and Affordability Constraints
- 7.2.2 Technology and Adoption Barriers
- 7.2.3 Supply Chain and Operational Constraints
- 7.3 Market Challenges
- 7.3.1 Competitive Pressure and Margin Erosion
- 7.3.2 Skills, Infrastructure and Implementation Gaps
- 7.4 Emerging Market Opportunities
- 7.5 Market Dynamics Impact and Time-Horizon Assessment
Chapter 8 Australia Emulsifiers Value Chain Analysis
- 8.1 Industry Value Chain Overview
- 8.2 Upstream Suppliers and Critical Inputs
- 8.3 Technology and Component Providers
- 8.4 Manufacturing or Service Delivery
- 8.5 Distribution, Channel Partners and Integrators
- 8.6 Downstream Applications and End Users
- 8.7 Value Addition and Profit Pools
- 8.8 Vertical Integration and Outsourcing
- 8.9 Supplier Concentration and Risk
- 8.10 Supply Chain Localization and Resilience
Chapter 9 Australia Emulsifiers Market Regulations and Policies
- 9.1 Relevant Laws, Standards and Compliance Frameworks
- 9.2 Product, Service, Safety and Quality Requirements
- 9.3 Government Policies, Incentives and Subsidies
- 9.4 Imports, Exports and Trade Barriers
- 9.5 Public Procurement and Local Content Requirements
- 9.6 Environmental and Sustainability Compliance
- 9.7 Upcoming Policy Changes and Market Implications
Chapter 10 Australia Emulsifiers Market Hotspots and Opportunities
- 10.1 Market Opportunity Mapping and Growth Hotspots
- 10.2 High-Growth Applications and Customer Groups
- 10.3 Underserved Markets and White-Space Opportunities
- 10.4 Emerging Technology and Product Opportunities
- 10.5 New Capacity and Investment Hotspots
- 10.6 Market Entry and Expansion Opportunities
- 10.7 Distribution and Partnership Opportunities
- 10.8 Near-Term and Long-Term Commercial Potential
- 10.9 Opportunity Attractiveness and Execution Risks
Chapter 11 Australia Emulsifiers Market Outlook, 2025-2035
- 11.1 Market Size and Analysis
- 11.1.1 Revenue (Market Measurement: 2025: USD 151.5 million → 2035: USD 245.2 million)
- 11.1.2 Market Volume and Quantity Sold
- 11.1.3 Historical Market Size, 2018-2025
- 11.1.4 Base-Year Market Size, 2025
- 11.2 Market Forecast, 2025-2035
- 11.2.1 Revenue Forecast to 2035
- 11.2.2 Volume Forecast to 2035
- 11.2.3 CAGR and Year-on-Year Growth
- 11.2.4 Incremental Revenue Opportunity
- 11.3 Forecast Assumptions and Scenario Analysis
- 11.3.1 Base-Case Forecast
- 11.3.2 Optimistic and Conservative Scenarios
- 11.3.3 Technology, Pricing and Policy Sensitivities
- 11.4 Market Attractiveness and Growth Outlook
Chapter 12 Australia Emulsifiers Market Segmentation and Outlook
- 12.1 Segmentation Summary and Market Shares, 2025
- 12.2 Largest and Fastest-Growing Segments
- 12.3 By Product Type - Market Size and Forecast, 2025-2035
- 12.3.1 Segment Definition and Scope
- 12.3.2 Historical Market Size, 2018-2025
- 12.3.3 Revenue Forecast, 2025-2035
- 12.3.4 Volume Forecast, 2025-2035
- 12.3.5 Base-Year Market Share, 2025
- 12.3.6 Segment CAGR and Growth Drivers
- 12.3.7 Subsegment Market Size and Forecast
- 12.3.7.1 Lecithin
- 12.3.7.2 Glycerides and Derivatives
- 12.3.7.3 Sorbitan Esters and Polysorbates
- 12.3.7.4 Specialty Emulsifier Systems
- 12.3.8 Subsegment Pricing and Adoption Trends
- 12.3.9 Leading Suppliers and Competition
- 12.3.10 Regional Demand and Opportunities
- 12.4 By End-Use Industry - Market Size and Forecast, 2025-2035
- 12.4.1 Segment Definition and Scope
- 12.4.2 Historical Market Size, 2018-2025
- 12.4.3 Revenue Forecast, 2025-2035
- 12.4.4 Volume Forecast, 2025-2035
- 12.4.5 Base-Year Market Share, 2025
- 12.4.6 Segment CAGR and Growth Drivers
- 12.4.7 Subsegment Market Size and Forecast
- 12.4.7.1 Food and Beverage
- 12.4.7.2 Personal Care and Cosmetics
- 12.4.7.3 Pharmaceuticals and Nutraceuticals
- 12.4.7.4 Industrial Formulations
- 12.4.8 Subsegment Pricing and Adoption Trends
- 12.4.9 Leading Suppliers and Competition
- 12.4.10 Regional Demand and Opportunities
- 12.5 By Customer Type - Market Size and Forecast, 2025-2035
- 12.5.1 Segment Definition and Scope
- 12.5.2 Historical Market Size, 2018-2025
- 12.5.3 Revenue Forecast, 2025-2035
- 12.5.4 Volume Forecast, 2025-2035
- 12.5.5 Base-Year Market Share, 2025
- 12.5.6 Segment CAGR and Growth Drivers
- 12.5.7 Subsegment Market Size and Forecast
- 12.5.7.1 Brand-Owned Manufacturers
- 12.5.7.2 Contract Manufacturers
- 12.5.7.3 Merchant Formulators
- 12.5.8 Subsegment Pricing and Adoption Trends
- 12.5.9 Leading Suppliers and Competition
- 12.5.10 Regional Demand and Opportunities
- 12.6 By Sales Channel - Market Size and Forecast, 2025-2035
- 12.6.1 Segment Definition and Scope
- 12.6.2 Historical Market Size, 2018-2025
- 12.6.3 Revenue Forecast, 2025-2035
- 12.6.4 Volume Forecast, 2025-2035
- 12.6.5 Base-Year Market Share, 2025
- 12.6.6 Segment CAGR and Growth Drivers
- 12.6.7 Subsegment Market Size and Forecast
- 12.6.7.1 Direct Manufacturer Sales
- 12.6.7.2 Exclusive Technical Distributors
- 12.6.7.3 Multi-Principal Ingredient Distributors
- 12.6.8 Subsegment Pricing and Adoption Trends
- 12.6.9 Leading Suppliers and Competition
- 12.6.10 Regional Demand and Opportunities
- 12.7 Segment Growth Comparison
- 12.8 Segment Attractiveness and Priority Matrix
Chapter 13 Australia Emulsifiers End-Use and Application Market Outlook
- 13.1 End-Use Industry and Customer Demand Structure
- 13.2 Leading Applications and Customer Groups
- 13.3 End-Use Market Size, Share and Forecast
- 13.4 Major End-Use Industry Deep Dives
- 13.4.1 Customer Requirements and Use Cases
- 13.4.2 Demand and Replacement Cycles
- 13.4.3 Technical and Regulatory Considerations
- 13.4.4 Purchasing and Procurement Models
- 13.4.5 Leading Vendors and Distribution Channels
- 13.4.6 Forecast and Commercial Opportunities
- 13.5 Emerging Applications and Cross-Segment Demand
- 13.6 End-Use Industry Investment Priorities
Chapter 14 Australia Emulsifiers Geographic Market Outlook, 2025-2035
- 14.1 Domestic Market Distribution and Demand Clusters
- 14.2 State- or Province-Wise Market Size and Forecast, 2025-2035
- 14.3 City and Metropolitan Market Outlook
- 14.4 Industrial, Manufacturing and Commercial Clusters
- 14.5 Geographic Concentration of Key End Users
- 14.6 Local Pricing and Purchasing Differences
- 14.7 Domestic Production Facilities and Capacity Map
- 14.8 Local Infrastructure and Project Pipeline
- 14.9 State-Level Policy and Incentive Differences
- 14.10 Subnational Investment Hotspots and Opportunities
- 14.11 Distribution and Logistics Networks
- 14.12 Domestic Competitive Footprint
Chapter 15 Australia Emulsifiers Technology, Innovation and Sustainability Outlook
- 15.1 Technology Landscape and Maturity
- 15.2 Product, Process and Service Innovation
- 15.3 AI, Automation and Digital Tools in the Industry
- 15.4 Technology Adoption and Performance Benchmarking
- 15.5 Innovation Pipeline and R&D Investment
- 15.6 Patent and Intellectual Property Trends
- 15.7 Energy Efficiency and Resource Management
- 15.8 Sustainability, Recycling and Circularity
- 15.9 Technology Roadmap, 2025-2035
- 15.10 Risks of Obsolescence and Technology Substitution
Chapter 16 Australia Emulsifiers Market Key Strategic Imperatives
- 16.1 Growth and Market Entry Priorities
- 16.2 High-Return Products and Segments
- 16.3 Pricing, Profitability and Cost Optimization
- 16.4 Technology Investment and Product Differentiation
- 16.5 Supply Chain Localization and Resilience
- 16.6 Distribution and Customer Acquisition
- 16.7 Partnership, Acquisition and Capacity Strategy
- 16.8 Regional Expansion Priorities
- 16.9 Short-, Medium- and Long-Term Actions
Chapter 17 Competition Outlook
- 17.1 Industry Competition Characteristics
- 17.2 Market Structure and Concentration
- 17.3 Market Share and Competitive Positioning, 2025
- 17.4 Company-Wise Revenue and Product Benchmarking
- 17.5 Production and Service Capacity Benchmarking
- 17.6 Technology, Pricing and Differentiation
- 17.7 Regional Footprint and Distribution Strength
- 17.8 Mergers, Acquisitions and Strategic Alliances
- 17.9 New Entrants and Competitive Threats
- 17.10 Porter's Five Forces and Industry Attractiveness
- 17.11 Competitive Outlook, 2025-2035
Chapter 18 Company Profiles
- 18.1 Company Coverage and Selection Criteria
- 18.2 AAK Australia
- 18.2.1 Business Description
- 18.2.2 Company Ownership and Geographic Presence
- 18.2.3 Product and Service Portfolio
- 18.2.4 Manufacturing and Operating Footprint
- 18.2.5 Production Capacity and Expansion Plans
- 18.2.6 Financial Performance and Investment
- 18.2.7 Market Share and Competitive Position
- 18.2.8 Technology and Innovation Capabilities
- 18.2.9 Strategic Alliances or Partnerships
- 18.2.10 Recent Developments
- 18.2.11 Growth Strategy and Outlook
- 18.3 Cargill Australia
- 18.4 Kerry Ingredients Australia
- 18.5 BASF Australia
- 18.6 Ingredion ANZ
- 18.7 ADM
- 18.8 Croda Australia
- 18.9 Evonik Australia
- 18.10 Palsgaard
- 18.11 Tate & Lyle
- 18.12 Other Relevant Market Participants
Note: Every listed company is profiled on the structure shown under the first company. The company list is preliminary and may change based on research findings, market developments, data availability and client requirements.
Chapter 19 Disclaimer
- 19.1 Research and Forecast Disclaimer
- 19.2 Data Source and Estimation Limitations
Note: The depth of individual sections depends on data availability for this market. Volume, capacity, trade and other unit-based metrics are included where applicable.

