
An imported comonomer niche reshaped by Qenos closures
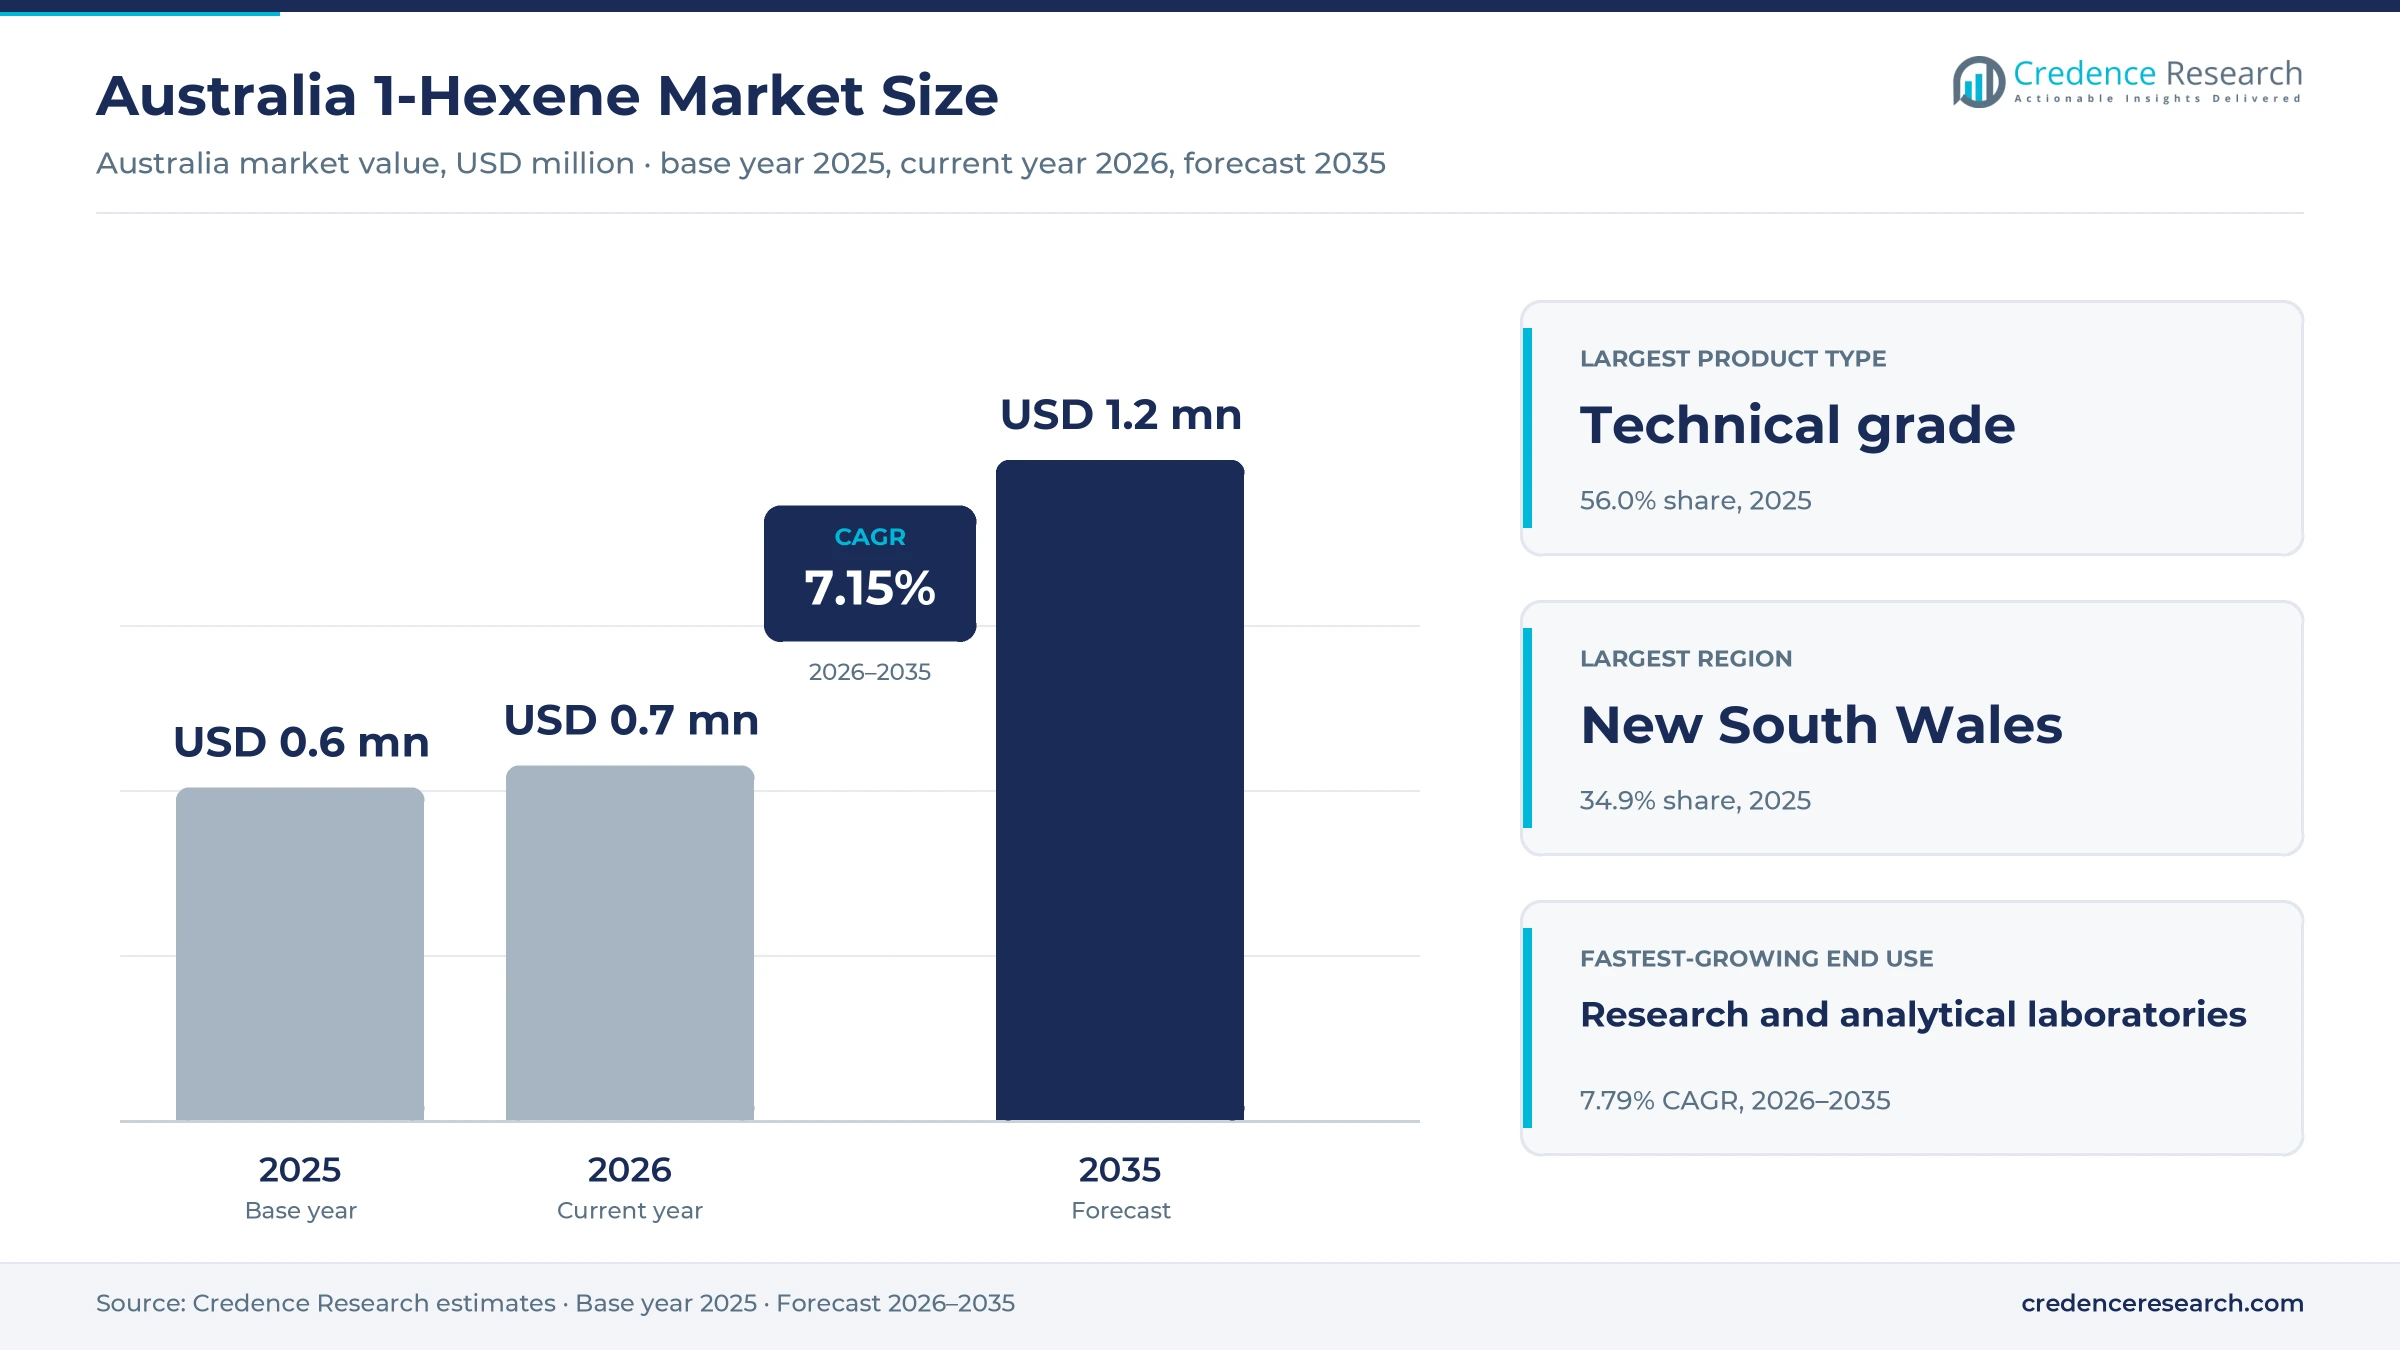
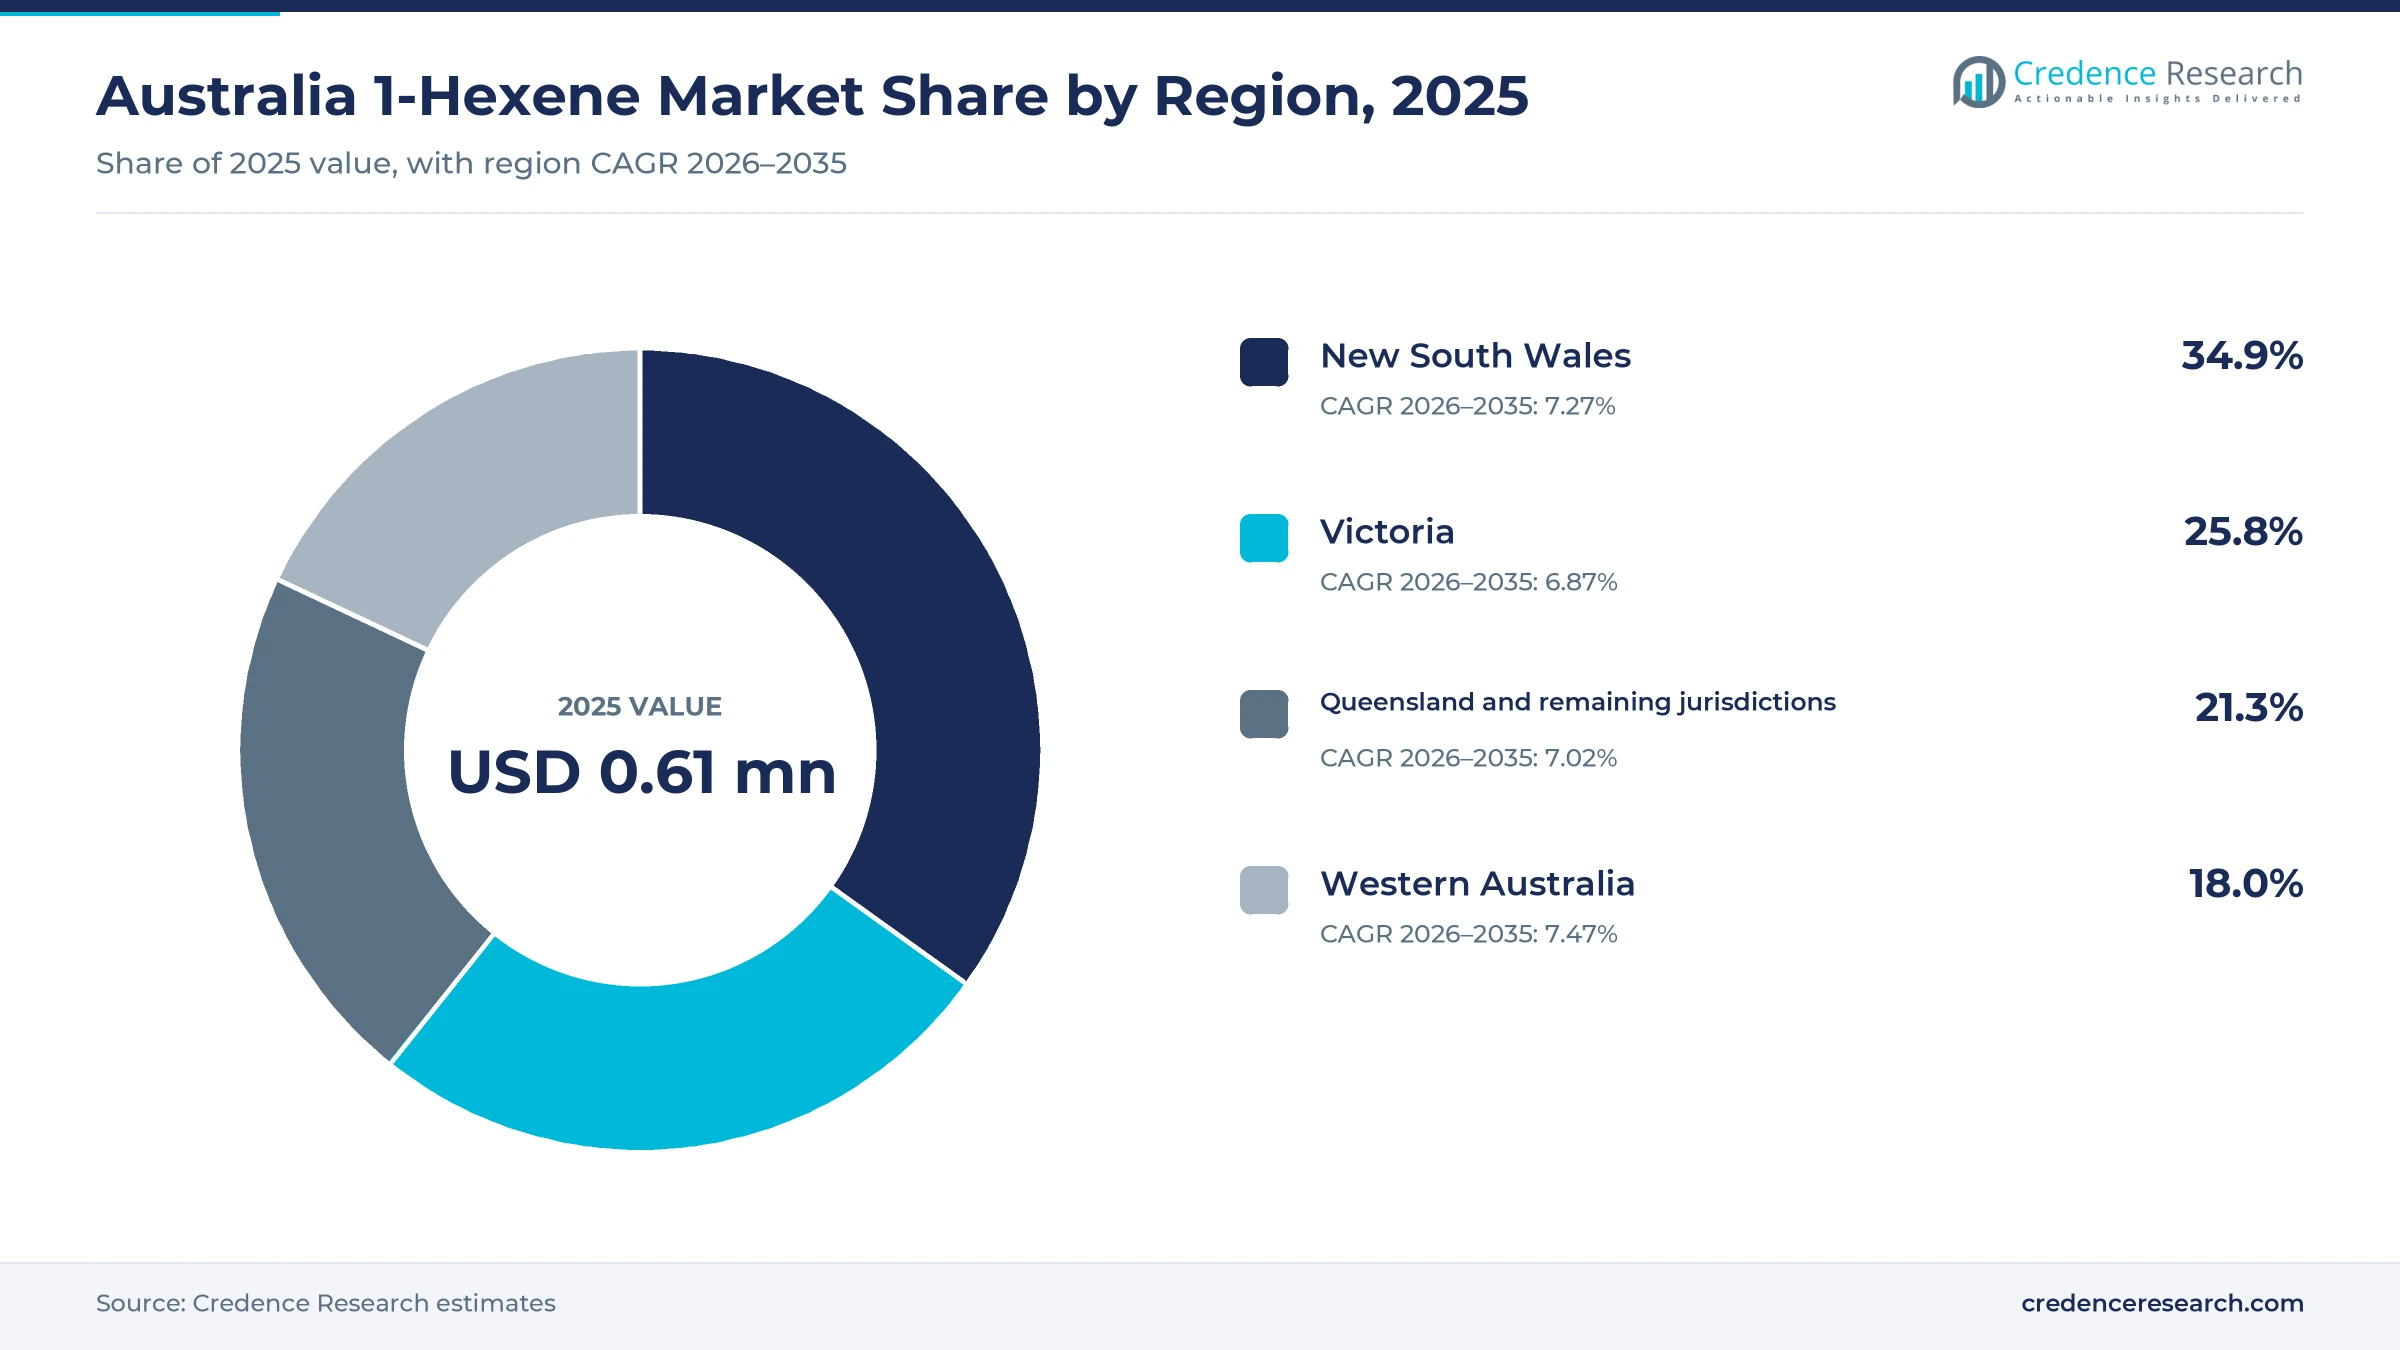
The Australia 1-hexene market was valued at USD 0.61 million in 2025 and is projected to increase from USD 0.65 million in 2026 to USD 1.21 million by 2035, registering a CAGR of 7.15% during 2026–2035. Demand now comes from oilfield chemical blenders, lubricant and specialty chemical formulators, and research laboratories that buy imported drums and small packs, because the country no longer makes polyethylene. New South Wales held the largest regional share, 34.9% in 2025, as Sydney carries the largest research spending and distributor base. Western Australia is the fastest-growing region at 7.47% a year, supported by oil and gas service work. The main commercial change was the exit of Qenos, the last local polyethylene maker, which entered administration in April 2024 after its Botany plant stopped in February 2023. As a result, the bulk comonomer trade from Qatar and Saudi Arabia ended, and the market reset to a smaller specialty base.
What does the Australian 1-hexene estimate measure?
The estimate measures the value of 1-hexene sold to users in Australia across technical, high-purity and analytical grades. It covers imported material sold in bulk containers, drums and laboratory packs through stocking distributors, direct producer contracts and reagent catalogues, valued at the price paid by the first local buyer.
The estimate excludes polyethylene resins that already contain 1-hexene, other alpha olefins such as 1-butene and 1-octene, and finished drilling fluids or lubricants imported as formulated products. The value chain runs from ethylene oligomerization plants in the United States, the Middle East and Asia through importers and distributors to formulators and laboratories.
Australia 1-Hexene Market Insights
- The market was valued at USD 0.61 million in 2025 and is projected to reach USD 1.21 million by 2035, registering a CAGR of 7.15% during 2026–2035.
- New South Wales held 34.9% of 2025 value, as the state recorded A$9,630 million of business R&D in 2023-24, or 39% of the national total.
- Technical grade material led with 56.0% of 2025 value, because oilfield and lubricant formulators buy in drum and bulk lots.
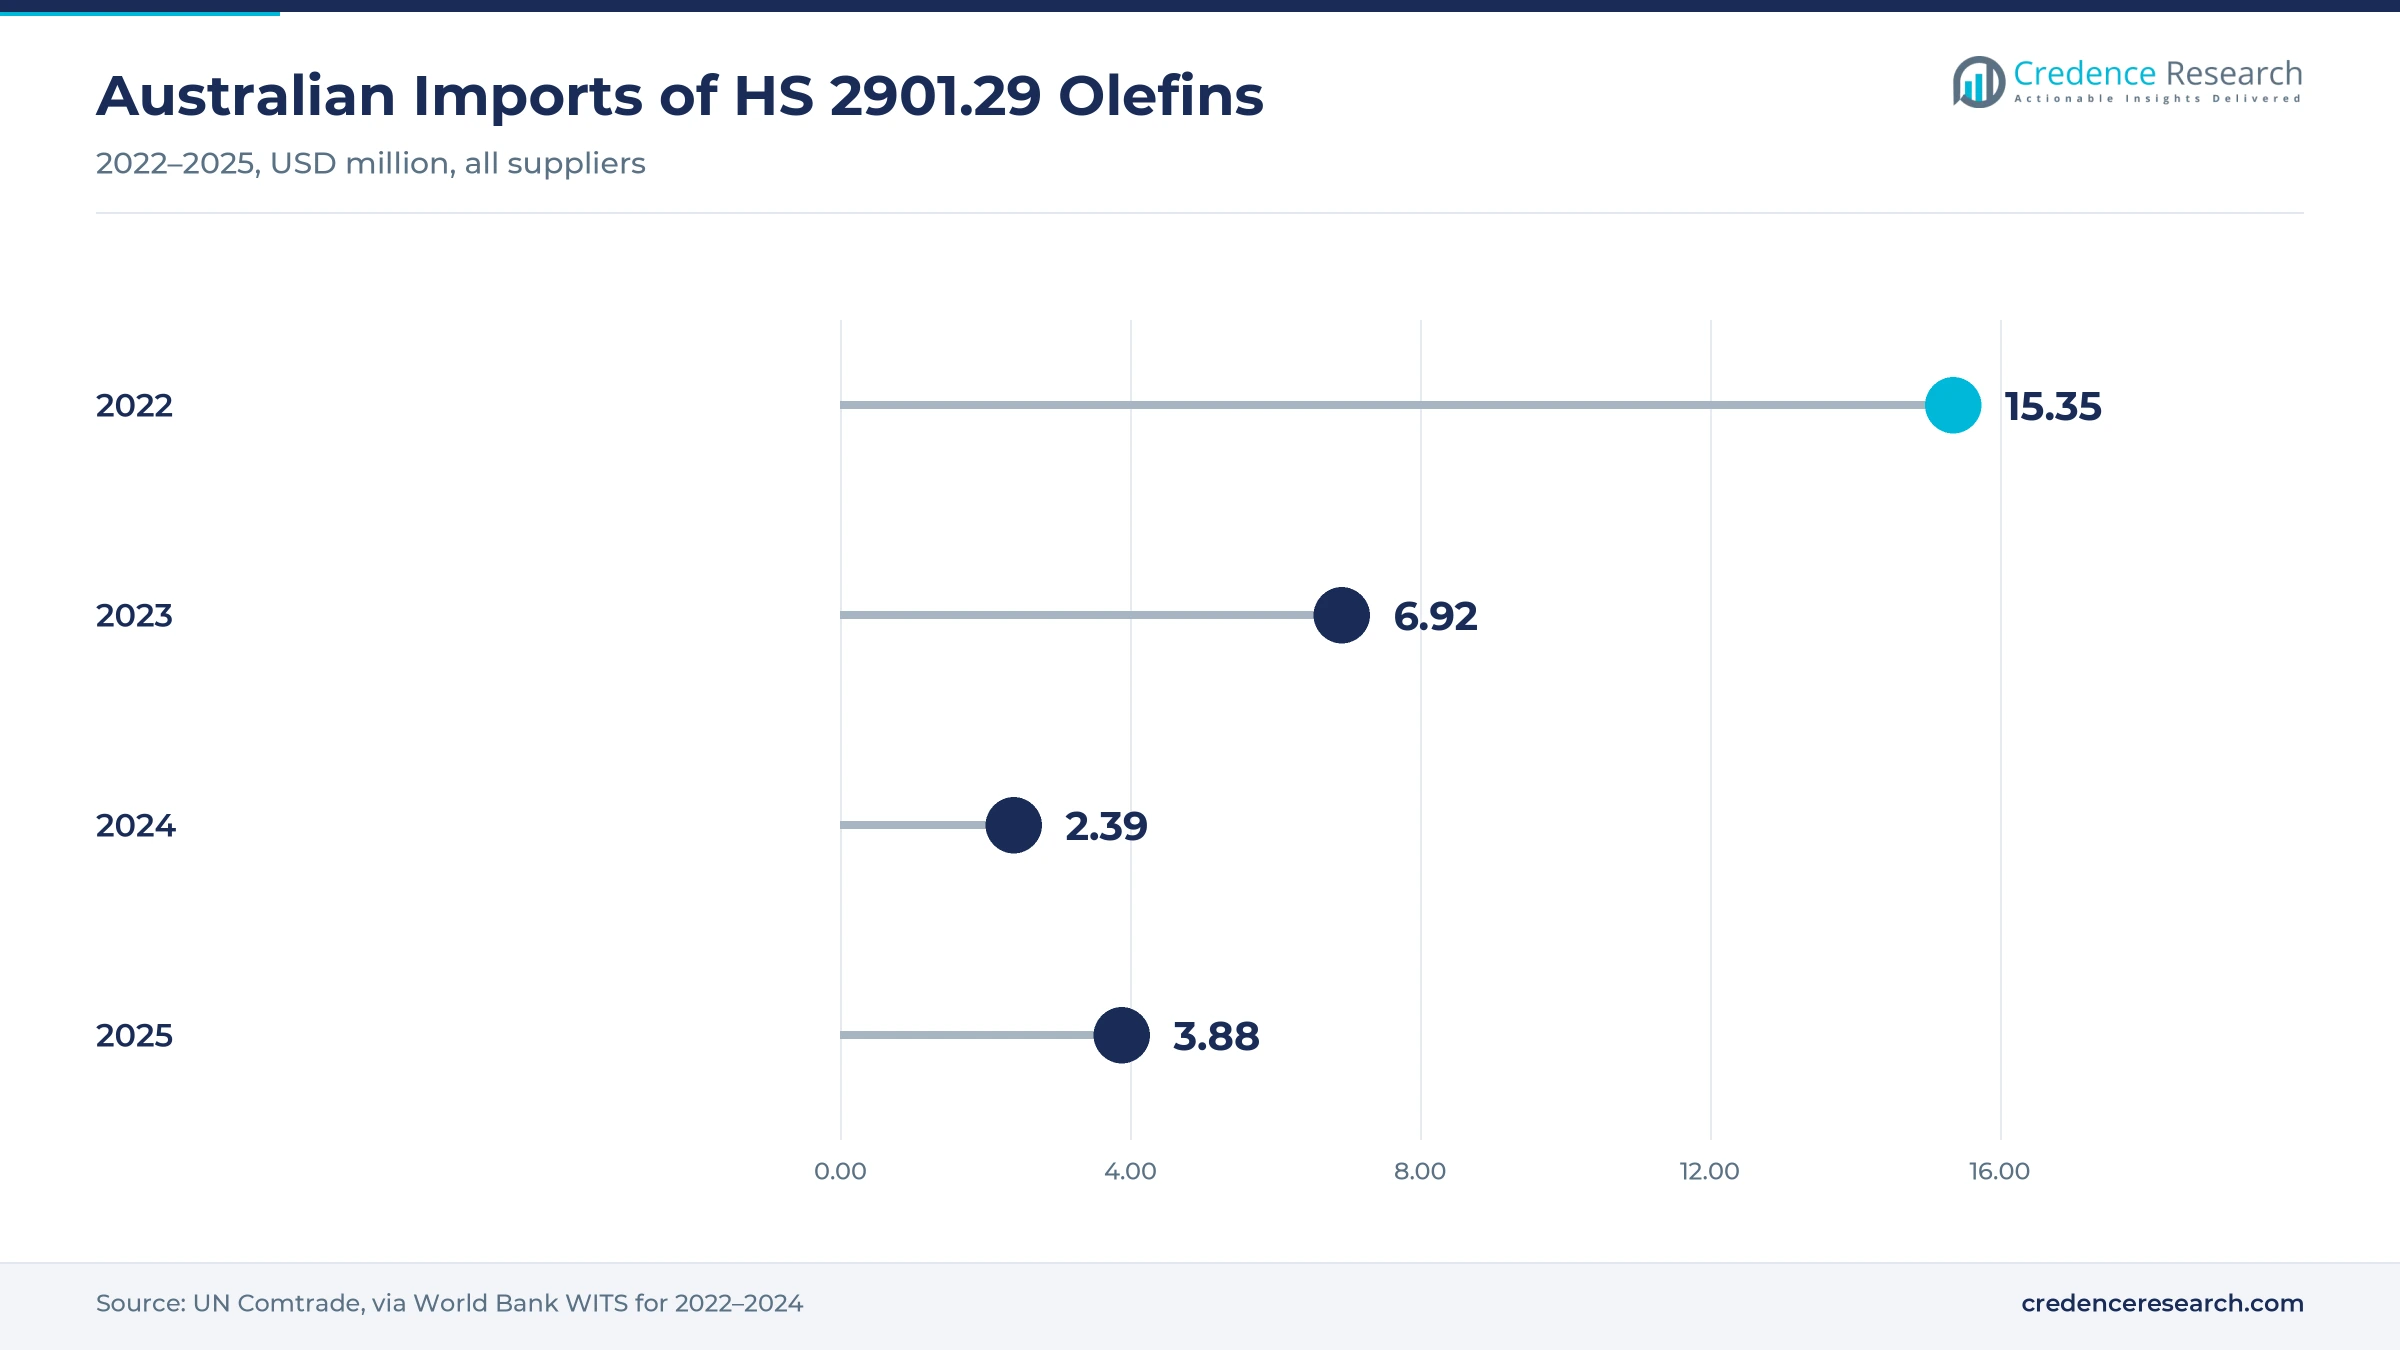
- Australian imports of the HS 2901.29 olefin group fell from USD 15.35 million in 2022 to USD 2.39 million in 2024 after polyethylene output stopped.
- Chevron Phillips Chemical completed the world's largest on-purpose 1-hexene unit at Old Ocean, Texas, in August 2023, which keeps global supply ample.
Technical grade leads while laboratory grades grow fastest
Why does technical grade hold the largest share?
Based on product type, the market is categorized into technical grade, high-purity grade and analytical grade. Technical grade led with a 56.0% share of 2025 value, because oilfield and lubricant formulators order drums at the lowest price per kilogram. Analytical grade grows fastest at 7.95% a year, as laboratories buy gas chromatography standards such as the 99.5% purity material Tokyo Chemical Industry sells in Australia.
Which industries account for most purchases?
Based on end-use industry, the market is categorized into oilfield and well-services chemicals, synthetic lubricant intermediates, fine and specialty chemicals, and research and analytical laboratories. Oilfield and well-services chemicals led with a 33.0% share of 2025 value, because Western Australian gas projects need drilling and flow additives. Research and analytical laboratories grow fastest at 7.79% a year, in line with rising business R&D spending.
How do feedstock, solvent and reagent uses differ?
Based on application, the market is categorized into reactive chemical feedstock, specialty process solvent and experimental reagent. Reactive chemical feedstock led with a 61.0% share of 2025 value, because most buyers react the double bond into polymers, additives or alcohols. Experimental reagent use grows fastest at 7.96% a year, as universities and company laboratories run small olefin chemistry and catalyst studies.
How do Australian buyers source the material?
Based on sales channel, the market is categorized into Australian stocking distributors, direct producer contracts and reagent catalogues. Australian stocking distributors led with a 52.0% share of 2025 value, because local stock removes the need to import a flammable liquid in small lots. Reagent catalogues grow fastest at 7.73% a year, as laboratories order gram packs for same-day delivery.
| Segment Group | Leading Sub-segment | Share, 2025 | Fastest-growing Sub-segment | CAGR, 2026–2035 |
|---|---|---|---|---|
| By Product Type | Technical grade | 56.0% | Analytical grade | 7.95% |
| By End-Use Industry | Oilfield and well-services chemicals | 33.0% | Research and analytical laboratories | 7.79% |
| By Application | Reactive chemical feedstock | 61.0% | Experimental reagent | 7.96% |
| By Sales Channel | Australian stocking distributors | 52.0% | Reagent catalogues | 7.73% |
Request a Free Sample
Fill in your details and we'll send you a free sample report.
- Sample data tables & charts
- Research methodology
Qualification, R&D buying and import pricing drive demand
How does specialty intermediate qualification anchor demand?
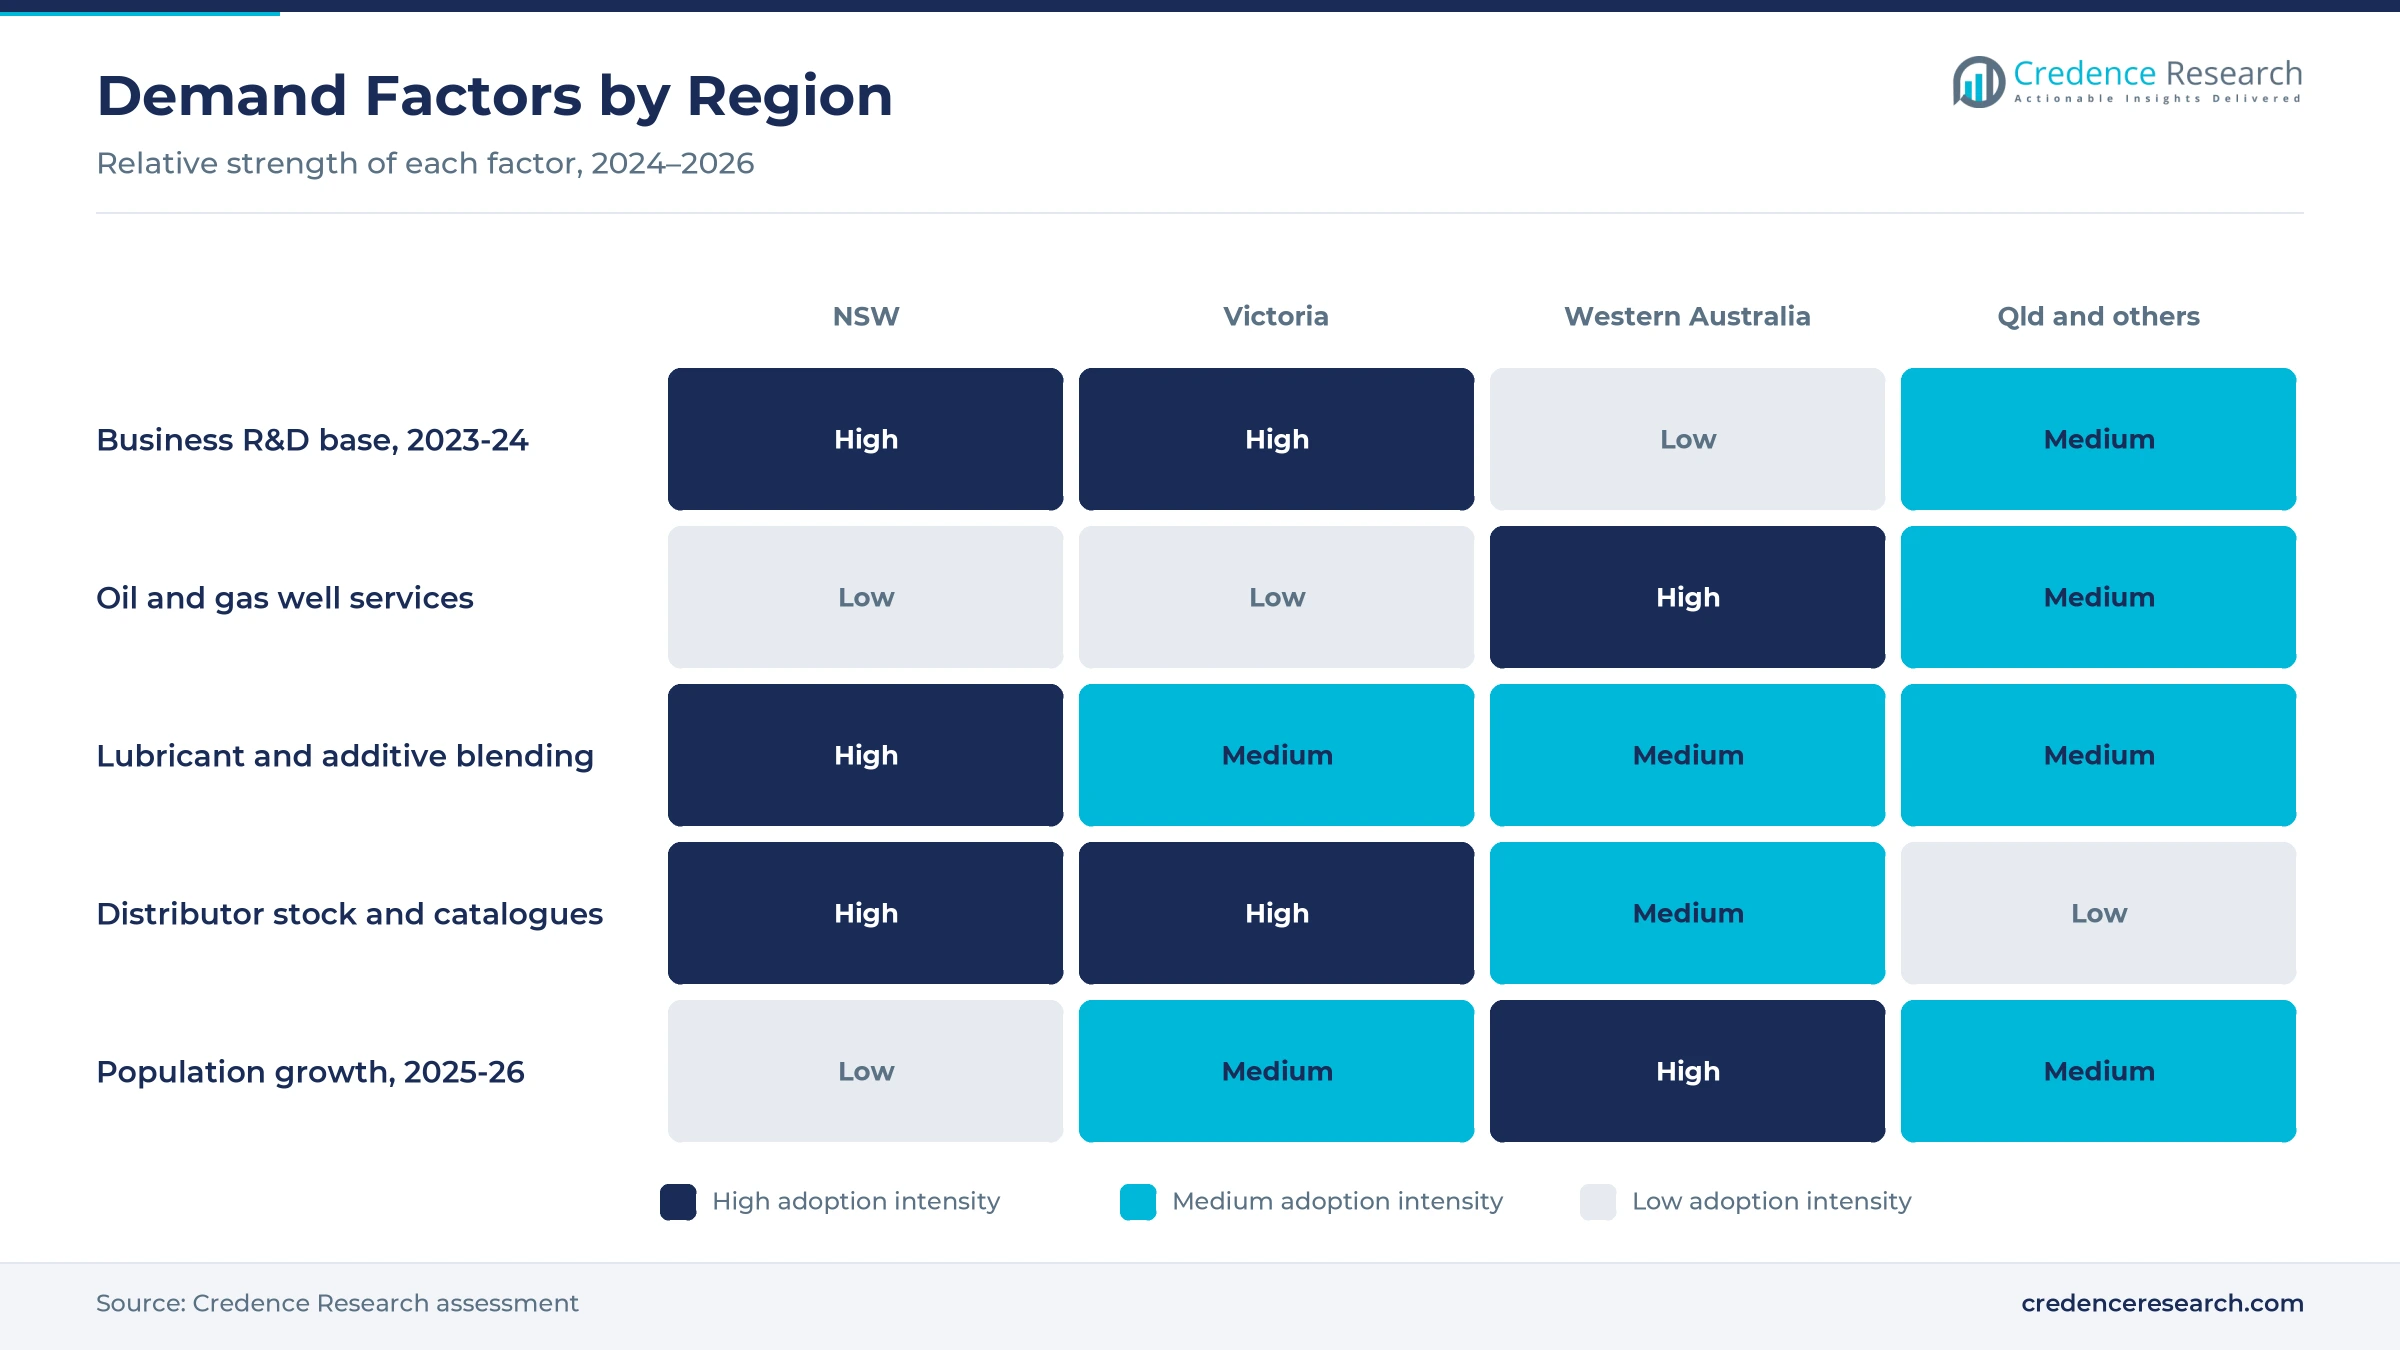
With polyethylene production gone, demand rests on formulators that have qualified 1-hexene as an intermediate in their own recipes. Qenos' Botany site, with a 130,000 t/yr LLDPE and HDPE swing plant, stopped in February 2023 and the company entered administration in April 2024, according to Argus. PubChem lists 1-hexene as a comonomer for high-density polyethylene and as an intermediate for flavors, perfumes, dyes and resins. INEOS Oligomers names polyethylene comonomers, lubricant feedstock and drilling fluids as the three main markets for linear alpha olefins. Because each recipe is tied to a qualified grade, switching is slow, so oilfield and well-services chemicals held a 33.0% share of 2025 value.
Why does research and product development purchasing lift demand?
Business R&D in Australia reached A$24,410 million in 2023-24, up 18% from 2021-22, according to the Australian Bureau of Statistics, and laboratory orders follow that spending. Manufacturing accounted for A$5,047 million of the total, which funds catalyst, polymer and additive studies that use olefins. New South Wales and Victoria together recorded A$16,583 million, or 67% of national business R&D. Tokyo Chemical Industry lists a 1-hexene gas chromatography standard of over 99.5% purity at A$252 for 5 mL, with same-day stock in Australia. As a result, research and analytical laboratories grow at 7.79% a year, the fastest end-use group.
How do qualified supply and moderate import pricing help buyers?
Australia buys from large producers that sell 1-hexene at moderate bulk prices, which keeps qualified grades affordable for small users. In 2022, Australia imported USD 15.35 million of the HS 2901.29 olefin group, including USD 6.40 million from Qatar for 2,730 metric tons, about USD 2.34 a kilogram. Qatar hosts Q-Chem, in which Chevron Phillips Chemical holds 49%, and its Mesaieed plant has 47,000 t/yr of 1-hexene capacity, according to the European Petrochemical Association. Korean supply in 2025 arrived at about USD 2.81 a kilogram. Because each parcel is small and travels as dangerous goods, most buyers draw on local stock, so Australian stocking distributors held a 52.0% share of 2025 value.
Do Western Australian gas projects support oilfield use?
Western Australia is the largest LNG exporter in Australia and alone accounted for 12% of global LNG exports in 2024, according to the state government's March 2026 LNG profile. Producers there use drilling fluids, flow improvers and well-service additives, and several of these products are built on linear alpha olefins. Shell describes its NEODENE olefins as ingredients for products from polyethylene and lubricants to drilling muds. Western Australia also recorded the fastest population growth of any state, 2.1% in the year to March 2026, according to the ABS. As a result, oilfield and well-services chemicals remain the largest end-use group, with Perth service companies buying through local distributors.
Supply shifts from Gulf bulk lots to Asian parcels
Shift from Gulf bulk cargoes to small Asian parcels
The supply pattern shifted sharply after local polyethylene output stopped, with bulk Gulf cargoes replaced by smaller Asian parcels. Imports of the HS 2901.29 group fell to USD 6.92 million in 2023 and USD 2.39 million in 2024, according to UN Comtrade data in World Bank WITS. Australia then imported USD 3.88 million of the group in 2025 for 702 metric tons, with no shipments from Qatar or Saudi Arabia. The Republic of Korea, China and the United Arab Emirates each supplied about USD 0.71 million to USD 0.73 million. Because the code also includes other olefins, these figures show supply routes rather than 1-hexene alone.
Rising on-purpose capacity keeps global supply loose
Producers are adding on-purpose 1-hexene capacity faster than many regions add comonomer demand, which is an emerging advantage for import-dependent buyers. Chevron Phillips Chemical announced on Aug. 3, 2023, that it had completed its Old Ocean 1-hexene unit, lifting its U.S. capacity to 646,000 tons a year. SIBUR announced in August 2025 that it had produced a test batch at its first hexene plant in Nizhnekamsk, with capacity of more than 50,000 metric tons a year. INEOS Oligomers announced an investment in May 2016 in a 420,000 t/yr unit for linear alpha olefins at Chocolate Bayou, Texas. As a result, Australian distributors can source qualified material from several suppliers at stable prices, even without any local production.
Opportunity in certified analytical and reagent packs
Laboratory demand offers the clearest growth opening, because buyers pay for documented purity rather than volume. Tokyo Chemical Industry sells its 1-hexene gas chromatography standard through ChemSupply Australia, which shows how catalogue channels reach local users. Business R&D rose by A$2,130 million in New South Wales and A$1,004 million in Victoria between 2021-22 and 2023-24, according to the ABS. Suppliers of laboratory chemicals that hold certified packs in Sydney and Melbourne can therefore win repeat orders. In turn, reagent catalogues grow at 7.73% a year, the fastest sales channel, while high-purity grades gain from the same buyers.
Opening in synthetic lubricant and additive intermediates
Lubricant and additive makers create a second opening, because alpha olefins remain core building blocks for synthetic base oils and additives. INEOS Oligomers lists polyalphaolefin lubricant feedstock as one of the three main markets for its linear alpha olefins. Local blenders of poly alpha olefin base stocks and specialty additives buy imported intermediates in drum lots. Imports of the HS 2901.29 group from the United States, home of the large Gulf Coast alpha olefin units, fell from USD 2.02 million in 2022 to USD 0.11 million in 2025, according to UN Comtrade. Qenos' distribution arm eXsource kept operating after the April 2024 administration, according to Packaging News. Therefore, distributors that bundle 1-hexene with other olefins can grow sales as blenders seek fewer suppliers.
Thin volumes, flammable freight and supply risk weigh
Why do thin volumes limit supplier interest?
The loss of polyethylene output removed the only bulk buyer, so remaining demand is spread across small formulators and laboratories. Administrators announced in April 2024 that the Botany plant would not restart, according to Packaging News. The Australian Strategic Policy Institute described Qenos as the country's last polyethylene manufacturer in May 2024. Its Altona site is being prepared for dismantling, and the new owner plans warehousing there. As a result, producers sell through distributors rather than direct, and buyers of high-density polyethylene now import finished resin.
How does flammable freight raise landed costs?
1-Hexene is a highly flammable liquid with a closed-cup flash point of about minus 26 degrees Celsius, according to PubChem. It ships under UN number 2370, so every container and laboratory pack travels as dangerous goods. These rules add packaging, labeling and freight costs that do not fall with smaller order sizes. Distributors that hold local stock spread these costs, although storage licenses and tank space add overhead.
Will new workplace exposure limits add compliance work?
Safe Work Australia states that new workplace exposure limits apply from Dec. 1, 2026, once the Commonwealth, states and territories adopt them in their work health and safety laws. Until Nov. 30, 2026, businesses must keep meeting the current workplace exposure standards. Users that handle volatile olefins must review air monitoring and controls during the change. Small laboratories may therefore lean on suppliers for updated safety data sheets and handling guidance.
Does Gulf supply risk affect sourcing choices?
Qatar and Saudi Arabia supplied most of Australia's bulk olefin imports in 2022, so Gulf disruption still shapes sourcing plans. The Western Australian government's March 2026 LNG profile noted that conflict in the Middle East in 2026 made the expansion of Qatar's production capacity uncertain. Shipping delays through the region would hit any buyer that returns to Gulf bulk supply. Buyers therefore keep Asian and U.S. sources qualified, which raises testing costs for each new supplier.
New South Wales leads on research and distributor stock
| Region | Value, 2025 (USD million) | Share, 2025 | CAGR, 2026–2035 |
|---|---|---|---|
| New South Wales | 0.213 | 34.9% | 7.27% |
| Victoria | 0.157 | 25.8% | 6.87% |
| Queensland and remaining jurisdictions | 0.130 | 21.3% | 7.02% |
| Western Australia | 0.110 | 18.0% | 7.47% |
Why does New South Wales lead the country?
New South Wales held a 34.9% share of 2025 value and grows at 7.27% a year. The state recorded A$9,630 million of business R&D in 2023-24, or 39% of the national total, and its business R&D equaled 1.17% of gross state product, the highest ratio in the country. Sydney also hosts the main chemical distributors and the Botany Industrial Park, which Packaging News described in April 2024 as shared with Indorama, Ixom and Orica.
How has Victoria adjusted after the Altona closure?
Victoria held a 25.8% share of 2025 value and grows at 6.87% a year, the slowest zone, because the Altona polyethylene complex no longer runs. Victoria still recorded A$6,953 million of business R&D in 2023-24, or 28% of the national total, according to the ABS. Melbourne laboratories and lubricant blenders keep buying drums and packs through local distributors, which keeps the state the second-largest zone.
What makes Western Australia the fastest zone?
Western Australia held 18.0% of 2025 value and grows at 7.47% a year, the fastest region. The state accounted for 12% of global LNG exports in 2024, and well-service work creates steady demand for olefin-based additives. Its population grew 2.1% in the year to March 2026 to 3.10 million, the fastest of any state, which adds service and laboratory activity in Perth.
How do Queensland and the smaller jurisdictions add demand?
Queensland and remaining jurisdictions held a 21.3% share of 2025 value and grows at 7.02% a year. Queensland had 5.74 million residents in March 2026, and its business R&D equaled 0.59% of gross state product in 2023-24. South Australia, Tasmania, the ACT and the Northern Territory add university and mining laboratory demand, which is served mainly by distributors based in the southern states.
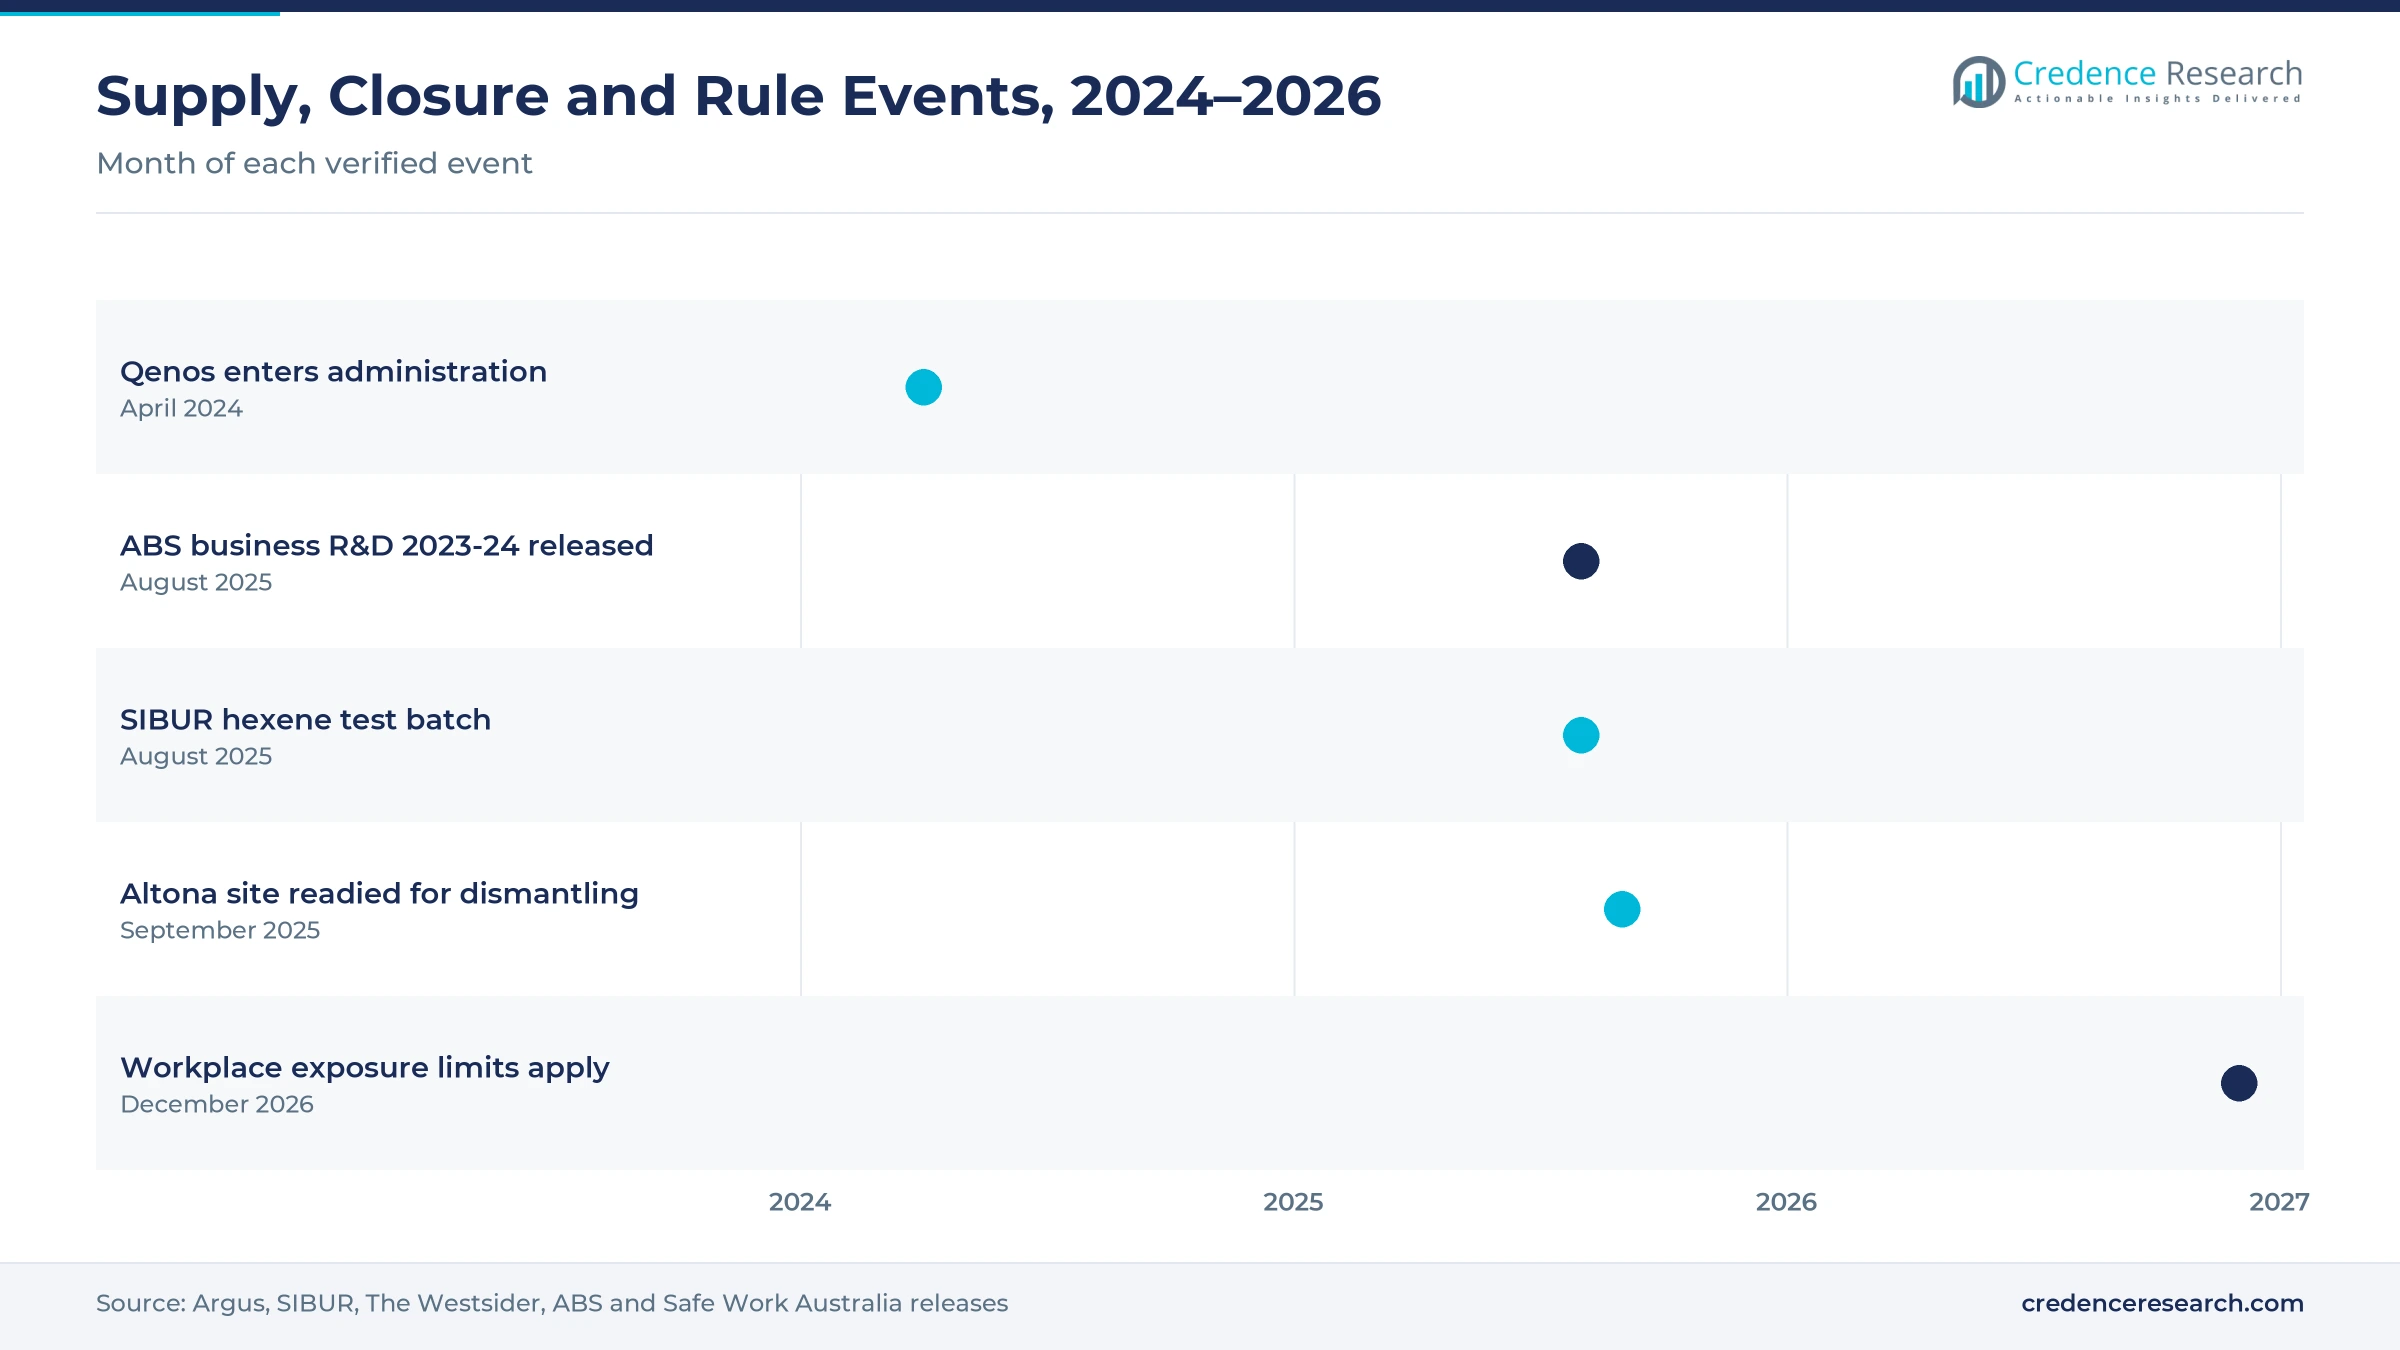
Plant closures, new capacity and rule changes, 2023–2026
| Development | Status and market relevance |
|---|---|
| In August 2023, Chevron Phillips Chemical completed the world's largest on-purpose 1-hexene unit at Old Ocean, Texas. | Lifts its U.S. capacity to 646,000 tons a year |
| In April 2024, Qenos entered voluntary administration and its Botany polyethylene plant was confirmed closed. | Ends bulk comonomer demand in Australia |
| In August 2025, SIBUR produced a test batch at its first hexene plant in Nizhnekamsk, Russia. | Adds more than 50,000 metric tons a year of global supply |
| In September 2025, the former Qenos Altona site was being readied for dismantling ahead of a warehousing project. | Confirms no local polyethylene restart |
| In December 2026, new workplace exposure limits from Safe Work Australia take effect across jurisdictions. | Requires users to review handling and monitoring |
Oligomerization routes set purity and supply options
- Broad-range ethylene oligomerization makes a spread of even-numbered alpha olefins, as at the INEOS Chocolate Bayou unit, so 1-hexene comes with other cuts.
- Selective ethylene conversion trimerizes ethylene into high-purity 1-hexene, the on-purpose route Chevron Phillips Chemical uses at Old Ocean.
- Fischer-Tropsch stream recovery separates alpha olefins from synthetic fuel streams, a route tied to coal and gas conversion plants.
- Purity grading separates technical drums from high-purity lots and 99.5% gas chromatography standards for laboratory work.
Need a Custom Version of This Report?
Tailor the scope, geography, or segments to your exact requirements.
- Custom geography or segment scope
- Direct access to our analyst team
Global producers sell through distributors and catalogues
Competition in the Australia 1-hexene market is led by global olefin producers that reach Australia through distributors, trading arms and reagent catalogues, because no local producer remains. Chevron Phillips Chemical holds 49% of Q-Chem in Qatar, whose Mesaieed plant has 47,000 t/yr of 1-hexene capacity, and it announced in August 2023 that it had completed its Old Ocean 1-hexene unit in Texas. Tokyo Chemical Industry supplies analytical grade through ChemSupply Australia, while eXsource continued trading after Qenos entered administration. INEOS Oligomers, Shell Chemicals, Sasol Chemicals and SABIC produce alpha olefins abroad, although no Australian activity for them was verified for this report. Suppliers compete on qualified grades, local stock, dangerous goods handling and delivery time. Laboratories that need certified packs favor catalogue suppliers with same-day stock, while drum buyers in oilfield and lubricant blending favor distributors that hold local inventory.
Companies profiled and their roles in this market
| Company | Type | Role in the market |
|---|---|---|
| Chevron Phillips Chemical | Global producer | 49% owner of Q-Chem, with 47,000 t/yr of 1-hexene at Mesaieed, Qatar; Old Ocean unit completed August 2023 |
| Tokyo Chemical Industry | Reagent producer | 1-Hexene gas chromatography standard of over 99.5% purity sold through ChemSupply Australia |
| eXsource | Distributor | Former Qenos distribution arm that kept trading after the April 2024 administration |
Credence Research view on a post-polyethylene niche
Credence Research's view is that the Australia 1-hexene market has reset to a small specialty base and will grow slightly faster than the wider chemical economy. Oilfield and lubricant formulators provide most of the volume, while laboratories add the fastest growth through certified packs. Global capacity additions keep supply ample and import prices moderate for local buyers. However, the loss of local polyethylene output means the market will not return to its pre-2023 scale, and supplier interest will depend on distributors bundling small orders.
Trade data, R&D statistics and catalogue checks used
The report uses 2025 as the base year for every value, share and growth rate. Market values come from the Credence Research model, and the 2025 value was set by Credence Research in line with the 2026 value and the forecast growth path, then checked against UN Comtrade import data. Regional shares, segment splits and growth tilts are all Credence Research estimates. Sources used are UN Comtrade and World Bank WITS trade data, ABS research and population statistics, company releases, trade press and supplier catalogue listings, and no interviews or surveys were used.
Specialty and research users steer growth to 2035
Spending is expected to reach USD 1.21 million by 2035, a 7.15% CAGR during 2026–2035, as specialty, oilfield and research users keep importing qualified grades. Growth should stay modest, because no local polyethylene plant remains to absorb bulk volumes. Laboratory packs, Western Australian well-service work and lubricant additives should add value at the margin, while ample global capacity keeps landed prices stable. A return to bulk demand would need a new local polymer plant, which no current project supports.
Frequently Asked Questions
How big is the Australia 1-hexene market?
Which region leads spending in Australia?
Which product type holds the largest share?
Is 1-hexene produced in Australia?
Why did Australian olefin imports fall after 2022?
Which region grows fastest through 2035?
Which companies compete in this market?
What are the main risks for suppliers?
Table of Content
Chapter 1 Market Segmentation
- 1.1 Segmentation Framework
- 1.1.1 Product and Service Classification
- 1.1.2 Application and End-Use Classification
- 1.1.3 Technology and Solution Classification
- 1.1.4 Customer and Distribution Channel Classification
- 1.1.5 Geographic Segmentation
- 1.1.6 Market Segment Definitions and Boundaries
- 1.2 By Product Type
- 1.2.1 Technical grade
- 1.2.2 High-purity grade
- 1.2.3 Analytical grade
- 1.3 By End-Use Industry
- 1.3.1 Oilfield and well-services chemicals
- 1.3.2 Synthetic lubricant intermediates
- 1.3.3 Fine and specialty chemicals
- 1.3.4 Research and analytical laboratories
- 1.4 By Application
- 1.4.1 Reactive chemical feedstock
- 1.4.2 Specialty process solvent
- 1.4.3 Experimental reagent
- 1.5 By Sales Channel
- 1.5.1 Australian stocking distributors
- 1.5.2 Direct producer contracts
- 1.5.3 Reagent catalogues
Chapter 2 Introduction
- 2.1 Report Objectives and Scope
- 2.2 Product Definition and Industry Terminology
- 2.3 Market Inclusions and Exclusions
- 2.4 Research Process
- 2.4.1 Primary Research and Expert Interviews
- 2.4.2 Secondary Research and Source Review
- 2.4.3 Top-Down and Bottom-Up Estimation
- 2.4.4 Data Triangulation and Verification
- 2.5 Market Size Measurement Basis
- 2.5.1 2025: USD 0.61 million → 2035: USD 1.21 million
- 2.6 Historical and Forecast Reference Periods
- 2.6.1 Historical Period: 2018-2025
- 2.6.2 Base Year: 2025
- 2.6.3 Forecast Period: 2025-2035
- 2.7 Research Assumptions and Limitations
Chapter 3 Executive Summary
- 3.1 Market Snapshot and Key Findings
- 3.2 Base-Year Market Size, 2025
- 3.3 Forecast Market Size, 2035
- 3.4 Revenue and Volume Growth Outlook
- 3.5 Key Demand and Supply Indicators
- 3.6 Leading Market Segments
- 3.7 Fastest-Growing Market Opportunities
- 3.8 Regional Performance Highlights
- 3.9 Technology and Industry Transformation
- 3.10 Competitive Landscape Summary
- 3.11 Analyst View and Strategic Implications
Chapter 4 Australia 1-Hexene Market Trends and Developments
- 4.1 Historical Industry Development, 2018-2025
- 4.2 Recent Market Trends and Developments
- 4.3 Demand and Customer Behavior Trends
- 4.4 Technology and Product Innovation
- 4.5 Artificial Intelligence, Automation and Digitalization
- 4.6 Local Manufacturing and Supply Chain Realignment
- 4.7 Industry Partnerships, Mergers and Acquisitions
- 4.8 Sustainability and Circular Economy Developments
- 4.9 Government and Private Sector Investment Trends
- 4.10 Emerging Business Models and Commercialization
- 4.11 Industry Developments and Announcements
Chapter 5 Australia 1-Hexene Market Production, Supply and Demand Analysis
- 5.1 Demand Trend and Consumption Analysis, 2018-2025
- 5.2 Demand Forecast, 2025-2035
- 5.3 Production and Output Trend, 2018-2025
- 5.4 Production and Output Forecast, 2025-2035
- 5.5 Installed Capacity and Capacity Utilization
- 5.6 Company-Wise Production Plants and Statistics
- 5.6.1 Installed Production Capacity
- 5.6.2 Actual Production
- 5.6.3 Planned Capacity and Expansion Targets
- 5.7 Supply Chain Structure and Procurement Trends
- 5.8 Supply-Demand Gap and Bottlenecks
- 5.9 Import Dependence and Sourcing Structure
- 5.10 Contract Manufacturing and Outsourcing
- 5.11 Regional Supply and Demand Concentration
Chapter 6 Australia 1-Hexene Market Pricing Analysis
- 6.1 Pricing Structure and Measurement
- 6.2 Historical Pricing Trends, 2018-2025
- 6.3 Pricing Outlook, 2025-2035
- 6.4 Average Selling Price and Unit Economics
- 6.5 Pricing by Product and Market Segment
- 6.6 Geographic Pricing Differences
- 6.7 Key Input, Energy, Labor and Logistics Costs
- 6.8 Contract Pricing and Purchasing Models
- 6.9 Pricing Sensitivity and Competitive Positioning
- 6.10 Price, Margin and Profitability Implications
Chapter 7 Australia 1-Hexene Market Dynamics
- 7.1 Market Growth Drivers
- 7.1.1 Demand-Side Drivers
- 7.1.2 Technology and Innovation Drivers
- 7.1.3 Infrastructure and Investment Drivers
- 7.1.4 Regulatory and Policy Drivers
- 7.2 Market Restraints
- 7.2.1 Cost and Affordability Constraints
- 7.2.2 Technology and Adoption Barriers
- 7.2.3 Supply Chain and Operational Constraints
- 7.3 Market Challenges
- 7.3.1 Competitive Pressure and Margin Erosion
- 7.3.2 Skills, Infrastructure and Implementation Gaps
- 7.4 Emerging Market Opportunities
- 7.5 Market Dynamics Impact and Time-Horizon Assessment
Chapter 8 Australia 1-Hexene Value Chain Analysis
- 8.1 Industry Value Chain Overview
- 8.2 Upstream Suppliers and Critical Inputs
- 8.3 Technology and Component Providers
- 8.4 Manufacturing or Service Delivery
- 8.5 Distribution, Channel Partners and Integrators
- 8.6 Downstream Applications and End Users
- 8.7 Value Addition and Profit Pools
- 8.8 Vertical Integration and Outsourcing
- 8.9 Supplier Concentration and Risk
- 8.10 Supply Chain Localization and Resilience
Chapter 9 Australia 1-Hexene Market Regulations and Policies
- 9.1 Relevant Laws, Standards and Compliance Frameworks
- 9.2 Product, Service, Safety and Quality Requirements
- 9.3 Government Policies, Incentives and Subsidies
- 9.4 Imports, Exports and Trade Barriers
- 9.5 Public Procurement and Local Content Requirements
- 9.6 Environmental and Sustainability Compliance
- 9.7 Upcoming Policy Changes and Market Implications
Chapter 10 Australia 1-Hexene Market Hotspots and Opportunities
- 10.1 Market Opportunity Mapping and Growth Hotspots
- 10.2 High-Growth Applications and Customer Groups
- 10.3 Underserved Markets and White-Space Opportunities
- 10.4 Emerging Technology and Product Opportunities
- 10.5 New Capacity and Investment Hotspots
- 10.6 Market Entry and Expansion Opportunities
- 10.7 Distribution and Partnership Opportunities
- 10.8 Near-Term and Long-Term Commercial Potential
- 10.9 Opportunity Attractiveness and Execution Risks
Chapter 11 Australia 1-Hexene Market Outlook, 2025-2035
- 11.1 Market Size and Analysis
- 11.1.1 Revenue (Market Measurement: 2025: USD 0.61 million → 2035: USD 1.21 million)
- 11.1.2 Market Volume and Quantity Sold
- 11.1.3 Historical Market Size, 2018-2025
- 11.1.4 Base-Year Market Size, 2025
- 11.2 Market Forecast, 2025-2035
- 11.2.1 Revenue Forecast to 2035
- 11.2.2 Volume Forecast to 2035
- 11.2.3 CAGR and Year-on-Year Growth
- 11.2.4 Incremental Revenue Opportunity
- 11.3 Forecast Assumptions and Scenario Analysis
- 11.3.1 Base-Case Forecast
- 11.3.2 Optimistic and Conservative Scenarios
- 11.3.3 Technology, Pricing and Policy Sensitivities
- 11.4 Market Attractiveness and Growth Outlook
Chapter 12 Australia 1-Hexene Market Segmentation and Outlook
- 12.1 Segmentation Summary and Market Shares, 2025
- 12.2 Largest and Fastest-Growing Segments
- 12.3 By Product Type - Market Size and Forecast, 2025-2035
- 12.3.1 Segment Definition and Scope
- 12.3.2 Historical Market Size, 2018-2025
- 12.3.3 Revenue Forecast, 2025-2035
- 12.3.4 Volume Forecast, 2025-2035
- 12.3.5 Base-Year Market Share, 2025
- 12.3.6 Segment CAGR and Growth Drivers
- 12.3.7 Subsegment Market Size and Forecast
- 12.3.7.1 Technical grade
- 12.3.7.2 High-purity grade
- 12.3.7.3 Analytical grade
- 12.3.8 Subsegment Pricing and Adoption Trends
- 12.3.9 Leading Suppliers and Competition
- 12.3.10 Regional Demand and Opportunities
- 12.4 By End-Use Industry - Market Size and Forecast, 2025-2035
- 12.4.1 Segment Definition and Scope
- 12.4.2 Historical Market Size, 2018-2025
- 12.4.3 Revenue Forecast, 2025-2035
- 12.4.4 Volume Forecast, 2025-2035
- 12.4.5 Base-Year Market Share, 2025
- 12.4.6 Segment CAGR and Growth Drivers
- 12.4.7 Subsegment Market Size and Forecast
- 12.4.7.1 Oilfield and well-services chemicals
- 12.4.7.2 Synthetic lubricant intermediates
- 12.4.7.3 Fine and specialty chemicals
- 12.4.7.4 Research and analytical laboratories
- 12.4.8 Subsegment Pricing and Adoption Trends
- 12.4.9 Leading Suppliers and Competition
- 12.4.10 Regional Demand and Opportunities
- 12.5 By Application - Market Size and Forecast, 2025-2035
- 12.5.1 Segment Definition and Scope
- 12.5.2 Historical Market Size, 2018-2025
- 12.5.3 Revenue Forecast, 2025-2035
- 12.5.4 Volume Forecast, 2025-2035
- 12.5.5 Base-Year Market Share, 2025
- 12.5.6 Segment CAGR and Growth Drivers
- 12.5.7 Subsegment Market Size and Forecast
- 12.5.7.1 Reactive chemical feedstock
- 12.5.7.2 Specialty process solvent
- 12.5.7.3 Experimental reagent
- 12.5.8 Subsegment Pricing and Adoption Trends
- 12.5.9 Leading Suppliers and Competition
- 12.5.10 Regional Demand and Opportunities
- 12.6 By Sales Channel - Market Size and Forecast, 2025-2035
- 12.6.1 Segment Definition and Scope
- 12.6.2 Historical Market Size, 2018-2025
- 12.6.3 Revenue Forecast, 2025-2035
- 12.6.4 Volume Forecast, 2025-2035
- 12.6.5 Base-Year Market Share, 2025
- 12.6.6 Segment CAGR and Growth Drivers
- 12.6.7 Subsegment Market Size and Forecast
- 12.6.7.1 Australian stocking distributors
- 12.6.7.2 Direct producer contracts
- 12.6.7.3 Reagent catalogues
- 12.6.8 Subsegment Pricing and Adoption Trends
- 12.6.9 Leading Suppliers and Competition
- 12.6.10 Regional Demand and Opportunities
- 12.7 Segment Growth Comparison
- 12.8 Segment Attractiveness and Priority Matrix
Chapter 13 Australia 1-Hexene End-Use and Application Market Outlook
- 13.1 End-Use Industry and Customer Demand Structure
- 13.2 Leading Applications and Customer Groups
- 13.3 End-Use Market Size, Share and Forecast
- 13.4 Major End-Use Industry Deep Dives
- 13.4.1 Customer Requirements and Use Cases
- 13.4.2 Demand and Replacement Cycles
- 13.4.3 Technical and Regulatory Considerations
- 13.4.4 Purchasing and Procurement Models
- 13.4.5 Leading Vendors and Distribution Channels
- 13.4.6 Forecast and Commercial Opportunities
- 13.5 Emerging Applications and Cross-Segment Demand
- 13.6 End-Use Industry Investment Priorities
Chapter 14 Australia 1-Hexene Geographic Market Outlook, 2025-2035
- 14.1 Domestic Market Distribution and Demand Clusters
- 14.2 State- or Province-Wise Market Size and Forecast, 2025-2035
- 14.3 City and Metropolitan Market Outlook
- 14.4 Industrial, Manufacturing and Commercial Clusters
- 14.5 Geographic Concentration of Key End Users
- 14.6 Local Pricing and Purchasing Differences
- 14.7 Domestic Production Facilities and Capacity Map
- 14.8 Local Infrastructure and Project Pipeline
- 14.9 State-Level Policy and Incentive Differences
- 14.10 Subnational Investment Hotspots and Opportunities
- 14.11 Distribution and Logistics Networks
- 14.12 Domestic Competitive Footprint
Chapter 15 Australia 1-Hexene Technology, Innovation and Sustainability Outlook
- 15.1 Technology Landscape and Maturity
- 15.2 Product, Process and Service Innovation
- 15.3 AI, Automation and Digital Tools in the Industry
- 15.4 Technology Adoption and Performance Benchmarking
- 15.5 Innovation Pipeline and R&D Investment
- 15.6 Patent and Intellectual Property Trends
- 15.7 Energy Efficiency and Resource Management
- 15.8 Sustainability, Recycling and Circularity
- 15.9 Technology Roadmap, 2025-2035
- 15.10 Risks of Obsolescence and Technology Substitution
Chapter 16 Australia 1-Hexene Market Key Strategic Imperatives
- 16.1 Growth and Market Entry Priorities
- 16.2 High-Return Products and Segments
- 16.3 Pricing, Profitability and Cost Optimization
- 16.4 Technology Investment and Product Differentiation
- 16.5 Supply Chain Localization and Resilience
- 16.6 Distribution and Customer Acquisition
- 16.7 Partnership, Acquisition and Capacity Strategy
- 16.8 Regional Expansion Priorities
- 16.9 Short-, Medium- and Long-Term Actions
Chapter 17 Competition Outlook
- 17.1 Industry Competition Characteristics
- 17.2 Market Structure and Concentration
- 17.3 Market Share and Competitive Positioning, 2025
- 17.4 Company-Wise Revenue and Product Benchmarking
- 17.5 Production and Service Capacity Benchmarking
- 17.6 Technology, Pricing and Differentiation
- 17.7 Regional Footprint and Distribution Strength
- 17.8 Mergers, Acquisitions and Strategic Alliances
- 17.9 New Entrants and Competitive Threats
- 17.10 Porter's Five Forces and Industry Attractiveness
- 17.11 Competitive Outlook, 2025-2035
Chapter 18 Company Profiles
- 18.1 Company Coverage and Selection Criteria
- 18.2 Chevron Phillips Chemical
- 18.2.1 Business Description
- 18.2.2 Company Ownership and Geographic Presence
- 18.2.3 Product and Service Portfolio
- 18.2.4 Manufacturing and Operating Footprint
- 18.2.5 Production Capacity and Expansion Plans
- 18.2.6 Financial Performance and Investment
- 18.2.7 Market Share and Competitive Position
- 18.2.8 Technology and Innovation Capabilities
- 18.2.9 Strategic Alliances or Partnerships
- 18.2.10 Recent Developments
- 18.2.11 Growth Strategy and Outlook
- 18.3 INEOS Oligomers
- 18.4 Sasol Chemicals
- 18.5 Shell Chemicals
- 18.6 SABIC
- 18.7 Other Relevant Market Participants
Note: Every listed company is profiled on the structure shown under the first company. The company list is preliminary and may change based on research findings, market developments, data availability and client requirements.
Chapter 19 Disclaimer
- 19.1 Research and Forecast Disclaimer
- 19.2 Data Source and Estimation Limitations
Note: The depth of individual sections depends on data availability for this market. Volume, capacity, trade and other unit-based metrics are included where applicable.

