
Asia-Pacific precast concrete shifts from housing to rail
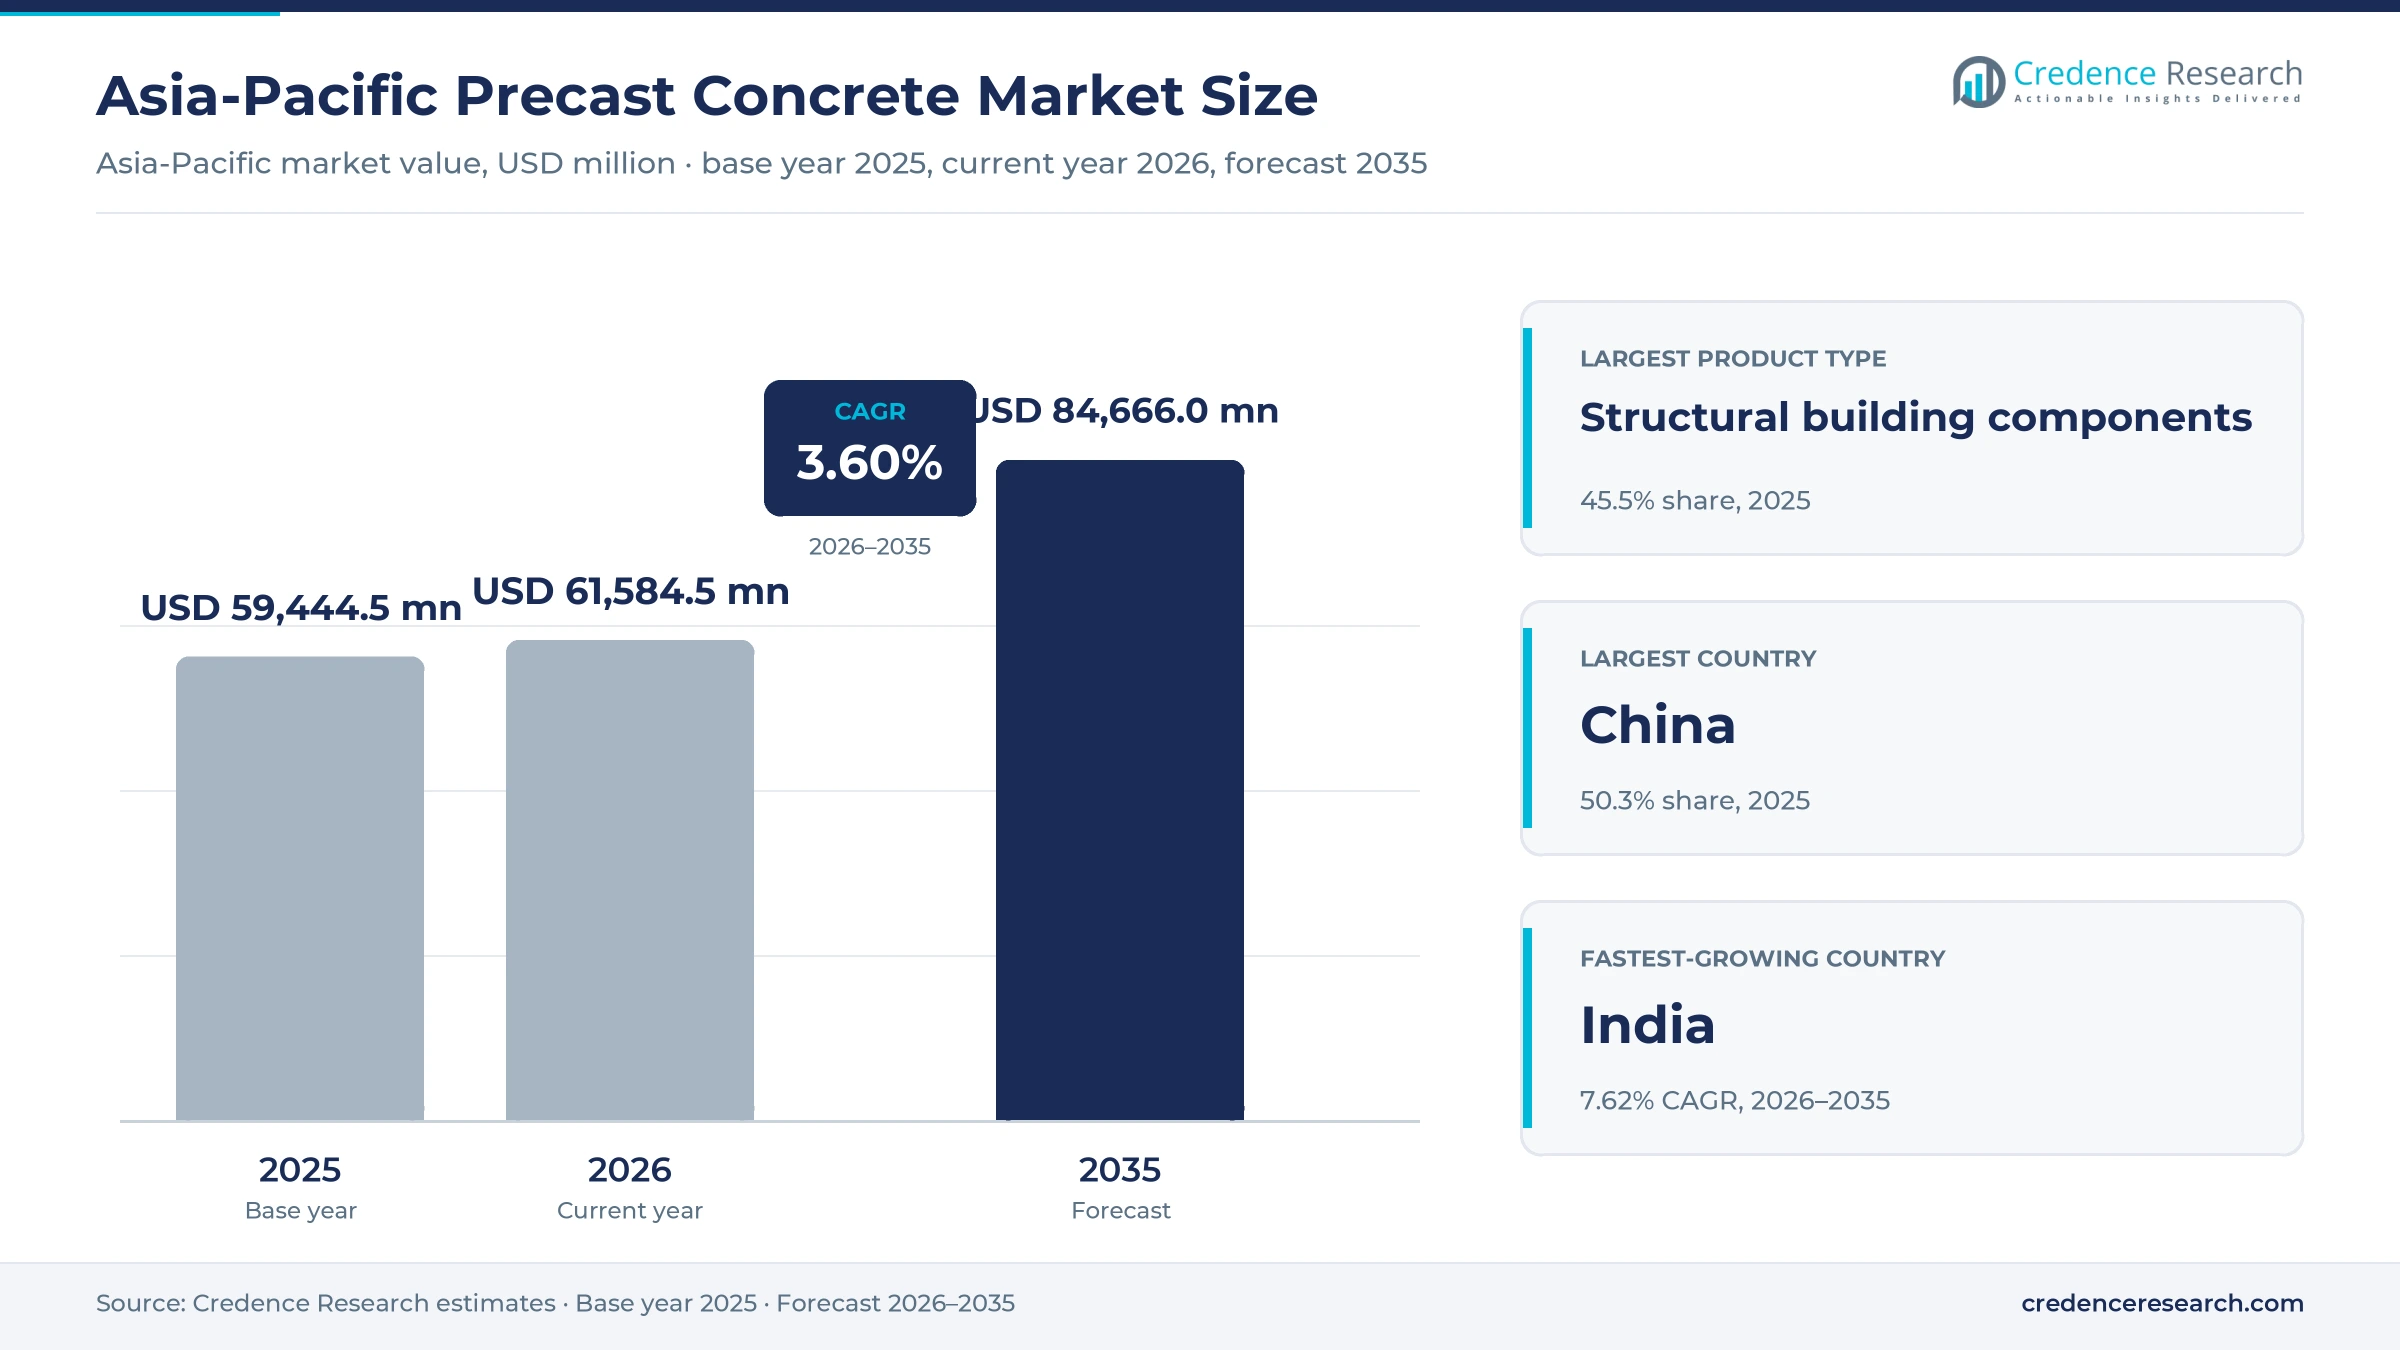
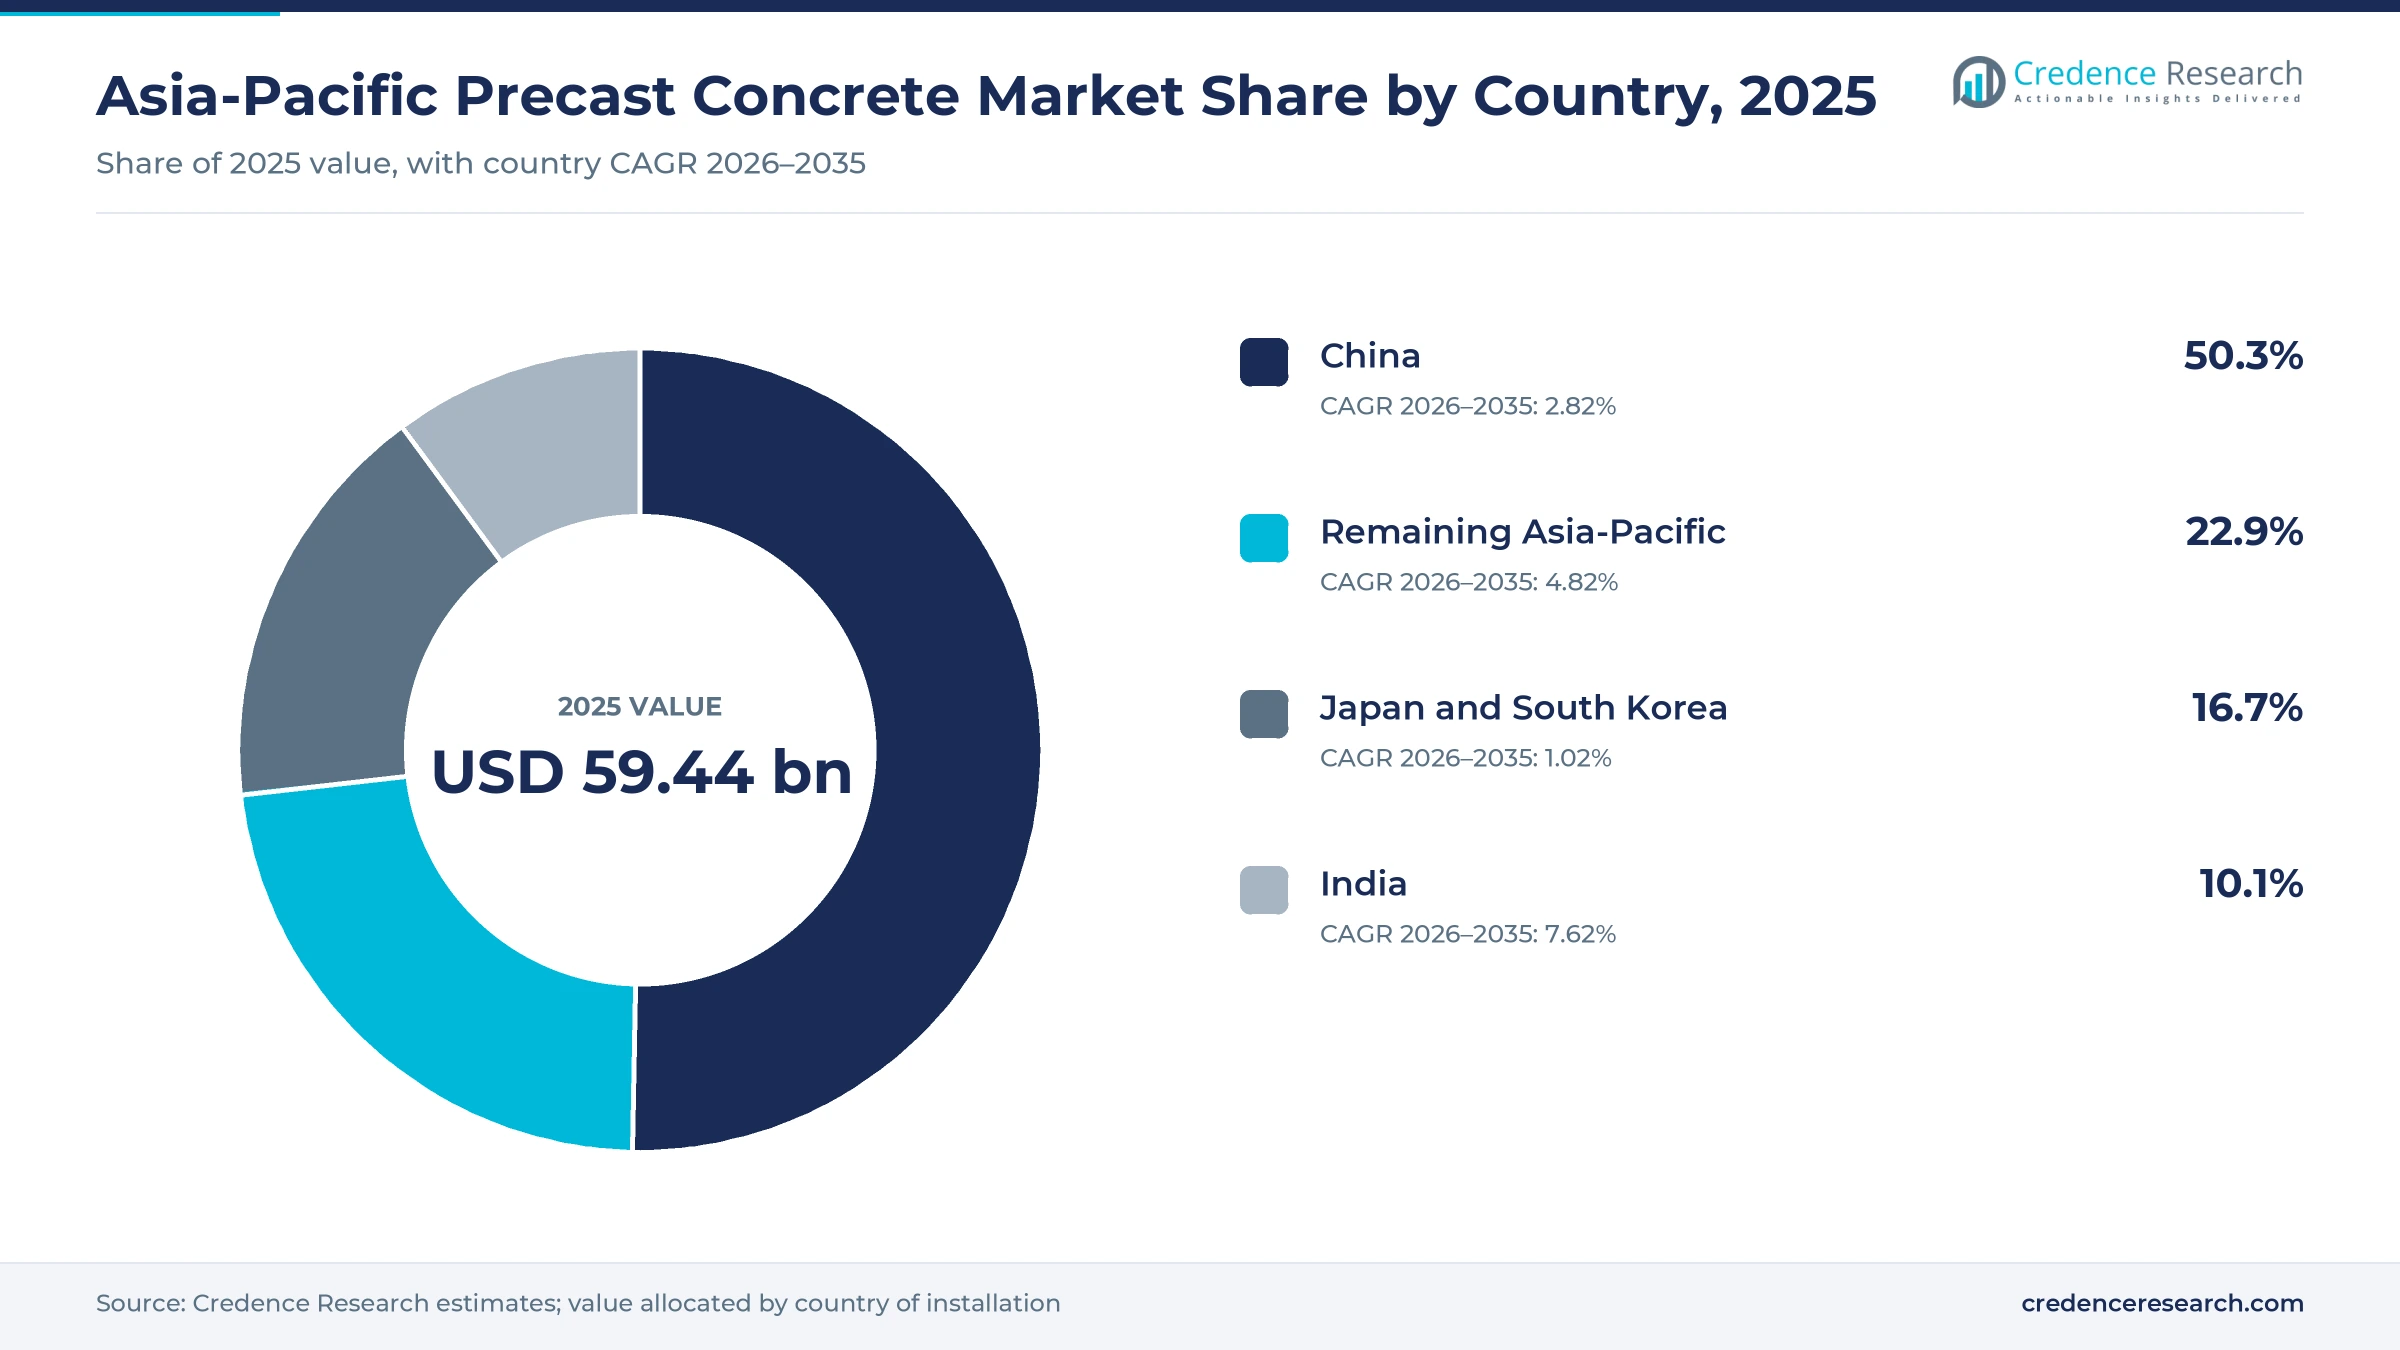
The Asia-Pacific precast concrete market was valued at USD 59.44 billion in 2025 and is projected to increase from USD 61.58 billion in 2026 to USD 84.67 billion by 2035, registering a CAGR of 3.60% during 2026–2035. Demand comes from contractors that buy girders, piles, pipes and box culverts for rail and road work, and from housing programs that order wall panels, slabs and staircases in large batches. China held the largest share, 50.3% in 2025, because its prefabrication rules apply to a very large base of new buildings, even though new floor space starts fell sharply in 2025. India is the fastest-growing country at 7.62% a year, as federal capital spending, urban housing grants and the high-speed rail corridor move more casting into factories. Southeast Asian producers add steady demand from toll roads, power lines and public housing. Japan is also changing how it builds, because its i-Construction 2.0 plan, launched in April 2024, aims to replace site labor with automated and factory-based work.
Which factory-cast concrete products does the regional estimate cover?
The estimate measures the value of concrete elements cast in plants or site casting yards and then moved into place, including wall panels, slabs, beams, columns, stairs, piles, girders, tunnel segments, sleepers, pipes, box culverts, manholes, poles, barriers, pavers and architectural cladding. It covers reinforced, pretensioned, post-tensioned and plain concrete products, and values them at the price paid by contractors, developers and asset owners, including delivery.
The estimate excludes ready-mixed concrete poured on site, cement, aggregates and admixtures sold separately, and steel or timber modular units. The value chain runs from cement, steel and aggregate suppliers through precast plants and casting yards to contractors, developers and public agencies that install the products across China, Japan and South Korea, India and the rest of the Asia-Pacific region.
Asia-Pacific Precast Concrete Market Insights
- The Asia-Pacific precast concrete market was valued at USD 59.44 billion in 2025 and is projected to reach USD 84.67 billion by 2035, registering a CAGR of 3.60% during 2026–2035.
- China held a 50.3% share of 2025 value, even though newly started floor space in China fell 20.4% in 2025 to 587.70 million square meters.
- Structural building components led product demand with a 45.5% share of 2025 value, because housing and offices still use the most wall and slab panels.
- Each 40-meter full-span box girder on the Mumbai-Ahmedabad high-speed rail line weighs about 970 metric tons, which shows how rail work moves heavy casting into yards.
- India approved PMAY-Urban 2.0 on Aug. 9, 2024, for 1 crore urban homes, with a grant for projects that use innovative construction technologies.
Building components lead while transport parts grow fastest
Why do structural building components lead product demand?
Based on product type, the market is categorized into structural building components, transportation and foundation products, water and waste-handling products, and landscape and architectural products. Structural Building Components led with a 45.5% share of 2025 value, because Chinese and Singaporean housing programs order wall panels, slabs and stairs in volume. Transportation and Foundation Products grows fastest at 4.17% a year, as rail girders and piles take a larger share of factory output.
How does residential building shape end-use demand?
Based on end-use industry, the market is categorized into residential construction, non-residential building construction, transport infrastructure and utility and environmental infrastructure. Residential Construction led with a 34.0% share of 2025 value, because public housing schemes in China, India and Malaysia specify factory-made parts. Transport Infrastructure grows fastest at 4.44% a year, as high-speed rail, metro and toll road packages buy girders and segments.
Why does conventional reinforced precast stay the base technology?
Based on technology, the market is categorized into non-prestressed reinforced concrete, pretensioned concrete, post-tensioned concrete and unreinforced concrete. Non-Prestressed Reinforced Concrete led with a 51.5% share of 2025 value, because wall panels, slabs, culverts and pipes rarely need prestressing. Post-Tensioned Concrete grows fastest at 4.29% a year, as long-span rail and highway girders use tendons stressed after casting.
How do EPC contractors control most buying decisions?
Based on customer type, the market is categorized into EPC and general contractors, property developers, public asset owners and private facility owners. EPC and General Contractors led with a 44.5% share of 2025 value, because they buy precast under rail, road and housing contracts awarded by governments. Public Asset Owners grows fastest at 4.04% a year, as water agencies and rail operators buy more products directly.
| Segment Group | Leading Sub-segment | Share, 2025 | Fastest-growing Sub-segment | CAGR, 2026–2035 |
|---|---|---|---|---|
| By Product Type | Structural Building Components | 45.5% | Transportation and Foundation Products | 4.17% |
| By End-Use Industry | Residential Construction | 34.0% | Transport Infrastructure | 4.44% |
| By Technology | Non-Prestressed Reinforced Concrete | 51.5% | Post-Tensioned Concrete | 4.29% |
| By Customer Type | EPC and General Contractors | 44.5% | Public Asset Owners | 4.04% |
Request a Free Sample
Fill in your details and we'll send you a free sample report.
- Sample data tables & charts
- Research methodology
Rail tenders, housing schemes and automation lift demand
How do transport infrastructure tenders anchor factory orders?
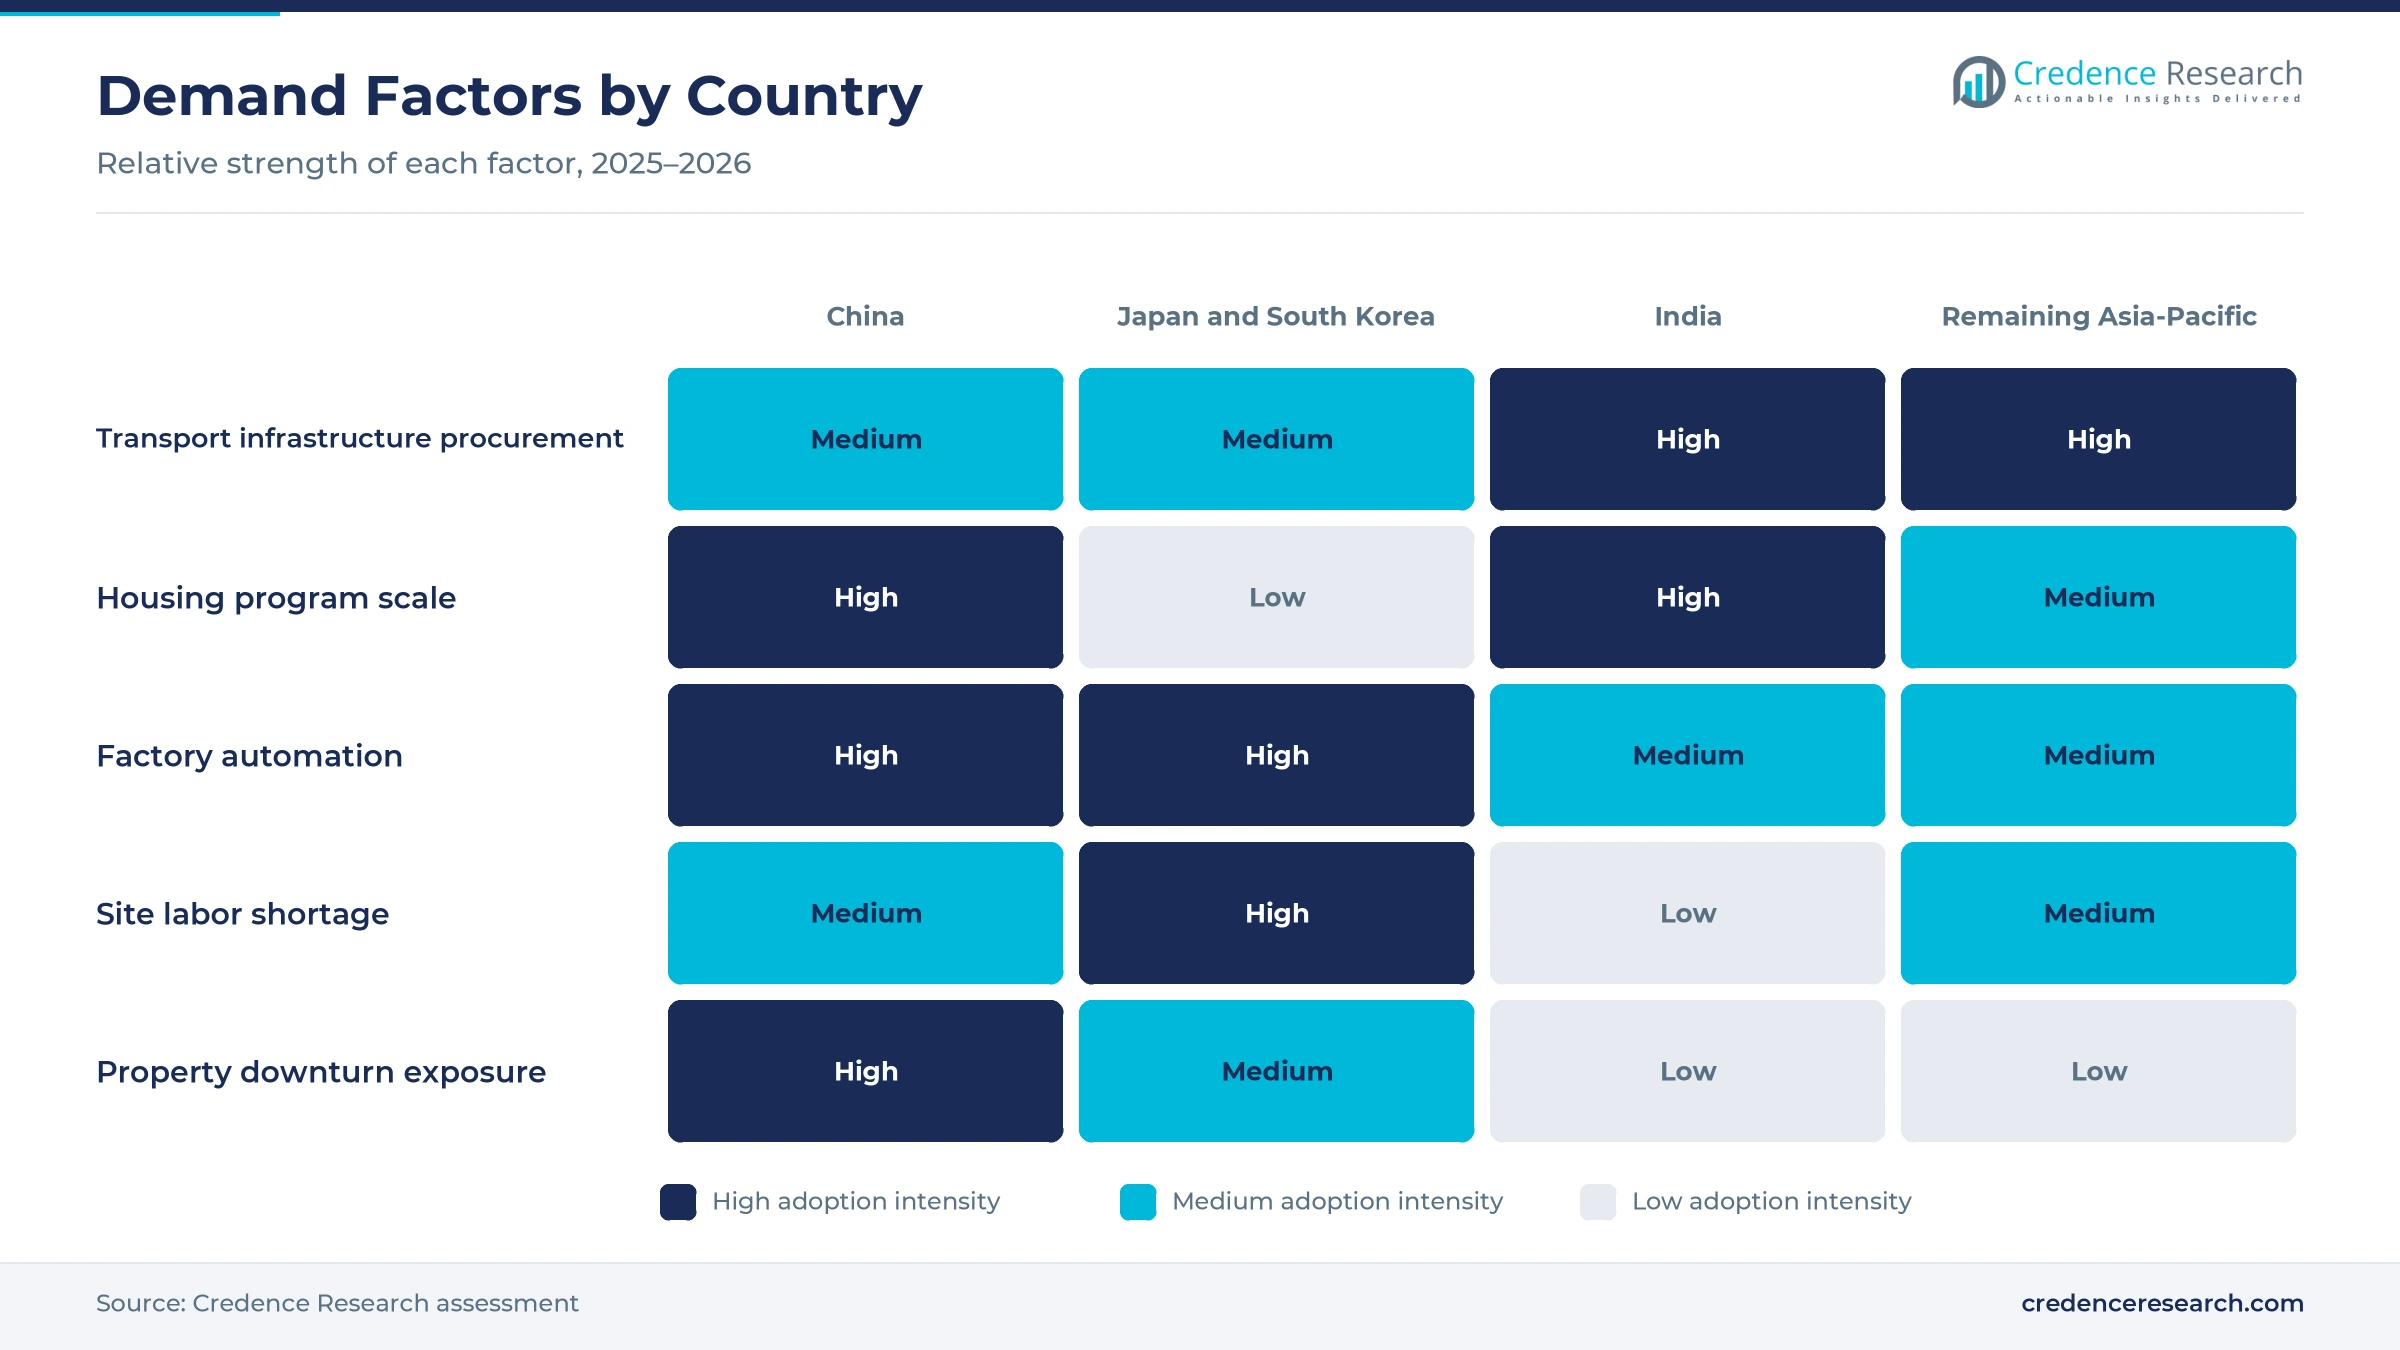
Rail and road programs buy precast girders, segments, piles and culverts in large tender packages, which makes transport the steadiest source of factory orders. India budgeted capital expenditure of 11.21 lakh crore rupees for fiscal 2025-26, All India Radio News reported, as part of a push for infrastructure-led growth. Each 40-meter full-span box girder on the Mumbai-Ahmedabad bullet train weighs about 970 metric tons, according to the National High Speed Rail Corporation, and L&T executes 325 kilometers of that corridor. NBM&CW also reported in September 2025 that 2,575 full-span girders are planned for 103 kilometers of the Maharashtra section. As a result, transport infrastructure grows fastest among end uses at 4.44% a year.
Why does housing program scale favor standard precast parts?
Large public housing programs create repeat orders for walls, slabs, stairs and columns, because governments favor standard designs that factories can cast in volume. India's Union Cabinet approved PMAY-Urban 2.0 on Aug. 9, 2024, for 1 crore urban homes over five years with investment of 10 lakh crore rupees, according to the Prime Minister's Office. The scheme also pays a Technology Innovation Grant of 1,000 rupees per square meter for affordable housing projects that use innovative construction methods. Australia's National Housing Accord targets 1.2 million new homes in five years from July 1, 2024, according to the Treasury. In turn, residential construction holds the largest end-use share at 34.0% of 2025 value.
How do factory productivity and digital integration cut costs?
Producers are automating plants to lift output per worker and cut waste, which makes factory-made parts more competitive with concrete poured on site. The HL-Sunway Prefab Hub in Punggol, Singapore, opened on July 21, 2023, with capacity for up to 100,000 cubic meters of components a year, enough for about 2,500 homes, BFT International reported. IJM Corporation's plant in Bestari Jaya, Selangor, uses robot-assisted carousel lines and magnetic shuttering with annual capacity of 700,000 square meters, according to the company. Gamuda's Digital IBS factory links cloud building models with robots and tracks each product by QR code, the company says. As a result, structural building components keep the largest product share at 45.5% of 2025 value.
Why do site labor shortages push work into factories?
Aging construction workforces push contractors to move labor from sites into plants, where fewer workers can produce more components. Japan's construction workforce fell to about 4.85 million in 2021 from a peak of 6.85 million in 1997, according to MLIT data cited by the skills body JAC, and 35.5% of those workers were aged 55 or over. Only 12% were aged 29 or younger, which limits the supply of new site crews. MLIT launched i-Construction 2.0 on April 16, 2024, with a goal of at least 30% labor savings by fiscal 2040, equal to a 1.5-fold rise in productivity. In turn, Japan and South Korea keep a 16.7% share of 2025 value while new building volumes slow.
Quotas, full-span girders and urban renewal reshape orders
How is the shift to prefabrication quotas changing Chinese supply?
Chinese local governments are turning prefabrication from a pilot into a planning rule, which keeps plants busy even as housing starts fall. Under the 14th Five-Year Plan, prefabricated construction was expected to reach about 30% of the building market by 2025, according to the interim report of Changsha Broad Homes. The company said many regions are introducing policies that require or encourage prefabrication, including for affordable rental housing. Its network had 58 joint factories by June 30, 2024, of which 57 could produce commercially, and its production rose 2.8% to 368,000 cubic meters in the first half. As a result, Chinese producers keep their plants running even as building starts weaken.
Why are heavier full-span girders rising in rail work?
Rail builders are casting whole spans in yards instead of joining short segments on site, which raises demand for heavy prestressed products. The yard-cast girders on the Mumbai-Ahmedabad line each use 390 cubic meters of concrete and 42 metric tons of steel, according to the rail corporation. NBM&CW reported in September 2025 that 319 kilometers of viaduct in Gujarat had been built with this method since April 2021. It also said that 13 casting yards are planned in Maharashtra, of which five were operating. These girders also lift demand for prestressing wire and strand. In turn, post-tensioned products grow fastest among technologies at 4.29% a year.
Can urban renewal open new demand for factory-made parts?
China's shift from new towns to renovation opens room for precast parts that can be installed quickly in occupied neighborhoods. Changsha Broad Homes cited about 2.73 billion square meters of primary and secondary school buildings in China in 2023, many of which need renovation. It also cited nearly 20 billion square meters of industrial park space and a MOHURD statement that 50,000 old residential areas would be renovated nationwide by 2024. Because renovation sites are crowded, factory-made stairs, balconies and facade panels reduce noise and work time. As a result, renovation can support Chinese plant utilization while new floor space stays weak.
Is Indonesian and Vietnamese infrastructure a growth opening?
Southeast Asian toll road, port and power programs give producers an opening beyond housing, because these projects buy piles, poles, girders and culverts. WIKA Beton said infrastructure made up 56.35% of its new contracts in 2025 and electricity 11.39%, Infobank News reported in February 2026. Waskita Beton Precast operates precast capacity of 3.7 million tons a year at plants including Karawang and Subang, and cited demand from toll roads, bridges and coastal works, Investortrust reported in April 2025. Vietnam's cement output also rose to 100 million metric tons in 2025 from 91 million in 2024. In turn, the remaining Asia-Pacific countries grow at 4.82% a year.
Property slump, idle lines and delays weigh on output
How does China's property contraction cut building orders?
China's housing slump has cut the number of new projects that order wall panels and slabs. Real estate development investment fell 17.2% in 2025, and newly started floor space fell 20.4% to 587.70 million square meters, according to the National Bureau of Statistics. As a result, residential precast plants face fewer orders and tighter prices. Producers respond by moving into renovation, schools, industrial parks and public rental housing, where demand is steadier.
Why do idle production lines squeeze producer margins?
Many Chinese precast plants were built for a larger housing market, so their lines now run well below capacity. Changsha Broad Homes reported a production line utilization rate of 39.2% in the first half of 2024, up only slightly from 37.5% a year earlier. Only six of its 58 joint factories were profitable in that period. In turn, idle lines push producers to cut prices to win work. Companies respond by merging lines, closing weak plants and seeking orders overseas.
How do project delays hit Japanese pile and segment makers?
Japanese producers depend on a few very large civil projects, so one delay can cut a year of segment orders. Nippon Concrete Industries said civil product sales fell sharply in the year to March 2026, because acceptance of RC segments for the Chuo Shinkansen maglev line was delayed. Its pile business also posted a loss as large orders were hard to win, and the company suspended some plants. Producers respond by growing utility pole sales and consolidating lines.
Why does weaker Korean building activity limit growth?
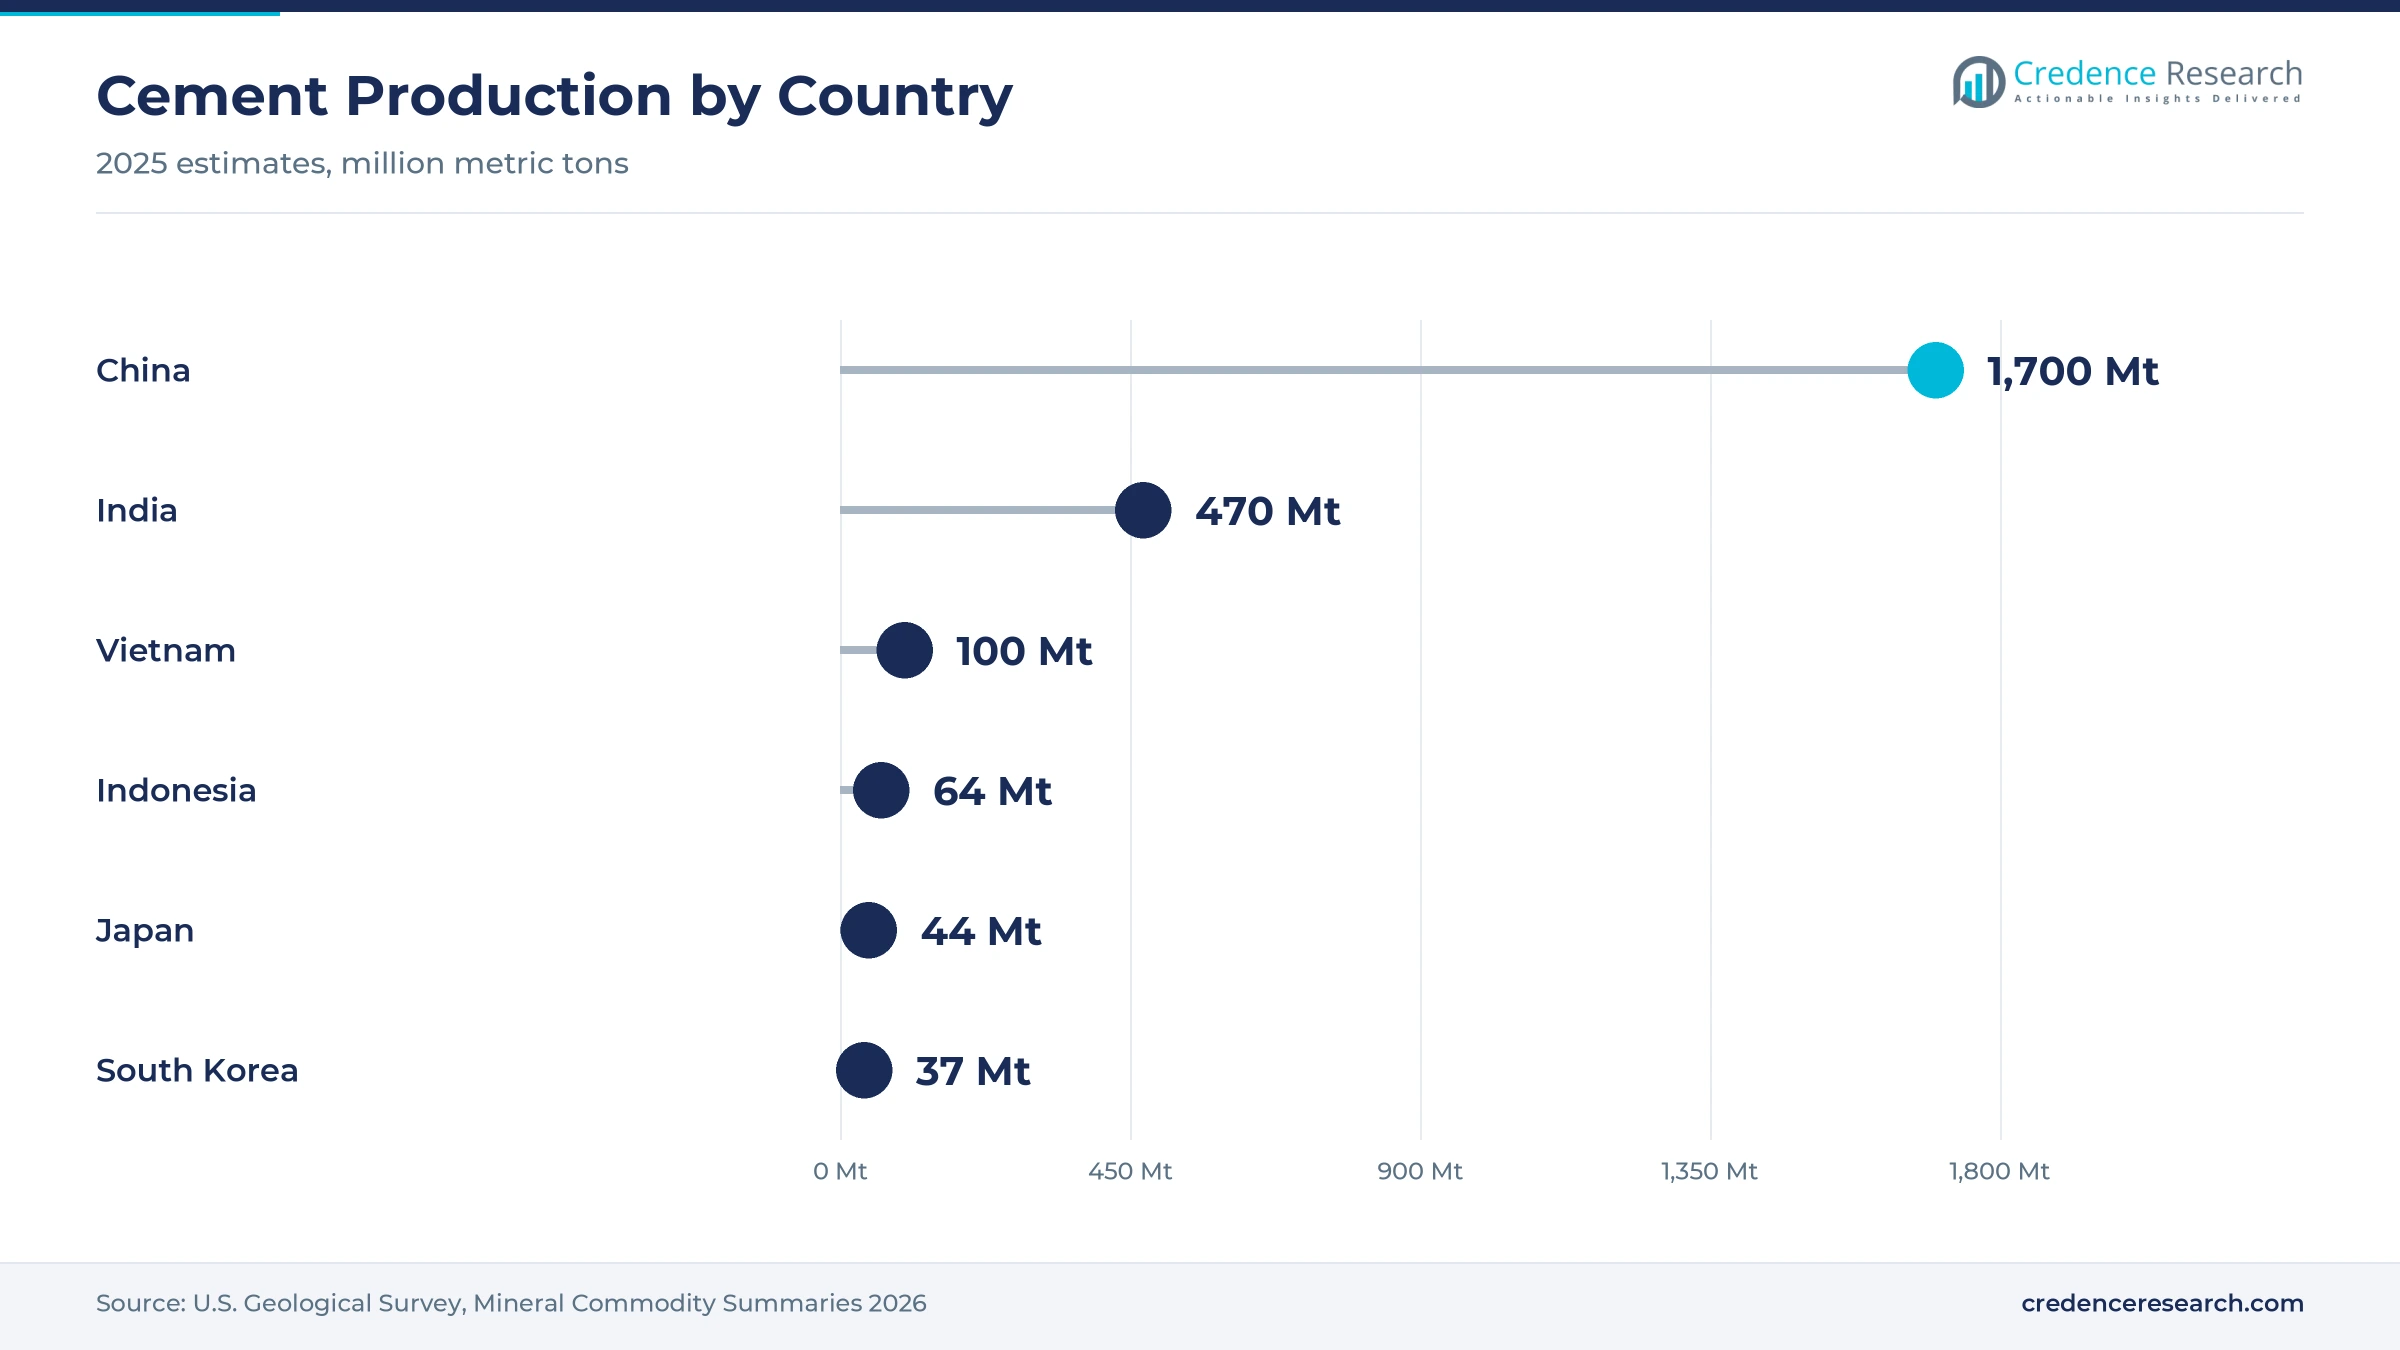
South Korea's building market has slowed, which reduces demand for piles, wall panels and slabs from housing builders. Korean cement production fell to 37 million metric tons in 2025 from 44 million in 2024, according to U.S. Geological Survey estimates. Lower cement use points to fewer new projects for precast plants that serve apartment builders. As a result, Japan and South Korea grow more slowly than the regional total. Producers respond by focusing on infrastructure repair and labor-saving products.
China leads while India adds volume fastest
| Country | Value, 2025 (USD billion) | Share, 2025 | CAGR, 2026–2035 |
|---|---|---|---|
| China | 29.90 | 50.3% | 2.82% |
| Remaining Asia-Pacific | 13.61 | 22.9% | 4.82% |
| Japan and South Korea | 9.93 | 16.7% | 1.02% |
| India | 6.00 | 10.1% | 7.62% |
Why does China keep the largest share despite weaker starts?
China held a 50.3% share of 2025 value and grows at 2.82% a year, because prefabrication rules apply to a very large base of new and renovated buildings. Chinese cement output fell to about 1.7 billion metric tons in 2025, which shows the scale of the slowdown. However, affordable rental homes, schools and industrial parks still order factory-made parts, and builders of prefabricated housing remain the largest buyers of wall and slab panels.
How do Southeast Asia and Oceania add steady volume?
The remaining Asia-Pacific countries held a 22.9% share of 2025 value and grow at 4.82% a year. Vietnam produced 100 million metric tons of cement in 2025 and Indonesia 64 million, according to the U.S. Geological Survey. Malaysia used its industrialized building system in 84% of government projects in 2021, Bernama reported. Singapore in Southeast Asia and Australia in Oceania also add demand from public housing and modular construction programs.
Why do Japan and South Korea grow the slowest?
Japan and South Korea held a 16.7% share of 2025 value and grow at 1.02% a year, the slowest pace in the region. Japan produced 44 million metric tons of cement in 2025 and South Korea 37 million, both lower than in 2024. However, worker shortages keep pushing Japanese builders toward factory-made piles, poles and segments. Large rail work also matters, because delayed Chuo Shinkansen segment orders hit Japanese producers in 2025.
Why is India the fastest-growing country?
India held a 10.1% share of 2025 value and grows fastest at 7.62% a year, because public spending and housing grants are moving casting into factories. Indian cement output rose to 470 million metric tons in 2025 from 440 million in 2024. The bullet train corridor already uses full-span girders cast in yards, while PMAY-Urban 2.0 rewards innovative building methods. Faster building cycles also lift demand for construction chemicals used in precast yards.
Policy moves, plant capacity and rail milestones, 2024–2026
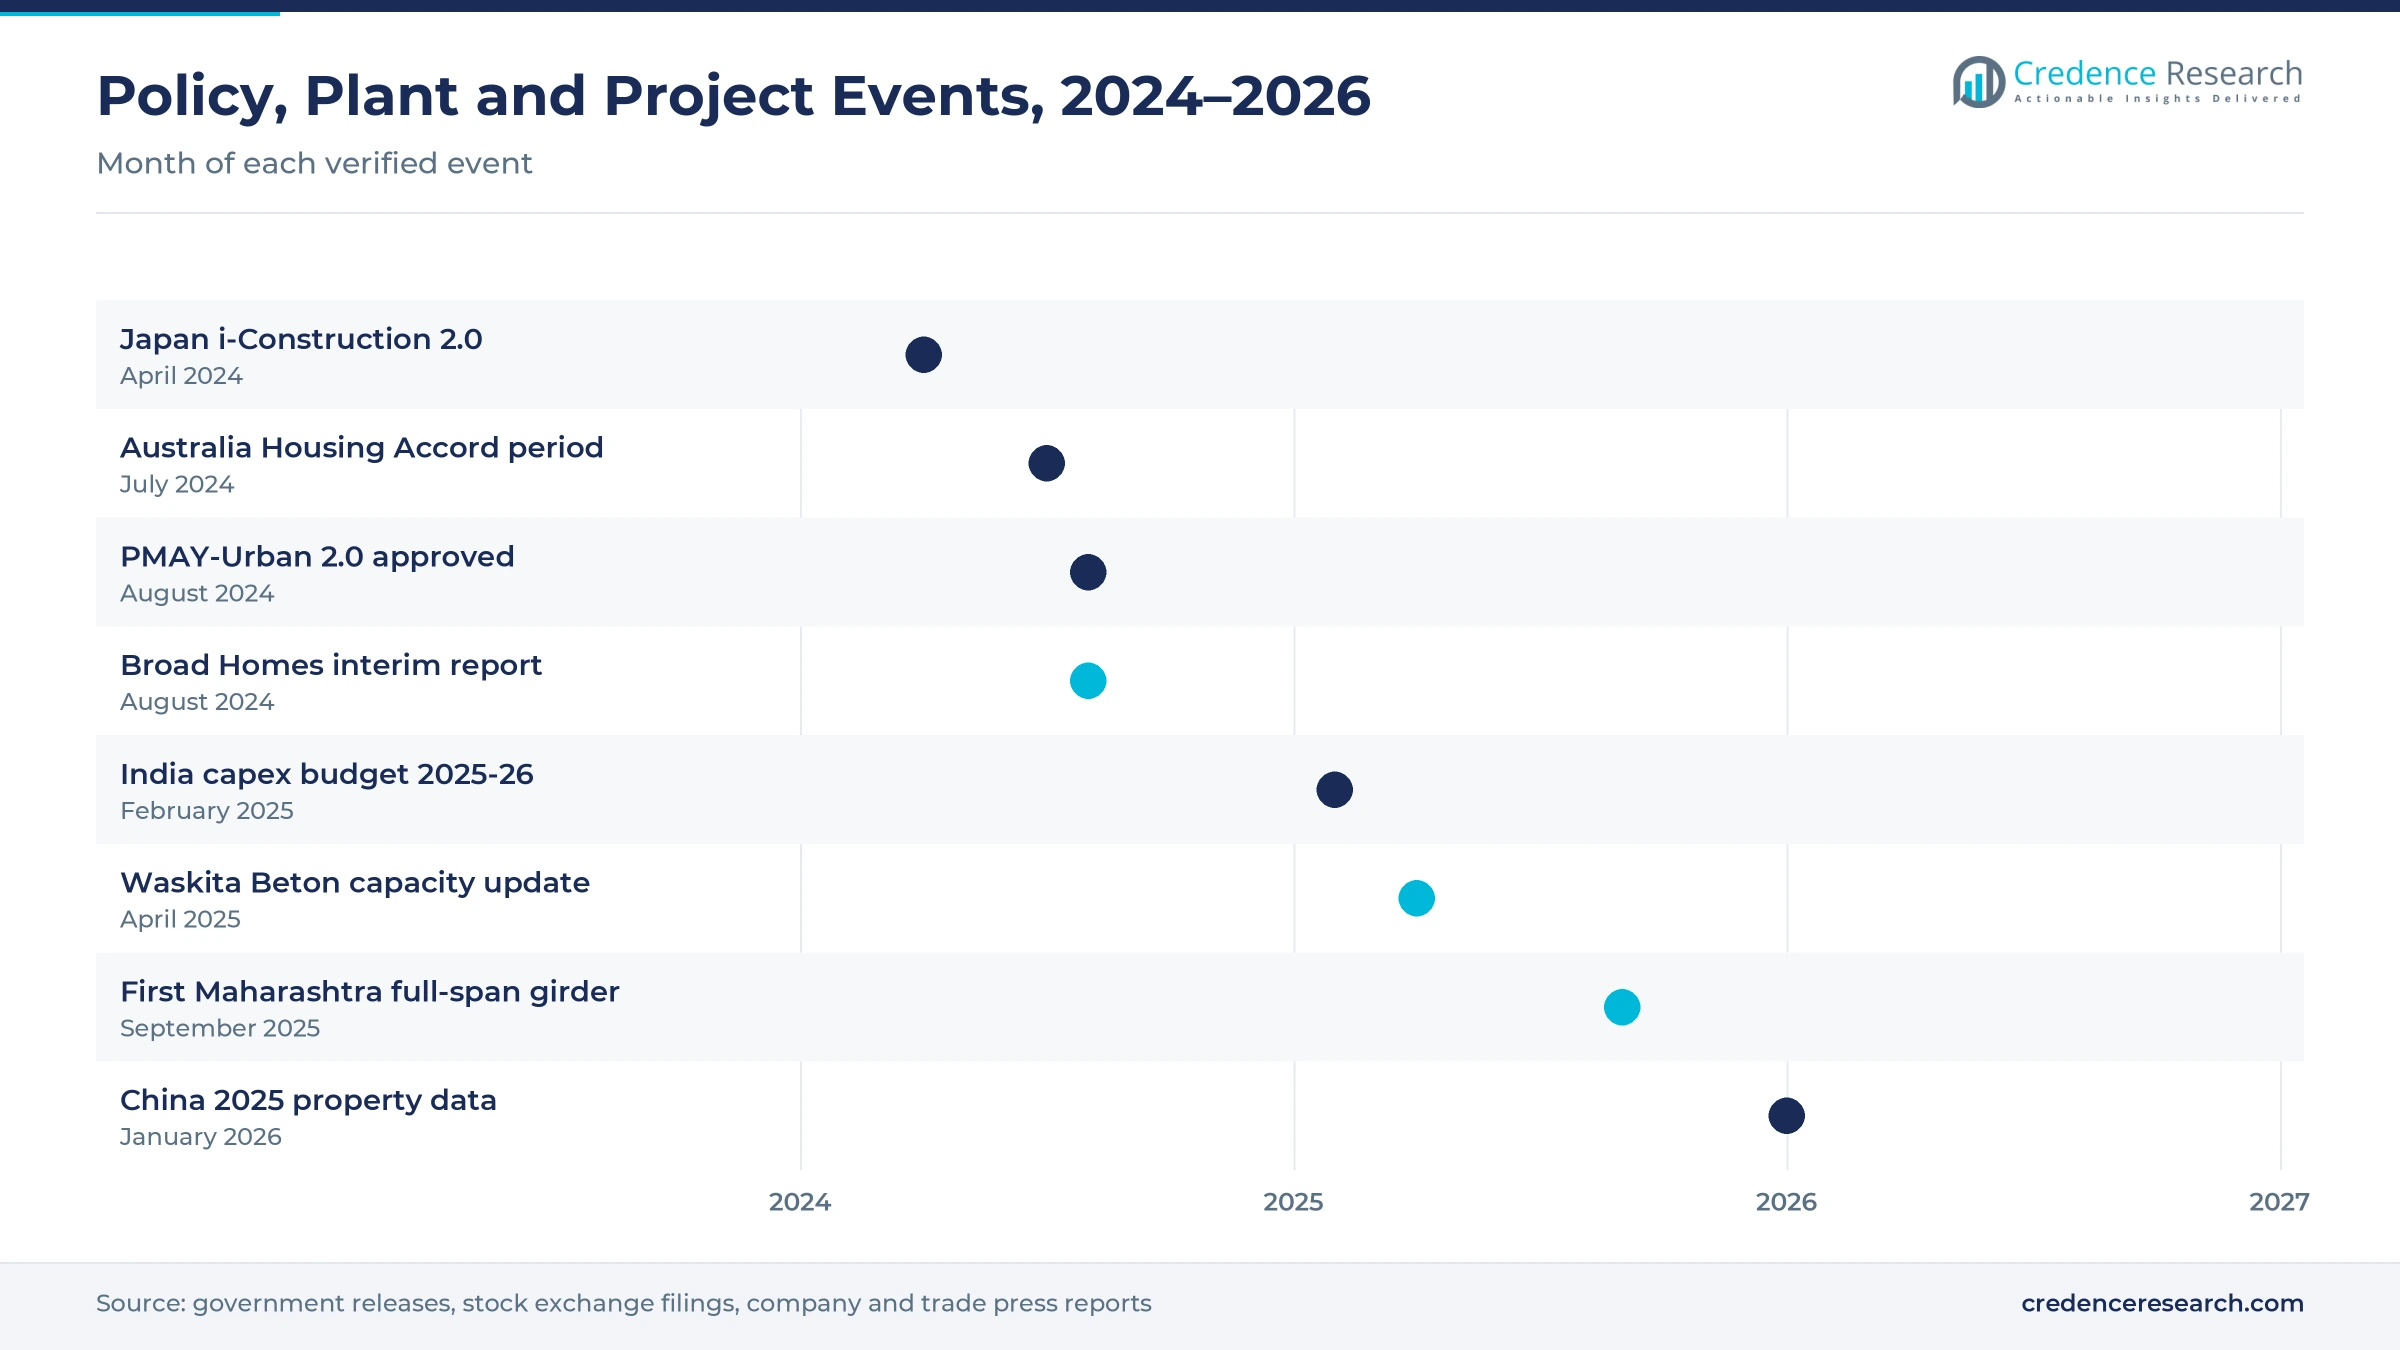
| Development | Status and market relevance |
|---|---|
| In April 2024, Japan's MLIT launched i-Construction 2.0 with a goal of at least 30% labor savings at sites by fiscal 2040. | Supports factory-made parts that save site labor |
| In August 2024, India's Union Cabinet approved PMAY-Urban 2.0 for 1 crore urban homes over five years. | Adds grants for innovative construction methods |
| In April 2025, Waskita Beton Precast cited precast capacity of 3.7 million tons a year and demand from toll roads and bridges. | Shows Indonesian infrastructure demand |
| In September 2025, the Mumbai-Ahmedabad bullet train project launched its first 40-meter full-span box girder in Maharashtra. | Extends yard-cast girders to a second state |
| In January 2026, China's National Bureau of Statistics reported that newly started floor space fell 20.4% in 2025. | Confirms weaker housing orders in China |
Carousel lines, BIM tracking and gantries change supply
- Robot-assisted carousel lines move pallets through shuttering, reinforcement, casting and curing stations, which raises output per worker in Malaysian and Singaporean plants.
- Magnetic shuttering lets plants change panel shapes quickly on the same pallet, which suits housing projects with many unit types.
- BIM models with QR tracking link design, casting and delivery, so contractors can check each part before and after it reaches the site.
- Full-span launching gantries lift whole 40-meter girders onto piers, which lets rail builders replace segment work with yard-cast spans.
Need a Custom Version of This Report?
Tailor the scope, geography, or segments to your exact requirements.
- Custom geography or segment scope
- Direct access to our analyst team
Builders with in-house plants compete with focused casters
Competition combines large contractors with their own plants, focused precast makers and state-linked suppliers in each country. Changsha Broad Homes supplies building units in China through a network of joint factories. Larsen & Toubro builds 325 kilometers of the Indian bullet train corridor, where full-span girders are cast in yards. In Japan, Nippon Concrete Industries makes piles, utility poles and tunnel segments. WIKA Beton and Waskita Beton Precast supply piles, girders and poles for Indonesian toll roads, bridges and power projects. In Malaysia and Singapore, Gamuda, IJM Corporation and Sunway Construction Group run automated plants for housing and building projects. Humes, part of Holcim Australia, supplies pipes, culverts and bridge parts in Australia. Companies compete on plant location, delivery reliability, design support and the ability to cast heavy prestressed parts.
Companies profiled and their roles in this market
| Company | Type | Role in the market |
|---|---|---|
| Changsha Broad Homes Industrial Group | Prefabricated building maker | Runs 58 joint factories for building units in China |
| Larsen & Toubro | EPC contractor | Executes 325 kilometers of the Mumbai-Ahmedabad high-speed rail corridor |
| Nippon Concrete Industries | Pile and pole maker | Makes PHC piles, utility poles and RC segments in Japan |
| WIKA Beton | Precast producer | Took most 2025 new contracts from infrastructure work in Indonesia |
| Waskita Beton Precast | Precast producer | Operates 3.7 million tons a year of precast capacity in Indonesia |
| Gamuda | Contractor and developer | Runs a Digital IBS factory with robots and QR tracking in Malaysia |
| IJM Corporation | Contractor and IBS maker | Operates a 700,000 square meter plant in Bestari Jaya, Selangor |
| Sunway Construction Group | Contractor and precast maker | Holds 49% of the HL-Sunway Prefab Hub in Singapore |
| Humes | Precast division of Holcim Australia | Makes pipes, box culverts and bridge parts across Australia |
Credence Research view on factory-cast concrete demand
Credence Research's view is that factory-cast concrete demand in the Asia-Pacific region will grow at a moderate pace, because rail, road and utility work offsets weaker housing starts in China. Structural building components keep the largest product share, but transport and foundation products grow faster as girders, piles and segments take more plant capacity. China stays the largest country, while India grows fastest on public capital spending and urban housing grants. However, idle Chinese lines and slow Korean building will hold back prices. Producers with automated plants near large projects should gain share fastest.
How the regional factory-cast concrete estimate was built
The report uses 2025 as the base year on a calendar basis, and market values come from the Credence Research model. That model combines cement output, construction statistics, public program budgets and company information on capacity, output and contracts. Segment splits and country growth rates are Credence Research estimates, while country shares follow the client-defined split. Sources used are official statistics, government releases, stock exchange filings, company websites and news reports, and no interviews or surveys were used.
Infrastructure orders carry factory-cast demand to 2035
Asia-Pacific precast concrete value is expected to reach USD 84.67 billion by 2035, a 3.60% CAGR during 2026–2035, as transport and housing programs move more casting into factories. Growth should stay slow through 2027 while Chinese housing starts settle. After that, Indian rail and housing work, Southeast Asian infrastructure and Japanese labor-saving rules should add more value each year. Faster Chinese renovation spending would raise this outlook, while further cuts in building starts would lower it.
Frequently Asked Questions
How big is the Asia-Pacific precast concrete market?
Which product type leads regional demand?
Which country leads the regional market?
How does rail work affect precast demand?
Why is Chinese housing demand weaker?
Which end use grows fastest?
Who are the leading companies in the region?
What are the main challenges for producers?
Table of Content
Chapter 1 Market Segmentation
- 1.1 Segmentation Framework
- 1.1.1 Product and Service Classification
- 1.1.2 Application and End-Use Classification
- 1.1.3 Technology and Solution Classification
- 1.1.4 Customer and Distribution Channel Classification
- 1.1.5 Geographic Segmentation
- 1.1.6 Market Segment Definitions and Boundaries
- 1.2 By Product Type
- 1.2.1 Structural Building Components
- 1.2.2 Transportation and Foundation Products
- 1.2.3 Water and Waste-Handling Products
- 1.2.4 Landscape and Architectural Products
- 1.3 By End-Use Industry
- 1.3.1 Residential Construction
- 1.3.2 Non-Residential Building Construction
- 1.3.3 Transport Infrastructure
- 1.3.4 Utility and Environmental Infrastructure
- 1.4 By Technology
- 1.4.1 Non-Prestressed Reinforced Concrete
- 1.4.2 Pretensioned Concrete
- 1.4.3 Post-Tensioned Concrete
- 1.4.4 Unreinforced Concrete
- 1.5 By Customer Type
- 1.5.1 EPC and General Contractors
- 1.5.2 Property Developers
- 1.5.3 Public Asset Owners
- 1.5.4 Private Facility Owners
- 1.6 By Country
- 1.6.1 China
- 1.6.2 Japan and South Korea
- 1.6.3 India
- 1.6.4 Remaining Asia-Pacific
Chapter 2 Introduction
- 2.1 Report Objectives and Scope
- 2.2 Product Definition and Industry Terminology
- 2.3 Market Inclusions and Exclusions
- 2.4 Research Process
- 2.4.1 Primary Research and Expert Interviews
- 2.4.2 Secondary Research and Source Review
- 2.4.3 Top-Down and Bottom-Up Estimation
- 2.4.4 Data Triangulation and Verification
- 2.5 Market Size Measurement Basis
- 2.5.1 2025: USD 59.44 billion → 2035: USD 84.67 billion
- 2.6 Historical and Forecast Reference Periods
- 2.6.1 Historical Period: 2018-2025
- 2.6.2 Base Year: 2025
- 2.6.3 Forecast Period: 2025-2035
- 2.7 Research Assumptions and Limitations
Chapter 3 Executive Summary
- 3.1 Market Snapshot and Key Findings
- 3.2 Base-Year Market Size, 2025
- 3.3 Forecast Market Size, 2035
- 3.4 Revenue and Volume Growth Outlook
- 3.5 Key Demand and Supply Indicators
- 3.6 Leading Market Segments
- 3.7 Fastest-Growing Market Opportunities
- 3.8 Regional Performance Highlights
- 3.9 Technology and Industry Transformation
- 3.10 Competitive Landscape Summary
- 3.11 Analyst View and Strategic Implications
Chapter 4 Asia-Pacific Precast Concrete Market Trends and Developments
- 4.1 Historical Industry Development, 2018-2025
- 4.2 Recent Market Trends and Developments
- 4.3 Demand and Customer Behavior Trends
- 4.4 Technology and Product Innovation
- 4.5 Artificial Intelligence, Automation and Digitalization
- 4.6 Local Manufacturing and Supply Chain Realignment
- 4.7 Industry Partnerships, Mergers and Acquisitions
- 4.8 Sustainability and Circular Economy Developments
- 4.9 Government and Private Sector Investment Trends
- 4.10 Emerging Business Models and Commercialization
- 4.11 Industry Developments and Announcements
Chapter 5 Asia-Pacific Precast Concrete Market Production, Supply and Demand Analysis
- 5.1 Demand Trend and Consumption Analysis, 2018-2025
- 5.2 Demand Forecast, 2025-2035
- 5.3 Production and Output Trend, 2018-2025
- 5.4 Production and Output Forecast, 2025-2035
- 5.5 Installed Capacity and Capacity Utilization
- 5.6 Company-Wise Production Plants and Statistics
- 5.6.1 Installed Production Capacity
- 5.6.2 Actual Production
- 5.6.3 Planned Capacity and Expansion Targets
- 5.7 Supply Chain Structure and Procurement Trends
- 5.8 Supply-Demand Gap and Bottlenecks
- 5.9 Import Dependence and Sourcing Structure
- 5.10 Contract Manufacturing and Outsourcing
- 5.11 Regional Supply and Demand Concentration
Chapter 6 Asia-Pacific Precast Concrete Market Pricing Analysis
- 6.1 Pricing Structure and Measurement
- 6.2 Historical Pricing Trends, 2018-2025
- 6.3 Pricing Outlook, 2025-2035
- 6.4 Average Selling Price and Unit Economics
- 6.5 Pricing by Product and Market Segment
- 6.6 Geographic Pricing Differences
- 6.7 Key Input, Energy, Labor and Logistics Costs
- 6.8 Contract Pricing and Purchasing Models
- 6.9 Pricing Sensitivity and Competitive Positioning
- 6.10 Price, Margin and Profitability Implications
Chapter 7 Asia-Pacific Precast Concrete Market Dynamics
- 7.1 Market Growth Drivers
- 7.1.1 Demand-Side Drivers
- 7.1.2 Technology and Innovation Drivers
- 7.1.3 Infrastructure and Investment Drivers
- 7.1.4 Regulatory and Policy Drivers
- 7.2 Market Restraints
- 7.2.1 Cost and Affordability Constraints
- 7.2.2 Technology and Adoption Barriers
- 7.2.3 Supply Chain and Operational Constraints
- 7.3 Market Challenges
- 7.3.1 Competitive Pressure and Margin Erosion
- 7.3.2 Skills, Infrastructure and Implementation Gaps
- 7.4 Emerging Market Opportunities
- 7.5 Market Dynamics Impact and Time-Horizon Assessment
Chapter 8 Asia-Pacific Precast Concrete Value Chain Analysis
- 8.1 Industry Value Chain Overview
- 8.2 Upstream Suppliers and Critical Inputs
- 8.3 Technology and Component Providers
- 8.4 Manufacturing or Service Delivery
- 8.5 Distribution, Channel Partners and Integrators
- 8.6 Downstream Applications and End Users
- 8.7 Value Addition and Profit Pools
- 8.8 Vertical Integration and Outsourcing
- 8.9 Supplier Concentration and Risk
- 8.10 Supply Chain Localization and Resilience
Chapter 9 Asia-Pacific Precast Concrete Market Regulations and Policies
- 9.1 Relevant Laws, Standards and Compliance Frameworks
- 9.2 Product, Service, Safety and Quality Requirements
- 9.3 Government Policies, Incentives and Subsidies
- 9.4 Imports, Exports and Trade Barriers
- 9.5 Public Procurement and Local Content Requirements
- 9.6 Environmental and Sustainability Compliance
- 9.7 Upcoming Policy Changes and Market Implications
Chapter 10 Asia-Pacific Precast Concrete Market Hotspots and Opportunities
- 10.1 Market Opportunity Mapping and Growth Hotspots
- 10.2 High-Growth Applications and Customer Groups
- 10.3 Underserved Markets and White-Space Opportunities
- 10.4 Emerging Technology and Product Opportunities
- 10.5 New Capacity and Investment Hotspots
- 10.6 Market Entry and Expansion Opportunities
- 10.7 Distribution and Partnership Opportunities
- 10.8 Near-Term and Long-Term Commercial Potential
- 10.9 Opportunity Attractiveness and Execution Risks
Chapter 11 Asia-Pacific Precast Concrete Market Outlook, 2025-2035
- 11.1 Market Size and Analysis
- 11.1.1 Revenue (Market Measurement: 2025: USD 59.44 billion → 2035: USD 84.67 billion)
- 11.1.2 Market Volume and Quantity Sold
- 11.1.3 Historical Market Size, 2018-2025
- 11.1.4 Base-Year Market Size, 2025
- 11.2 Market Forecast, 2025-2035
- 11.2.1 Revenue Forecast to 2035
- 11.2.2 Volume Forecast to 2035
- 11.2.3 CAGR and Year-on-Year Growth
- 11.2.4 Incremental Revenue Opportunity
- 11.3 Forecast Assumptions and Scenario Analysis
- 11.3.1 Base-Case Forecast
- 11.3.2 Optimistic and Conservative Scenarios
- 11.3.3 Technology, Pricing and Policy Sensitivities
- 11.4 Market Attractiveness and Growth Outlook
Chapter 12 Asia-Pacific Precast Concrete Market Segmentation and Outlook
- 12.1 Segmentation Summary and Market Shares, 2025
- 12.2 Largest and Fastest-Growing Segments
- 12.3 By Product Type - Market Size and Forecast, 2025-2035
- 12.3.1 Segment Definition and Scope
- 12.3.2 Historical Market Size, 2018-2025
- 12.3.3 Revenue Forecast, 2025-2035
- 12.3.4 Volume Forecast, 2025-2035
- 12.3.5 Base-Year Market Share, 2025
- 12.3.6 Segment CAGR and Growth Drivers
- 12.3.7 Subsegment Market Size and Forecast
- 12.3.7.1 Structural Building Components
- 12.3.7.2 Transportation and Foundation Products
- 12.3.7.3 Water and Waste-Handling Products
- 12.3.7.4 Landscape and Architectural Products
- 12.3.8 Subsegment Pricing and Adoption Trends
- 12.3.9 Leading Suppliers and Competition
- 12.3.10 Regional Demand and Opportunities
- 12.4 By End-Use Industry - Market Size and Forecast, 2025-2035
- 12.4.1 Segment Definition and Scope
- 12.4.2 Historical Market Size, 2018-2025
- 12.4.3 Revenue Forecast, 2025-2035
- 12.4.4 Volume Forecast, 2025-2035
- 12.4.5 Base-Year Market Share, 2025
- 12.4.6 Segment CAGR and Growth Drivers
- 12.4.7 Subsegment Market Size and Forecast
- 12.4.7.1 Residential Construction
- 12.4.7.2 Non-Residential Building Construction
- 12.4.7.3 Transport Infrastructure
- 12.4.7.4 Utility and Environmental Infrastructure
- 12.4.8 Subsegment Pricing and Adoption Trends
- 12.4.9 Leading Suppliers and Competition
- 12.4.10 Regional Demand and Opportunities
- 12.5 By Technology - Market Size and Forecast, 2025-2035
- 12.5.1 Segment Definition and Scope
- 12.5.2 Historical Market Size, 2018-2025
- 12.5.3 Revenue Forecast, 2025-2035
- 12.5.4 Volume Forecast, 2025-2035
- 12.5.5 Base-Year Market Share, 2025
- 12.5.6 Segment CAGR and Growth Drivers
- 12.5.7 Subsegment Market Size and Forecast
- 12.5.7.1 Non-Prestressed Reinforced Concrete
- 12.5.7.2 Pretensioned Concrete
- 12.5.7.3 Post-Tensioned Concrete
- 12.5.7.4 Unreinforced Concrete
- 12.5.8 Subsegment Pricing and Adoption Trends
- 12.5.9 Leading Suppliers and Competition
- 12.5.10 Regional Demand and Opportunities
- 12.6 By Customer Type - Market Size and Forecast, 2025-2035
- 12.6.1 Segment Definition and Scope
- 12.6.2 Historical Market Size, 2018-2025
- 12.6.3 Revenue Forecast, 2025-2035
- 12.6.4 Volume Forecast, 2025-2035
- 12.6.5 Base-Year Market Share, 2025
- 12.6.6 Segment CAGR and Growth Drivers
- 12.6.7 Subsegment Market Size and Forecast
- 12.6.7.1 EPC and General Contractors
- 12.6.7.2 Property Developers
- 12.6.7.3 Public Asset Owners
- 12.6.7.4 Private Facility Owners
- 12.6.8 Subsegment Pricing and Adoption Trends
- 12.6.9 Leading Suppliers and Competition
- 12.6.10 Regional Demand and Opportunities
- 12.7 By Country - Market Size and Forecast, 2025-2035
- 12.7.1 Segment Definition and Scope
- 12.7.2 Historical Market Size, 2018-2025
- 12.7.3 Revenue Forecast, 2025-2035
- 12.7.4 Volume Forecast, 2025-2035
- 12.7.5 Base-Year Market Share, 2025
- 12.7.6 Segment CAGR and Growth Drivers
- 12.7.7 Subsegment Market Size and Forecast
- 12.7.7.1 China
- 12.7.7.2 Japan and South Korea
- 12.7.7.3 India
- 12.7.7.4 Remaining Asia-Pacific
- 12.7.8 Subsegment Pricing and Adoption Trends
- 12.7.9 Leading Suppliers and Competition
- 12.7.10 Regional Demand and Opportunities
- 12.8 Segment Growth Comparison
- 12.9 Segment Attractiveness and Priority Matrix
Chapter 13 Asia-Pacific Precast Concrete End-Use and Application Market Outlook
- 13.1 End-Use Industry and Customer Demand Structure
- 13.2 Leading Applications and Customer Groups
- 13.3 End-Use Market Size, Share and Forecast
- 13.4 Major End-Use Industry Deep Dives
- 13.4.1 Customer Requirements and Use Cases
- 13.4.2 Demand and Replacement Cycles
- 13.4.3 Technical and Regulatory Considerations
- 13.4.4 Purchasing and Procurement Models
- 13.4.5 Leading Vendors and Distribution Channels
- 13.4.6 Forecast and Commercial Opportunities
- 13.5 Emerging Applications and Cross-Segment Demand
- 13.6 End-Use Industry Investment Priorities
Chapter 14 Asia-Pacific Precast Concrete Geographic Market Outlook, 2025-2035
- 14.1 Regional Market Size and Country-Level Shares, 2025
- 14.2 Country Market Size Comparison, 2025
- 14.3 Country Market Forecasts, 2025-2035
- 14.4 Subregional Industrial and Demand Clusters
- 14.5 Intra-Regional Pricing and Cost Differences
- 14.6 Cross-Border Trade and Supply Networks
- 14.7 Regional Supply and Demand Balances
- 14.8 Country Opportunity Comparison and Prioritization
Note: Every listed country is covered on the structure shown under the first country.
Chapter 15 Asia-Pacific Precast Concrete Technology, Innovation and Sustainability Outlook
- 15.1 Technology Landscape and Maturity
- 15.2 Product, Process and Service Innovation
- 15.3 AI, Automation and Digital Tools in the Industry
- 15.4 Technology Adoption and Performance Benchmarking
- 15.5 Innovation Pipeline and R&D Investment
- 15.6 Patent and Intellectual Property Trends
- 15.7 Energy Efficiency and Resource Management
- 15.8 Sustainability, Recycling and Circularity
- 15.9 Technology Roadmap, 2025-2035
- 15.10 Risks of Obsolescence and Technology Substitution
Chapter 16 Asia-Pacific Precast Concrete Market Key Strategic Imperatives
- 16.1 Growth and Market Entry Priorities
- 16.2 High-Return Products and Segments
- 16.3 Pricing, Profitability and Cost Optimization
- 16.4 Technology Investment and Product Differentiation
- 16.5 Supply Chain Localization and Resilience
- 16.6 Distribution and Customer Acquisition
- 16.7 Partnership, Acquisition and Capacity Strategy
- 16.8 Regional Expansion Priorities
- 16.9 Short-, Medium- and Long-Term Actions
Chapter 17 Competition Outlook
- 17.1 Industry Competition Characteristics
- 17.2 Market Structure and Concentration
- 17.3 Market Share and Competitive Positioning, 2025
- 17.4 Company-Wise Revenue and Product Benchmarking
- 17.5 Production and Service Capacity Benchmarking
- 17.6 Technology, Pricing and Differentiation
- 17.7 Regional Footprint and Distribution Strength
- 17.8 Mergers, Acquisitions and Strategic Alliances
- 17.9 New Entrants and Competitive Threats
- 17.10 Porter's Five Forces and Industry Attractiveness
- 17.11 Competitive Outlook, 2025-2035
Chapter 18 Company Profiles
- 18.1 Company Coverage and Selection Criteria
- 18.2 Changsha Broad Homes Industrial Group
- 18.2.1 Business Description
- 18.2.2 Company Ownership and Geographic Presence
- 18.2.3 Product and Service Portfolio
- 18.2.4 Manufacturing and Operating Footprint
- 18.2.5 Production Capacity and Expansion Plans
- 18.2.6 Financial Performance and Investment
- 18.2.7 Market Share and Competitive Position
- 18.2.8 Technology and Innovation Capabilities
- 18.2.9 Strategic Alliances or Partnerships
- 18.2.10 Recent Developments
- 18.2.11 Growth Strategy and Outlook
- 18.3 Larsen & Toubro
- 18.4 Showa Concrete Industry
- 18.5 Nippon Concrete Industries
- 18.6 WIKA Beton
- 18.7 Waskita Beton Precast
- 18.8 Gamuda
- 18.9 IJM Corporation
- 18.10 Humes
- 18.11 Sunway Construction Group
- 18.12 Other Relevant Market Participants
Note: Every listed company is profiled on the structure shown under the first company. The company list is preliminary and may change based on research findings, market developments, data availability and client requirements.
Chapter 19 Disclaimer
- 19.1 Research and Forecast Disclaimer
- 19.2 Data Source and Estimation Limitations
Note: The depth of individual sections depends on data availability for this market. Volume, capacity, trade and other unit-based metrics are included where applicable.

