
Housing, transport and grid works carry Australian building
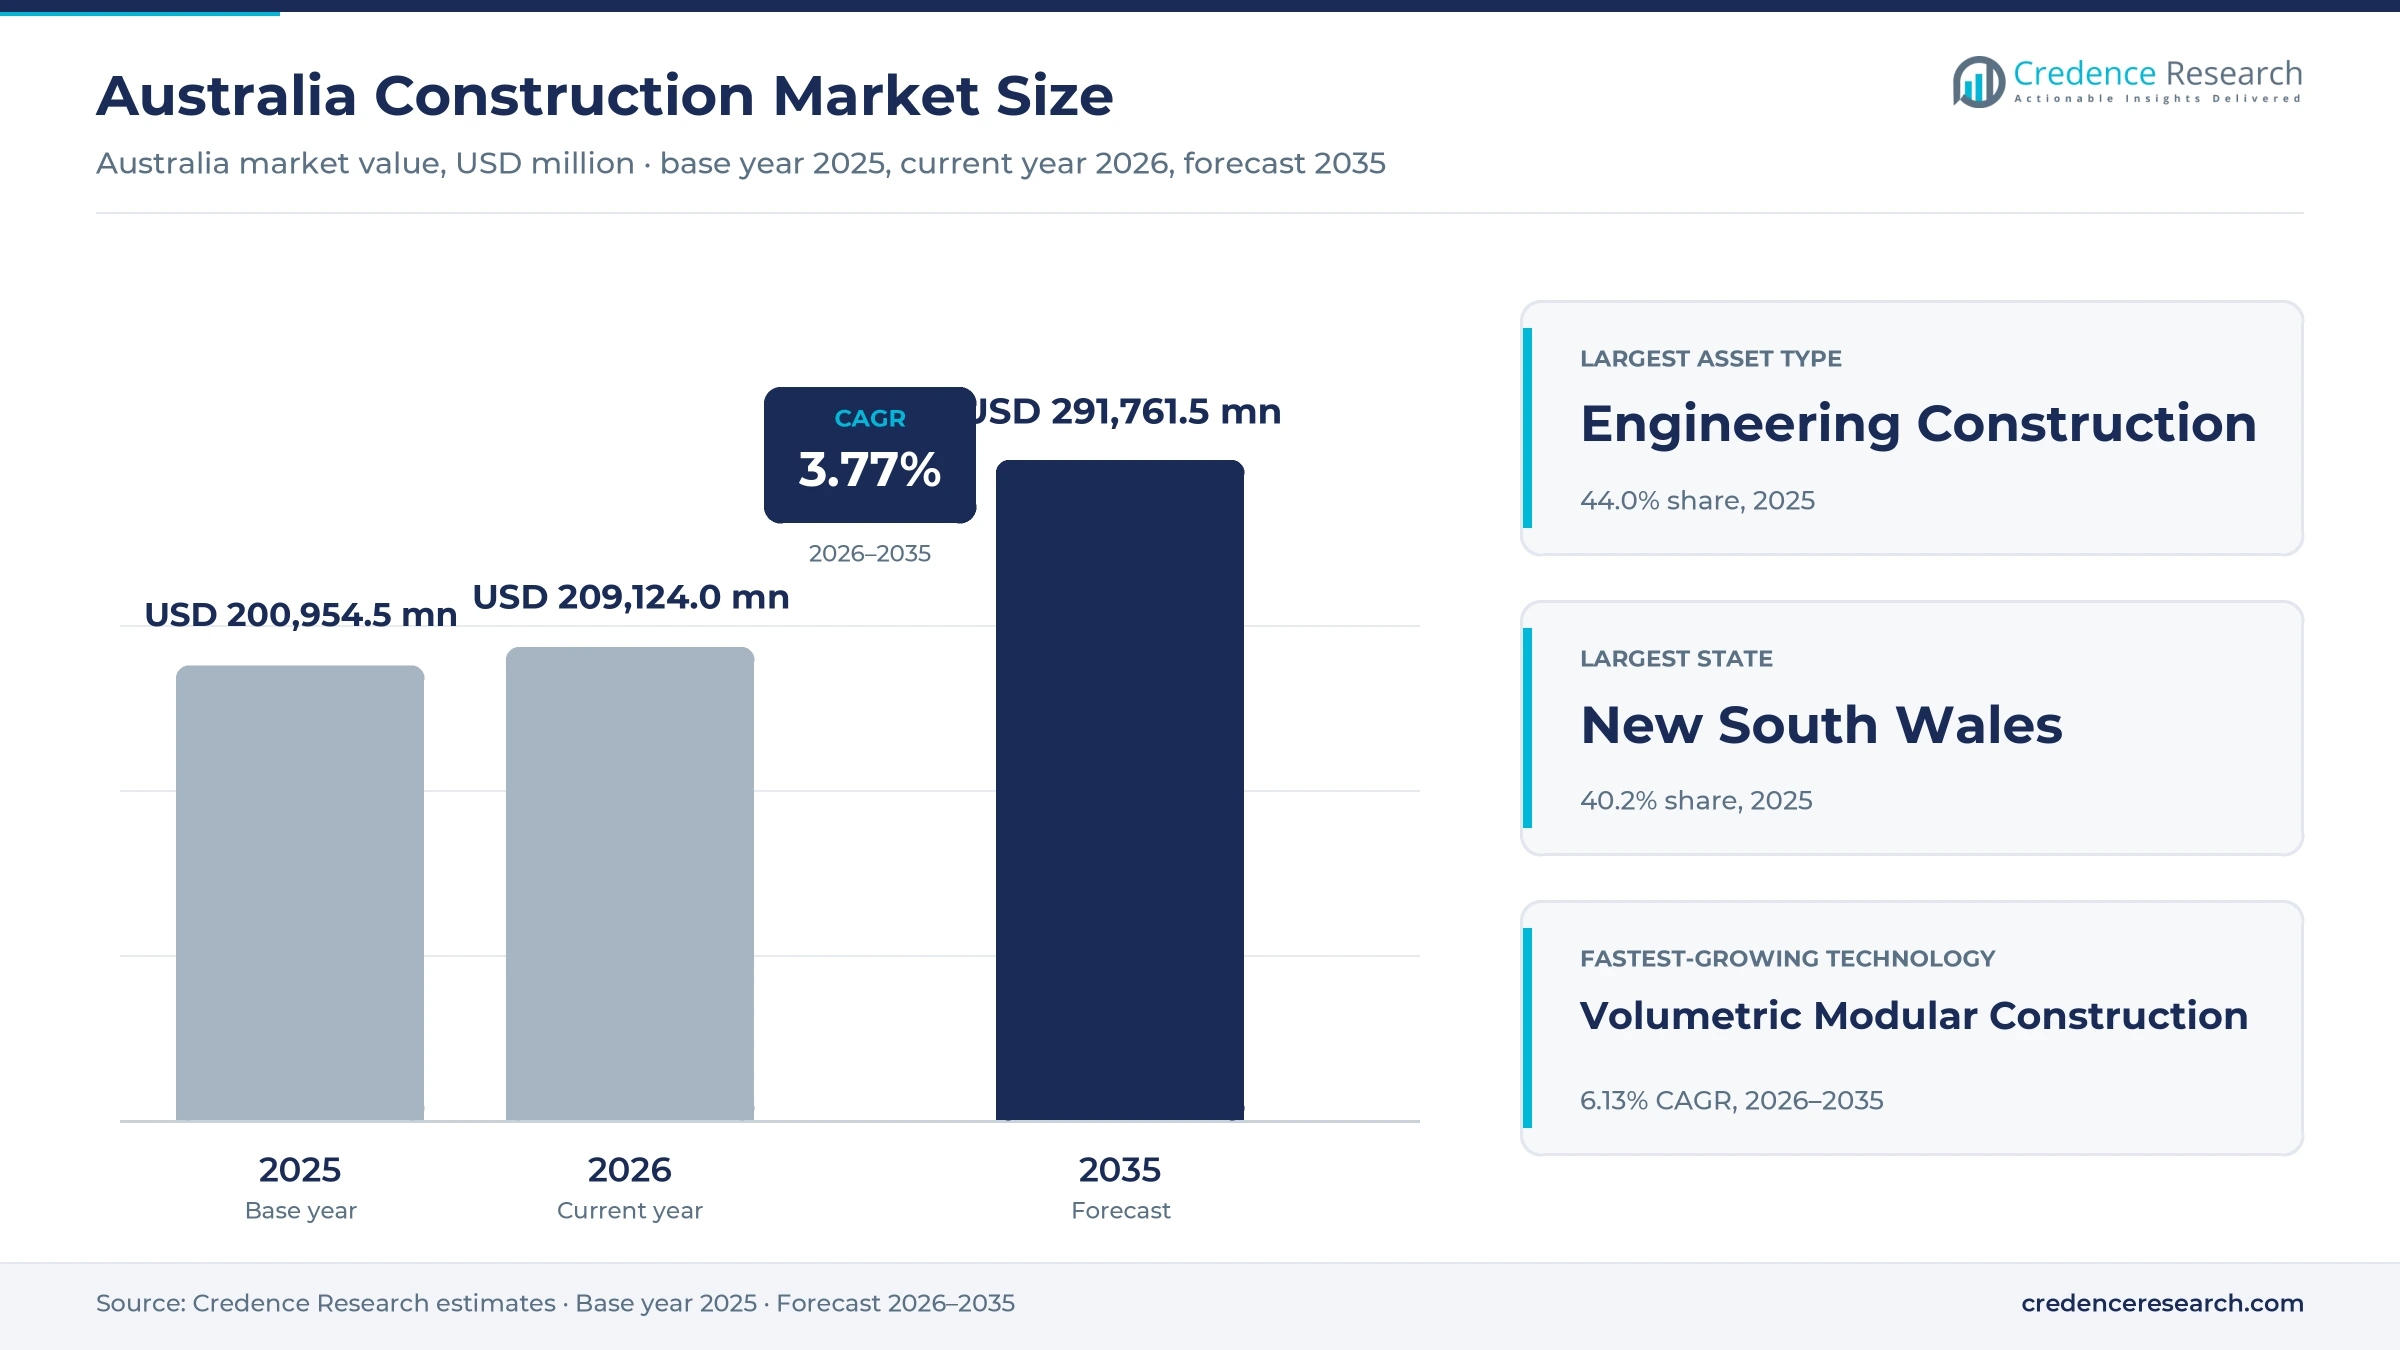
The Australia construction market was valued at USD 200.95 billion in 2025 and is projected to increase from USD 209.12 billion in 2026 to USD 291.76 billion by 2035, registering a CAGR of 3.77% during 2026–2035. Demand comes from the national push to build 1.2 million homes over five years from mid-2024, from rail and road megaprojects in the eastern states, and from transmission and renewable energy works that connect new generation. New South Wales held the largest share, 40.2% in 2025, because Sydney carries the heaviest rail, road and housing workload in the country. Queensland is the fastest-growing state at 4.31% a year, as Brisbane 2032 venues and regional road programs move into construction. In turn, building ministers agreed in October 2026 to create nationally consistent approval pathways for modular and prefabricated construction, which could shorten delivery times for homes and public buildings.
What building and civil work does the national estimate count?
The estimate counts the value of construction work done in Australia on new projects, alterations and additions, and rehabilitation and capital repairs. It spans residential buildings, non-residential buildings and engineering construction such as roads, rail, water, power and telecommunications networks, whether commissioned by households, businesses or governments.
The estimate excludes land costs, stand-alone machinery purchases, routine maintenance below capital repair scale, and dedicated mine site and oil and gas production works, which are tracked as resources investment. The value chain runs from owners and developers through head contractors and trade subcontractors to material suppliers, precast and modular factories, and plant hire companies.
Australia Construction Market Insights
- The Australia construction market was valued at USD 200.95 billion in 2025 and is projected to reach USD 291.76 billion by 2035, registering a CAGR of 3.77% during 2026–2035.
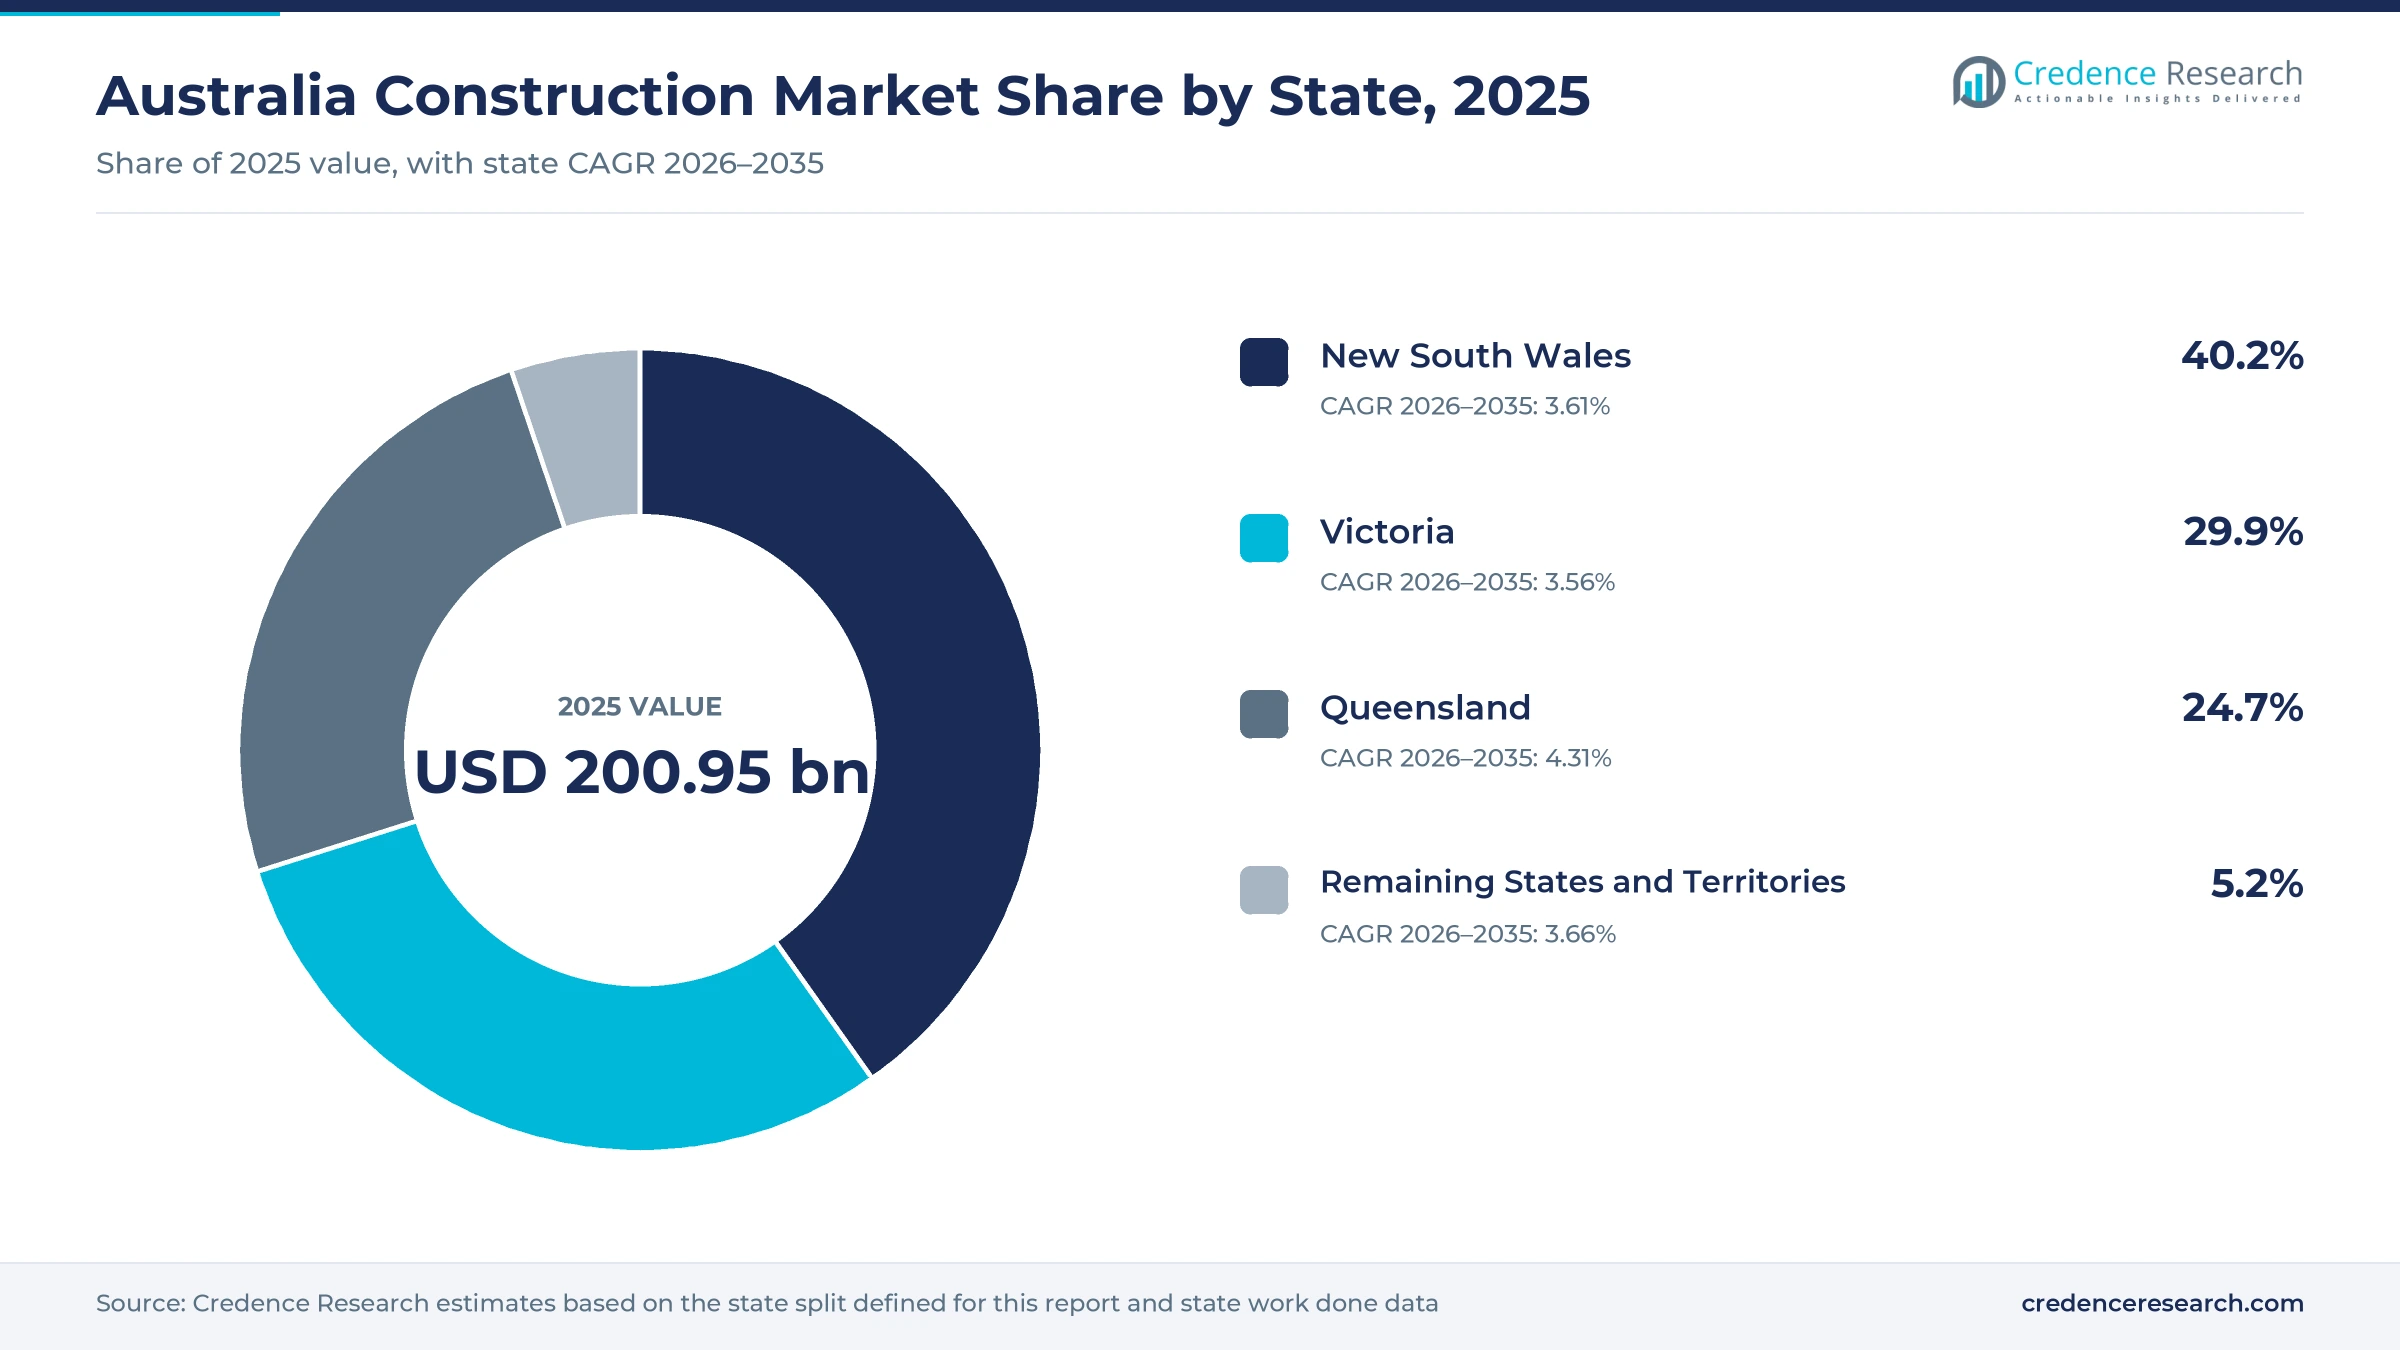
- New South Wales held a 40.2% share of 2025 value, because Sydney rail, road and housing programs form the largest state workload in the country.
- Engineering construction led asset types with a 44.0% share of 2025 value, because transport, water and energy networks carry the largest contract sizes.
- National Cabinet agreed on Aug. 16, 2023, to build 1.2 million new well-located homes over five years from July 1, 2024, which anchors residential demand to 2029.
- Volumetric modular construction grows fastest among technologies at 6.13% a year during 2026–2035, as ministers back national approval pathways for factory-built homes.
Engineering works lead while homes grow fastest
Why does engineering work hold the largest share?
Based on asset type, the market is categorized into Residential Building, Non-Residential Building and Engineering Construction. Engineering Construction led with a 44.0% share of 2025 value, because rail, road and energy contracts are the largest single packages. Residential Building grows fastest at 4.30% a year, while hospitals, schools and commercial building work add steady non-residential demand.
How much spending goes to new projects?
Based on project type, the market is categorized into New Construction, Alterations and Additions, and Rehabilitation and Capital Repairs. New Construction led with a 70.0% share of 2025 value, because the housing target and transport pipeline favor new assets. Rehabilitation and Capital Repairs grows fastest at 4.11% a year, as aging roads, water assets and public buildings need renewal.
Which contracting models do owners prefer?
Based on contracting model, the market is categorized into Construct Only, Design and Construct, Collaborative Delivery and Managing Contractor. Construct Only led with a 38.0% share of 2025 value, because most homes and smaller civil jobs are let on fixed designs. Collaborative Delivery grows fastest at 4.75% a year, as owners bring builders in early on complex projects.
How quickly are factory-built methods gaining share?
Based on technology, the market is categorized into Site-Based Construction, Panelised and Precast Construction, and Volumetric Modular Construction. Site-Based Construction led with 88.0% of 2025 value, because trades still build most homes and civil works in place. Volumetric Modular Construction grows fastest at 6.13% a year, as national certification makes approvals easier for factory-built homes.
| Segment Group | Leading Sub-segment | Share, 2025 | Fastest-growing Sub-segment | CAGR, 2026–2035 |
|---|---|---|---|---|
| By Asset Type | Engineering Construction | 44.0% | Residential Building | 4.30% |
| By Project Type | New Construction | 70.0% | Rehabilitation and Capital Repairs | 4.11% |
| By Contracting Model | Construct Only | 38.0% | Collaborative Delivery | 4.75% |
| By Technology | Site-Based Construction | 88.0% | Volumetric Modular Construction | 6.13% |
Request a Free Sample
Fill in your details and we'll send you a free sample report.
- Sample data tables & charts
- Research methodology
Housing targets, megaprojects and grid works lift demand
What keeps homebuilding demand firm through 2029?
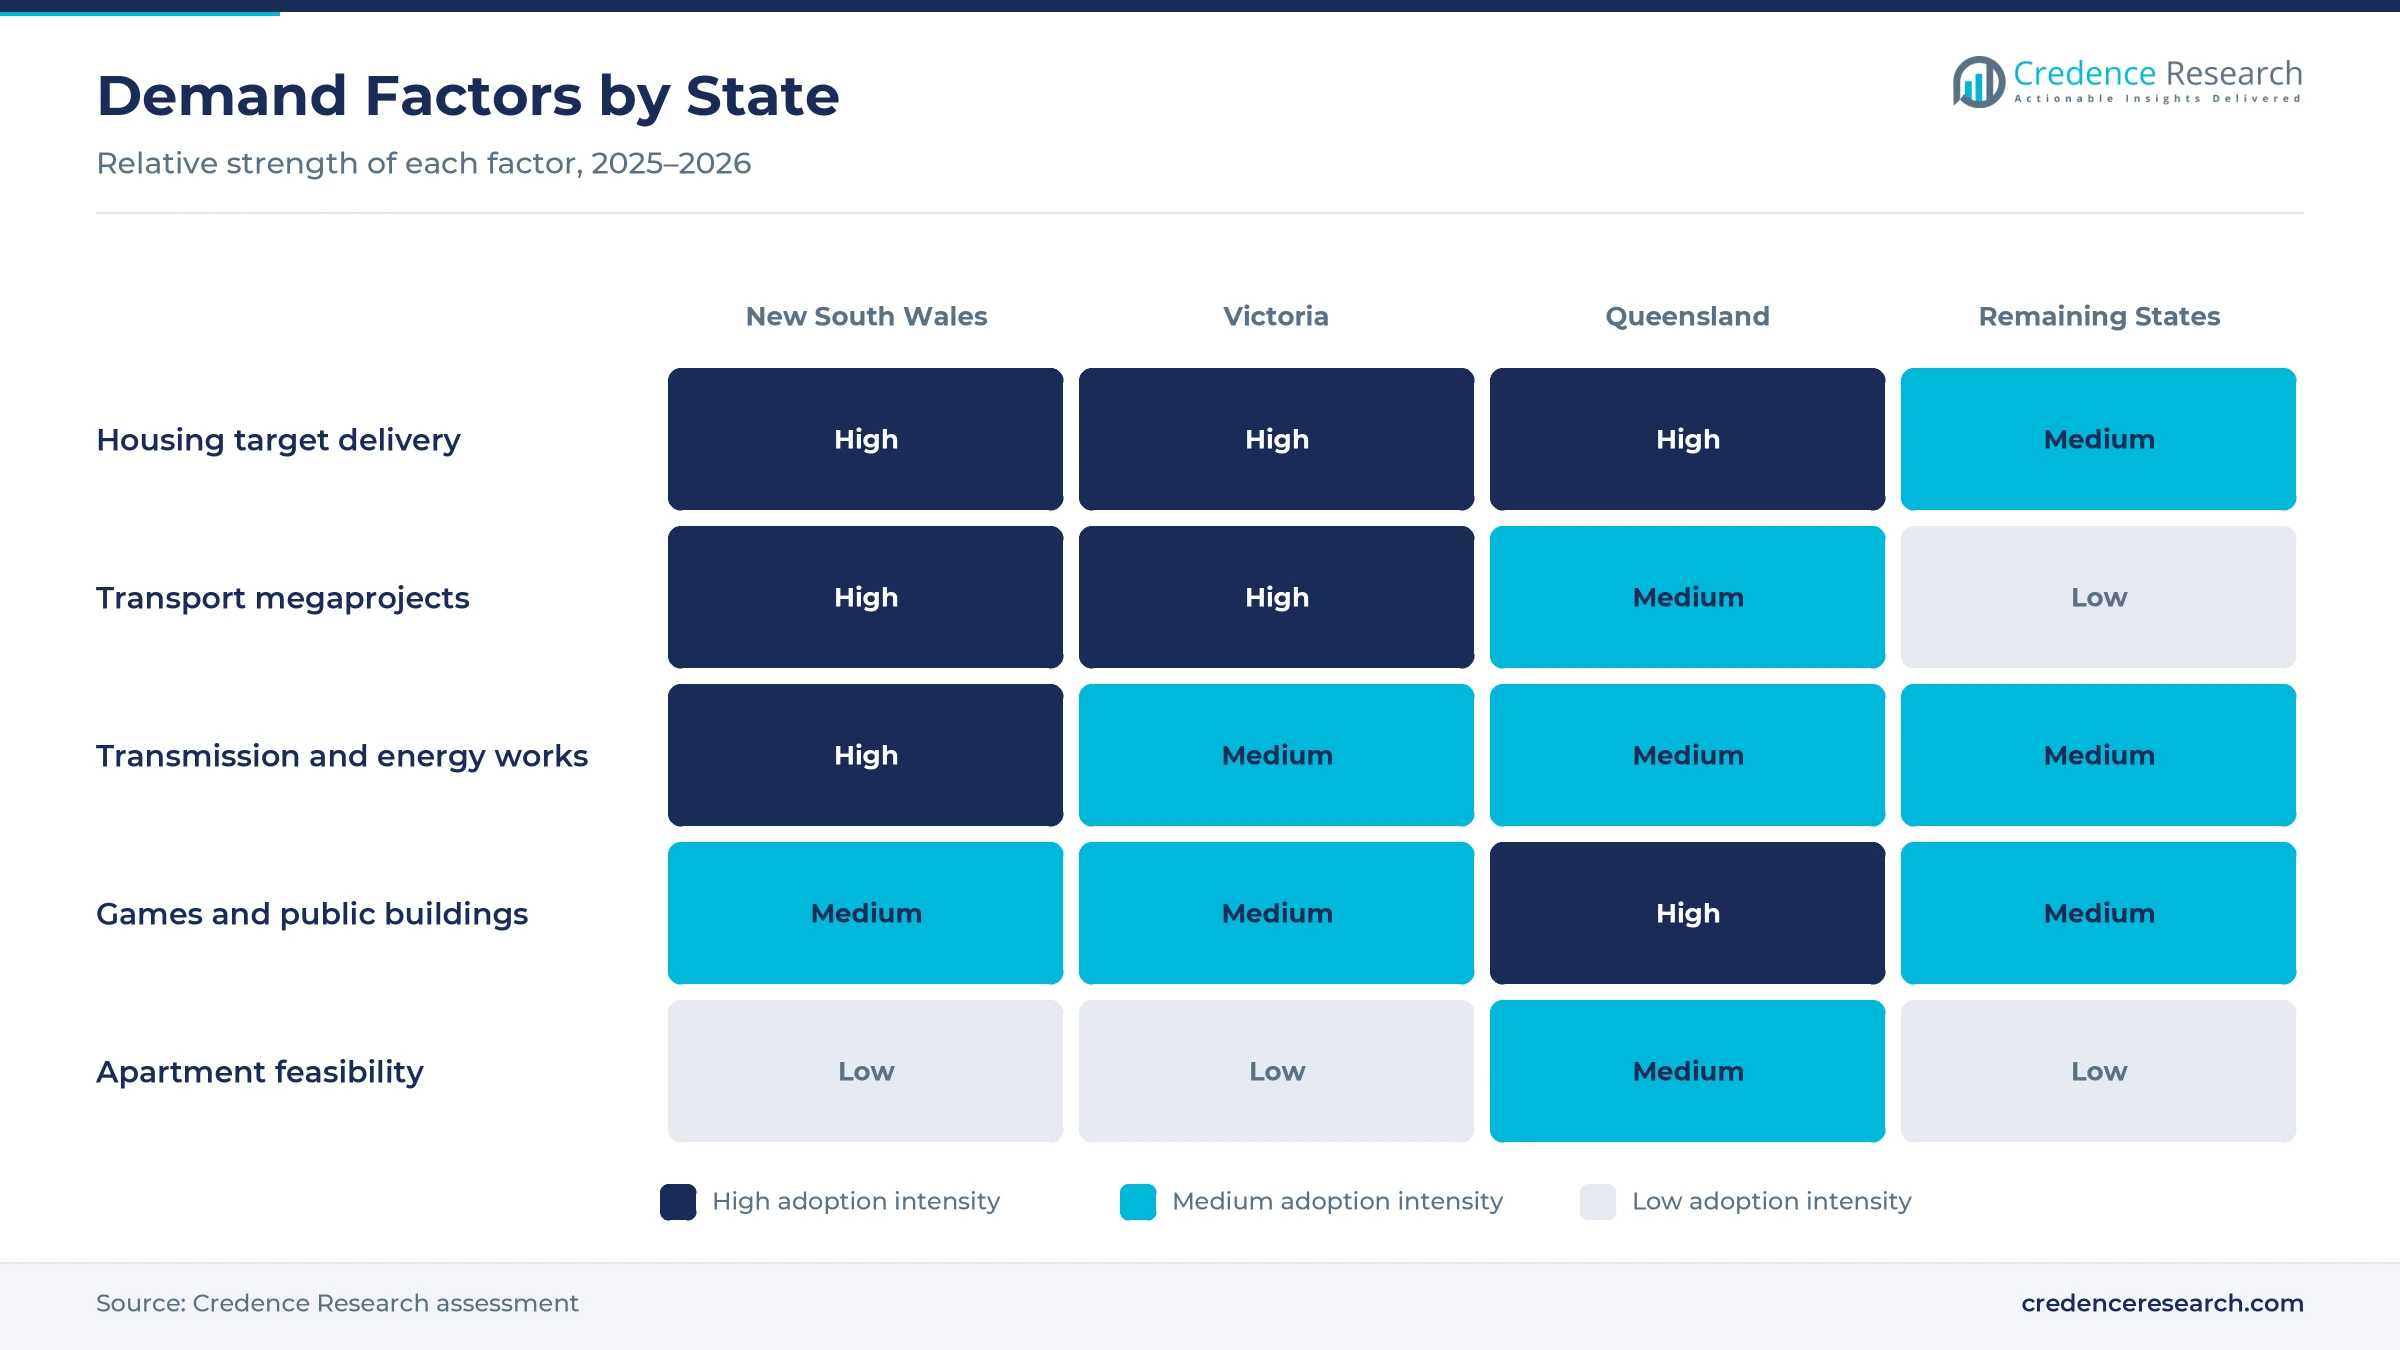
Housing shortages give residential work the strongest pull on new spending, because governments have tied funding to a fixed national delivery target. National Cabinet agreed on Aug. 16, 2023, to build 1.2 million new well-located homes over five years from July 1, 2024, under the National Housing Accord. Building ministers noted in their October 2026 communique that a record 248,733 homes were under construction and that completions rose 15.9% over the year to the June quarter. Population growth stayed high at about 2.0% in 2024 and 1.5% in 2025, according to the World Bank, which keeps household formation strong. As a result, Residential Building grows fastest among asset types at 4.30% a year.
Which public pipeline figures underpin civil demand?
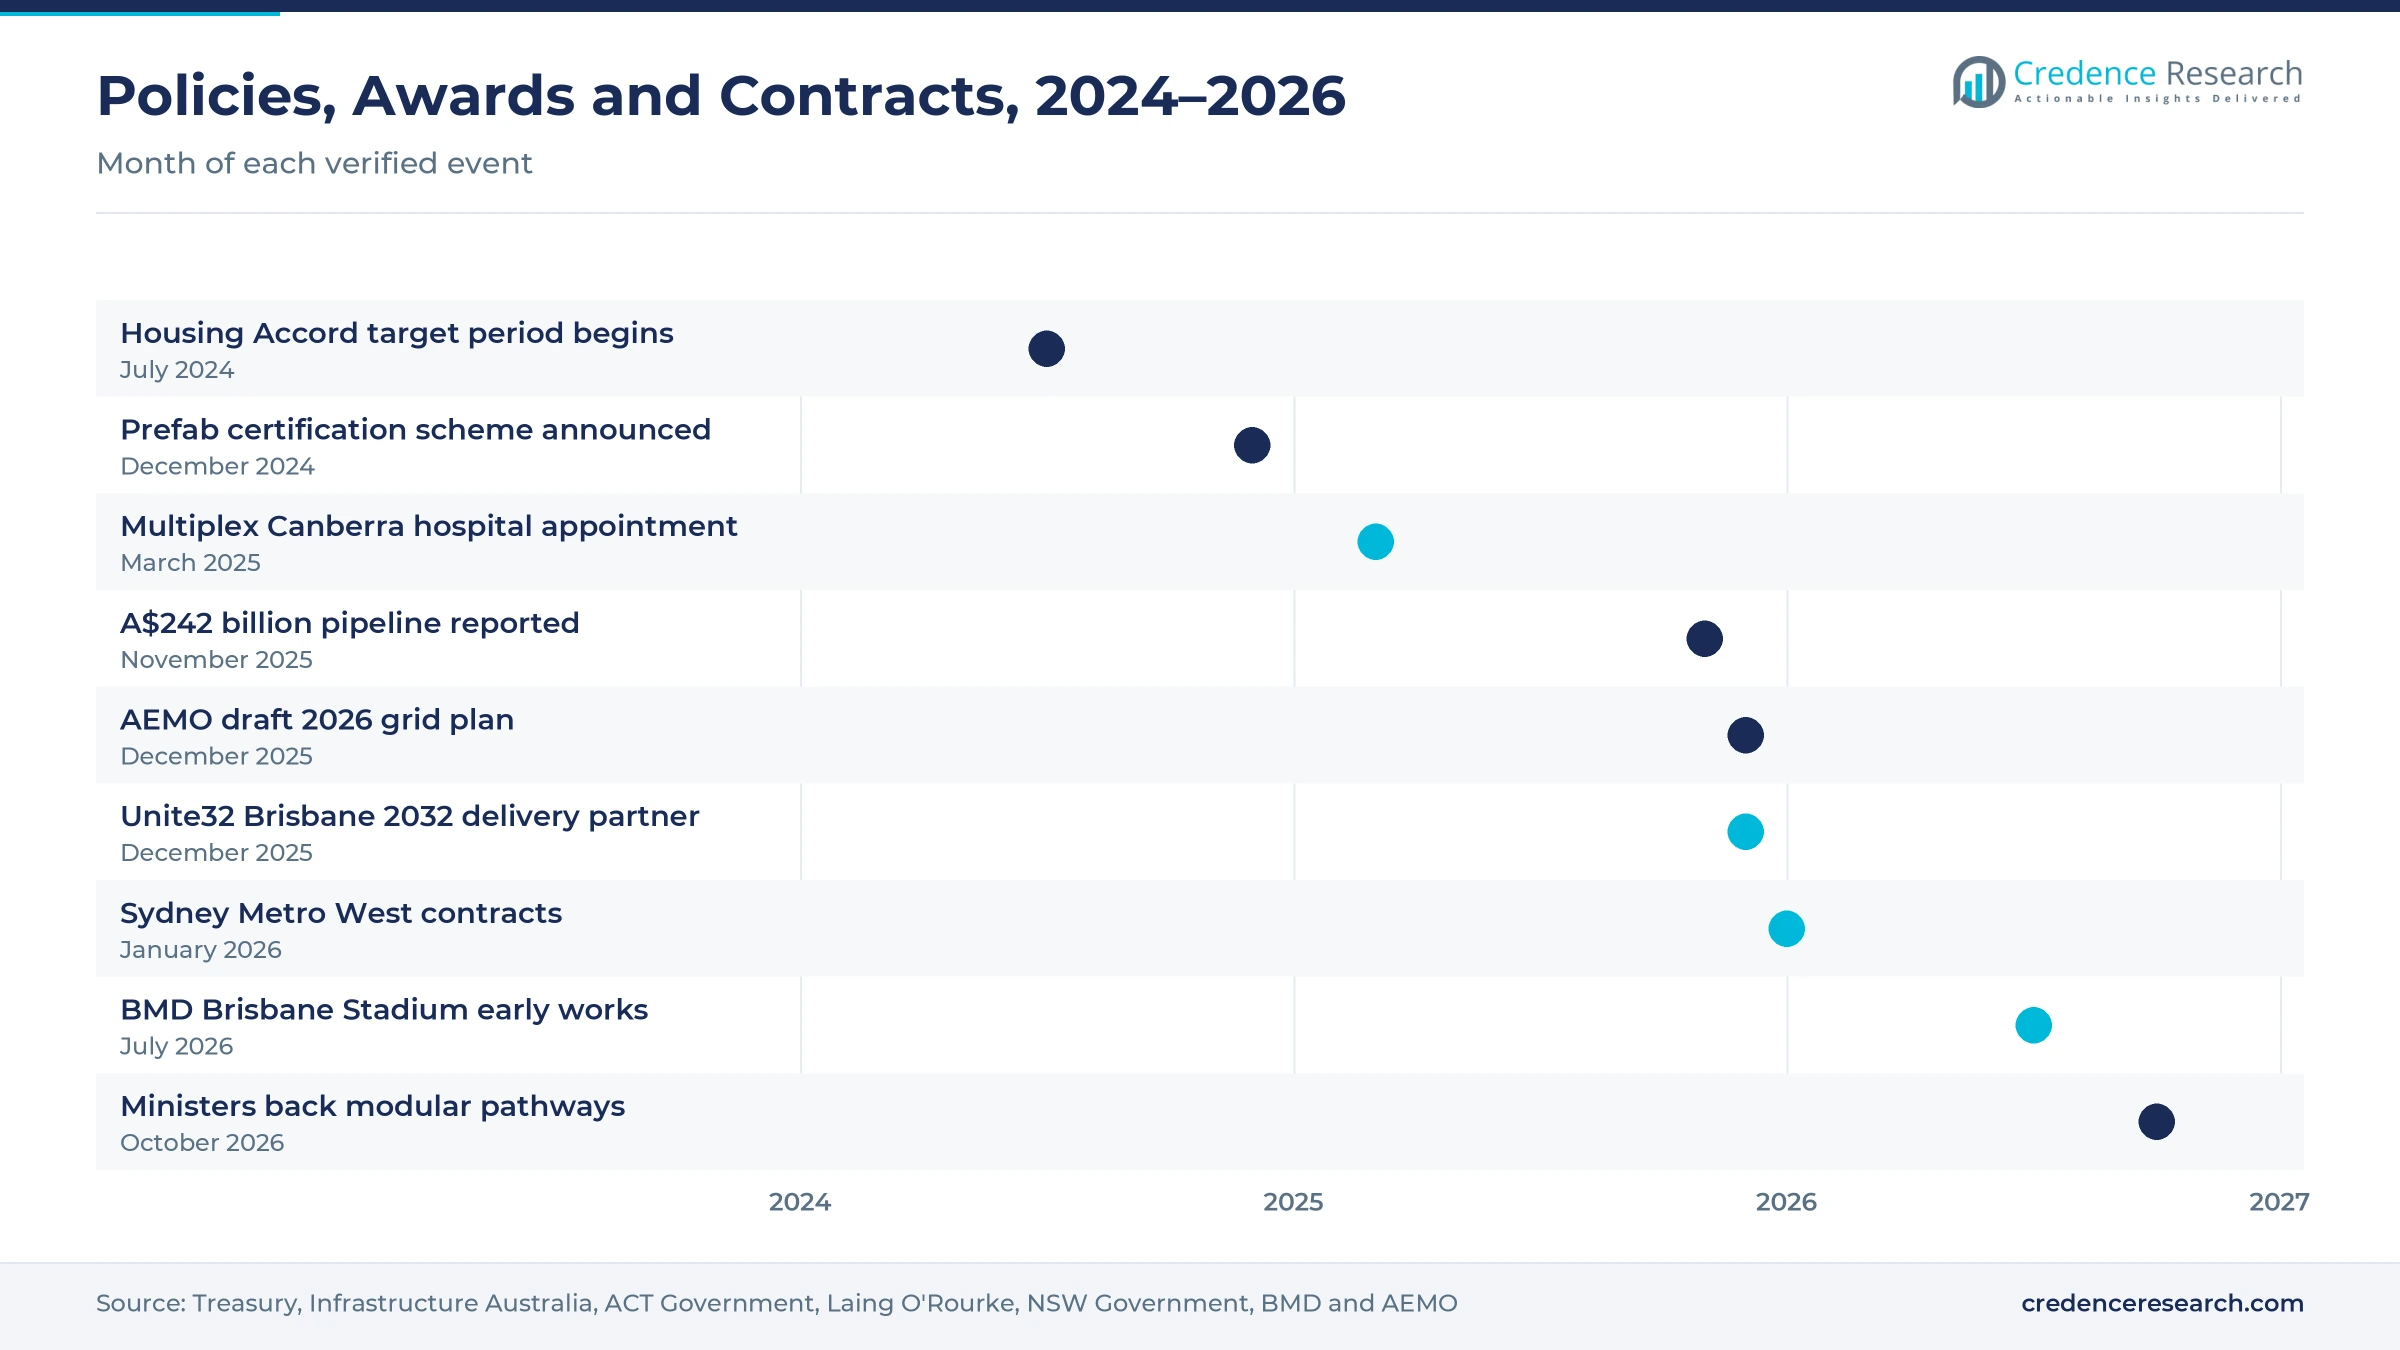
Transport megaprojects keep engineering crews busy even when private building slows, because governments award large multi-year packages well ahead of opening dates. Infrastructure Australia put the five-year Major Public Infrastructure Pipeline at A$242 billion in November 2025, with transport projects worth A$129 billion, more than half of the total. The Australian Government is investing more than A$120 billion over 10 years through its Infrastructure Investment Program, including A$17.3 billion committed to New South Wales. In January 2026, the NSW Government awarded four Sydney Metro West contracts worth A$11.5 billion, including a A$3.2 billion linewide package to John Holland. That pipeline helps Engineering Construction hold 44.0% of 2025 value across the country.
How do energy and utility works add new capital spending?
Energy transition works are lifting utilities construction quickly, because new wind and solar farms must connect through long transmission corridors. Infrastructure Australia projected in November 2025 that public utilities investment will more than double to A$36 billion over five years, while renewable energy ambitions reach about A$163 billion. The Australian Energy Market Operator said in December 2025 that about 6,000 km of new transmission lines would be needed, on top of a network of roughly 44,000 km. Transgrid awarded A$2.9 billion of contracts for the 385 km, 500 kV HumeLink project to joint ventures of ACCIONA with GenusPlus and of UGL with CPB Contractors. Builders of high-voltage transmission lines therefore compete with road and rail contractors for the same civil crews.
How do Brisbane 2032 and public buildings add demand?
Hospitals, stadiums and other public buildings add a steady stream of non-residential work that is less exposed to interest rates. Infrastructure Australia expects public building projects, including social housing, to rise by A$6 billion to A$77 billion over five years. The Games Independent Infrastructure and Coordination Authority appointed Unite32, a joint venture of Laing O'Rourke and AECOM, in December 2025 as delivery partner for the A$7.1 billion Brisbane 2032 venues program. That program covers 17 new and upgraded venues and two monitored venues from the Gold Coast to Cairns. In July 2026, BMD won the design and construct contract for Brisbane Stadium early works at Victoria Park. These Games and stadium contracts help make Queensland the fastest-growing state in the national estimate.
Prefabrication and early contractor deals gain ground
Why is factory-built housing on the rise?
Factory-made building parts are moving from niche use toward national policy, because governments want faster housing delivery without adding more site labor. The Australian Government said in December 2024 that it would fund the Australian Building Codes Board to develop a voluntary national certification scheme for prefabricated housing, with first accreditations expected in the first half of 2026, according to ArchitectureAU. Building ministers then agreed on Oct. 16, 2026, to create nationally consistent pathways for modular and prefabricated construction. A roundtable of investors, modular manufacturers, unions and builders also agreed to strengthen collaboration on investment in these methods. In turn, prefabricated homes help Volumetric Modular Construction grow at 6.13% a year.
How is early contractor involvement reshaping big projects?
Public owners increasingly bring builders in early on their largest projects, so design, price and risk are settled together before construction starts. The ACT Government appointed Multiplex in March 2025 under a Very Early Contractor Involvement contract for a new northside hospital in Canberra costing more than A$1 billion. Unite32 works as delivery partner across the Brisbane 2032 venues program rather than as a single head contractor for each venue. Sydney Metro West also appointed Lendlease, Mirvac and Coombes Property Group as partners for the A$1.5 billion Hunter Street station and precinct. As a result, Collaborative Delivery grows fastest among contracting models at 4.75% a year.
Can low-carbon delivery give contractors an edge?
Contractors that can document lower site emissions gain an opening, as owners electrify major tunnel and rail works. The A$3.6 billion Suburban Rail Loop East Tunnels South contract, awarded in December 2023 to CPB Contractors, Ghella and ACCIONA, uses four tunnel boring machines powered by renewable electricity. Tunnelling on those 16 km of twin tunnels between Cheltenham and Glen Waverley is set to start in 2026, according to Victoria's Big Build. Infrastructure Australia also counts about A$163 billion of renewable energy ambitions over five years, which rewards builders with grid and site power skills. In turn, contractors that run battery and hybrid site machinery can present lower emissions in their bids.
Is detached housing an opening for volume builders?
House approvals are recovering faster than apartment approvals, which gives the largest home building groups room to lift detached and townhouse output. The Housing Industry Association reported in September 2026 that its 100 largest builders started 70,553 homes in 2025/26, up 9.4% and about 35% of national commencements. Sumitomo Forestry Australia, which now includes Metricon, led with 8,038 starts, while Hutchies ranked eighth with 1,907 multi-unit starts. The Australian Bureau of Statistics reported that private house approvals rose 3.7% in August 2026, while other private dwellings fell 21.2%. New Construction therefore remains the largest project type with 70.0% of 2025 value.
Labor gaps, insolvencies and weak apartments weigh
How do worker shortages limit delivery?
Skills shortages limit how much work the industry can deliver at once, because housing, transport and energy projects draw on the same trades. Infrastructure Australia reported in November 2025 that the industry is short of 141,000 workers. As a result, labor costs rise and project schedules stretch when several megaprojects peak together. Contractors respond with apprenticeships, offsite manufacturing and longer forward planning with public owners.
Why do builder insolvencies remain a risk?
Builder failures remain a serious risk for owners and subcontractors, because thin margins leave little room for cost overruns. ASIC data reported by Accountants Daily show that 3,472 construction companies entered external administration or had a controller appointed in 2025/26, out of 14,152 company insolvencies. In turn, unfinished homes and unpaid trades damage confidence in the supply chain. Owners respond with closer financial checks, project bank accounts and shared-risk contracts.
How does a slowdown in engineering work affect contractors?
Engineering activity can swing sharply between quarters, which leaves civil contractors with uneven workloads. Engineering work done fell 6.0% in the June quarter of 2026 and was 5.1% lower than a year earlier, according to the Australian Bureau of Statistics. Total construction work done fell 2.1% to about A$82.5 billion in that quarter, even as building work rose 1.3%. As a result, contractors must shift crews between sectors and states to keep plant and staff busy.
Why do weak apartment approvals slow housing supply?
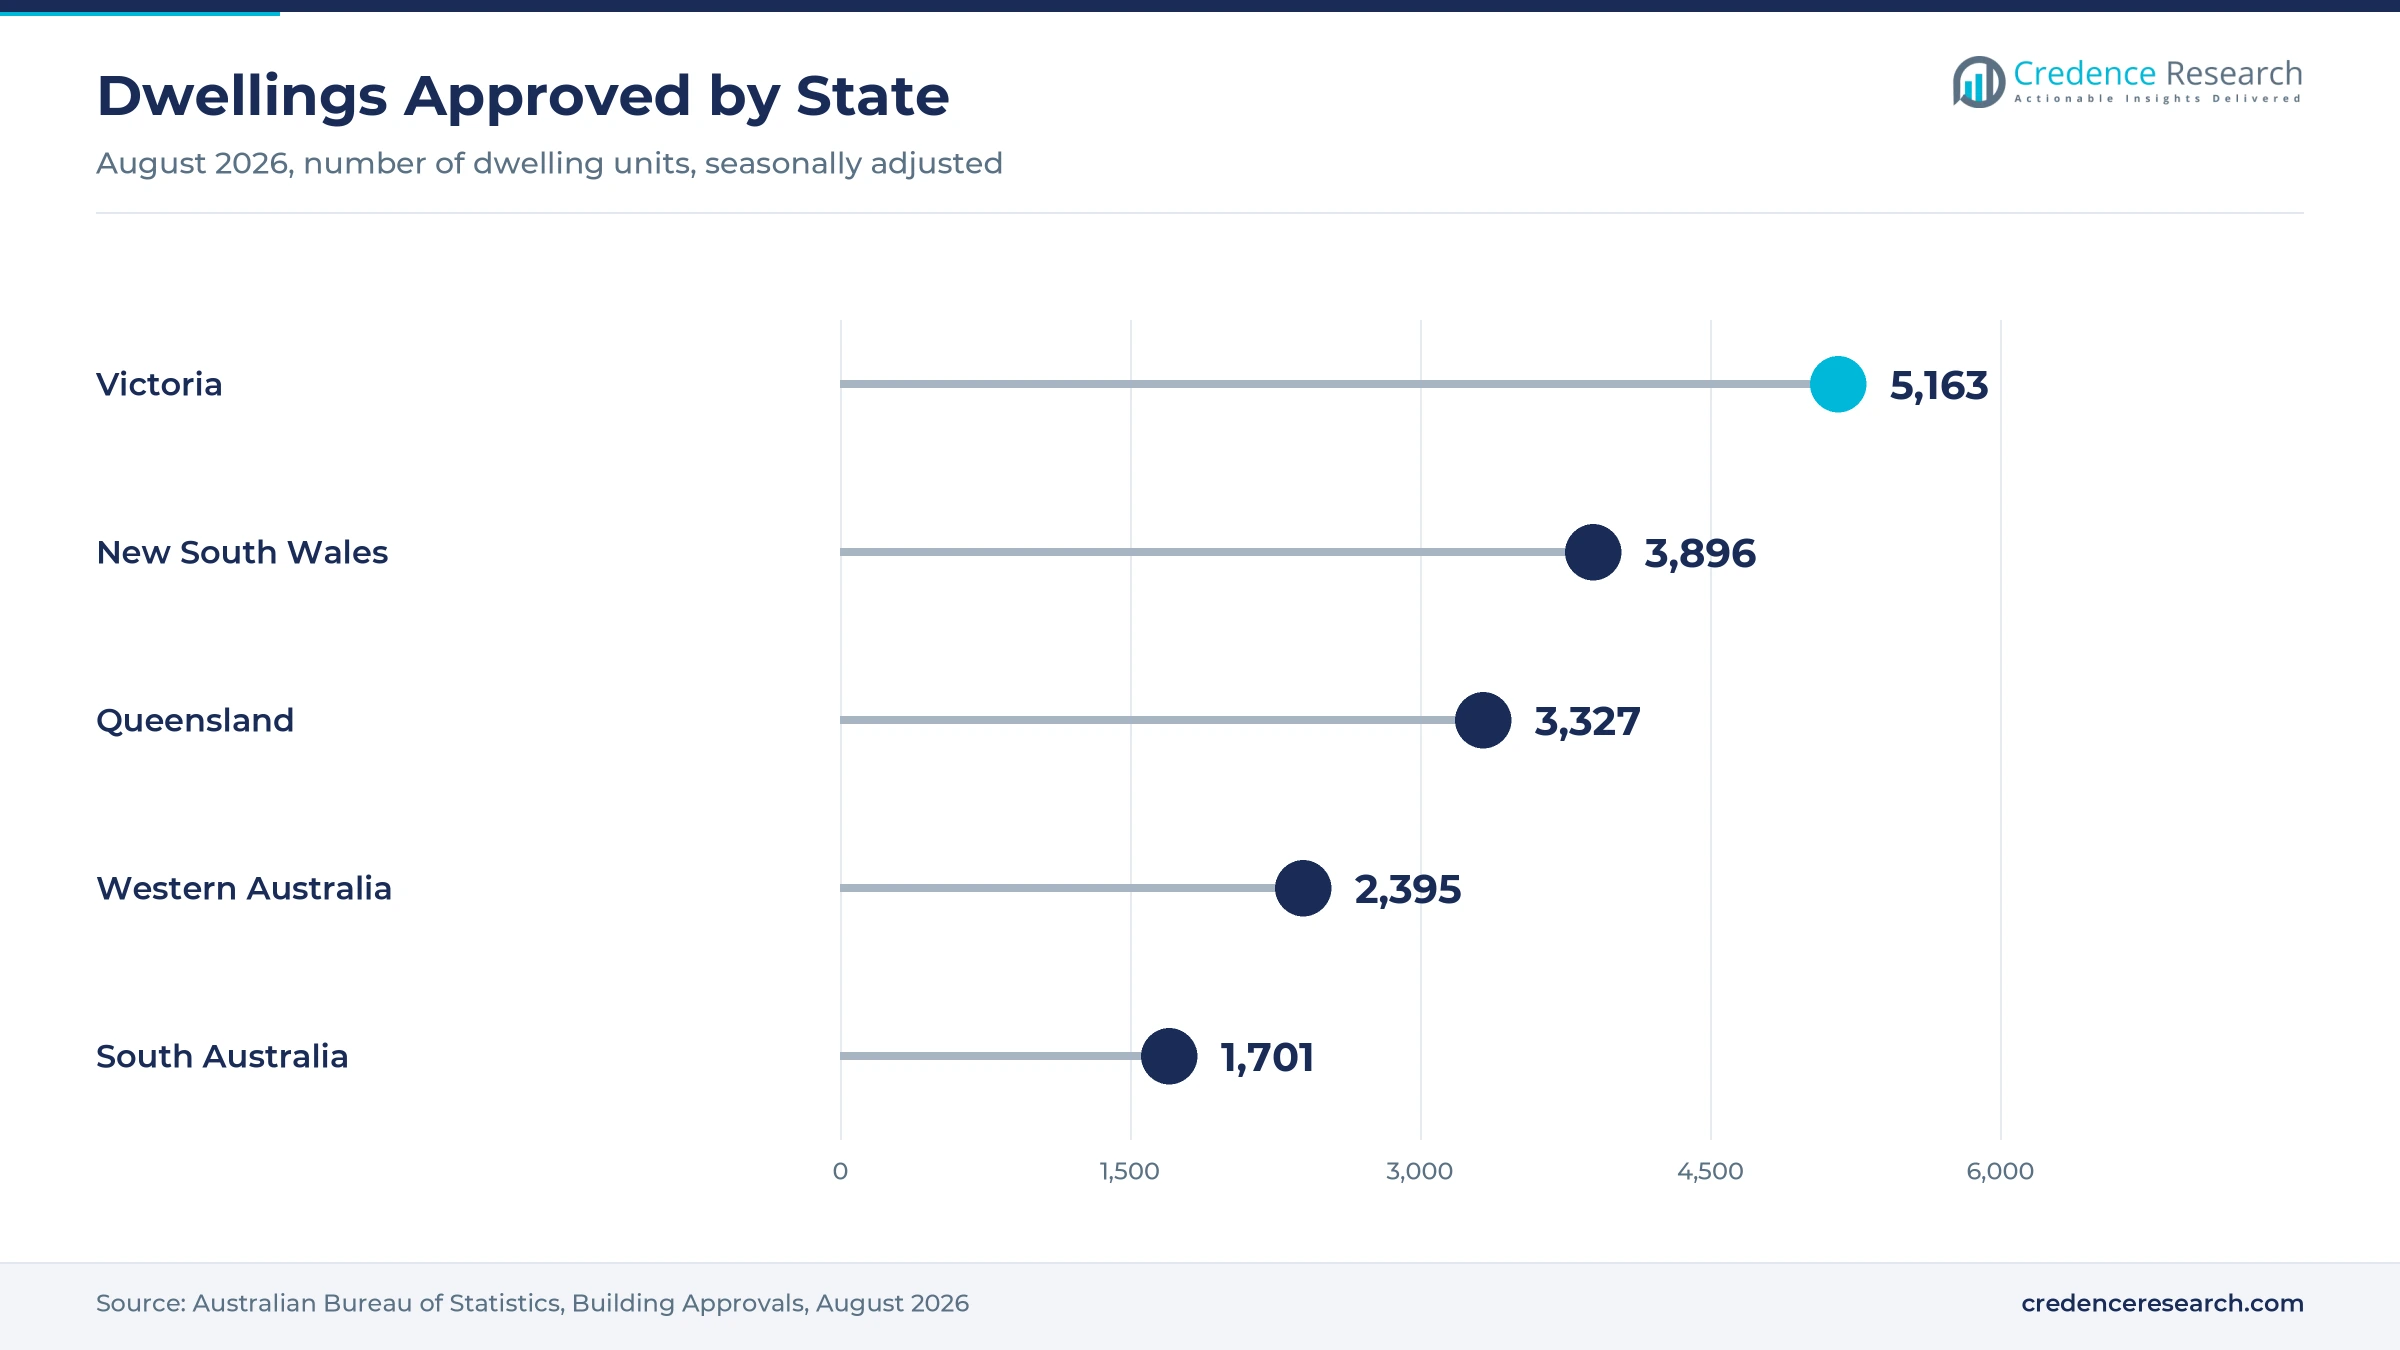
Apartment projects remain hard to start, because high building costs and presale requirements weaken feasibility. The Australian Bureau of Statistics reported that approvals for private dwellings other than houses fell 21.2% to 5,674 in August 2026, while total approvals fell 6.1% to 16,953. In turn, the housing target relies heavily on detached homes in outer suburbs. Governments respond with enabling infrastructure funds and planning reforms for higher density.
New South Wales leads as Queensland grows fastest
| State | Value, 2025 (USD billion) | Share, 2025 | CAGR, 2026–2035 |
|---|---|---|---|
| New South Wales | 80.78 | 40.2% | 3.61% |
| Victoria | 60.09 | 29.9% | 3.56% |
| Queensland | 49.64 | 24.7% | 4.31% |
| Remaining States and Territories | 10.45 | 5.2% | 3.66% |
How do Sydney rail and housing keep NSW ahead?
New South Wales held 40.2% of 2025 value and grows at 3.61% a year, as Sydney rail and housing programs keep crews busy. Construction work done in New South Wales rose 7.7% over the year to the June quarter of 2026, according to Australian Bureau of Statistics data. The Australian Government has committed A$17.3 billion to the state through its Infrastructure Investment Program. Sydney Metro West contracts worth A$11.5 billion were awarded in January 2026.
How do rail and housing shape demand in Victoria?
Victoria held a 29.9% share of 2025 value and grows at 3.56% a year, as the Suburban Rail Loop and outer suburban housing drive work. Construction work done in Victoria rose 6.7% over the year to the June quarter of 2026, according to Australian Bureau of Statistics data. Victoria also approved 5,163 dwellings in August 2026, the most of any state. Tunnelling on Suburban Rail Loop East is set to start in 2026.
Why does Queensland grow fastest to 2035?
Queensland held a 24.7% share of 2025 value and grows fastest at 4.31% a year, as Games venues and highway programs move into construction. Construction work done in Queensland rose 7.9% over the year to the June quarter of 2026, the fastest gain among the three largest states. Infrastructure Australia expects public investment to rise by at least 200% in ten regions across New South Wales, Tasmania and Queensland. A Fulton Hogan joint venture is also delivering the Coomera Connector Stage 1 Central section.
How do the remaining states and territories contribute?
Remaining States and Territories held a 5.2% share of 2025 value and grow at 3.66% a year. Their share follows the state split defined for this report, which sits below their weight in official work done statistics partly because dedicated mine site and oil and gas production works are excluded. South Australian work done rose 11.5% over the year to the June quarter of 2026, while Australian Capital Territory work fell 15.7%. Multiplex is helping plan a new Canberra hospital costing more than A$1 billion.
Policies, awards and Games contracts, 2024–2026
| Development | Status and market relevance |
|---|---|
| In December 2024, the Australian Government announced funding for the Australian Building Codes Board to develop a voluntary national certification scheme for prefabricated housing. | Eases approvals for panelised and modular builders across states |
| In March 2025, the ACT Government appointed Multiplex under a Very Early Contractor Involvement contract for a new northside hospital costing more than A$1 billion. | Shows public owners moving to collaborative delivery on hospitals |
| In December 2025, the Games Independent Infrastructure and Coordination Authority appointed Unite32, a Laing O'Rourke and AECOM joint venture, as delivery partner for the A$7.1 billion Brisbane 2032 venues program. | Opens 17 venue projects across Queensland to contractors |
| In January 2026, the NSW Government awarded four Sydney Metro West contracts worth A$11.5 billion, including a A$3.2 billion linewide package to John Holland. | Secures multi-year rail work in the largest state market |
| In October 2026, building ministers agreed to nationally consistent pathways for modular and prefabricated construction and a digital, AI-ready building code. | Supports faster approvals for factory-built homes |
Site methods still dominate as factory building grows
- Site-based construction still delivers most Australian homes, offices and civil works through cast-in-place concrete, framing and on-site trades.
- Panelised and precast construction moves walls, floors and structural elements into factories, which shortens site programs and cuts weather delays.
- Volumetric modular construction ships finished room modules to site and stands to gain from the national voluntary certification scheme for prefabricated housing.
- Digital building code tools are planned as the Australian Building Codes Board prepares to deliver NCC 25 digitally and make it AI-ready.
Need a Custom Version of This Report?
Tailor the scope, geography, or segments to your exact requirements.
- Custom geography or segment scope
- Direct access to our analyst team
Tier one contractors and volume builders split the field
Competition in Australian construction splits between tier one contractors that win large transport, energy and public building packages and volume builders that dominate new homes. CPB Contractors works on Suburban Rail Loop tunnels and HumeLink West, while John Holland holds the A$3.2 billion Sydney Metro West linewide package. ACCIONA partners on Suburban Rail Loop tunnels and HumeLink East, and Laing O'Rourke leads Brisbane 2032 venue delivery with AECOM. Multiplex is planning a new Canberra hospital, Lendlease is a Hunter Street precinct partner, and BMD holds Brisbane Stadium early works. Fulton Hogan delivers road works such as the Coomera Connector. In housing, Metricon now sits within Sumitomo Forestry Australia, the largest home building group, while Hutchinson Builders ranks among the largest multi-unit builders. Rivals compete on balance sheet strength, labor access, safety record and collaborative contracting skills.
Which builders and contractors lead Australian construction?
| Company | Type | Role in the market |
|---|---|---|
| CPB Contractors | Tier one contractor | Suburban Rail Loop East tunnels and HumeLink West joint ventures |
| John Holland | Tier one contractor | A$3.2 billion Sydney Metro West linewide package awarded in January 2026 |
| Multiplex | Tier one builder | Very Early Contractor Involvement partner for a new Canberra northside hospital |
| Lendlease | Builder and developer | Hunter Street station and precinct partner with Mirvac and Coombes Property Group |
| ACCIONA | Tier one contractor | Suburban Rail Loop East tunnels and HumeLink East joint ventures |
| Hutchinson Builders | Private builder | Ranked eighth in the Housing 100 with 1,907 multi-unit starts in 2025/26 |
| Fulton Hogan | Civil contractor | Joint venture delivering Coomera Connector Stage 1 Central in Queensland |
| BMD Group | Civil contractor | Design and construct contract for Brisbane Stadium early works at Victoria Park |
| Laing O'Rourke | Tier one contractor | Unite32 delivery partner for the A$7.1 billion Brisbane 2032 venues program |
| Metricon | Volume home builder | Part of Sumitomo Forestry Australia, which led home starts in 2025/26 |
Credence Research view on Australian building demand
Credence Research's view is that the Australia construction market will grow steadily, because the housing target, transport megaprojects and grid works give owners a long and visible pipeline. Engineering construction remains the largest value pool, while residential building adds the fastest growth as completions catch up with population needs. Collaborative contracts and factory-built methods will gain share as owners try to reduce risk and save site labor. Worker shortages, builder insolvencies and weak apartment feasibility will cap how quickly the pipeline turns into finished work.
How the national building and civil estimate was built
The report uses 2025 as the base year on a calendar basis, and market values come from the Credence Research model. That model combines construction work done statistics, building approvals, the public infrastructure pipeline, government program data and company announcements. Segment splits and state growth rates are Credence Research estimates, while state shares follow the regional split defined for this report. Sources used are government agencies, official statistics, international agency data, industry associations, trade press and company publications, and no interviews or surveys were used.
Homes, rail and transmission carry growth to 2035
Australian construction value is expected to reach USD 291.76 billion by 2035, a 3.77% CAGR during 2026–2035, as housing, transport and energy programs move from planning into delivery. Growth should be strongest in Queensland as Games venues and regional roads proceed, while New South Wales keeps the largest workload. Residential building will gain share if house approvals keep recovering and apartment feasibility improves. Contractors that combine collaborative contracting, factory methods and a stable workforce should win the largest share of new work.
Frequently Asked Questions
How big is the Australia construction market?
Which asset type leads Australian construction spending?
Which state leads construction spending in Australia?
How does the housing target affect construction demand?
How large is the public infrastructure pipeline?
Which construction technology grows fastest?
Which companies lead construction in Australia?
What are the main challenges for Australian construction?
Table of Content
Chapter 1 Market Segmentation
- 1.1 Segmentation Framework
- 1.1.1 Product and Service Classification
- 1.1.2 Application and End-Use Classification
- 1.1.3 Technology and Solution Classification
- 1.1.4 Customer and Distribution Channel Classification
- 1.1.5 Geographic Segmentation
- 1.1.6 Market Segment Definitions and Boundaries
- 1.2 By Asset Type
- 1.2.1 Residential Building
- 1.2.2 Non-Residential Building
- 1.2.3 Engineering Construction
- 1.3 By Project Type
- 1.3.1 New Construction
- 1.3.2 Alterations and Additions
- 1.3.3 Rehabilitation and Capital Repairs
- 1.4 By Contracting Model
- 1.4.1 Construct Only
- 1.4.2 Design and Construct
- 1.4.3 Collaborative Delivery
- 1.4.4 Managing Contractor
- 1.5 By Technology
- 1.5.1 Site-Based Construction
- 1.5.2 Panelised and Precast Construction
- 1.5.3 Volumetric Modular Construction
- 1.6 By State
- 1.6.1 New South Wales
- 1.6.2 Victoria
- 1.6.3 Queensland
- 1.6.4 Remaining States and Territories
Chapter 2 Introduction
- 2.1 Report Objectives and Scope
- 2.2 Product Definition and Industry Terminology
- 2.3 Market Inclusions and Exclusions
- 2.4 Research Process
- 2.4.1 Primary Research and Expert Interviews
- 2.4.2 Secondary Research and Source Review
- 2.4.3 Top-Down and Bottom-Up Estimation
- 2.4.4 Data Triangulation and Verification
- 2.5 Market Size Measurement Basis
- 2.5.1 2025: USD 200.95 billion → 2035: USD 291.76 billion
- 2.6 Historical and Forecast Reference Periods
- 2.6.1 Historical Period: 2018-2025
- 2.6.2 Base Year: 2025
- 2.6.3 Forecast Period: 2025-2035
- 2.7 Research Assumptions and Limitations
Chapter 3 Executive Summary
- 3.1 Market Snapshot and Key Findings
- 3.2 Base-Year Market Size, 2025
- 3.3 Forecast Market Size, 2035
- 3.4 Revenue and Volume Growth Outlook
- 3.5 Key Demand and Supply Indicators
- 3.6 Leading Market Segments
- 3.7 Fastest-Growing Market Opportunities
- 3.8 Regional Performance Highlights
- 3.9 Technology and Industry Transformation
- 3.10 Competitive Landscape Summary
- 3.11 Analyst View and Strategic Implications
Chapter 4 Australia Construction Market Trends and Developments
- 4.1 Historical Industry Development, 2018-2025
- 4.2 Recent Market Trends and Developments
- 4.3 Demand and Customer Behavior Trends
- 4.4 Technology and Product Innovation
- 4.5 Artificial Intelligence, Automation and Digitalization
- 4.6 Local Manufacturing and Supply Chain Realignment
- 4.7 Industry Partnerships, Mergers and Acquisitions
- 4.8 Sustainability and Circular Economy Developments
- 4.9 Government and Private Sector Investment Trends
- 4.10 Emerging Business Models and Commercialization
- 4.11 Industry Developments and Announcements
Chapter 5 Australia Construction Market Production, Supply and Demand Analysis
- 5.1 Demand Trend and Consumption Analysis, 2018-2025
- 5.2 Demand Forecast, 2025-2035
- 5.3 Production and Output Trend, 2018-2025
- 5.4 Production and Output Forecast, 2025-2035
- 5.5 Installed Capacity and Capacity Utilization
- 5.6 Company-Wise Production Plants and Statistics
- 5.6.1 Installed Production Capacity
- 5.6.2 Actual Production
- 5.6.3 Planned Capacity and Expansion Targets
- 5.7 Supply Chain Structure and Procurement Trends
- 5.8 Supply-Demand Gap and Bottlenecks
- 5.9 Import Dependence and Sourcing Structure
- 5.10 Contract Manufacturing and Outsourcing
- 5.11 Regional Supply and Demand Concentration
Chapter 6 Australia Construction Market Pricing Analysis
- 6.1 Pricing Structure and Measurement
- 6.2 Historical Pricing Trends, 2018-2025
- 6.3 Pricing Outlook, 2025-2035
- 6.4 Average Selling Price and Unit Economics
- 6.5 Pricing by Product and Market Segment
- 6.6 Geographic Pricing Differences
- 6.7 Key Input, Energy, Labor and Logistics Costs
- 6.8 Contract Pricing and Purchasing Models
- 6.9 Pricing Sensitivity and Competitive Positioning
- 6.10 Price, Margin and Profitability Implications
Chapter 7 Australia Construction Market Dynamics
- 7.1 Market Growth Drivers
- 7.1.1 Demand-Side Drivers
- 7.1.2 Technology and Innovation Drivers
- 7.1.3 Infrastructure and Investment Drivers
- 7.1.4 Regulatory and Policy Drivers
- 7.2 Market Restraints
- 7.2.1 Cost and Affordability Constraints
- 7.2.2 Technology and Adoption Barriers
- 7.2.3 Supply Chain and Operational Constraints
- 7.3 Market Challenges
- 7.3.1 Competitive Pressure and Margin Erosion
- 7.3.2 Skills, Infrastructure and Implementation Gaps
- 7.4 Emerging Market Opportunities
- 7.5 Market Dynamics Impact and Time-Horizon Assessment
Chapter 8 Australia Construction Value Chain Analysis
- 8.1 Industry Value Chain Overview
- 8.2 Upstream Suppliers and Critical Inputs
- 8.3 Technology and Component Providers
- 8.4 Manufacturing or Service Delivery
- 8.5 Distribution, Channel Partners and Integrators
- 8.6 Downstream Applications and End Users
- 8.7 Value Addition and Profit Pools
- 8.8 Vertical Integration and Outsourcing
- 8.9 Supplier Concentration and Risk
- 8.10 Supply Chain Localization and Resilience
Chapter 9 Australia Construction Market Regulations and Policies
- 9.1 Relevant Laws, Standards and Compliance Frameworks
- 9.2 Product, Service, Safety and Quality Requirements
- 9.3 Government Policies, Incentives and Subsidies
- 9.4 Imports, Exports and Trade Barriers
- 9.5 Public Procurement and Local Content Requirements
- 9.6 Environmental and Sustainability Compliance
- 9.7 Upcoming Policy Changes and Market Implications
Chapter 10 Australia Construction Market Hotspots and Opportunities
- 10.1 Market Opportunity Mapping and Growth Hotspots
- 10.2 High-Growth Applications and Customer Groups
- 10.3 Underserved Markets and White-Space Opportunities
- 10.4 Emerging Technology and Product Opportunities
- 10.5 New Capacity and Investment Hotspots
- 10.6 Market Entry and Expansion Opportunities
- 10.7 Distribution and Partnership Opportunities
- 10.8 Near-Term and Long-Term Commercial Potential
- 10.9 Opportunity Attractiveness and Execution Risks
Chapter 11 Australia Construction Market Outlook, 2025-2035
- 11.1 Market Size and Analysis
- 11.1.1 Revenue (Market Measurement: 2025: USD 200.95 billion → 2035: USD 291.76 billion)
- 11.1.2 Market Volume and Quantity Sold
- 11.1.3 Historical Market Size, 2018-2025
- 11.1.4 Base-Year Market Size, 2025
- 11.2 Market Forecast, 2025-2035
- 11.2.1 Revenue Forecast to 2035
- 11.2.2 Volume Forecast to 2035
- 11.2.3 CAGR and Year-on-Year Growth
- 11.2.4 Incremental Revenue Opportunity
- 11.3 Forecast Assumptions and Scenario Analysis
- 11.3.1 Base-Case Forecast
- 11.3.2 Optimistic and Conservative Scenarios
- 11.3.3 Technology, Pricing and Policy Sensitivities
- 11.4 Market Attractiveness and Growth Outlook
Chapter 12 Australia Construction Market Segmentation and Outlook
- 12.1 Segmentation Summary and Market Shares, 2025
- 12.2 Largest and Fastest-Growing Segments
- 12.3 By Asset Type - Market Size and Forecast, 2025-2035
- 12.3.1 Segment Definition and Scope
- 12.3.2 Historical Market Size, 2018-2025
- 12.3.3 Revenue Forecast, 2025-2035
- 12.3.4 Volume Forecast, 2025-2035
- 12.3.5 Base-Year Market Share, 2025
- 12.3.6 Segment CAGR and Growth Drivers
- 12.3.7 Subsegment Market Size and Forecast
- 12.3.7.1 Residential Building
- 12.3.7.2 Non-Residential Building
- 12.3.7.3 Engineering Construction
- 12.3.8 Subsegment Pricing and Adoption Trends
- 12.3.9 Leading Suppliers and Competition
- 12.3.10 Regional Demand and Opportunities
- 12.4 By Project Type - Market Size and Forecast, 2025-2035
- 12.4.1 Segment Definition and Scope
- 12.4.2 Historical Market Size, 2018-2025
- 12.4.3 Revenue Forecast, 2025-2035
- 12.4.4 Volume Forecast, 2025-2035
- 12.4.5 Base-Year Market Share, 2025
- 12.4.6 Segment CAGR and Growth Drivers
- 12.4.7 Subsegment Market Size and Forecast
- 12.4.7.1 New Construction
- 12.4.7.2 Alterations and Additions
- 12.4.7.3 Rehabilitation and Capital Repairs
- 12.4.8 Subsegment Pricing and Adoption Trends
- 12.4.9 Leading Suppliers and Competition
- 12.4.10 Regional Demand and Opportunities
- 12.5 By Contracting Model - Market Size and Forecast, 2025-2035
- 12.5.1 Segment Definition and Scope
- 12.5.2 Historical Market Size, 2018-2025
- 12.5.3 Revenue Forecast, 2025-2035
- 12.5.4 Volume Forecast, 2025-2035
- 12.5.5 Base-Year Market Share, 2025
- 12.5.6 Segment CAGR and Growth Drivers
- 12.5.7 Subsegment Market Size and Forecast
- 12.5.7.1 Construct Only
- 12.5.7.2 Design and Construct
- 12.5.7.3 Collaborative Delivery
- 12.5.7.4 Managing Contractor
- 12.5.8 Subsegment Pricing and Adoption Trends
- 12.5.9 Leading Suppliers and Competition
- 12.5.10 Regional Demand and Opportunities
- 12.6 By Technology - Market Size and Forecast, 2025-2035
- 12.6.1 Segment Definition and Scope
- 12.6.2 Historical Market Size, 2018-2025
- 12.6.3 Revenue Forecast, 2025-2035
- 12.6.4 Volume Forecast, 2025-2035
- 12.6.5 Base-Year Market Share, 2025
- 12.6.6 Segment CAGR and Growth Drivers
- 12.6.7 Subsegment Market Size and Forecast
- 12.6.7.1 Site-Based Construction
- 12.6.7.2 Panelised and Precast Construction
- 12.6.7.3 Volumetric Modular Construction
- 12.6.8 Subsegment Pricing and Adoption Trends
- 12.6.9 Leading Suppliers and Competition
- 12.6.10 Regional Demand and Opportunities
- 12.7 By State - Market Size and Forecast, 2025-2035
- 12.7.1 Segment Definition and Scope
- 12.7.2 Historical Market Size, 2018-2025
- 12.7.3 Revenue Forecast, 2025-2035
- 12.7.4 Volume Forecast, 2025-2035
- 12.7.5 Base-Year Market Share, 2025
- 12.7.6 Segment CAGR and Growth Drivers
- 12.7.7 Subsegment Market Size and Forecast
- 12.7.7.1 New South Wales
- 12.7.7.2 Victoria
- 12.7.7.3 Queensland
- 12.7.7.4 Remaining States and Territories
- 12.7.8 Subsegment Pricing and Adoption Trends
- 12.7.9 Leading Suppliers and Competition
- 12.7.10 Regional Demand and Opportunities
- 12.8 Segment Growth Comparison
- 12.9 Segment Attractiveness and Priority Matrix
Chapter 13 Australia Construction Geographic Market Outlook, 2025-2035
- 13.1 Domestic Market Distribution and Demand Clusters
- 13.2 State- or Province-Wise Market Size and Forecast, 2025-2035
- 13.3 City and Metropolitan Market Outlook
- 13.4 Industrial, Manufacturing and Commercial Clusters
- 13.5 Geographic Concentration of Key End Users
- 13.6 Local Pricing and Purchasing Differences
- 13.7 Domestic Production Facilities and Capacity Map
- 13.8 Local Infrastructure and Project Pipeline
- 13.9 State-Level Policy and Incentive Differences
- 13.10 Subnational Investment Hotspots and Opportunities
- 13.11 Distribution and Logistics Networks
- 13.12 Domestic Competitive Footprint
Chapter 14 Australia Construction Technology, Innovation and Sustainability Outlook
- 14.1 Technology Landscape and Maturity
- 14.2 Product, Process and Service Innovation
- 14.3 AI, Automation and Digital Tools in the Industry
- 14.4 Technology Adoption and Performance Benchmarking
- 14.5 Innovation Pipeline and R&D Investment
- 14.6 Patent and Intellectual Property Trends
- 14.7 Energy Efficiency and Resource Management
- 14.8 Sustainability, Recycling and Circularity
- 14.9 Technology Roadmap, 2025-2035
- 14.10 Risks of Obsolescence and Technology Substitution
Chapter 15 Australia Construction Market Key Strategic Imperatives
- 15.1 Growth and Market Entry Priorities
- 15.2 High-Return Products and Segments
- 15.3 Pricing, Profitability and Cost Optimization
- 15.4 Technology Investment and Product Differentiation
- 15.5 Supply Chain Localization and Resilience
- 15.6 Distribution and Customer Acquisition
- 15.7 Partnership, Acquisition and Capacity Strategy
- 15.8 Regional Expansion Priorities
- 15.9 Short-, Medium- and Long-Term Actions
Chapter 16 Competition Outlook
- 16.1 Industry Competition Characteristics
- 16.2 Market Structure and Concentration
- 16.3 Market Share and Competitive Positioning, 2025
- 16.4 Company-Wise Revenue and Product Benchmarking
- 16.5 Production and Service Capacity Benchmarking
- 16.6 Technology, Pricing and Differentiation
- 16.7 Regional Footprint and Distribution Strength
- 16.8 Mergers, Acquisitions and Strategic Alliances
- 16.9 New Entrants and Competitive Threats
- 16.10 Porter's Five Forces and Industry Attractiveness
- 16.11 Competitive Outlook, 2025-2035
Chapter 17 Company Profiles
- 17.1 Company Coverage and Selection Criteria
- 17.2 CPB Contractors
- 17.2.1 Business Description
- 17.2.2 Company Ownership and Geographic Presence
- 17.2.3 Product and Service Portfolio
- 17.2.4 Manufacturing and Operating Footprint
- 17.2.5 Production Capacity and Expansion Plans
- 17.2.6 Financial Performance and Investment
- 17.2.7 Market Share and Competitive Position
- 17.2.8 Technology and Innovation Capabilities
- 17.2.9 Strategic Alliances or Partnerships
- 17.2.10 Recent Developments
- 17.2.11 Growth Strategy and Outlook
- 17.3 John Holland
- 17.4 Multiplex
- 17.5 Lendlease
- 17.6 ACCIONA
- 17.7 Hutchinson Builders
- 17.8 Fulton Hogan
- 17.9 BMD Group
- 17.10 Laing O'Rourke
- 17.11 Metricon
- 17.12 Other Relevant Market Participants
Note: Every listed company is profiled on the structure shown under the first company. The company list is preliminary and may change based on research findings, market developments, data availability and client requirements.
Chapter 18 Disclaimer
- 18.1 Research and Forecast Disclaimer
- 18.2 Data Source and Estimation Limitations
Note: The depth of individual sections depends on data availability for this market. Volume, capacity, trade and other unit-based metrics are included where applicable.

