
Dump closures, shale cuttings and recycling contracts
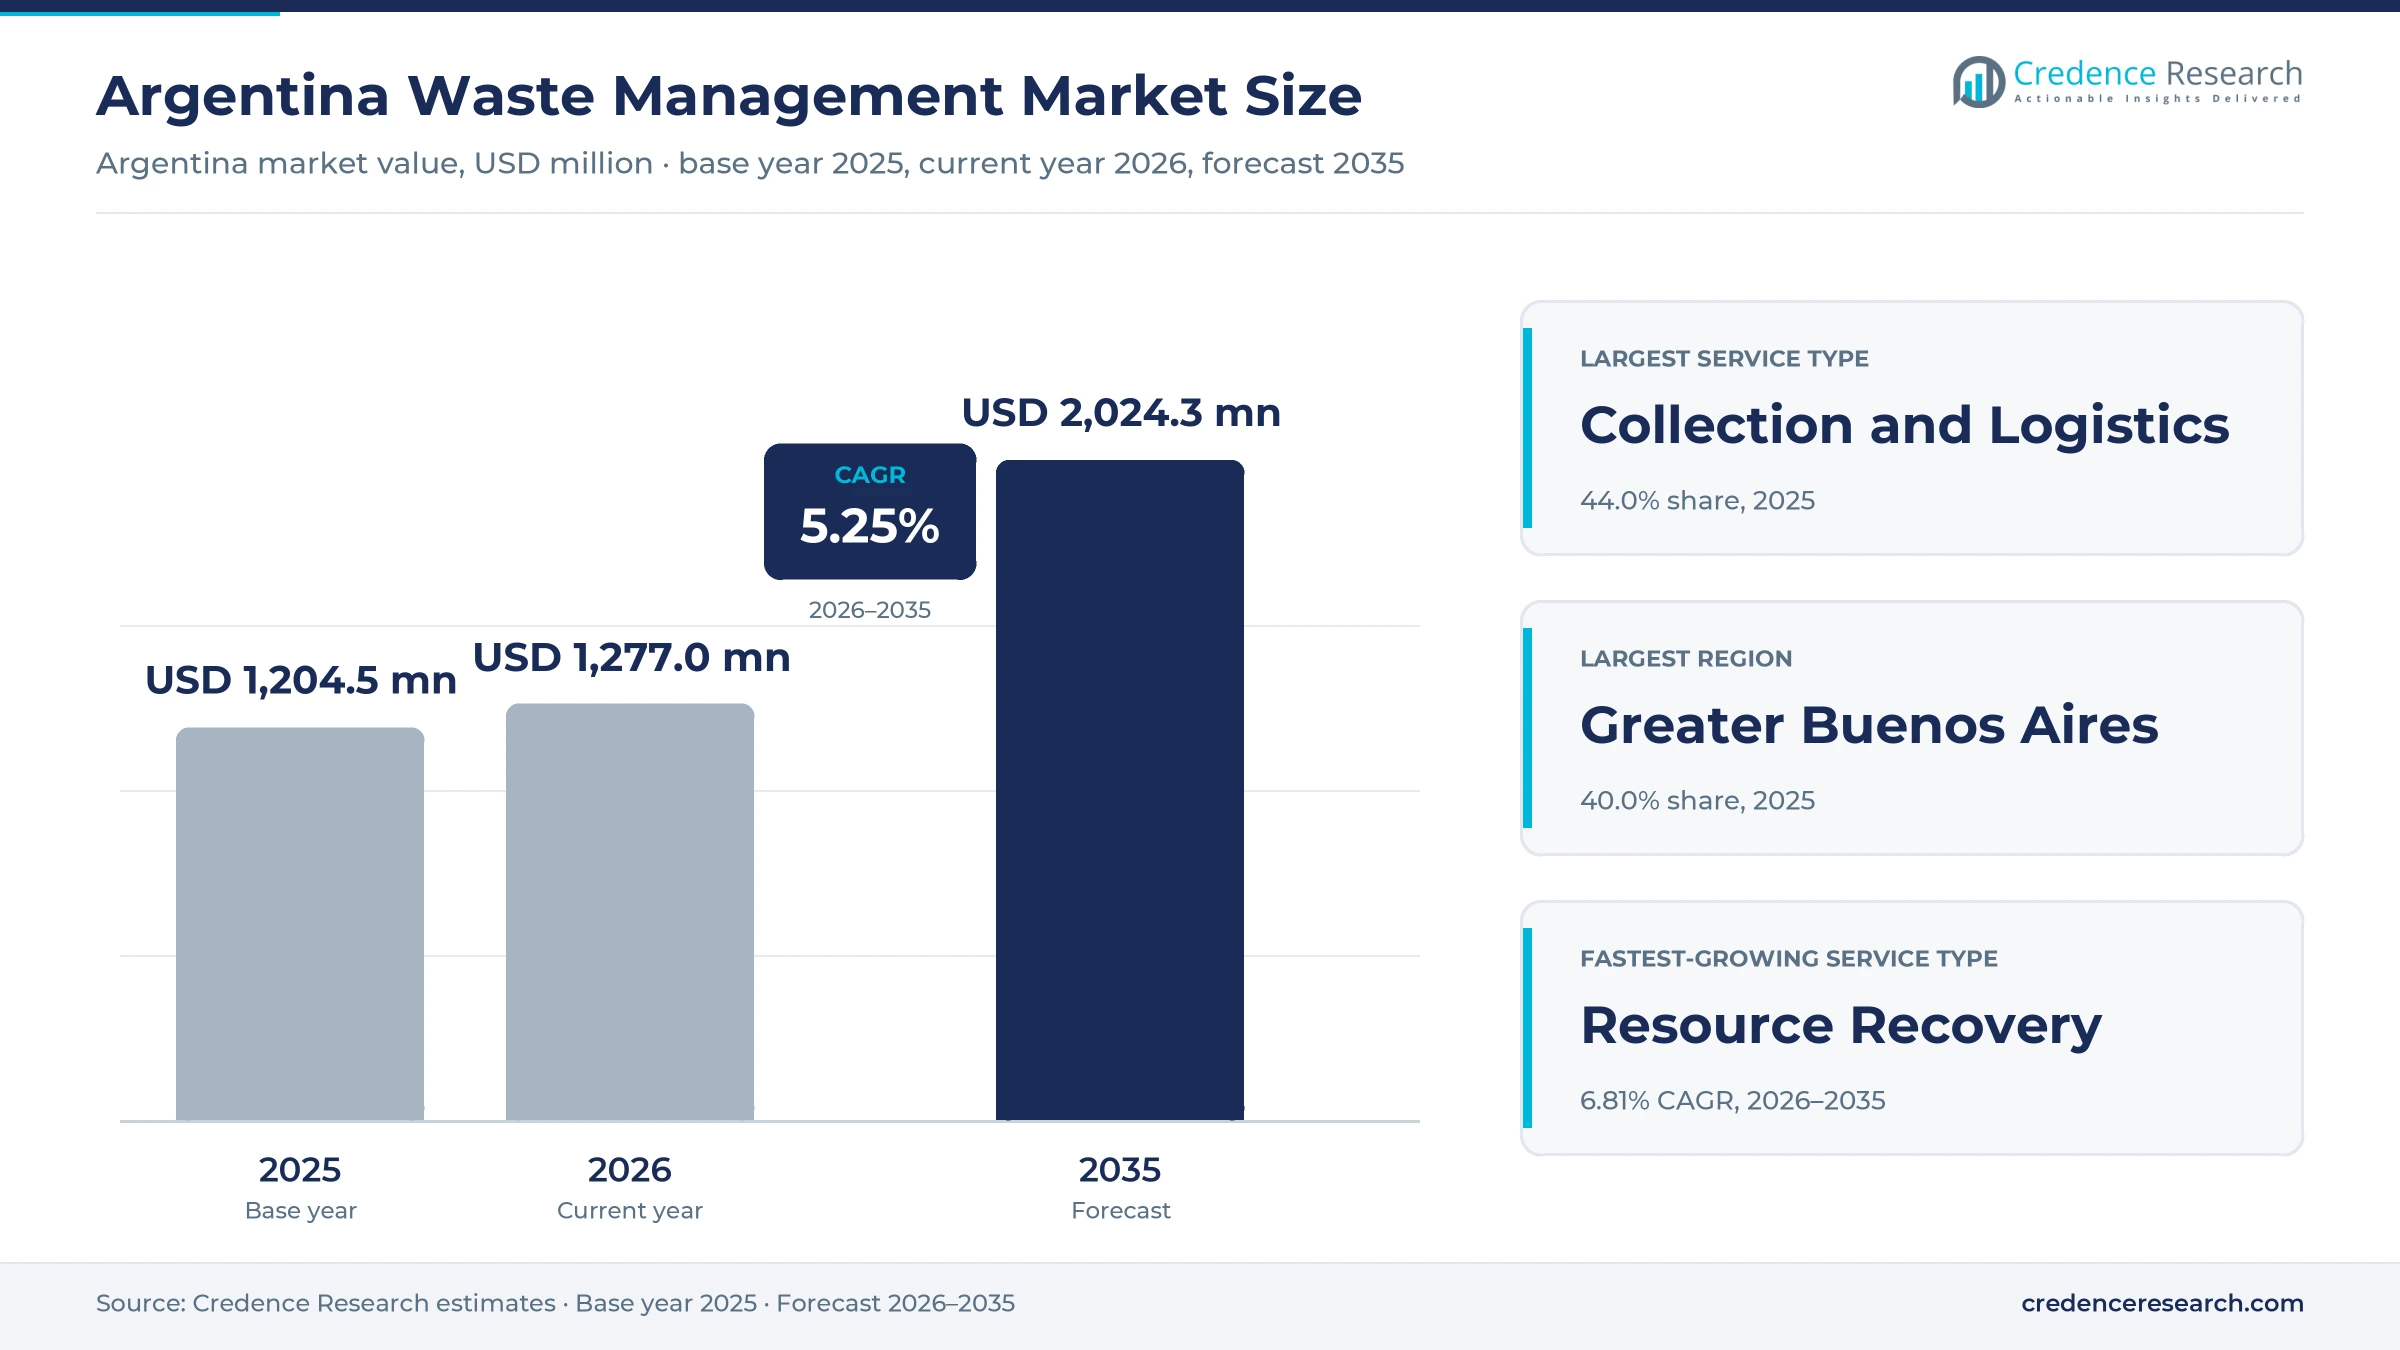
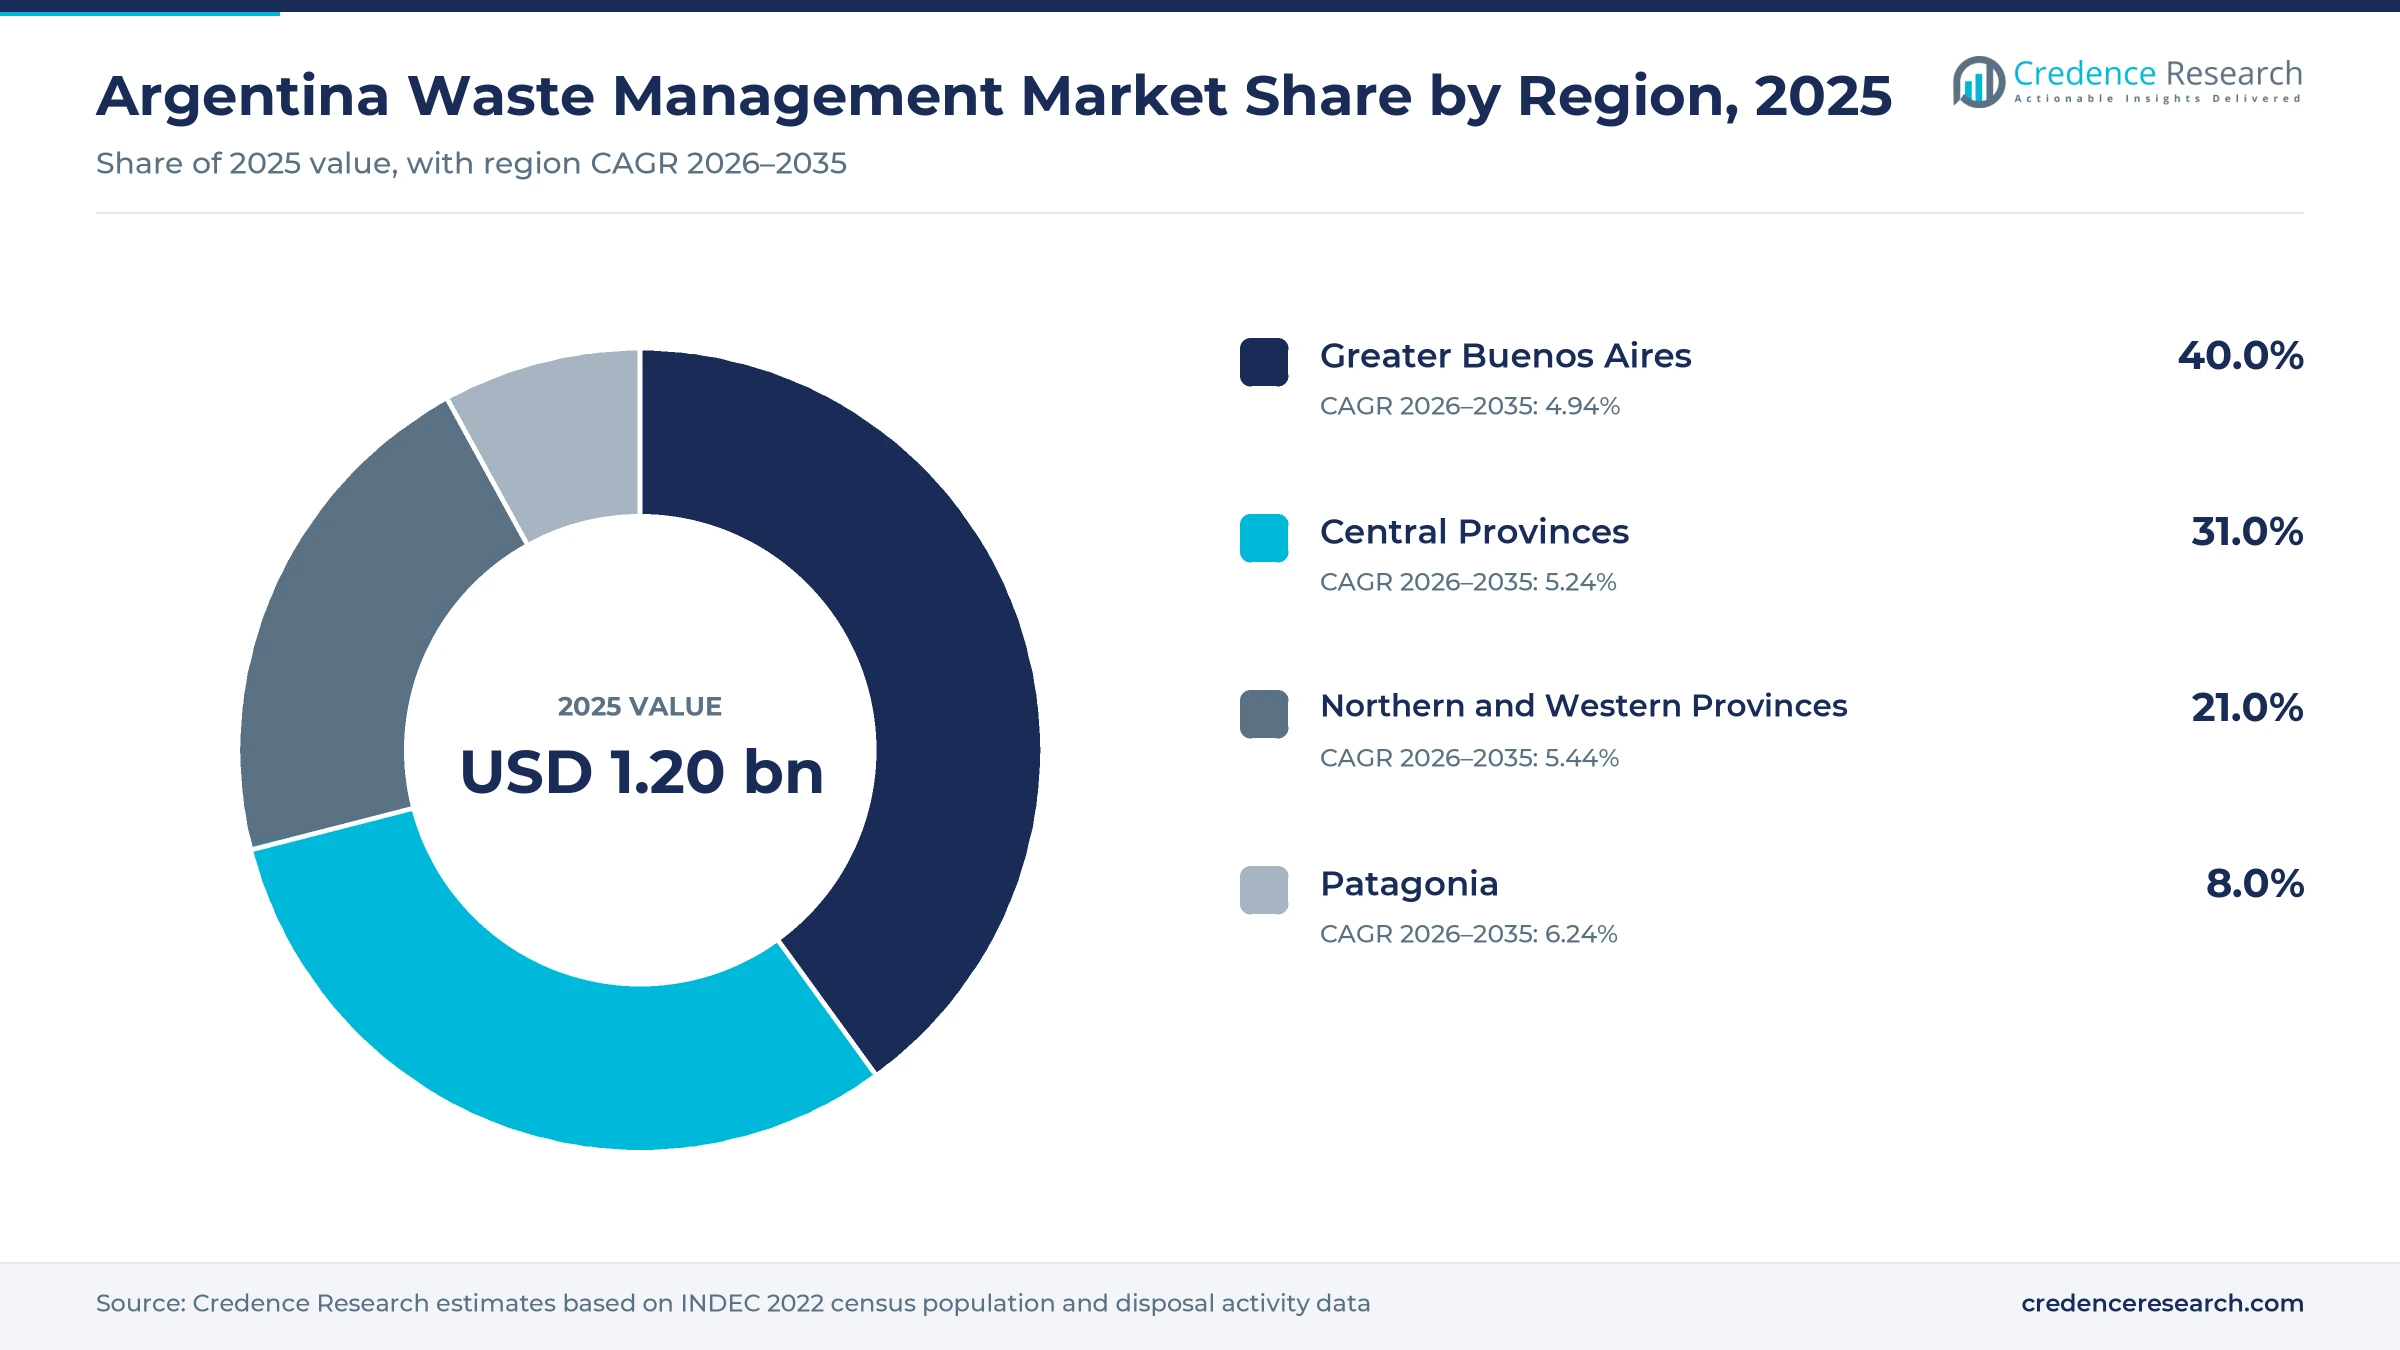
The Argentina waste management market was valued at USD 1.20 billion in 2025 and is projected to increase from USD 1.28 billion in 2026 to USD 2.02 billion by 2035, registering a CAGR of 5.25% during 2026–2035. Demand comes from municipalities that pay contractors to collect, transport and bury household refuse, from oil, gas and manufacturing companies that must treat regulated residues, and from cities that now contract formal recycling networks. Greater Buenos Aires held the largest regional share, 40.0% in 2025, because the capital and its suburbs send refuse to the country's largest sanitary landfill complex. Patagonia is the fastest-growing region at 6.24% a year, as shale drilling in Neuquén produces rising volumes of residues that need licensed treatment. In turn, the commercial landscape is shifting, because the City of Buenos Aires opened a 10-year collection tender in September 2026 that ties part of each payment to service quality.
What does the national estimate include and leave out?
The estimate measures what public and private buyers spend on waste services in Argentina. It counts household and commercial collection, transfer and haulage, sanitary landfill and treatment fees, hazardous and oilfield residue treatment, sorting and recovery services, and street sweeping and related urban hygiene work sold to public and private buyers.
The estimate excludes the sale of trucks, containers and plant equipment, the value of recovered materials resold to industry and informal scavenging outside contracted systems. The value chain runs from municipalities and industrial generators through collection contractors, transfer stations and treatment plants to landfills and the recycling buyers that take sorted materials.
Argentina Waste Management Market Insights
- The Argentina waste management market was valued at USD 1.20 billion in 2025 and is projected to reach USD 2.02 billion by 2035, registering a CAGR of 5.25% during 2026–2035.
- Greater Buenos Aires held a 40.0% share of 2025 value, because the capital and its suburbs feed the Norte III landfill complex and pay the highest collection rates.
- Collection and Logistics led service types with a 44.0% share of 2025 value, because daily household pickup and haulage absorb most municipal budgets.
- The City of Buenos Aires published Decree 304/26 on Sept. 1, 2026, opening a 10-year collection tender across eight zones with quality-linked payments.
- Platinum Equity hired Banco Santander in February 2026 to sell Urbaser Argentina, a sale that could reshape competition for urban contracts.
Collection leads while resource recovery grows fastest
Why does collection carry the largest share of spending?
Based on service type, the market is categorized into Collection and Logistics, Treatment and Disposal, Resource Recovery and Municipal Service Operations. Collection and Logistics led with a 44.0% share of 2025 value, because daily pickup, transfer and long haul to landfills use the most trucks and crews. Resource Recovery grows fastest at 6.81% a year, as cities pay for sorting plants, green centers and fuel made from residues.
Which buyers pay for most collection and disposal?
Based on customer type, the market is categorized into Municipal Authorities, Private Waste Generators and Public Institutions. Municipal Authorities led with a 63.0% share of 2025 value, because local governments contract household collection, street cleaning and landfill access for every resident. Private Waste Generators grow fastest at 5.92% a year, as shale operators and factories must treat regulated residues under provincial rules.
Which sources of refuse generate the most value?
Based on end-use industry, the market is categorized into Residential Communities, Commerce and Public Facilities and Production Industries. Residential Communities led with a 55.0% share of 2025 value, because households produce most of the urban refuse that cities pay to remove. Production Industries grow fastest at 6.02% a year, as drilling cuttings, solvents and hospital residues need licensed treatment.
How do service providers win their contracts?
Based on sales channel, the market is categorized into Public Procurement, Direct Corporate Contracting and Operator Subcontracting. Public Procurement led with a 62.0% share of 2025 value, because cities award multi-year collection zones through public tenders. Direct Corporate Contracting grows fastest at 5.90% a year, as oil, gas and industrial companies hire treatment plants directly for residues their own sites produce.
| Segment Group | Leading Sub-segment | Share, 2025 | Fastest-growing Sub-segment | CAGR, 2026–2035 |
|---|---|---|---|---|
| By Service Type | Collection and Logistics | 44.0% | Resource Recovery | 6.81% |
| By Customer Type | Municipal Authorities | 63.0% | Private Waste Generators | 5.92% |
| By End-Use Industry | Residential Communities | 55.0% | Production Industries | 6.02% |
| By Sales Channel | Public Procurement | 62.0% | Direct Corporate Contracting | 5.90% |
Request a Free Sample
Fill in your details and we'll send you a free sample report.
- Sample data tables & charts
- Research methodology
Landfill shift, shale compliance and recycling contracts
How is the move from open dumps to landfills lifting spending?
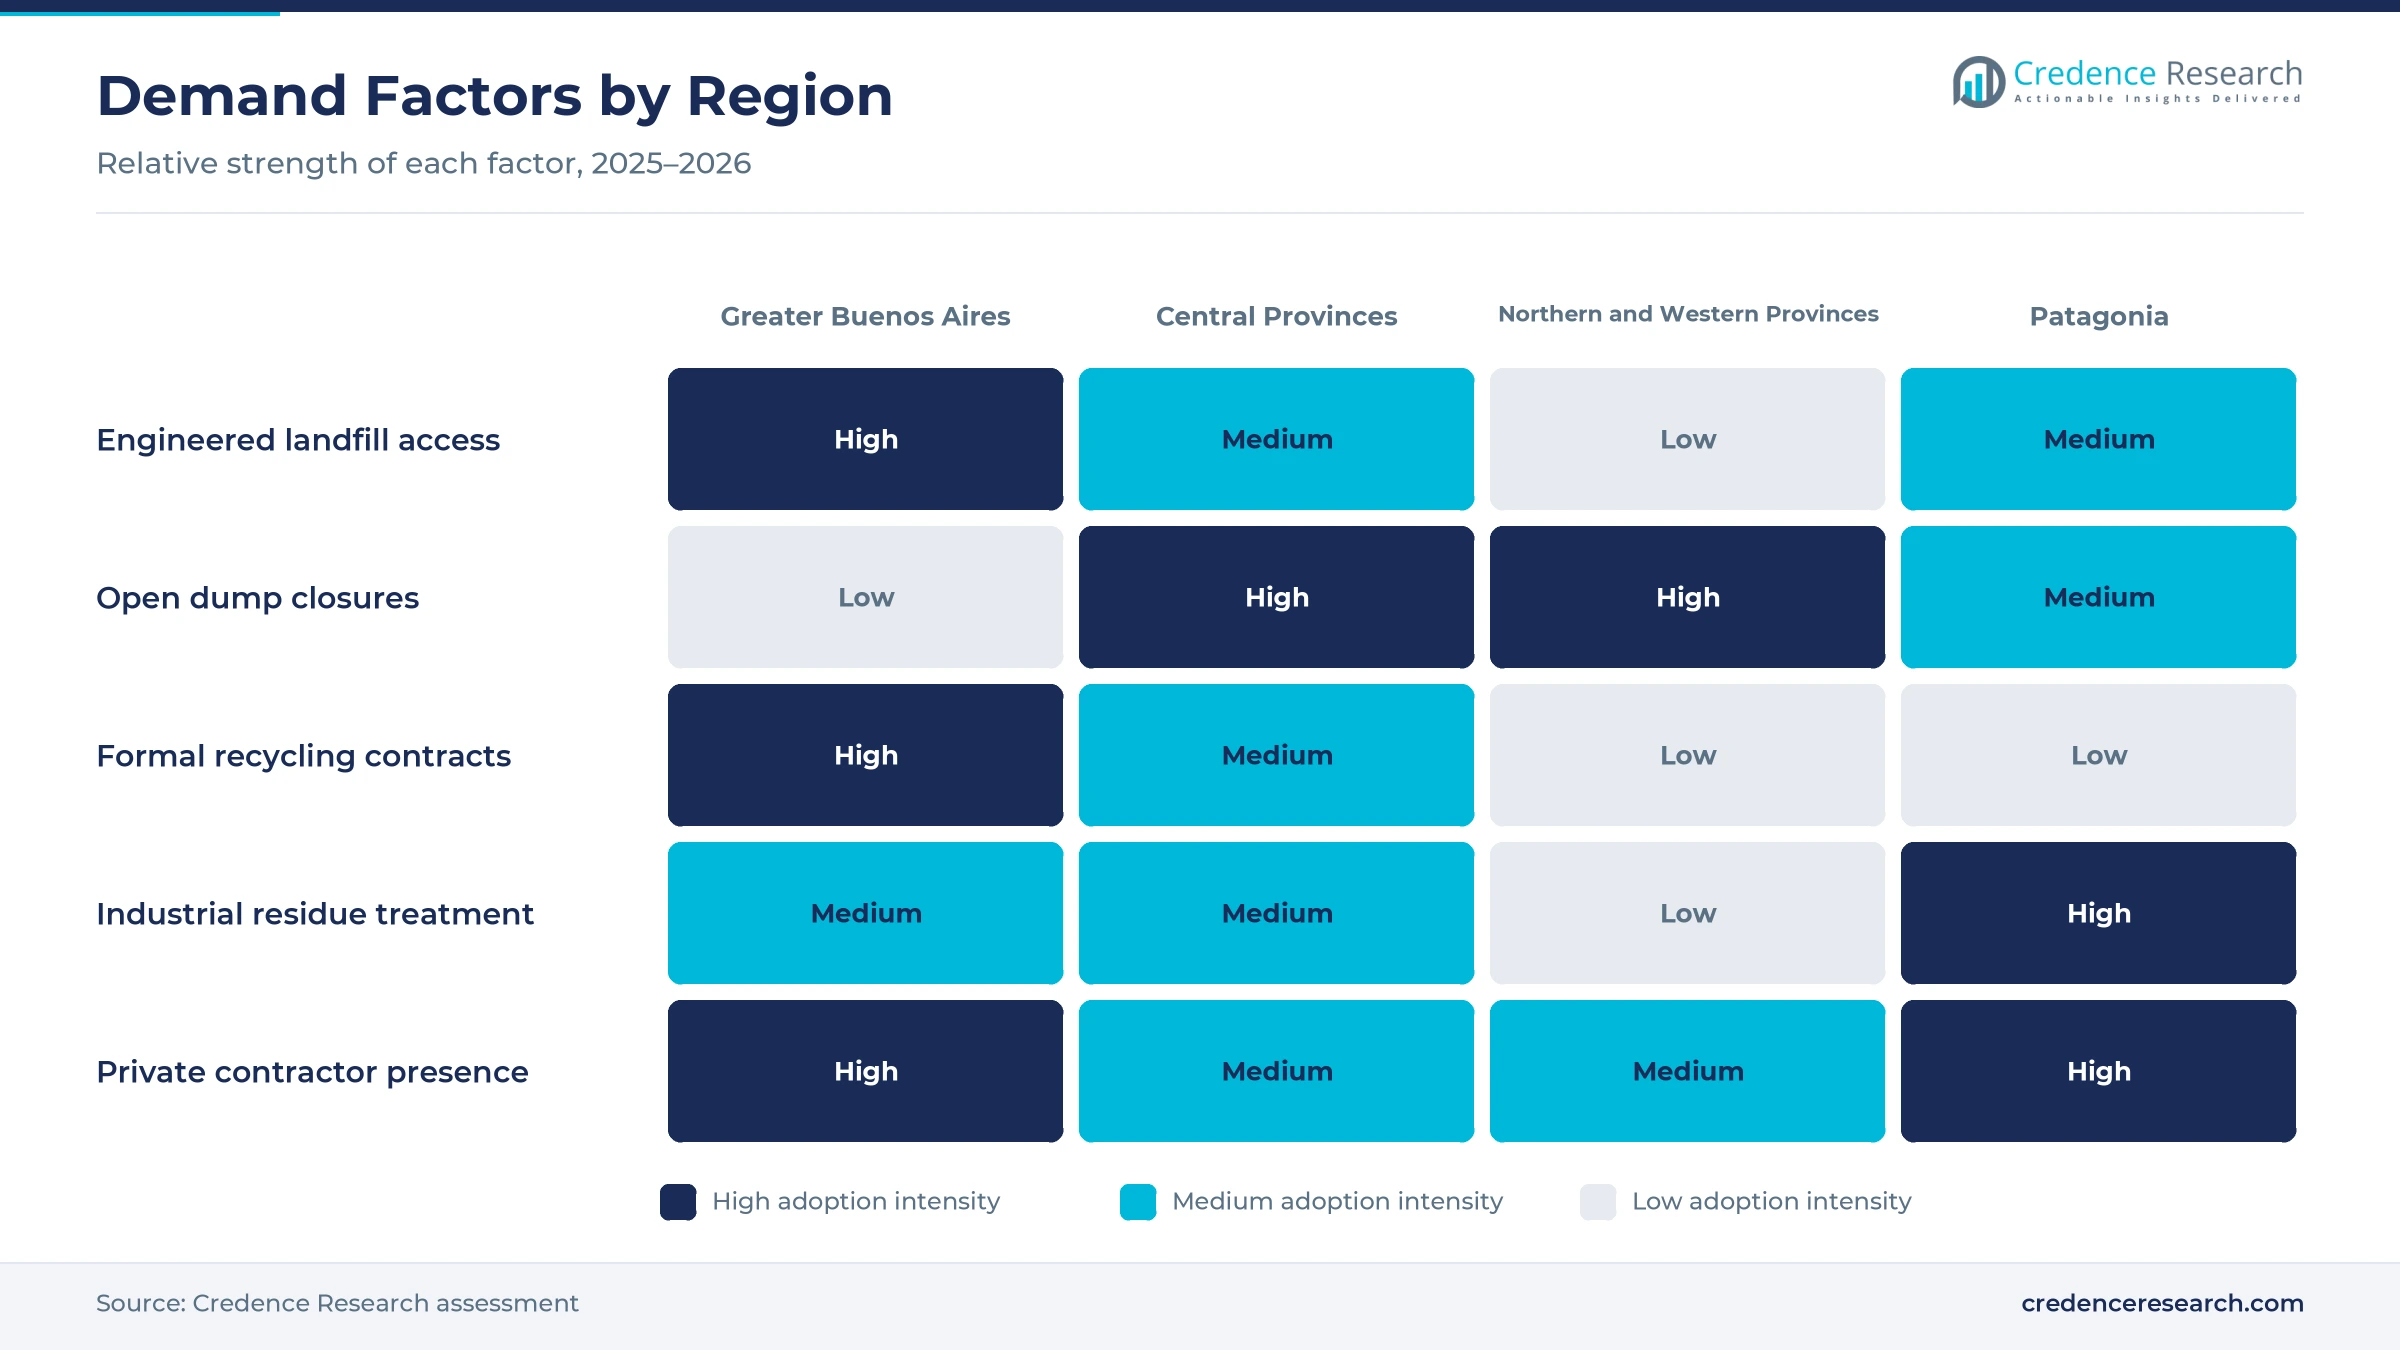
The replacement of open dumps with engineered landfills raises spending on haulage and disposal, because towns must pay to move refuse to licensed sites. Argentina generates about 1.15 kg of household waste per person a day, or almost 45,000 metric tons a day, and the last official count found about 5,000 open dumps covering 8,600 hectares, Chequeado reported. A United Nations environment program document published in 2021 put the share handled by inadequate methods at 34.4%, Chequeado noted. Luján closed a 16-hectare dump on July 1, 2026 after more than 50 years, and the district now sends all household refuse to CEAMSE, Perfil reported. As a result, Collection and Logistics keeps a 44.0% share of 2025 value.
Why do shale operators need more specialist residue treatment?
Shale drilling in Vaca Muerta creates the fastest-growing stream of regulated industrial residues, because each well produces cuttings, flowback and oily sludge. Licensed plants treated 1,022,290 cubic meters of hazardous waste in 2023, up 35.2% from 756,230 cubic meters in 2022, and Chequeado reported that plants worked at full capacity. Neuquén then ordered the transfer of 210,000 cubic meters of stored residues from the Comarsa site to Añelo, and NoticiasNQN reported 1,500 authorized truck trips by August 2025. Veolia Argentina treats 2,000 to 3,000 metric tons of drill cuttings a month in Añelo, Forbes Argentina reported. In turn, Production Industries grow fastest among sources at 6.02% a year.
How are formal recycling contracts widening recovery work?
Cities are paying organized recycling networks to sort and sell materials, which turns recovery into a contracted service. The City of Buenos Aires works with 12 recycler cooperatives that employ more than 6,500 workers, and it runs 16 green centers, 3 of which use automated sorting lines, according to the city government. Those green centers received 101,000 metric tons of recyclables in 2022, and 82,000 metric tons were recovered and sold. A mechanical biological treatment plant at Norte III processes up to 1,100 metric tons a day and recovers 328,000 metric tons a year. As a result, Resource Recovery grows fastest among service types at 6.81% a year.
Why do economic recovery and long contracts support demand?
A return to growth gives municipalities and companies more room to renew long service contracts, which supports fleet and landfill investment. Gross domestic product grew 4.4% in 2025 after a 1.3% fall in 2024, according to the World Bank. Neuquén awarded its collection, sweeping and cleaning service to a Cliba and Tecsan joint venture in June 2025 for eight years, with an optional one-year extension, NoticiasNQN reported. The City of Buenos Aires then opened a 10-year collection tender through Decree 304/26 in September 2026, with eight zones replacing the current seven. In turn, Public Procurement held 62.0% of 2025 value across the country.
Methane scrutiny and performance-linked contracts rise
Why is landfill methane scrutiny on the rise?
Satellite monitoring is putting landfill emissions under public review, which pushes operators toward gas capture and cover systems. A UCLA study with Carbon Mapper tracked nearly 3,000 methane plumes over 707 landfills and dumps and found the highest hourly rate at Norte III, close to 7.6 metric tons of methane an hour, Economía Sustentable reported. CEAMSE receives an average of 436,325 metric tons a month, about 14,500 metric tons a day, and Norte III takes about 85% of that volume. The study did not rank the site as the largest annual emitter. In turn, interest in landfill gas capture should rise across the Greater Buenos Aires complexes.
How are performance-linked collection contracts emerging?
Cities are shifting from fixed fees toward payments tied to measured service quality, which changes how contractors price and staff each zone. Decree 304/26 in the City of Buenos Aires splits monthly payment into a fixed part for equipment and frequency and a variable part tied to a quality index and a resident perception index, Economía Sustentable reported. The tender covers 17 lots, requires five years of similar experience and lets the dry-waste contractor sell recovered materials. The current contracts were extended to Sept. 30, 2028, which sets the transition window. As a result, contractors must price each zone on measured quality rather than on fleet size alone.
Is contractor consolidation an opening for new investors?
Ownership changes among large collection contractors create an opening for strategic buyers and local groups. Platinum Equity hired Banco Santander to sell Urbaser Argentina after the country was left out of the global deal in which Blackstone and EQT agreed to buy Urbaser, Canal 26 reported on Feb. 25, 2026. Urbaser has operated in the country since 1996 and employs about 3,500 workers through a local holding company created in December 2023. Veolia Argentina grew mainly through acquisitions, including the Braunco solvent and incineration business that serves about 200 clients, Forbes Argentina reported. In turn, buyers can gain zones, fleets and permits at once.
Is fuel made from residues the next recovery opening?
Turning sorted residues into fuel for cement kilns gives cities a way to cut landfill volumes while selling an industrial input. Geocycle, part of the Holcim group, has separated household refuse at the Piedra Blanca landfill in Córdoba since 2021 and turns it into refuse-derived fuel for kilns in Malagueño, La Voz reported. Piedra Blanca received 811,843 metric tons in 2022, and on average 18% of monthly intake was kept out of the landfill. An expansion is expected to double processing to more than 8,000 metric tons a month. As a result, Resource Recovery gains new buyers outside the capital.
Landfill emissions and informal recycling test operators
How do aging landfill complexes raise emission risk?
Large landfills near the capital have operated for more than three decades, which exposes operators to emission and capacity scrutiny. Norte III covers about 600 hectares at Campo de Mayo and receives most of the metropolitan refuse. As a result, any delay in gas capture or new cells can draw regulatory and neighborhood pressure. Operators respond with treatment plants that cut buried volumes and with monitoring that measures emissions before regulators ask.
Why does the informal recycling transition create friction?
Formal recovery depends on thousands of recyclers whose income relies on access to materials and city funding. Cooperatives in the City of Buenos Aires said a proposed recycling tender in August 2026 put about 7,000 jobs at risk, Tiempo Argentino reported. In turn, tender delays or disputes can slow the rollout of new sorting contracts. Cities reduce the risk by reserving roles for cooperative workers and by exempting cooperatives from offer guarantees.
Why do hazardous treatment bottlenecks persist in Neuquén?
Treatment capacity for shale residues has lagged behind drilling, which leaves stockpiles and legal exposure for generators. About 210,000 cubic meters of residues sat at the Comarsa site in Neuquén city before the provincial transfer plan, and a further 31,000 cubic meters in biopiles awaits treatment. Because of this backlog, operators face higher costs and stricter audits. Treaters respond by adding plants near Añelo, at least 8 km from urban areas.
How does contract oversight affect service quality?
Large collection contracts require close control of equipment and frequencies, which tests city audit capacity. An audit approved in 2025 found that hundreds of containers bought for the City of Buenos Aires in 2023 sat in depots instead of streets, Economía Sustentable reported. As a result, residents can see weaker service even when budgets rise. Cities respond with quality indexes, GPS tracking and payment deductions linked to measured performance.
Greater Buenos Aires leads while Patagonia grows fastest
| Region | Value, 2025 (USD billion) | Share, 2025 | CAGR, 2026–2035 |
|---|---|---|---|
| Greater Buenos Aires | 0.48 | 40.0% | 4.94% |
| Central Provinces | 0.37 | 31.0% | 5.24% |
| Northern and Western Provinces | 0.25 | 21.0% | 5.44% |
| Patagonia | 0.10 | 8.0% | 6.24% |
Why does the capital region hold the largest share?
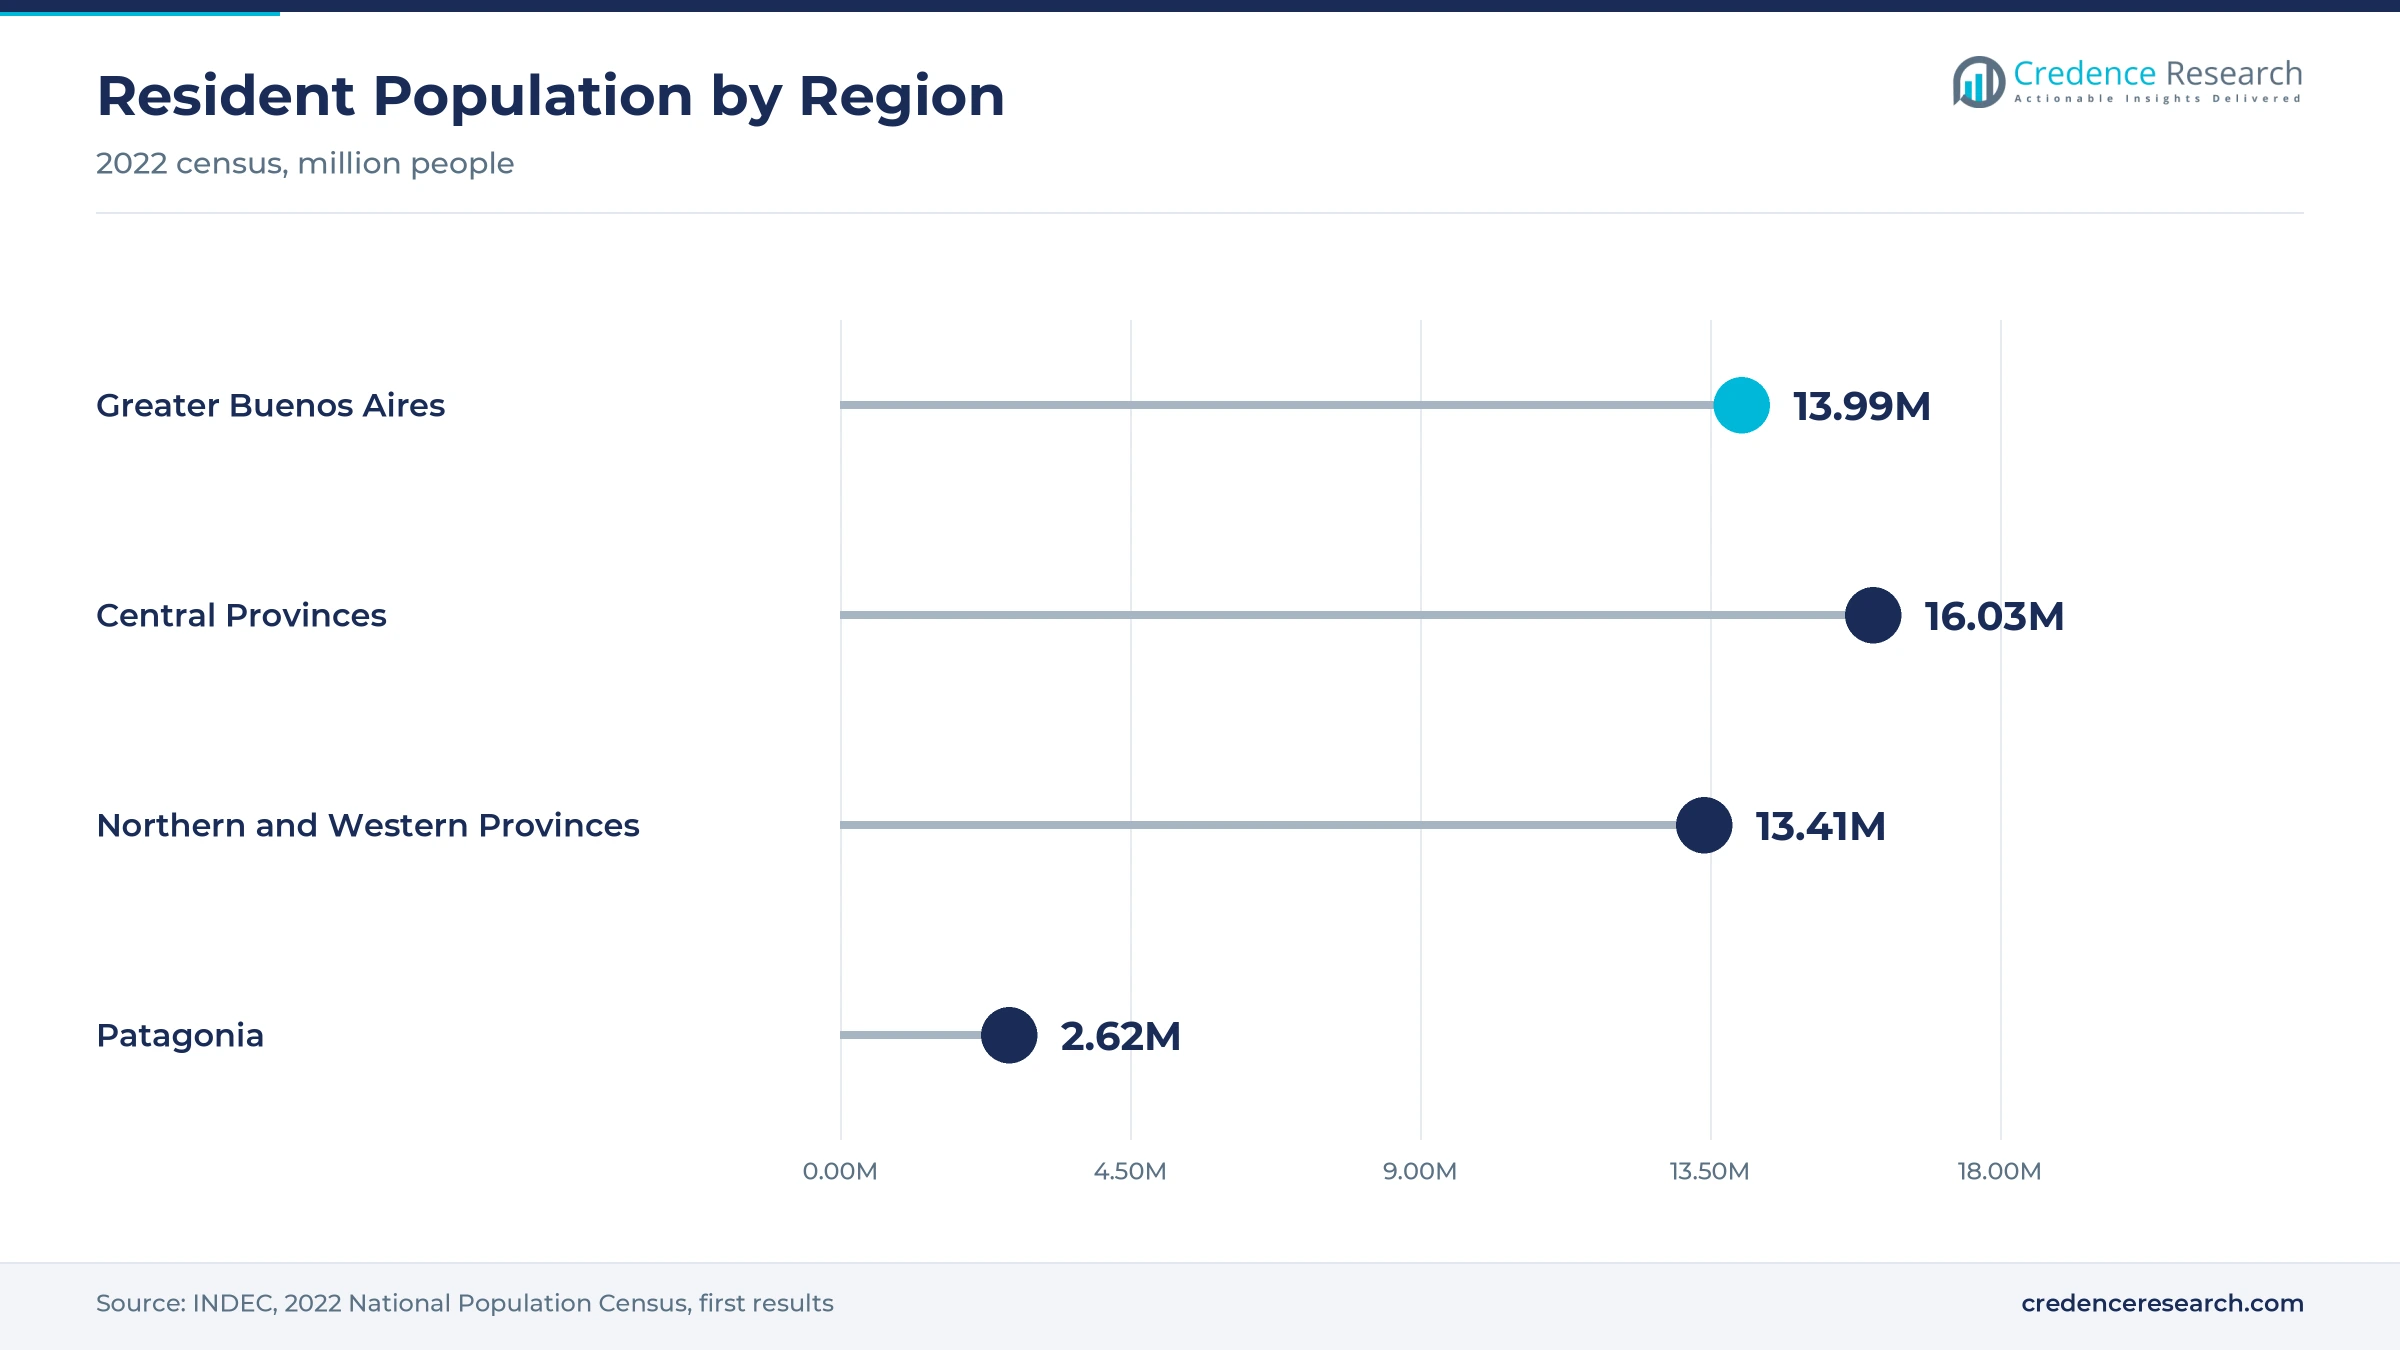
Greater Buenos Aires held 40.0% of 2025 value and grows at 4.94% a year, because the capital and its 24 suburban districts pay for daily collection and landfill access. The region had about 13.99 million residents in the 2022 census, including 3.12 million in the City of Buenos Aires. The city manages about 5,800 metric tons of refuse a day, and CEAMSE disposes of refuse from the city and more than 40 municipalities. In turn, the region keeps the largest share even as interior provinces grow faster.
How do the Central provinces gain from dump closures?
Central Provinces held a 31.0% share of 2025 value and grow at 5.24% a year, as interior districts of Buenos Aires province, Córdoba and Santa Fe close dumps and add treatment. The region had about 16.03 million residents in the 2022 census, the largest population of the four regions. Luján, in Buenos Aires province, closed its 16-hectare dump in July 2026 and now trucks refuse to CEAMSE. As a result, haulage and disposal spending rise in districts that once dumped refuse locally.
Why is Patagonia growing fastest in residue treatment?
Patagonia held 8.0% of 2025 value and grows fastest at 6.24% a year, because Vaca Muerta drilling produces large volumes of cuttings and flowback. The five southern provinces had about 2.62 million residents in the 2022 census, yet the region hosts the largest cluster of oilfield treatment plants near Añelo. Demand for oilfield services brings residue treatment contracts with it. Neuquén city also renewed its collection, sweeping and cleaning contract with a Cliba and Tecsan joint venture in June 2025.
What shapes service demand in the northern and western provinces?
Northern and Western Provinces held 21.0% of 2025 value and grow at 5.44% a year, as provinces replace dumps with regional landfills. The thirteen provinces of the northwest, northeast and Cuyo had about 13.41 million residents in the 2022 census. Misiones is the only province with privatized household collection, and Veolia's AESA Misiones also operates two landfills there, Forbes Argentina reported. As a result, provincial contracts add steady demand for haulage and disposal.
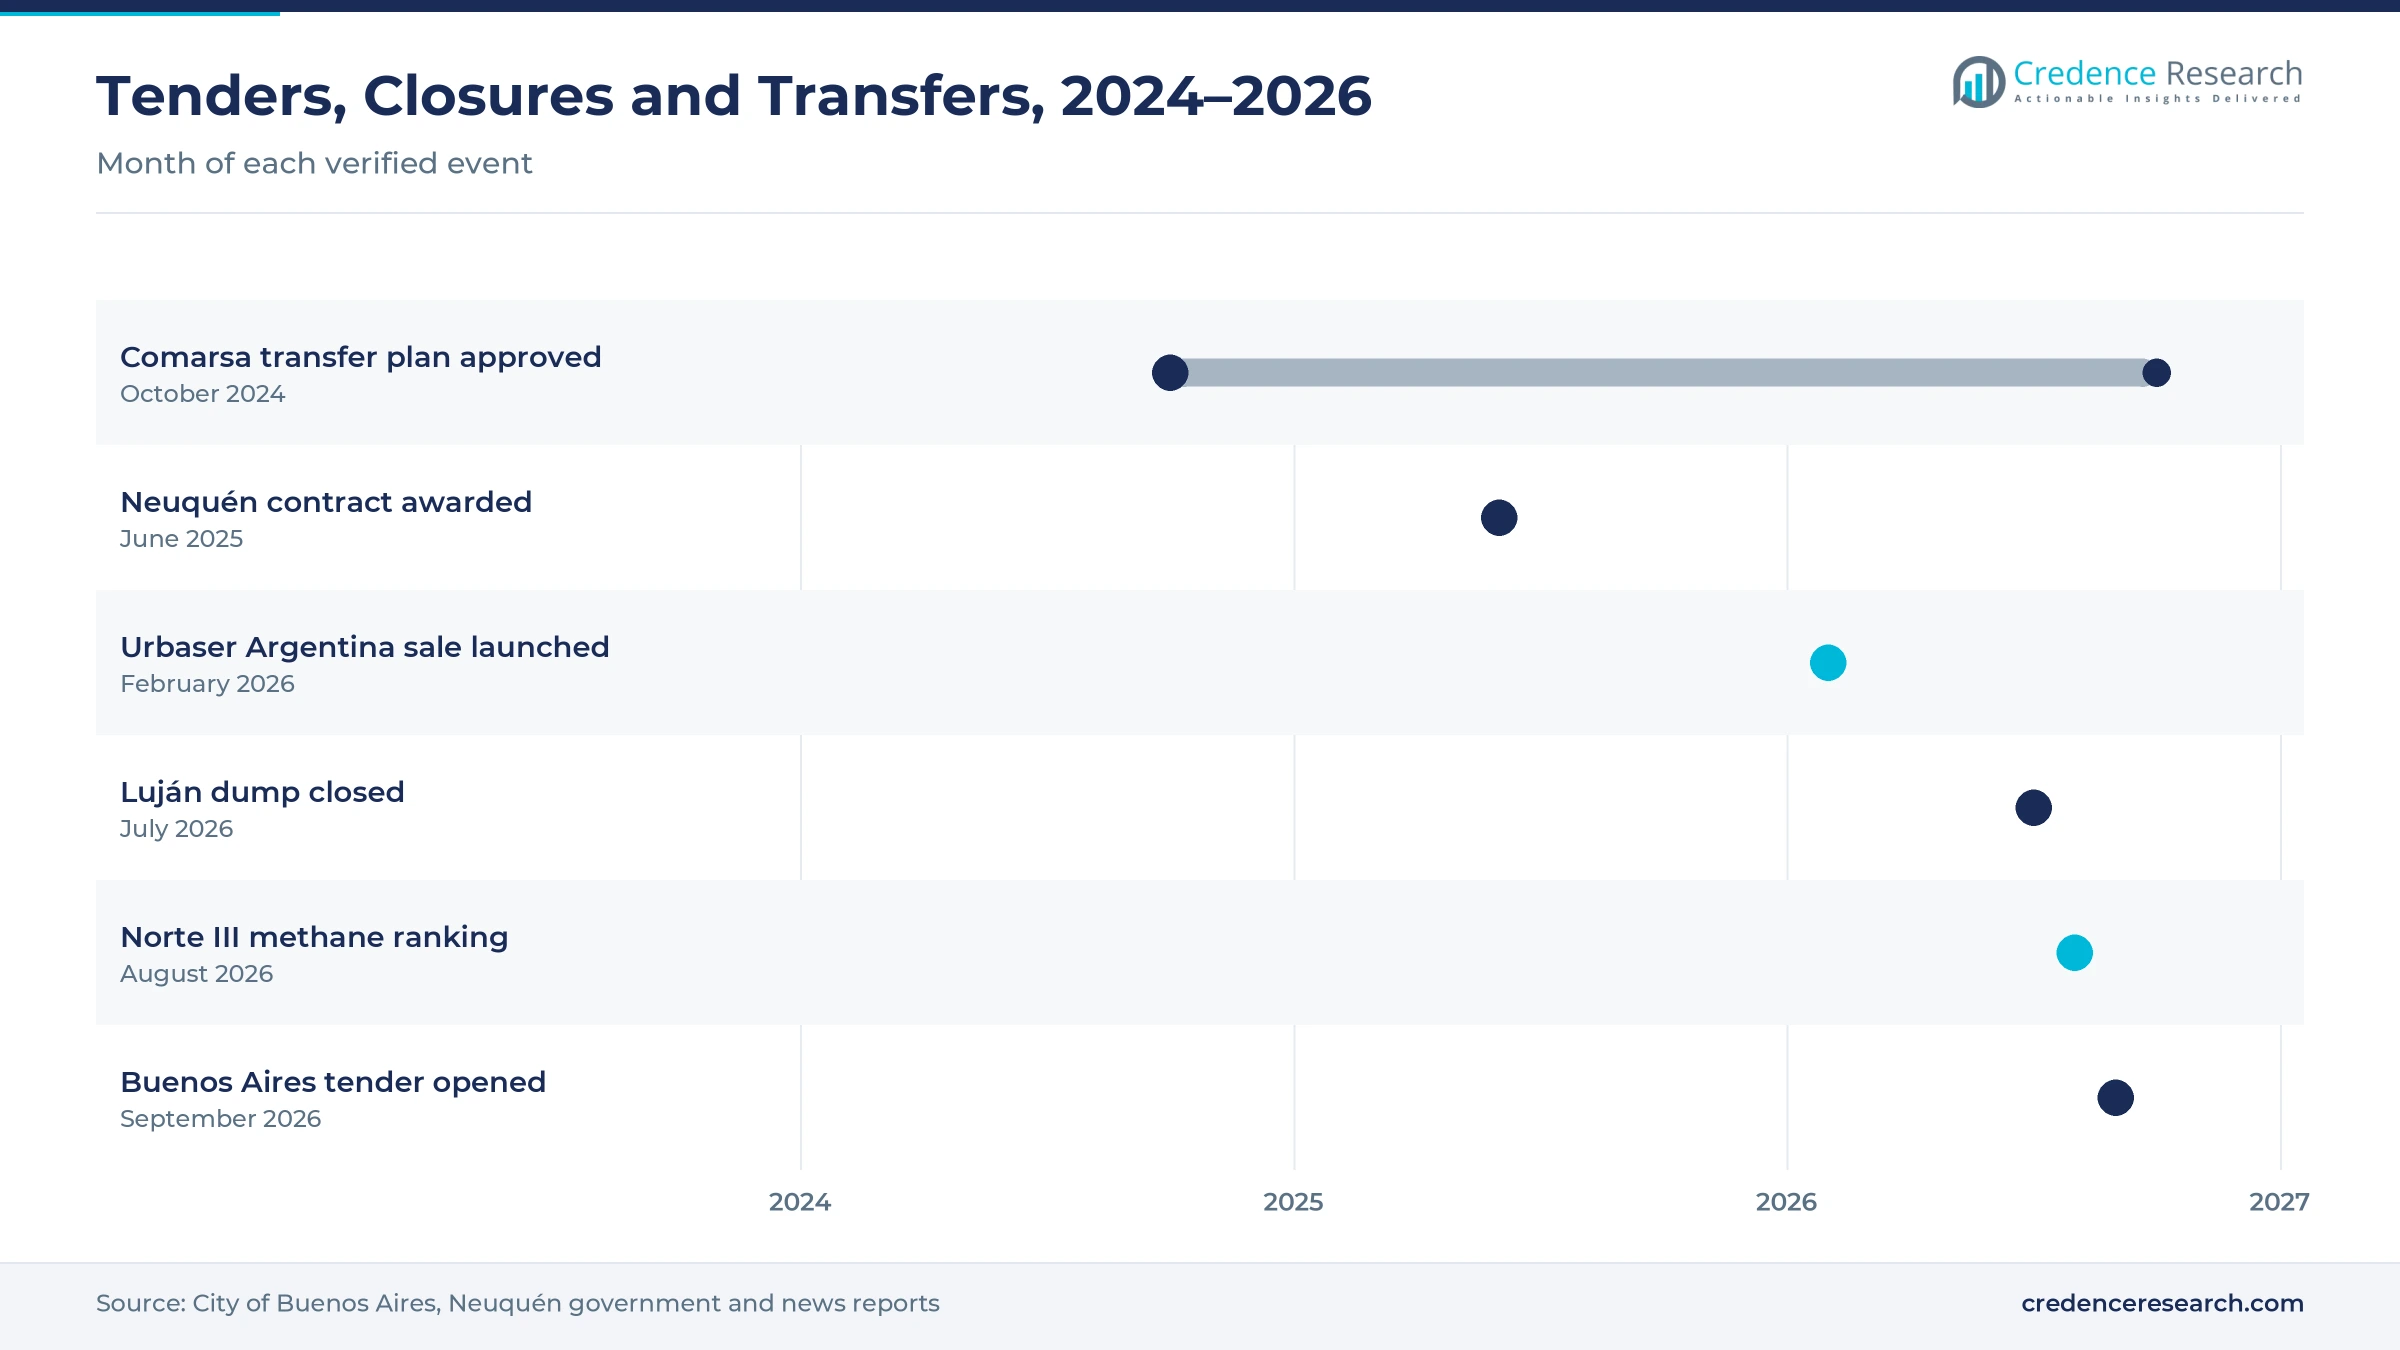
Tenders, closures and ownership changes, 2024–2026
| Development | Status and market relevance |
|---|---|
| In October 2024, Neuquén approved a 24-month plan to move 210,000 cubic meters of oilfield residues from the Comarsa site to a treatment plant in Añelo. | Transfers began May 2025 |
| In June 2025, Neuquén awarded its collection, sweeping and cleaning service to a Cliba and Tecsan joint venture for eight years. | Renewed a contract in force since 2016 |
| In February 2026, Platinum Equity hired Banco Santander to sell Urbaser Argentina, which employs about 3,500 workers. | Sale process under way |
| In July 2026, Luján closed its 16-hectare open dump and began sending all household refuse to CEAMSE. | Ended more than 50 years of dumping |
| In September 2026, the City of Buenos Aires published Decree 304/26, opening a 10-year collection tender in eight zones. | Public hearing held Oct. 5, 2026 |
Sorting plants, digital manifests and satellite methane
- Materials recovery facilities sort dry recyclables on conveyor lines, and 3 of the 16 green centers in the City of Buenos Aires use this technology.
- Mechanical biological treatment separates recoverable fractions before burial, and the Norte III plant processes up to 1,100 metric tons a day.
- Electronic waste manifests track special residues from generator to treater, because Neuquén made the electronic manifest mandatory for carriers and operators in 2021.
- Satellite methane detection measures plumes over landfills from orbit, as the Tanager-1 satellite and the NASA EMIT instrument did for 707 sites.
Need a Custom Version of This Report?
Tailor the scope, geography, or segments to your exact requirements.
- Custom geography or segment scope
- Direct access to our analyst team
Disposal company, urban contractors and treaters compete
Competition is split between a public disposal company, private urban contractors and specialist treaters. CEAMSE runs the metropolitan landfill complexes that serve the capital and more than 40 municipalities. Cliba, controlled by Benito Roggio Ambiental, collects refuse in three communes of the City of Buenos Aires and, with Tecsan, serves Neuquén city. Urbaser Argentina takes part in the Urbasur venture that serves two communes, while AESA, part of Veolia Argentina, serves Commune 1. Veolia Argentina also runs eight treatment plants and two landfills. Rivals compete on fleet size, permits, landfill access and price, because public tenders demand proven experience. Contractors that renew their collection truck fleets and add sorting capacity are best placed for the next round of city tenders.
Which operators lead disposal, collection and treatment?
| Company | Type | Role in the market |
|---|---|---|
| CEAMSE | Public disposal company | Runs Norte III, which takes about 85% of the 436,325 metric tons a month CEAMSE receives |
| Cliba | Urban collection contractor | Serves three City of Buenos Aires communes and Neuquén city with Tecsan |
| Tecsan | Collection and landfill contractor | Joint venture partner on the eight-year Neuquén contract awarded in June 2025 |
| Veolia Argentina | Collection and treatment group | Eight treatment plants, two landfills and drill cuttings treatment in Añelo |
| Urbaser Argentina | Urban collection contractor | About 3,500 workers, with its Argentine unit offered for sale in 2026 |
Credence Research view on Argentine disposal reform
Credence Research's view is that Argentina waste management spending will grow steadily because dump closures, shale residues and formal recycling add paid volume at the same time. Collection remains the largest value pool, while recovery services add the fastest growth as cities fund sorting plants and fuel production. Operators with landfill access, treatment permits near Añelo and experience in quality-linked contracts should gain share. Methane scrutiny and tender disputes will test incumbents, while ownership changes could bring new capital into urban collection fleets.
How the national collection and disposal estimate was built
The report uses 2025 as the base year on a calendar basis, and market values come from the Credence Research model. That model combines census population, per capita generation estimates, landfill intake data, provincial residue statistics, tender documents and company disclosures. Segment splits and regional shares and growth rates are Credence Research estimates. Sources used are government agencies, official statistics, news reports and company publications, and no interviews or surveys were used.
Engineered disposal and formal recovery carry growth
Value across the Argentina waste management market is expected to reach USD 2.02 billion by 2035, a 5.25% CAGR during 2026–2035, as engineered disposal replaces open dumps and recovery becomes a paid service. Growth should be strongest in Patagonia, where shale residues need licensed treatment near the wells. Collection will keep the largest share, while recovery services gain ground through green centers and fuel from residues. The new Buenos Aires tender will set contract terms for the next decade, and operators with landfills, permits and sorting capacity should gain the most.
Frequently Asked Questions
How big is the Argentina waste management market?
Which service type leads collection and disposal spending?
Which region leads waste service spending in Argentina?
How much household refuse does Argentina generate?
What is the new Buenos Aires collection tender?
Why are oilfield residues a growing service line?
Which companies lead collection and disposal in Argentina?
What are the main challenges for Argentine operators?
Table of Content
Chapter 1 Market Segmentation
- 1.1 Segmentation Framework
- 1.1.1 Product and Service Classification
- 1.1.2 Application and End-Use Classification
- 1.1.3 Technology and Solution Classification
- 1.1.4 Customer and Distribution Channel Classification
- 1.1.5 Geographic Segmentation
- 1.1.6 Market Segment Definitions and Boundaries
- 1.2 By Service Type
- 1.2.1 Collection and Logistics
- 1.2.2 Treatment and Disposal
- 1.2.3 Resource Recovery
- 1.2.4 Municipal Service Operations
- 1.3 By Customer Type
- 1.3.1 Municipal Authorities
- 1.3.2 Private Waste Generators
- 1.3.3 Public Institutions
- 1.4 By End-Use Industry
- 1.4.1 Residential Communities
- 1.4.2 Commerce and Public Facilities
- 1.4.3 Production Industries
- 1.5 By Sales Channel
- 1.5.1 Public Procurement
- 1.5.2 Direct Corporate Contracting
- 1.5.3 Operator Subcontracting
Chapter 2 Introduction
- 2.1 Report Objectives and Scope
- 2.2 Product Definition and Industry Terminology
- 2.3 Market Inclusions and Exclusions
- 2.4 Research Process
- 2.4.1 Primary Research and Expert Interviews
- 2.4.2 Secondary Research and Source Review
- 2.4.3 Top-Down and Bottom-Up Estimation
- 2.4.4 Data Triangulation and Verification
- 2.5 Market Size Measurement Basis
- 2.5.1 2025: USD 1.20 billion → 2035: USD 2.02 billion
- 2.6 Historical and Forecast Reference Periods
- 2.6.1 Historical Period: 2018-2025
- 2.6.2 Base Year: 2025
- 2.6.3 Forecast Period: 2025-2035
- 2.7 Research Assumptions and Limitations
Chapter 3 Executive Summary
- 3.1 Market Snapshot and Key Findings
- 3.2 Base-Year Market Size, 2025
- 3.3 Forecast Market Size, 2035
- 3.4 Revenue and Volume Growth Outlook
- 3.5 Key Demand and Supply Indicators
- 3.6 Leading Market Segments
- 3.7 Fastest-Growing Market Opportunities
- 3.8 Regional Performance Highlights
- 3.9 Technology and Industry Transformation
- 3.10 Competitive Landscape Summary
- 3.11 Analyst View and Strategic Implications
Chapter 4 Argentina Waste Management Market Trends and Developments
- 4.1 Historical Industry Development, 2018-2025
- 4.2 Recent Market Trends and Developments
- 4.3 Demand and Customer Behavior Trends
- 4.4 Technology and Product Innovation
- 4.5 Artificial Intelligence, Automation and Digitalization
- 4.6 Local Manufacturing and Supply Chain Realignment
- 4.7 Industry Partnerships, Mergers and Acquisitions
- 4.8 Sustainability and Circular Economy Developments
- 4.9 Government and Private Sector Investment Trends
- 4.10 Emerging Business Models and Commercialization
- 4.11 Industry Developments and Announcements
Chapter 5 Argentina Waste Management Market Production, Supply and Demand Analysis
- 5.1 Demand Trend and Consumption Analysis, 2018-2025
- 5.2 Demand Forecast, 2025-2035
- 5.3 Production and Output Trend, 2018-2025
- 5.4 Production and Output Forecast, 2025-2035
- 5.5 Installed Capacity and Capacity Utilization
- 5.6 Company-Wise Production Plants and Statistics
- 5.6.1 Installed Production Capacity
- 5.6.2 Actual Production
- 5.6.3 Planned Capacity and Expansion Targets
- 5.7 Supply Chain Structure and Procurement Trends
- 5.8 Supply-Demand Gap and Bottlenecks
- 5.9 Import Dependence and Sourcing Structure
- 5.10 Contract Manufacturing and Outsourcing
- 5.11 Regional Supply and Demand Concentration
Chapter 6 Argentina Waste Management Market Pricing Analysis
- 6.1 Pricing Structure and Measurement
- 6.2 Historical Pricing Trends, 2018-2025
- 6.3 Pricing Outlook, 2025-2035
- 6.4 Average Selling Price and Unit Economics
- 6.5 Pricing by Product and Market Segment
- 6.6 Geographic Pricing Differences
- 6.7 Key Input, Energy, Labor and Logistics Costs
- 6.8 Contract Pricing and Purchasing Models
- 6.9 Pricing Sensitivity and Competitive Positioning
- 6.10 Price, Margin and Profitability Implications
Chapter 7 Argentina Waste Management Market Dynamics
- 7.1 Market Growth Drivers
- 7.1.1 Demand-Side Drivers
- 7.1.2 Technology and Innovation Drivers
- 7.1.3 Infrastructure and Investment Drivers
- 7.1.4 Regulatory and Policy Drivers
- 7.2 Market Restraints
- 7.2.1 Cost and Affordability Constraints
- 7.2.2 Technology and Adoption Barriers
- 7.2.3 Supply Chain and Operational Constraints
- 7.3 Market Challenges
- 7.3.1 Competitive Pressure and Margin Erosion
- 7.3.2 Skills, Infrastructure and Implementation Gaps
- 7.4 Emerging Market Opportunities
- 7.5 Market Dynamics Impact and Time-Horizon Assessment
Chapter 8 Argentina Waste Management Value Chain Analysis
- 8.1 Industry Value Chain Overview
- 8.2 Upstream Suppliers and Critical Inputs
- 8.3 Technology and Component Providers
- 8.4 Manufacturing or Service Delivery
- 8.5 Distribution, Channel Partners and Integrators
- 8.6 Downstream Applications and End Users
- 8.7 Value Addition and Profit Pools
- 8.8 Vertical Integration and Outsourcing
- 8.9 Supplier Concentration and Risk
- 8.10 Supply Chain Localization and Resilience
Chapter 9 Argentina Waste Management Market Regulations and Policies
- 9.1 Relevant Laws, Standards and Compliance Frameworks
- 9.2 Product, Service, Safety and Quality Requirements
- 9.3 Government Policies, Incentives and Subsidies
- 9.4 Imports, Exports and Trade Barriers
- 9.5 Public Procurement and Local Content Requirements
- 9.6 Environmental and Sustainability Compliance
- 9.7 Upcoming Policy Changes and Market Implications
Chapter 10 Argentina Waste Management Market Hotspots and Opportunities
- 10.1 Market Opportunity Mapping and Growth Hotspots
- 10.2 High-Growth Applications and Customer Groups
- 10.3 Underserved Markets and White-Space Opportunities
- 10.4 Emerging Technology and Product Opportunities
- 10.5 New Capacity and Investment Hotspots
- 10.6 Market Entry and Expansion Opportunities
- 10.7 Distribution and Partnership Opportunities
- 10.8 Near-Term and Long-Term Commercial Potential
- 10.9 Opportunity Attractiveness and Execution Risks
Chapter 11 Argentina Waste Management Market Outlook, 2025-2035
- 11.1 Market Size and Analysis
- 11.1.1 Revenue (Market Measurement: 2025: USD 1.20 billion → 2035: USD 2.02 billion)
- 11.1.2 Market Volume and Quantity Sold
- 11.1.3 Historical Market Size, 2018-2025
- 11.1.4 Base-Year Market Size, 2025
- 11.2 Market Forecast, 2025-2035
- 11.2.1 Revenue Forecast to 2035
- 11.2.2 Volume Forecast to 2035
- 11.2.3 CAGR and Year-on-Year Growth
- 11.2.4 Incremental Revenue Opportunity
- 11.3 Forecast Assumptions and Scenario Analysis
- 11.3.1 Base-Case Forecast
- 11.3.2 Optimistic and Conservative Scenarios
- 11.3.3 Technology, Pricing and Policy Sensitivities
- 11.4 Market Attractiveness and Growth Outlook
Chapter 12 Argentina Waste Management Market Segmentation and Outlook
- 12.1 Segmentation Summary and Market Shares, 2025
- 12.2 Largest and Fastest-Growing Segments
- 12.3 By Service Type - Market Size and Forecast, 2025-2035
- 12.3.1 Segment Definition and Scope
- 12.3.2 Historical Market Size, 2018-2025
- 12.3.3 Revenue Forecast, 2025-2035
- 12.3.4 Volume Forecast, 2025-2035
- 12.3.5 Base-Year Market Share, 2025
- 12.3.6 Segment CAGR and Growth Drivers
- 12.3.7 Subsegment Market Size and Forecast
- 12.3.7.1 Collection and Logistics
- 12.3.7.2 Treatment and Disposal
- 12.3.7.3 Resource Recovery
- 12.3.7.4 Municipal Service Operations
- 12.3.8 Subsegment Pricing and Adoption Trends
- 12.3.9 Leading Suppliers and Competition
- 12.3.10 Regional Demand and Opportunities
- 12.4 By Customer Type - Market Size and Forecast, 2025-2035
- 12.4.1 Segment Definition and Scope
- 12.4.2 Historical Market Size, 2018-2025
- 12.4.3 Revenue Forecast, 2025-2035
- 12.4.4 Volume Forecast, 2025-2035
- 12.4.5 Base-Year Market Share, 2025
- 12.4.6 Segment CAGR and Growth Drivers
- 12.4.7 Subsegment Market Size and Forecast
- 12.4.7.1 Municipal Authorities
- 12.4.7.2 Private Waste Generators
- 12.4.7.3 Public Institutions
- 12.4.8 Subsegment Pricing and Adoption Trends
- 12.4.9 Leading Suppliers and Competition
- 12.4.10 Regional Demand and Opportunities
- 12.5 By End-Use Industry - Market Size and Forecast, 2025-2035
- 12.5.1 Segment Definition and Scope
- 12.5.2 Historical Market Size, 2018-2025
- 12.5.3 Revenue Forecast, 2025-2035
- 12.5.4 Volume Forecast, 2025-2035
- 12.5.5 Base-Year Market Share, 2025
- 12.5.6 Segment CAGR and Growth Drivers
- 12.5.7 Subsegment Market Size and Forecast
- 12.5.7.1 Residential Communities
- 12.5.7.2 Commerce and Public Facilities
- 12.5.7.3 Production Industries
- 12.5.8 Subsegment Pricing and Adoption Trends
- 12.5.9 Leading Suppliers and Competition
- 12.5.10 Regional Demand and Opportunities
- 12.6 By Sales Channel - Market Size and Forecast, 2025-2035
- 12.6.1 Segment Definition and Scope
- 12.6.2 Historical Market Size, 2018-2025
- 12.6.3 Revenue Forecast, 2025-2035
- 12.6.4 Volume Forecast, 2025-2035
- 12.6.5 Base-Year Market Share, 2025
- 12.6.6 Segment CAGR and Growth Drivers
- 12.6.7 Subsegment Market Size and Forecast
- 12.6.7.1 Public Procurement
- 12.6.7.2 Direct Corporate Contracting
- 12.6.7.3 Operator Subcontracting
- 12.6.8 Subsegment Pricing and Adoption Trends
- 12.6.9 Leading Suppliers and Competition
- 12.6.10 Regional Demand and Opportunities
- 12.7 Segment Growth Comparison
- 12.8 Segment Attractiveness and Priority Matrix
Chapter 13 Argentina Waste Management End-Use and Application Market Outlook
- 13.1 End-Use Industry and Customer Demand Structure
- 13.2 Leading Applications and Customer Groups
- 13.3 End-Use Market Size, Share and Forecast
- 13.4 Major End-Use Industry Deep Dives
- 13.4.1 Customer Requirements and Use Cases
- 13.4.2 Demand and Replacement Cycles
- 13.4.3 Technical and Regulatory Considerations
- 13.4.4 Purchasing and Procurement Models
- 13.4.5 Leading Vendors and Distribution Channels
- 13.4.6 Forecast and Commercial Opportunities
- 13.5 Emerging Applications and Cross-Segment Demand
- 13.6 End-Use Industry Investment Priorities
Chapter 14 Argentina Waste Management Geographic Market Outlook, 2025-2035
- 14.1 Domestic Market Distribution and Demand Clusters
- 14.2 State- or Province-Wise Market Size and Forecast, 2025-2035
- 14.3 City and Metropolitan Market Outlook
- 14.4 Industrial, Manufacturing and Commercial Clusters
- 14.5 Geographic Concentration of Key End Users
- 14.6 Local Pricing and Purchasing Differences
- 14.7 Domestic Production Facilities and Capacity Map
- 14.8 Local Infrastructure and Project Pipeline
- 14.9 State-Level Policy and Incentive Differences
- 14.10 Subnational Investment Hotspots and Opportunities
- 14.11 Distribution and Logistics Networks
- 14.12 Domestic Competitive Footprint
Chapter 15 Argentina Waste Management Technology, Innovation and Sustainability Outlook
- 15.1 Technology Landscape and Maturity
- 15.2 Product, Process and Service Innovation
- 15.3 AI, Automation and Digital Tools in the Industry
- 15.4 Technology Adoption and Performance Benchmarking
- 15.5 Innovation Pipeline and R&D Investment
- 15.6 Patent and Intellectual Property Trends
- 15.7 Energy Efficiency and Resource Management
- 15.8 Sustainability, Recycling and Circularity
- 15.9 Technology Roadmap, 2025-2035
- 15.10 Risks of Obsolescence and Technology Substitution
Chapter 16 Argentina Waste Management Market Key Strategic Imperatives
- 16.1 Growth and Market Entry Priorities
- 16.2 High-Return Products and Segments
- 16.3 Pricing, Profitability and Cost Optimization
- 16.4 Technology Investment and Product Differentiation
- 16.5 Supply Chain Localization and Resilience
- 16.6 Distribution and Customer Acquisition
- 16.7 Partnership, Acquisition and Capacity Strategy
- 16.8 Regional Expansion Priorities
- 16.9 Short-, Medium- and Long-Term Actions
Chapter 17 Competition Outlook
- 17.1 Industry Competition Characteristics
- 17.2 Market Structure and Concentration
- 17.3 Market Share and Competitive Positioning, 2025
- 17.4 Company-Wise Revenue and Product Benchmarking
- 17.5 Production and Service Capacity Benchmarking
- 17.6 Technology, Pricing and Differentiation
- 17.7 Regional Footprint and Distribution Strength
- 17.8 Mergers, Acquisitions and Strategic Alliances
- 17.9 New Entrants and Competitive Threats
- 17.10 Porter's Five Forces and Industry Attractiveness
- 17.11 Competitive Outlook, 2025-2035
Chapter 18 Company Profiles
- 18.1 Company Coverage and Selection Criteria
- 18.2 CEAMSE
- 18.2.1 Business Description
- 18.2.2 Company Ownership and Geographic Presence
- 18.2.3 Product and Service Portfolio
- 18.2.4 Manufacturing and Operating Footprint
- 18.2.5 Production Capacity and Expansion Plans
- 18.2.6 Financial Performance and Investment
- 18.2.7 Market Share and Competitive Position
- 18.2.8 Technology and Innovation Capabilities
- 18.2.9 Strategic Alliances or Partnerships
- 18.2.10 Recent Developments
- 18.2.11 Growth Strategy and Outlook
- 18.3 Cliba
- 18.4 Tecsan
- 18.5 Veolia Argentina
- 18.6 Urbaser Argentina
- 18.7 Other Relevant Market Participants
Note: Every listed company is profiled on the structure shown under the first company. The company list is preliminary and may change based on research findings, market developments, data availability and client requirements.
Chapter 19 Disclaimer
- 19.1 Research and Forecast Disclaimer
- 19.2 Data Source and Estimation Limitations
Note: The depth of individual sections depends on data availability for this market. Volume, capacity, trade and other unit-based metrics are included where applicable.

