
Low-carbon machines reach Australian building sites
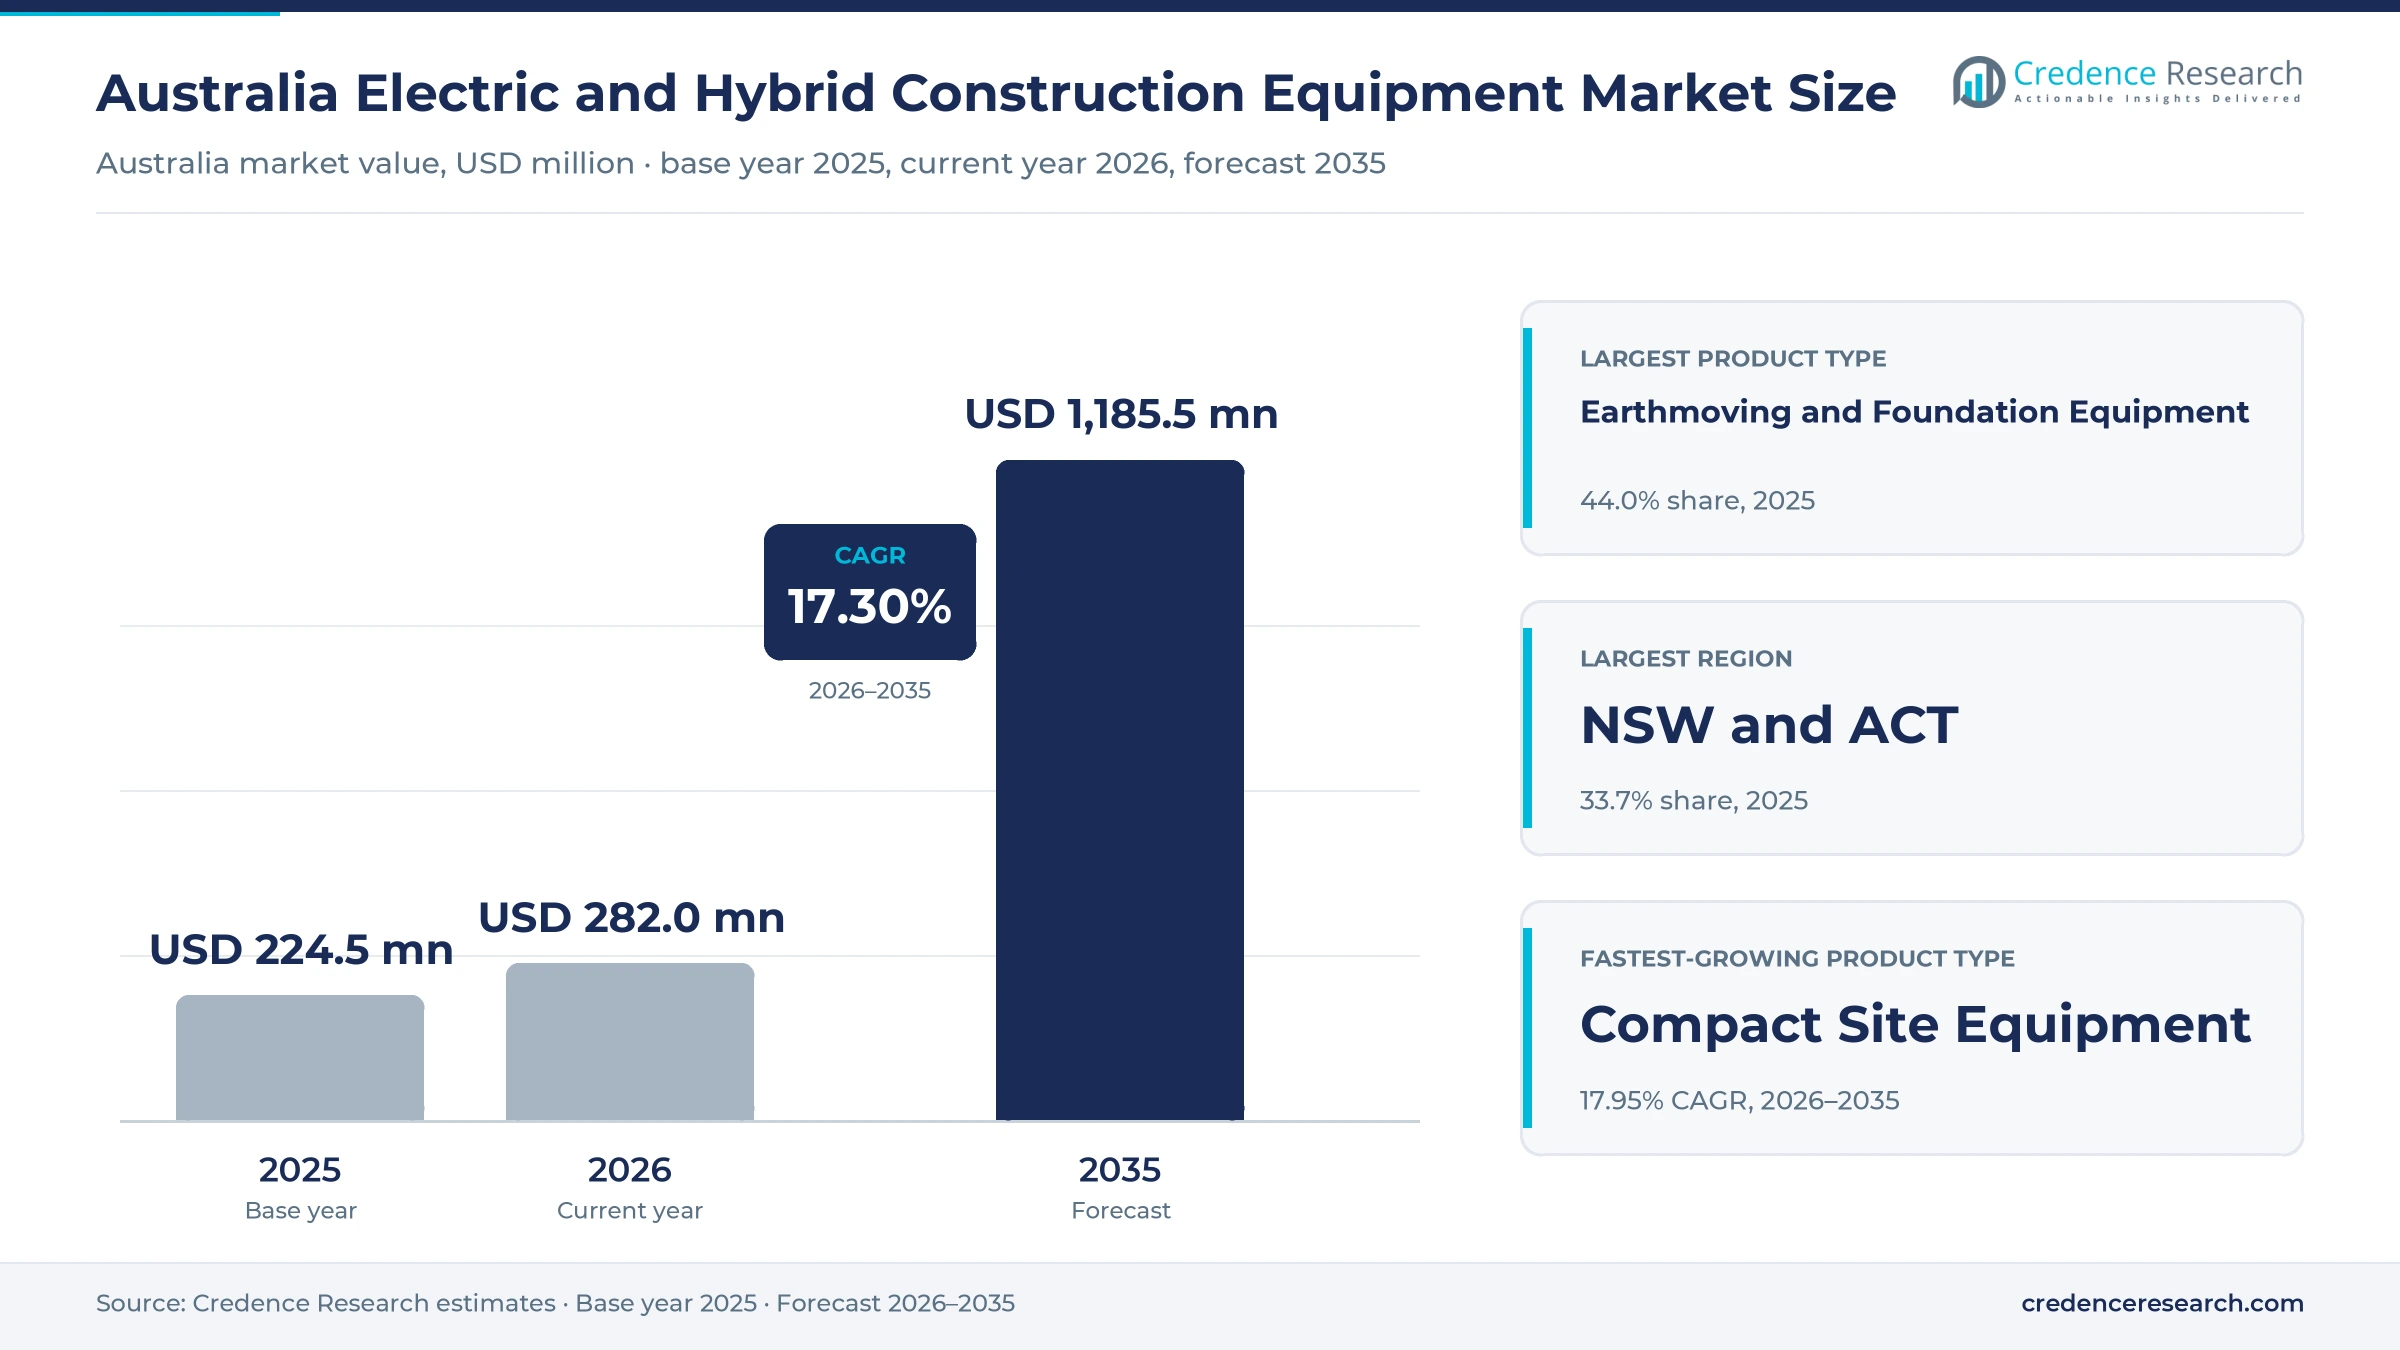
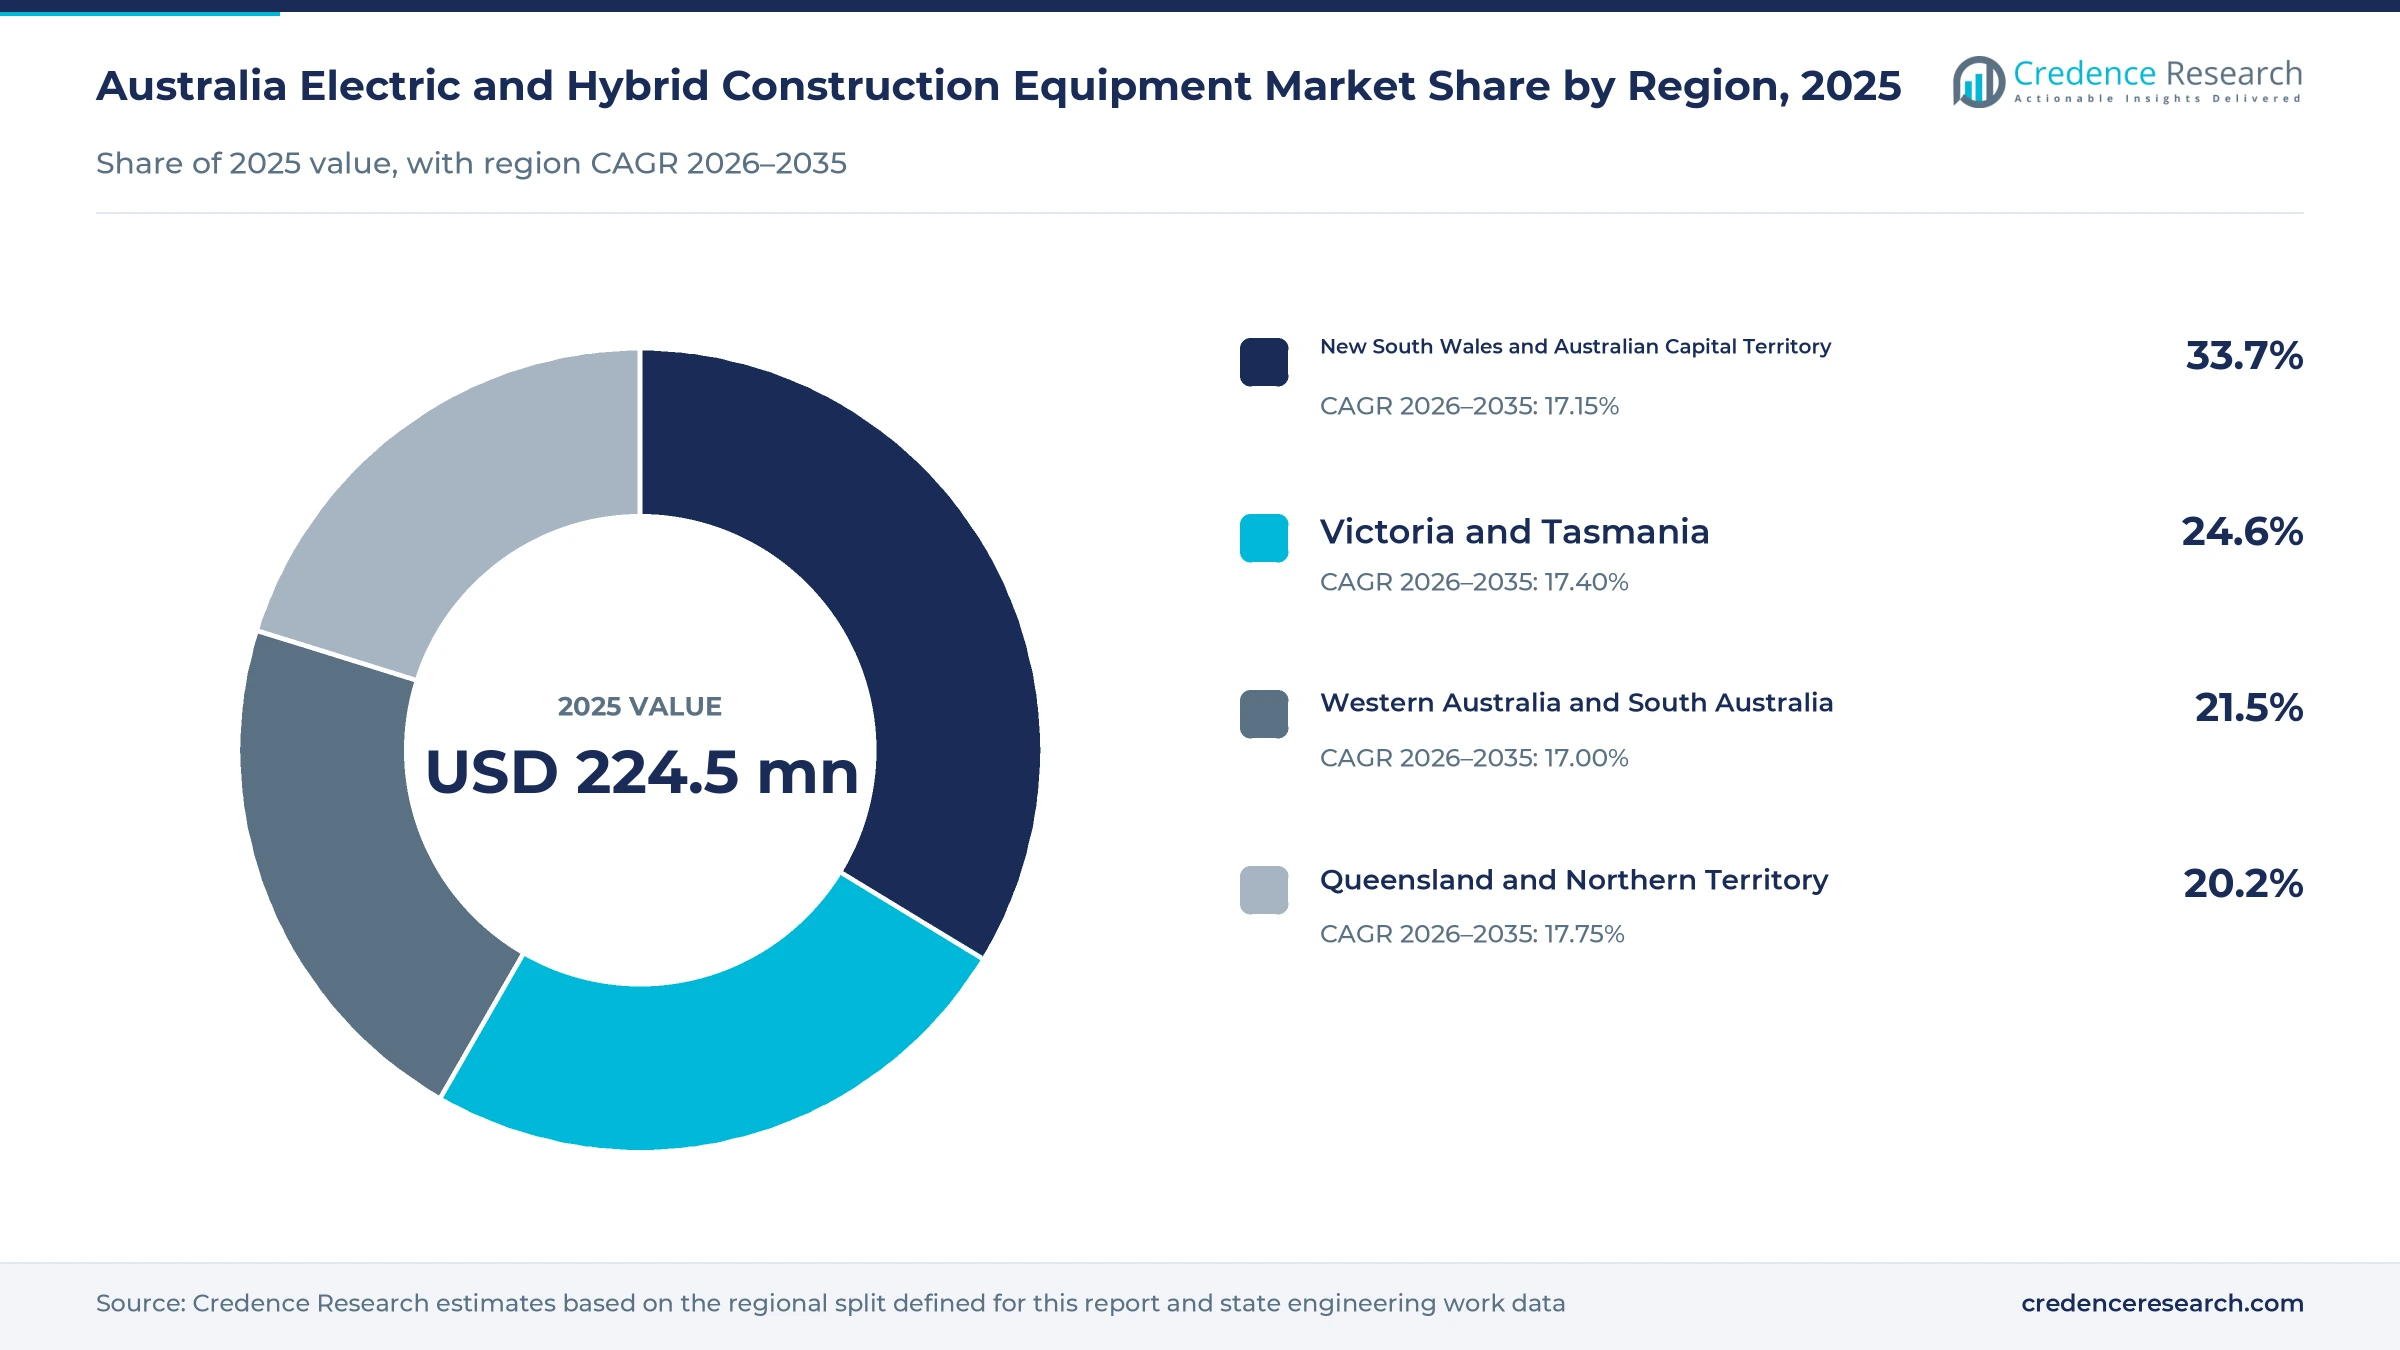
The Australia electric and hybrid construction equipment market was valued at USD 224.5 million in 2025 and is projected to increase from USD 282.0 million in 2026 to USD 1.19 billion by 2035, registering a CAGR of 17.30% during 2026–2035. Demand comes from transport agencies that now count embodied carbon on major projects, from builders working in dense city streets where noise and exhaust limits matter, and from hire companies that add battery machines so contractors can trial them without buying. New South Wales and the Australian Capital Territory held the largest regional share, 33.7% in 2025, because the state set its own carbon policy for public works. Queensland and the Northern Territory is the fastest-growing region at 17.75% a year, as several regional pipelines expand sharply. In turn, model choice has widened, because battery excavators, loaders and booms now come from most major brands, while hybrid excavators regain attention as fuel costs climb.
Which low-carbon machines does the national estimate count?
Spending on new battery-electric and hybrid machines sold or leased in Australia forms the base of this estimate, including excavators, piling rigs, loaders, road machines, telehandlers, booms and compact site machines. It counts the machine with its battery, energy storage system and charger when these are supplied together by a dealer, a manufacturer branch or an equipment integrator.
The estimate excludes diesel-only machines, mining-class haul trucks and shovels, used machine resales, hand-held battery tools and stand-alone site generators. The value chain runs from overseas factories through national distributors and dealers to contractors, hire companies and public asset owners, who buy outright, lease or hire machines by the day.
Australia Electric and Hybrid Construction Equipment Market Insights
- The Australia electric and hybrid construction equipment market was valued at USD 224.5 million in 2025 and is projected to reach USD 1.19 billion by 2035, registering a CAGR of 17.30% during 2026–2035.
- New South Wales and the Australian Capital Territory held a 33.7% share of 2025 value, because the state applies its own embodied carbon policy to public works.
- Earthmoving and foundation equipment led product types with a 44.0% share of 2025 value, because excavators and piling rigs carry the highest unit prices.
- Infrastructure and transport ministers agreed a national method for measuring embodied carbon in transport projects on June 7, 2024, which brings plant emissions into tender scoring.
- Battery-electric equipment grows fastest among technologies at 18.34% a year during 2026–2035, as more brands sell battery excavators, loaders and booms through Australian dealers.
Earthmoving leads while compact battery machines grow
Why does earthmoving equipment hold the largest share?
Based on product type, the market is categorized into Earthmoving and Foundation Equipment, Road Construction Equipment, Material Handling Equipment and Compact Site Equipment. Earthmoving and Foundation Equipment led with a 44.0% share of 2025 value, because excavators and piling rigs carry the highest prices per unit. Compact Site Equipment grows fastest at 17.95% a year, as small battery machines suit city streets and indoor work.
How fast are battery machines replacing hybrids?
Based on technology, the market is categorized into Battery-Electric Equipment, Electromechanical Hybrid Equipment and Hydraulic Hybrid Equipment. Battery-Electric Equipment led with a 52.0% share of 2025 value, because battery booms, scissor lifts and mini excavators sell in large numbers. Battery-Electric Equipment also grows fastest at 18.34% a year, while hybrids keep a place in heavy, fuel-hungry work.
Which kinds of projects use the most low-carbon plant?
Based on application, the market is categorized into Transport Infrastructure, Building Construction and Utilities and Resources Infrastructure. Building Construction led with a 42.0% share of 2025 value, because city residential and commercial building work needs quiet machines near homes and offices. Utilities and Resources Infrastructure grows fastest at 17.98% a year, as transmission and renewable energy works expand across regional areas.
Who buys most battery and hybrid machines?
Based on customer type, the market is categorized into Construction Contractors, Rental Fleet Operators and Public Asset Operators. Rental Fleet Operators led with a 45.0% share of 2025 value, because hire companies let contractors try battery machines without owning them. Rental Fleet Operators also grow fastest at 17.57% a year, as hire fleets add electric booms and compact diggers.
| Segment Group | Leading Sub-segment | Share, 2025 | Fastest-growing Sub-segment | CAGR, 2026–2035 |
|---|---|---|---|---|
| By Product Type | Earthmoving and Foundation Equipment | 44.0% | Compact Site Equipment | 17.95% |
| By Technology | Battery-Electric Equipment | 52.0% | Battery-Electric Equipment | 18.34% |
| By Application | Building Construction | 42.0% | Utilities and Resources Infrastructure | 17.98% |
| By Customer Type | Rental Fleet Operators | 45.0% | Rental Fleet Operators | 17.57% |
Request a Free Sample
Fill in your details and we'll send you a free sample report.
- Sample data tables & charts
- Research methodology
Carbon rules, model choice and pipeline work lift demand
How does carbon-informed procurement change plant choice?
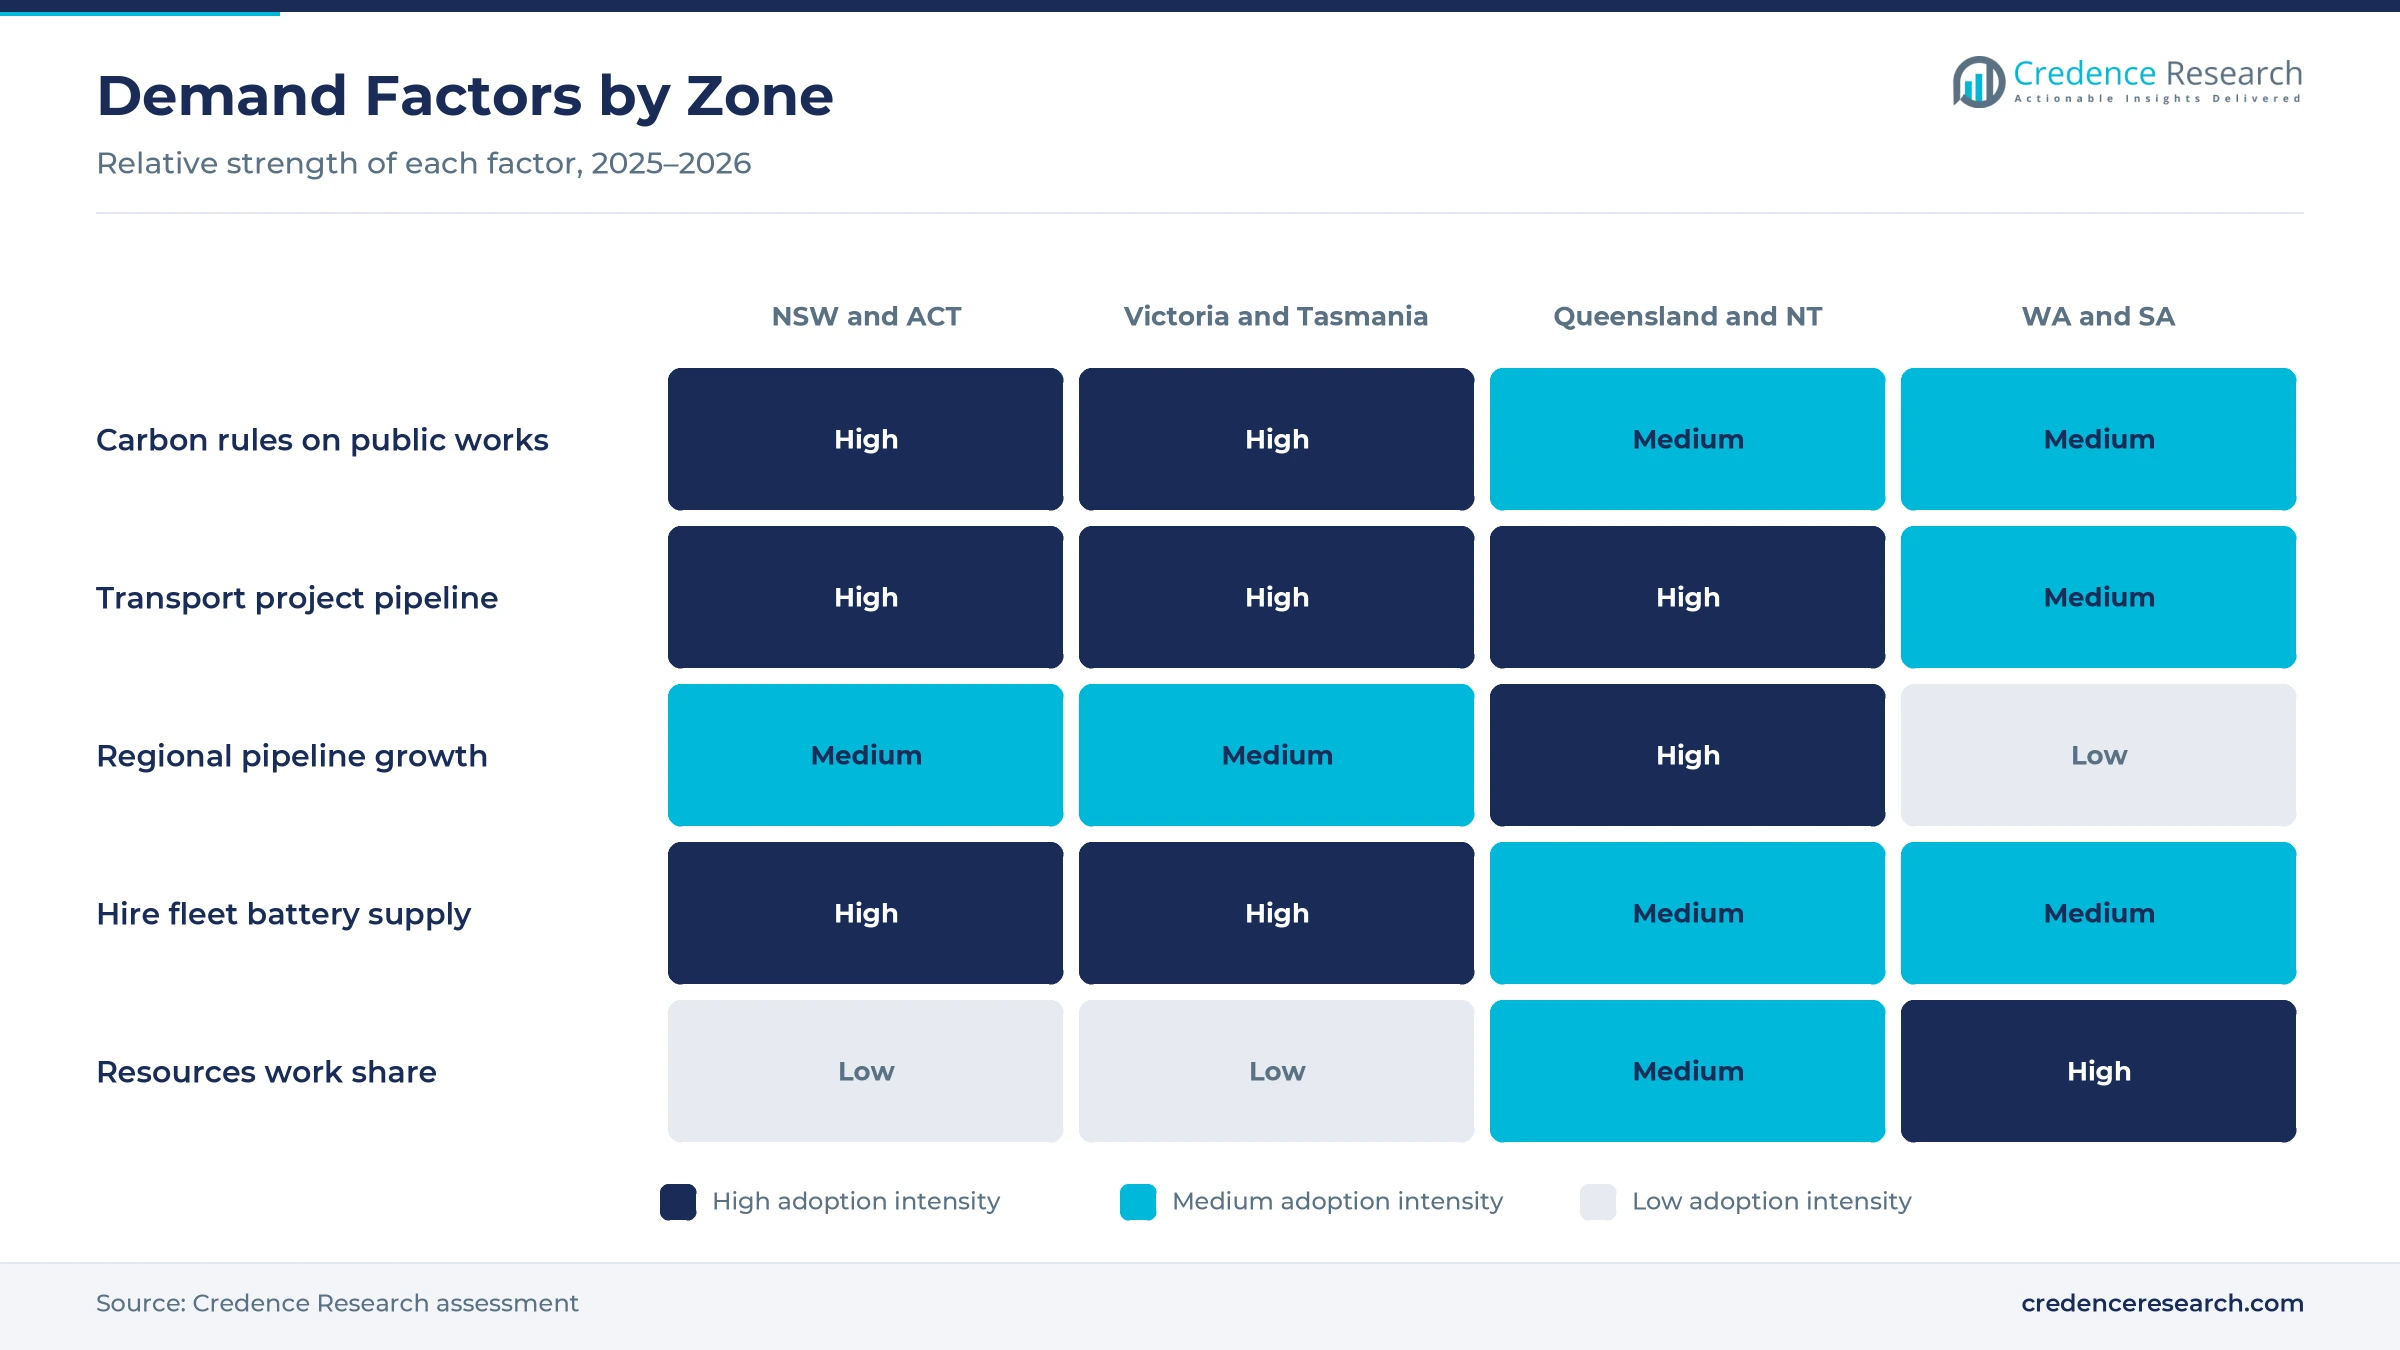
Public owners now ask contractors to measure and cut carbon on major works, which rewards bids that use battery and hybrid plant on site. The Infrastructure and Transport Ministers' Meeting agreed a national method for measuring embodied carbon in transport projects on June 7, 2024. The same meeting gave in-principle support to using carbon values in business cases for transport projects above A$100 million, with an aspirational start date of Jan. 1, 2025. Infrastructure NSW launched its Decarbonising Infrastructure Delivery Policy on April 4, 2024, so state agencies must measure embodied carbon consistently on government projects. As a result, Building Construction and transport works led demand, and Rental Fleet Operators held 45.0% of 2025 value as contractors hired plant for these jobs.
How is wider product choice bringing buyers into the market?
Most major brands now sell battery or hybrid models through Australian dealers, which lets contractors match machines to real jobs instead of waiting for imports. CJD Equipment began selling the Volvo ECR25 Electric excavator and L25 Electric loader in early 2024, and it expected the larger L120 and EC230 electric models in 2025. Semco took delivery of its first Takeuchi TB20e, a 24.7 kWh battery excavator, in May 2024. LiuGong unveiled its 21-metric-ton 856H-E Max battery loader, with a 432 kWh pack, at its Laverton North headquarters in September 2023. In turn, Battery-Electric Equipment led technologies with 52.0% of 2025 value.
Why do infrastructure work and fleet renewal lift demand?
A large public works pipeline forces contractors and hire companies to add or replace machines, and each new purchase becomes a chance to choose battery or hybrid plant. Infrastructure Australia put the five-year Major Public Infrastructure Pipeline at A$242 billion in November 2025, up A$29 billion in a year. Transport accounts for A$129 billion of that pipeline, and utilities spending, including energy transmission, is projected to more than double to A$36 billion. Engineering construction work done reached about A$157 billion over the four quarters to June 2026, according to the Australian Bureau of Statistics. As a result, Utilities and Resources Infrastructure grows fastest among applications at 17.98% a year.
How do fuel costs revive interest in hybrid excavators?
Higher diesel bills push contractors to look again at machines that burn less fuel for the same work. Komatsu Australia cited June 2026 survey data showing that 85% of construction businesses were hurt by fuel prices or availability. The company sells its HB215LC-3 and HB365LC-3 hybrid excavators, which store slewing energy in an ultracapacitor and use it to assist the engine. Divall's Earthmoving in Goulburn reports that its hybrid burns about 8 liters an hour on crushing work, against about 16 liters for a standard machine. In turn, hybrid machines keep a firm place in quarry and civil fleets despite faster battery growth.
Site electrification and hire-led adoption gain ground
Why is whole-site electrification on the rise?
Major contractors now electrify whole worksites rather than single machines, which raises demand for battery plant alongside site batteries and solar power. CPB Contractors reported in July 2026 that its Suburban Rail Loop East team has rolled out electric elevated work platforms since early 2025. The same team trialed a battery plate compactor and installed a mini battery storage system that cut generator runtime by 82%. The project also used a 250-metric-ton electric crawler crane at Heatherton West, which is expected to save about 9,000 liters of diesel. As a result, battery aerial work platforms and compact machines are often the first items on a site plan.
How are mining contractors testing battery diggers?
Large contractors are trialing battery excavators on real production work, which builds evidence that buyers in civil works can use when they compare bids. Thiess ran a fully electric 22-metric-ton Komatsu excavator at Yallourn Mine in Victoria for one month in June 2025. Thiess reported that the trial cut carbon dioxide emissions by about 80 kg a day compared with a diesel unit. Komatsu also placed a PC210LCE electric excavator with an earthworks contractor on demonstration in 2024, while Liebherr supplied the first electric piling rig in Australia. In turn, Earthmoving and Foundation Equipment remains the largest product group with 44.0% of 2025 value.
Can hire fleets open the market for small contractors?
Hire companies have an opening to carry battery risk for smaller firms that cannot justify buying a battery machine for occasional work. Coates launched its Greener Choices range in June 2022, with hybrid, battery-electric and solar models, and it received A$20 million of such equipment in the 2023 financial year. Camden Hire in Western Sydney bought two Genie Z-60/37 FE booms that run on electricity or diesel and suit quiet work at schools, and each weighs 7,686 kg, light enough for a tilt tray. Wacker Neuson lists its EZ17e electric excavator and WL20e electric loader for Australian customers. As a result, plant hire fleets help Rental Fleet Operators grow at 17.57% a year.
Is energy-recovery hydraulics an opening for heavy work?
Hybrid designs that recover energy from repeated swings offer an opening in heavy work, where battery packs still struggle to last a full shift. Komatsu notes that repetitive slewing, such as loading trucks from a stockpile, gives its hybrids more chances to recover energy. Divall's Earthmoving bought Komatsu's first hybrid excavator in Australia in 2008 and still runs hybrid machines, mainly for crushing. Komatsu now offers hybrids in the 23-metric-ton and 38-metric-ton classes, which match the sizes used in quarry and civil work. In turn, demand for energy-recovery excavators keeps fuel savings visible to fleet owners that are not yet ready for battery plant.
Charging, run time and diesel habits slow the switch
How do charging limits slow larger machines?
Battery run time and charging still limit larger machines on remote and long-shift sites. The Volvo L25 Electric loader runs up to about six hours on a full charge, yet needs about six hours on AC power or about 1.5 hours on a DC fast charger. As a result, contractors must plan site power before ordering battery fleets. Suppliers respond with fast chargers, while site teams add batteries and solar power to bridge the gap.
Why does missing diesel engine regulation slow change?
Australia has no national emission standard for non-road diesel engines, which keeps older diesel machines legal and cheap to run. The federal environment department called these engines the largest unregulated source of air pollution in the country during its 2023 consultation. In turn, low-carbon plant must win on tender scoring and running costs rather than on compliance. Buyers that are not bound by carbon rules often stay with diesel for this reason.
How do worker shortages affect machine choice?
Skills shortages slow the adoption of new machine types, because operators and technicians must learn battery safety and charging practice. Infrastructure Australia warned in November 2025 that a shortage of 141,000 workers poses a significant risk to the public pipeline. As a result, contractors often favor familiar diesel machines that existing staff can run and repair. Dealers respond with training and service packages for battery models.
Why does slower engineering work delay fleet renewal?
Periods of weaker engineering activity delay fleet renewal, because contractors stretch the life of existing machines. Engineering construction work done fell 3.7% in the year to the June quarter of 2026 in chain volume terms, according to the Australian Bureau of Statistics. Industry, including construction, added about 23.9% of GDP in 2025, according to the World Bank, down from about 25.5% in 2024. As a result, some buyers delay switching until the next large contract.
New South Wales leads as Queensland grows fastest
| Region | Value, 2025 (USD million) | Share, 2025 | CAGR, 2026–2035 |
|---|---|---|---|
| New South Wales and Australian Capital Territory | 75.7 | 33.7% | 17.15% |
| Victoria and Tasmania | 55.2 | 24.6% | 17.40% |
| Western Australia and South Australia | 48.3 | 21.5% | 17.00% |
| Queensland and Northern Territory | 45.3 | 20.2% | 17.75% |
Why do NSW and the ACT lead low-carbon plant demand?
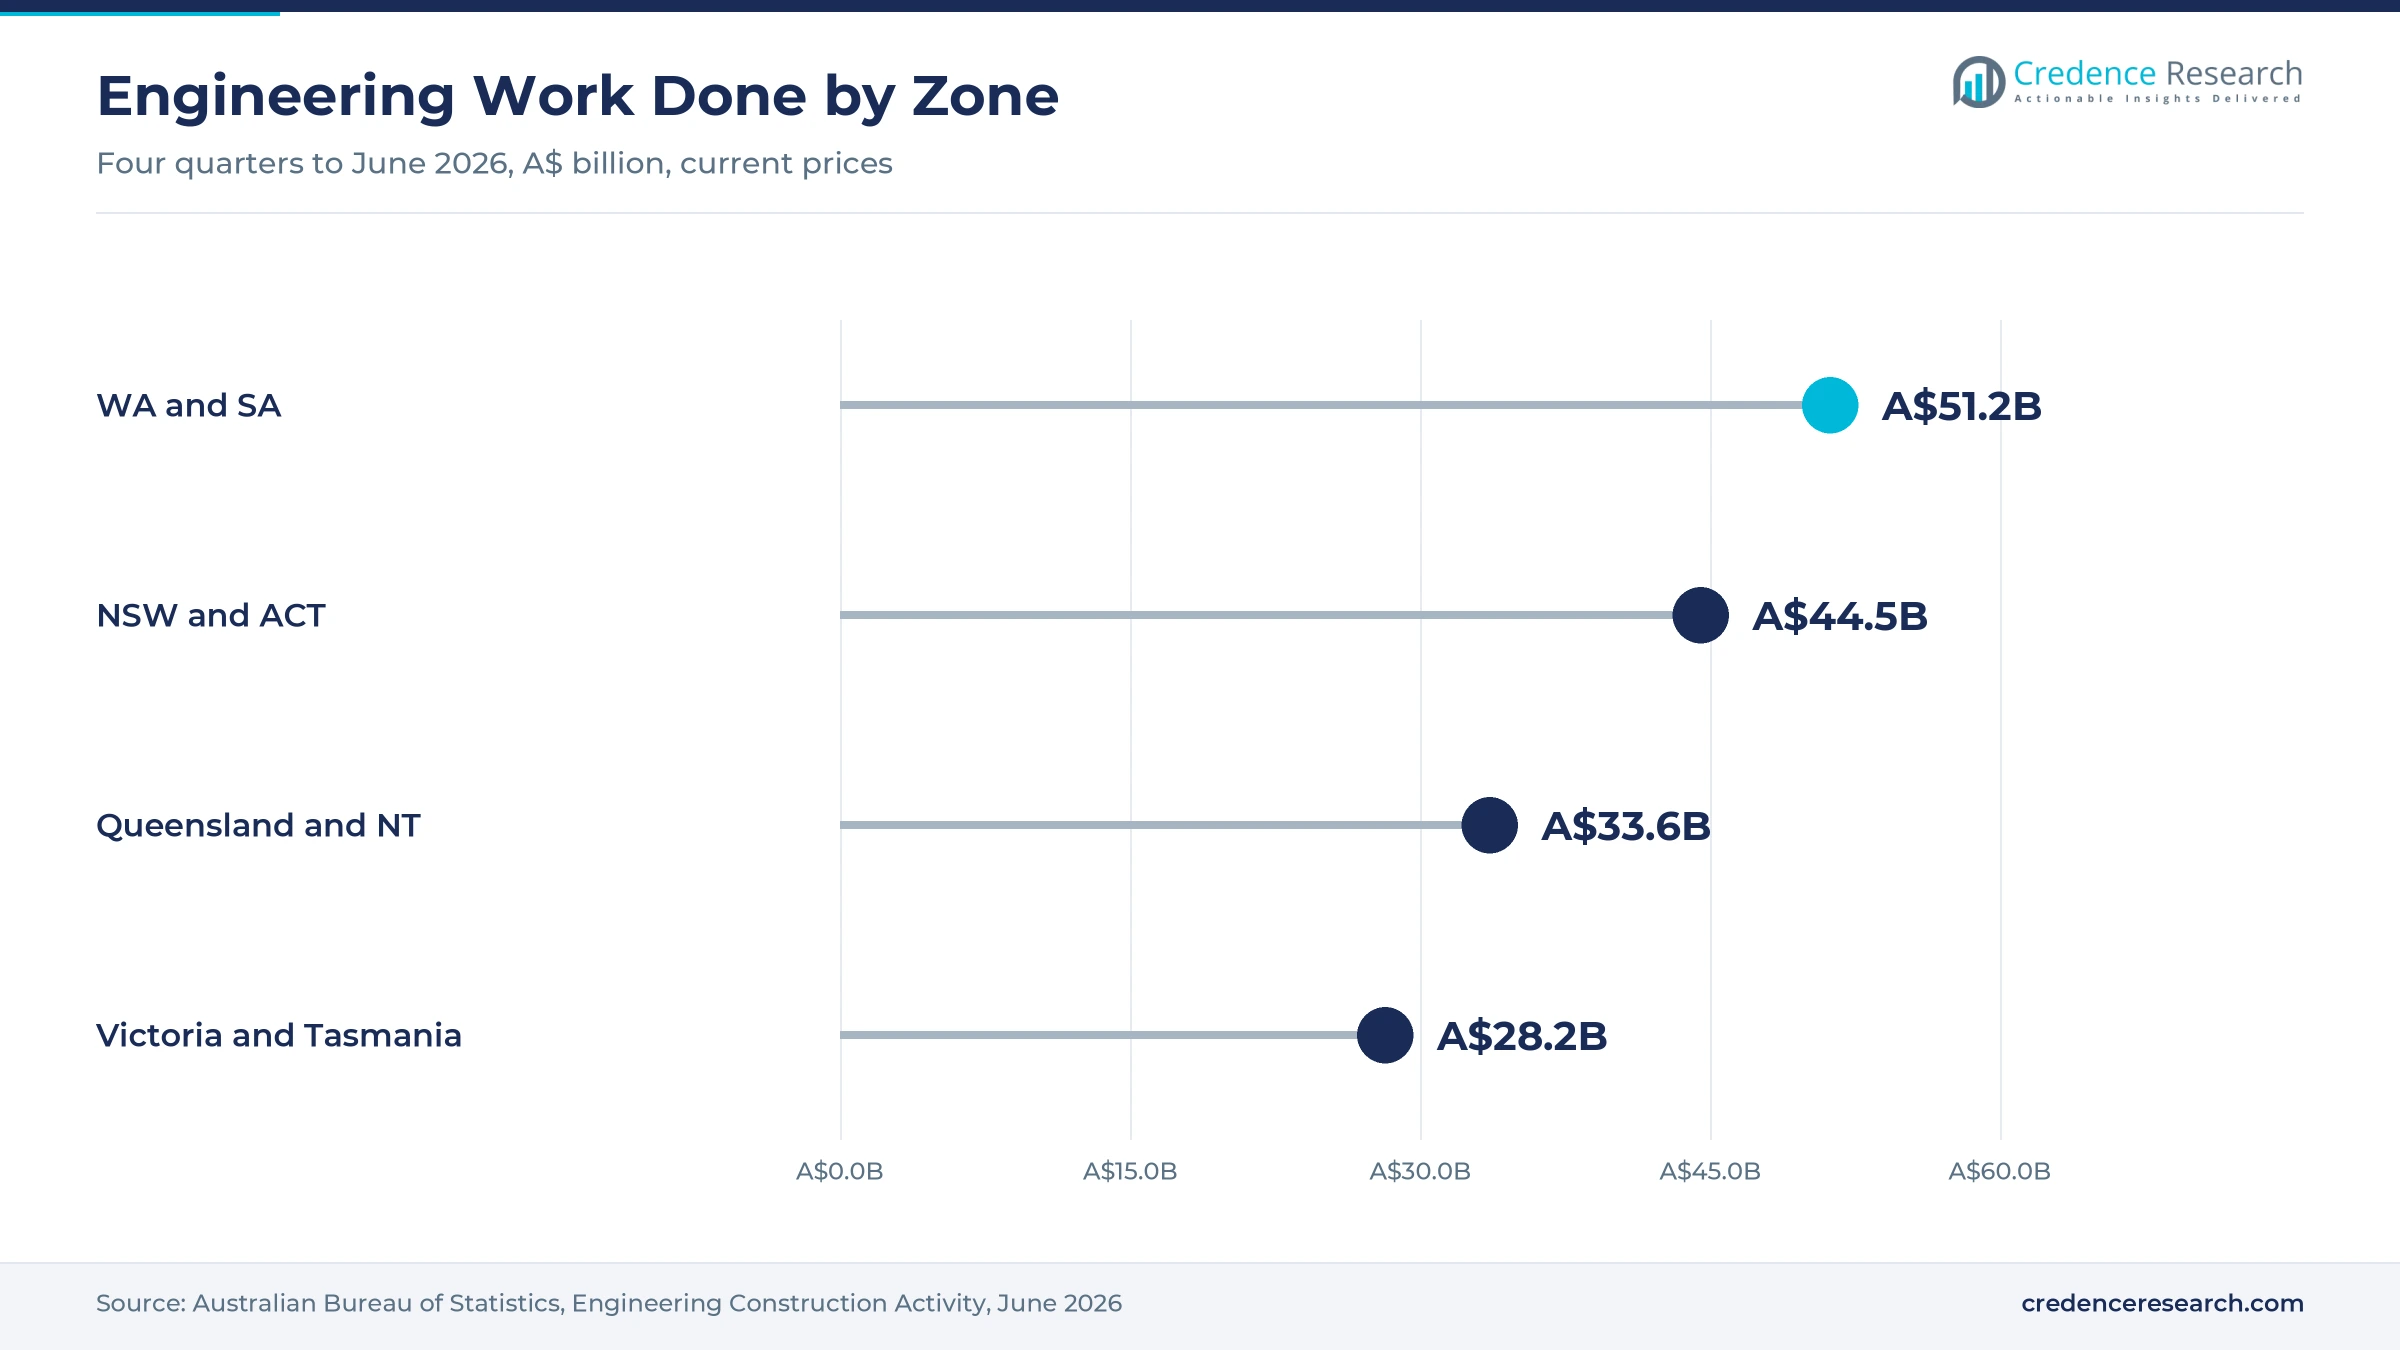
New South Wales and the Australian Capital Territory held 33.7% of 2025 value and grow at 17.15% a year. The zone recorded about A$44.5 billion of engineering work done over the four quarters to June 2026. Infrastructure NSW set its own embodied carbon policy for public works in April 2024. Hire firms such as Camden Hire already run hybrid booms across Western Sydney sites.
How does Victoria lead site electrification?
Victoria and Tasmania held a 24.6% share of 2025 value and grow at 17.40% a year, as major rail tunnels and renewable projects test electric plant. The zone recorded about A$28.2 billion of engineering work done over the four quarters to June 2026. CPB Contractors and Acciona use electric work platforms and an electric crawler crane on Suburban Rail Loop East. Thiess also trialed a battery Komatsu excavator at Yallourn Mine in June 2025.
Why does Queensland grow fastest to 2035?
Queensland and the Northern Territory held a 20.2% share of 2025 value and grow fastest at 17.75% a year. The zone recorded about A$33.6 billion of engineering work done over the four quarters to June 2026. Infrastructure Australia expects public investment in several regions to rise by at least 200%, with ten such regions across New South Wales, Tasmania and Queensland. As a result, Credence Research expects contractors to add battery and hybrid plant as new contracts start.
How do mining states shape demand in the west?
Western Australia and South Australia held a 21.5% share of 2025 value and grow at 17.00% a year. The zone recorded about A$51.2 billion of engineering work done over the four quarters to June 2026, much of it resources work that uses mining-class fleets outside this estimate. The METRONET team at Whiteman Park used a solar and battery generator that saved about 45,000 liters of diesel. In turn, site power systems prepare the ground for battery plant.
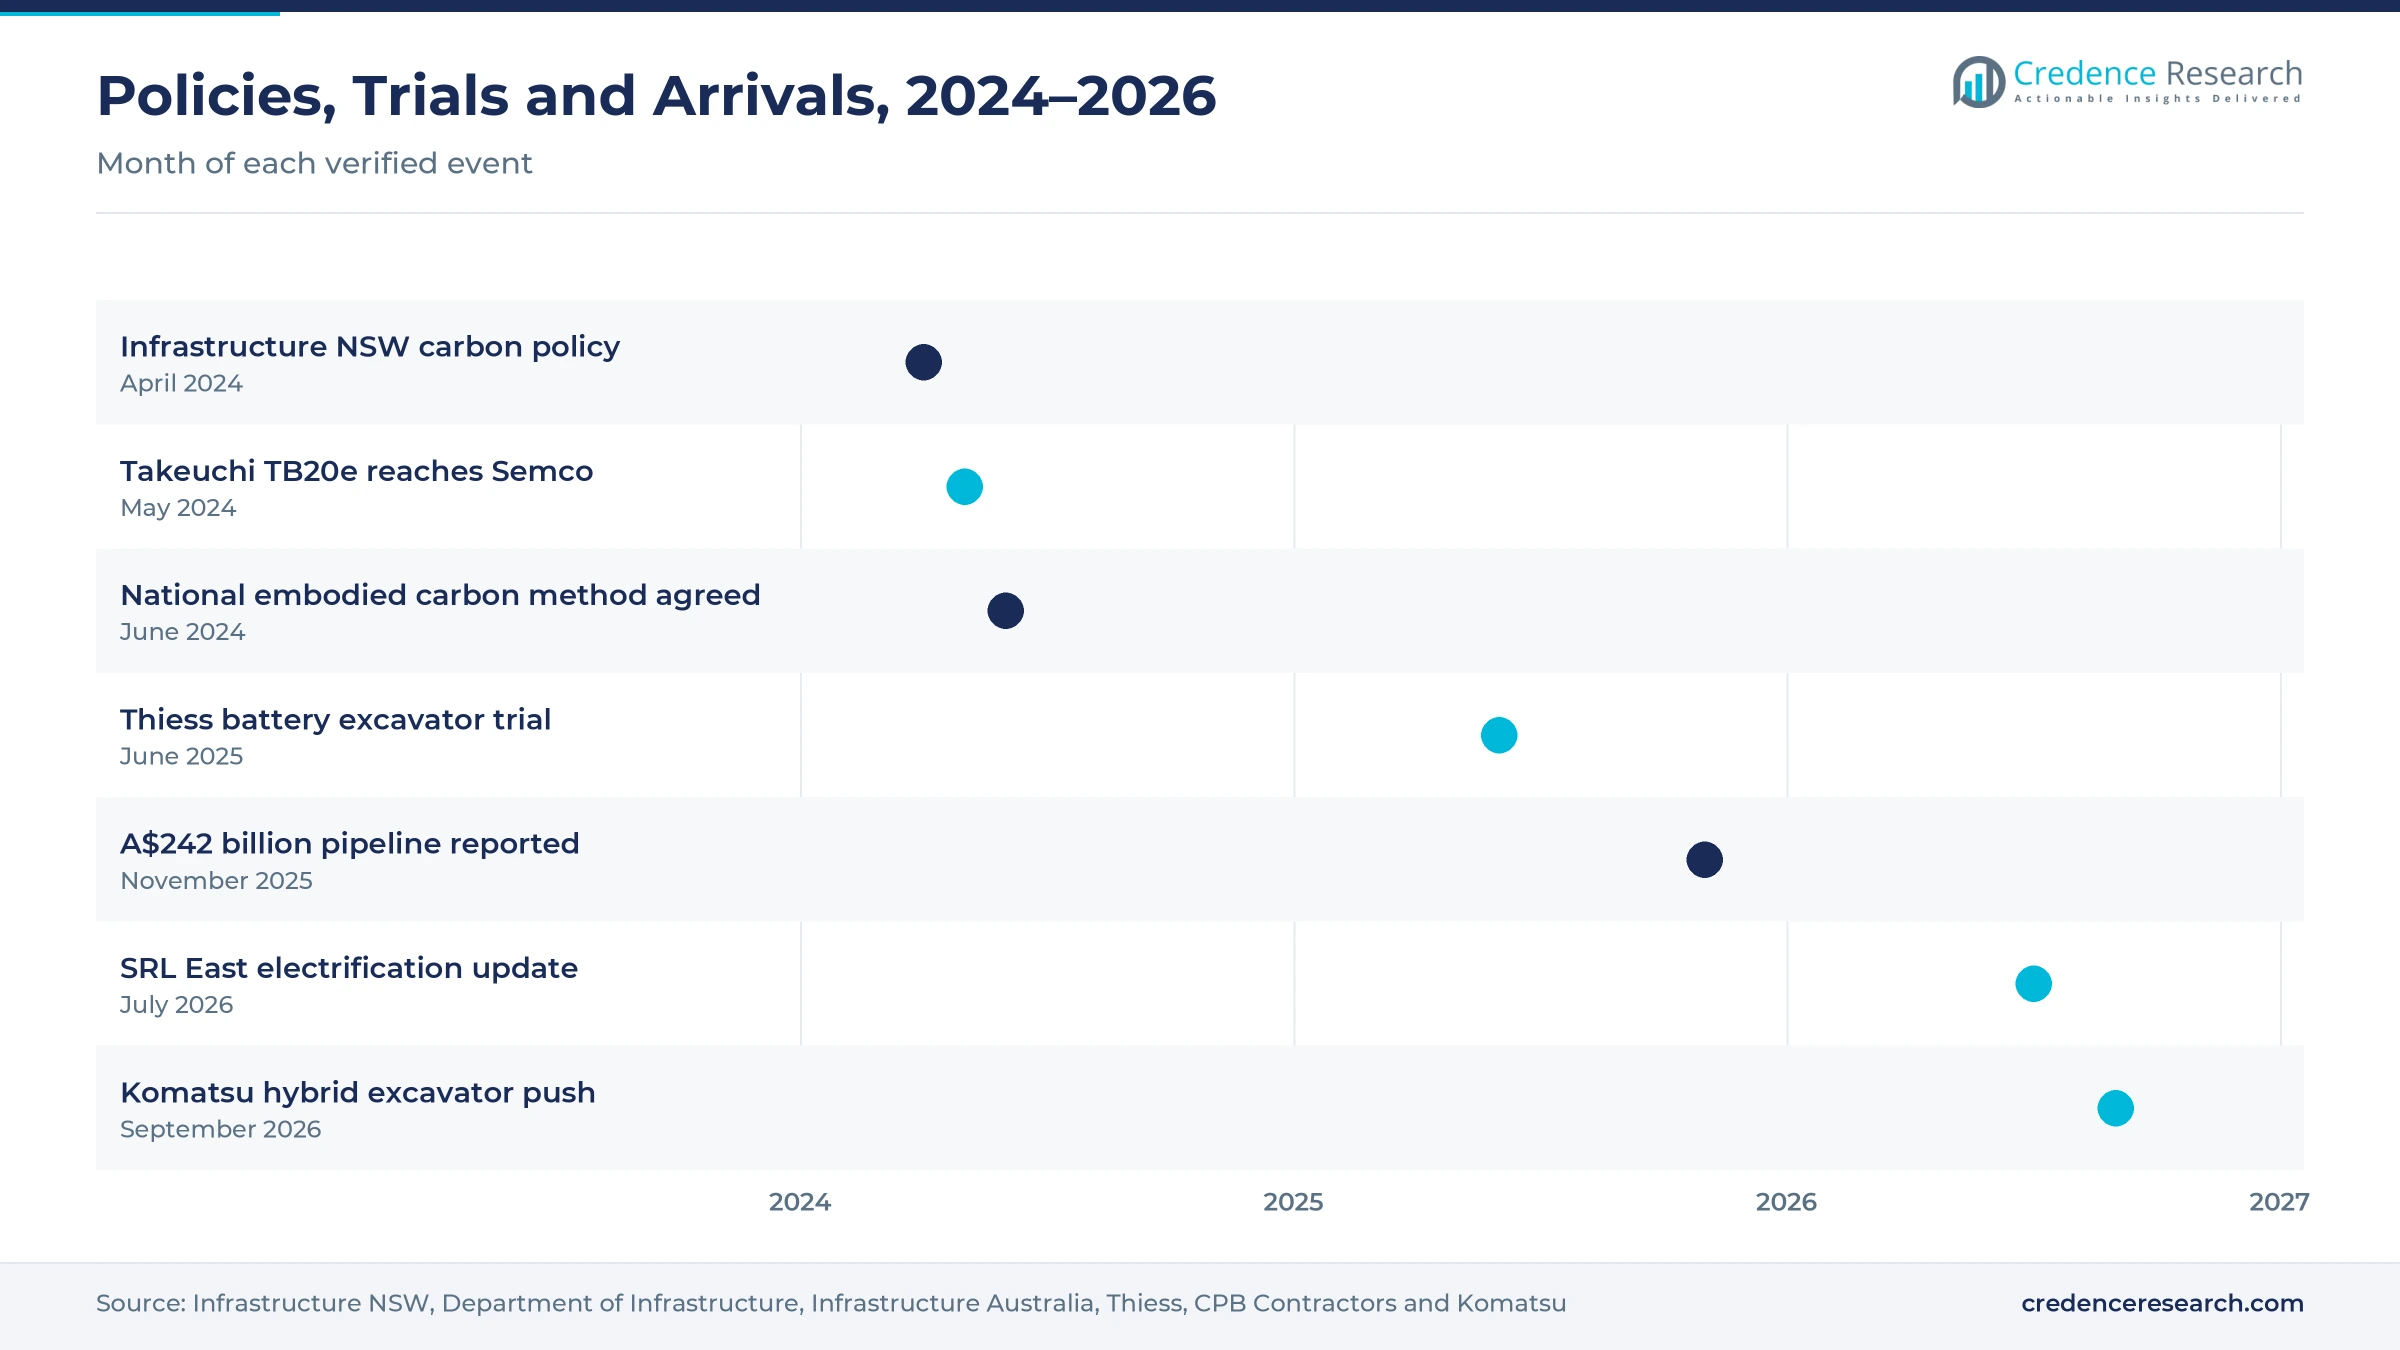
Policies, trials and machine arrivals, 2024–2026
| Development | Status and market relevance |
|---|---|
| In April 2024, Infrastructure NSW launched its Decarbonising Infrastructure Delivery Policy, which requires government projects to measure embodied carbon consistently. | Brings plant emissions into public works planning in the largest regional market |
| In May 2024, Semco, an Australian equipment specialist, took delivery of its first Takeuchi TB20e, a 1,930 kg battery excavator with a 24.7 kWh lithium-ion pack. | Adds a compact battery digger to the national dealer offer |
| In June 2025, Thiess trialed a fully electric 22-metric-ton Komatsu excavator at Yallourn Mine in Victoria, cutting carbon dioxide output by about 80 kg a day. | Gives contractors local evidence on battery excavator performance |
| In July 2026, CPB Contractors reported that electric work platforms, a battery plate compactor and a 250-metric-ton electric crane support Suburban Rail Loop East. | Shows whole-site electrification on a major Victorian project |
| In September 2026, Komatsu Australia promoted its HB215LC-3 and HB365LC-3 hybrid excavators as fuel prices weighed on construction businesses. | Revives interest in hybrid machines for heavy work |
Batteries, energy recovery and site power shape choice
- Battery-electric equipment uses lithium-ion packs such as the 432 kWh unit in the LiuGong 856H-E Max loader, which fast-charges in about 90 minutes.
- Electromechanical hybrid equipment stores slewing energy in an ultracapacitor and returns it to assist the engine, as in Komatsu hybrid excavators.
- Hydraulic hybrid equipment recovers energy through the hydraulic circuit and suits machines that repeat heavy lifting and swinging cycles.
- Site battery systems such as the solar and battery generator on the METRONET Whiteman Park site supply power where grid connections are weak.
Need a Custom Version of This Report?
Tailor the scope, geography, or segments to your exact requirements.
- Custom geography or segment scope
- Direct access to our analyst team
Global OEMs and dealers compete on range and support
Competition for low-carbon construction plant is led by global manufacturers that sell through national distributors and dealers, while hire companies decide which models most contractors try first. Komatsu offers battery and hybrid excavators and supports trials with contractors such as Thiess. CJD Equipment distributes Volvo Construction Equipment battery loaders and excavators, and LiuGong runs its Australian headquarters in Laverton North. JCB sells its 19C-1E battery mini excavator through JCB CEA and delivered its first electric telehandler in Australia to an earthworks contractor. Liebherr supplied an electric piling rig, while Takeuchi machines reach buyers through Toyota Material Handling Australia. Wacker Neuson, Genie and JLG compete in compact, access and boom equipment. Rivals compete on model range, charging support, dealer service and hire company partnerships.
Which manufacturers compete for low-carbon plant buyers?
| Company | Type | Role in the market |
|---|---|---|
| Komatsu | OEM subsidiary | Battery excavator trials and HB215LC-3 and HB365LC-3 hybrid excavators |
| Volvo Construction Equipment | OEM via distributor | ECR25 Electric excavator and L25 Electric loader sold through CJD Equipment |
| LiuGong | OEM subsidiary | 856H-E Max battery loader unveiled at its Laverton North headquarters |
| Liebherr | OEM subsidiary | Supplied an electric piling rig described as the first of its kind in Australia |
| JCB | OEM via dealer | 19C-1E battery mini excavator through JCB CEA and the first local electric telehandler |
| Takeuchi | OEM via distributor | TB20e battery excavator sold through Toyota Material Handling Australia |
| Wacker Neuson | OEM subsidiary | EZ17e electric excavator, WL20e loader and battery compaction tools |
| Genie | OEM subsidiary | Z-60/37 FE fuel-electric booms used by hire firms such as Camden Hire |
| JLG | OEM subsidiary | Hybrid and electric booms offered through JLG Australia |
Credence Research view on low-carbon plant adoption
Credence Research's view is that Australian demand for battery and hybrid construction plant will grow quickly, because carbon measurement on public works, wider dealer ranges and a large project pipeline all favor low-carbon machines. Earthmoving and foundation equipment remains the largest value pool, while compact battery machines add the fastest growth in city work. Hire companies will shape adoption, because most contractors try battery plant before buying it. Charging limits and the lack of diesel engine standards will slow the switch on remote and heavy sites.
How the national low-carbon plant estimate was built
The report uses 2025 as the base year on a calendar basis, and market values come from the Credence Research model. That model combines engineering construction data, the public infrastructure pipeline, supplier product ranges, dealer announcements and company disclosures. Segment splits and zone growth rates are Credence Research estimates, while zone shares follow the regional split defined for this report. Sources used are government agencies, official statistics, international agency data, trade press and company publications, and no interviews or surveys were used.
Battery machines and hybrid diggers carry growth to 2035
Value across Australian battery and hybrid construction plant is expected to reach USD 1.19 billion by 2035, a 17.30% CAGR during 2026–2035, as carbon rules, fleet renewal and wider model ranges lift adoption. Growth should be strongest where new regional pipelines start, led by Queensland and the Northern Territory. Battery machines will take a larger share of compact and access fleets, while hybrid excavators keep a role in heavy cycles. Suppliers that pair machines with charging, training and hire partnerships should gain the most.
Frequently Asked Questions
How big is the Australia electric and hybrid construction equipment market?
Which product type leads low-carbon plant spending?
Which region leads low-carbon plant spending in Australia?
How does carbon procurement affect machine choice?
Which technology grows fastest in this market?
Do hybrid excavators still make sense for Australian buyers?
Which companies supply battery and hybrid plant in Australia?
What are the main challenges for low-carbon plant adoption?
Table of Content
Chapter 1 Market Segmentation
- 1.1 Segmentation Framework
- 1.1.1 Product and Service Classification
- 1.1.2 Application and End-Use Classification
- 1.1.3 Technology and Solution Classification
- 1.1.4 Customer and Distribution Channel Classification
- 1.1.5 Geographic Segmentation
- 1.1.6 Market Segment Definitions and Boundaries
- 1.2 By Product Type
- 1.2.1 Earthmoving and Foundation Equipment
- 1.2.2 Road Construction Equipment
- 1.2.3 Material Handling Equipment
- 1.2.4 Compact Site Equipment
- 1.3 By Technology
- 1.3.1 Battery-Electric Equipment
- 1.3.2 Electromechanical Hybrid Equipment
- 1.3.3 Hydraulic Hybrid Equipment
- 1.4 By Application
- 1.4.1 Transport Infrastructure
- 1.4.2 Building Construction
- 1.4.3 Utilities and Resources Infrastructure
- 1.5 By Customer Type
- 1.5.1 Construction Contractors
- 1.5.2 Rental Fleet Operators
- 1.5.3 Public Asset Operators
Chapter 2 Introduction
- 2.1 Report Objectives and Scope
- 2.2 Product Definition and Industry Terminology
- 2.3 Market Inclusions and Exclusions
- 2.4 Research Process
- 2.4.1 Primary Research and Expert Interviews
- 2.4.2 Secondary Research and Source Review
- 2.4.3 Top-Down and Bottom-Up Estimation
- 2.4.4 Data Triangulation and Verification
- 2.5 Market Size Measurement Basis
- 2.5.1 2025: USD 224.5 million → 2035: USD 1.19 billion
- 2.6 Historical and Forecast Reference Periods
- 2.6.1 Historical Period: 2018-2025
- 2.6.2 Base Year: 2025
- 2.6.3 Forecast Period: 2025-2035
- 2.7 Research Assumptions and Limitations
Chapter 3 Executive Summary
- 3.1 Market Snapshot and Key Findings
- 3.2 Base-Year Market Size, 2025
- 3.3 Forecast Market Size, 2035
- 3.4 Revenue and Volume Growth Outlook
- 3.5 Key Demand and Supply Indicators
- 3.6 Leading Market Segments
- 3.7 Fastest-Growing Market Opportunities
- 3.8 Regional Performance Highlights
- 3.9 Technology and Industry Transformation
- 3.10 Competitive Landscape Summary
- 3.11 Analyst View and Strategic Implications
Chapter 4 Australia Electric and Hybrid Construction Equipment Market Trends and Developments
- 4.1 Historical Industry Development, 2018-2025
- 4.2 Recent Market Trends and Developments
- 4.3 Demand and Customer Behavior Trends
- 4.4 Technology and Product Innovation
- 4.5 Artificial Intelligence, Automation and Digitalization
- 4.6 Local Manufacturing and Supply Chain Realignment
- 4.7 Industry Partnerships, Mergers and Acquisitions
- 4.8 Sustainability and Circular Economy Developments
- 4.9 Government and Private Sector Investment Trends
- 4.10 Emerging Business Models and Commercialization
- 4.11 Industry Developments and Announcements
Chapter 5 Australia Electric and Hybrid Construction Equipment Market Production, Supply and Demand Analysis
- 5.1 Demand Trend and Consumption Analysis, 2018-2025
- 5.2 Demand Forecast, 2025-2035
- 5.3 Production and Output Trend, 2018-2025
- 5.4 Production and Output Forecast, 2025-2035
- 5.5 Installed Capacity and Capacity Utilization
- 5.6 Company-Wise Production Plants and Statistics
- 5.6.1 Installed Production Capacity
- 5.6.2 Actual Production
- 5.6.3 Planned Capacity and Expansion Targets
- 5.7 Supply Chain Structure and Procurement Trends
- 5.8 Supply-Demand Gap and Bottlenecks
- 5.9 Import Dependence and Sourcing Structure
- 5.10 Contract Manufacturing and Outsourcing
- 5.11 Regional Supply and Demand Concentration
Chapter 6 Australia Electric and Hybrid Construction Equipment Market Pricing Analysis
- 6.1 Pricing Structure and Measurement
- 6.2 Historical Pricing Trends, 2018-2025
- 6.3 Pricing Outlook, 2025-2035
- 6.4 Average Selling Price and Unit Economics
- 6.5 Pricing by Product and Market Segment
- 6.6 Geographic Pricing Differences
- 6.7 Key Input, Energy, Labor and Logistics Costs
- 6.8 Contract Pricing and Purchasing Models
- 6.9 Pricing Sensitivity and Competitive Positioning
- 6.10 Price, Margin and Profitability Implications
Chapter 7 Australia Electric and Hybrid Construction Equipment Market Dynamics
- 7.1 Market Growth Drivers
- 7.1.1 Demand-Side Drivers
- 7.1.2 Technology and Innovation Drivers
- 7.1.3 Infrastructure and Investment Drivers
- 7.1.4 Regulatory and Policy Drivers
- 7.2 Market Restraints
- 7.2.1 Cost and Affordability Constraints
- 7.2.2 Technology and Adoption Barriers
- 7.2.3 Supply Chain and Operational Constraints
- 7.3 Market Challenges
- 7.3.1 Competitive Pressure and Margin Erosion
- 7.3.2 Skills, Infrastructure and Implementation Gaps
- 7.4 Emerging Market Opportunities
- 7.5 Market Dynamics Impact and Time-Horizon Assessment
Chapter 8 Australia Electric and Hybrid Construction Equipment Value Chain Analysis
- 8.1 Industry Value Chain Overview
- 8.2 Upstream Suppliers and Critical Inputs
- 8.3 Technology and Component Providers
- 8.4 Manufacturing or Service Delivery
- 8.5 Distribution, Channel Partners and Integrators
- 8.6 Downstream Applications and End Users
- 8.7 Value Addition and Profit Pools
- 8.8 Vertical Integration and Outsourcing
- 8.9 Supplier Concentration and Risk
- 8.10 Supply Chain Localization and Resilience
Chapter 9 Australia Electric and Hybrid Construction Equipment Market Regulations and Policies
- 9.1 Relevant Laws, Standards and Compliance Frameworks
- 9.2 Product, Service, Safety and Quality Requirements
- 9.3 Government Policies, Incentives and Subsidies
- 9.4 Imports, Exports and Trade Barriers
- 9.5 Public Procurement and Local Content Requirements
- 9.6 Environmental and Sustainability Compliance
- 9.7 Upcoming Policy Changes and Market Implications
Chapter 10 Australia Electric and Hybrid Construction Equipment Market Hotspots and Opportunities
- 10.1 Market Opportunity Mapping and Growth Hotspots
- 10.2 High-Growth Applications and Customer Groups
- 10.3 Underserved Markets and White-Space Opportunities
- 10.4 Emerging Technology and Product Opportunities
- 10.5 New Capacity and Investment Hotspots
- 10.6 Market Entry and Expansion Opportunities
- 10.7 Distribution and Partnership Opportunities
- 10.8 Near-Term and Long-Term Commercial Potential
- 10.9 Opportunity Attractiveness and Execution Risks
Chapter 11 Australia Electric and Hybrid Construction Equipment Market Outlook, 2025-2035
- 11.1 Market Size and Analysis
- 11.1.1 Revenue (Market Measurement: 2025: USD 224.5 million → 2035: USD 1.19 billion)
- 11.1.2 Market Volume and Quantity Sold
- 11.1.3 Historical Market Size, 2018-2025
- 11.1.4 Base-Year Market Size, 2025
- 11.2 Market Forecast, 2025-2035
- 11.2.1 Revenue Forecast to 2035
- 11.2.2 Volume Forecast to 2035
- 11.2.3 CAGR and Year-on-Year Growth
- 11.2.4 Incremental Revenue Opportunity
- 11.3 Forecast Assumptions and Scenario Analysis
- 11.3.1 Base-Case Forecast
- 11.3.2 Optimistic and Conservative Scenarios
- 11.3.3 Technology, Pricing and Policy Sensitivities
- 11.4 Market Attractiveness and Growth Outlook
Chapter 12 Australia Electric and Hybrid Construction Equipment Market Segmentation and Outlook
- 12.1 Segmentation Summary and Market Shares, 2025
- 12.2 Largest and Fastest-Growing Segments
- 12.3 By Product Type - Market Size and Forecast, 2025-2035
- 12.3.1 Segment Definition and Scope
- 12.3.2 Historical Market Size, 2018-2025
- 12.3.3 Revenue Forecast, 2025-2035
- 12.3.4 Volume Forecast, 2025-2035
- 12.3.5 Base-Year Market Share, 2025
- 12.3.6 Segment CAGR and Growth Drivers
- 12.3.7 Subsegment Market Size and Forecast
- 12.3.7.1 Earthmoving and Foundation Equipment
- 12.3.7.2 Road Construction Equipment
- 12.3.7.3 Material Handling Equipment
- 12.3.7.4 Compact Site Equipment
- 12.3.8 Subsegment Pricing and Adoption Trends
- 12.3.9 Leading Suppliers and Competition
- 12.3.10 Regional Demand and Opportunities
- 12.4 By Technology - Market Size and Forecast, 2025-2035
- 12.4.1 Segment Definition and Scope
- 12.4.2 Historical Market Size, 2018-2025
- 12.4.3 Revenue Forecast, 2025-2035
- 12.4.4 Volume Forecast, 2025-2035
- 12.4.5 Base-Year Market Share, 2025
- 12.4.6 Segment CAGR and Growth Drivers
- 12.4.7 Subsegment Market Size and Forecast
- 12.4.7.1 Battery-Electric Equipment
- 12.4.7.2 Electromechanical Hybrid Equipment
- 12.4.7.3 Hydraulic Hybrid Equipment
- 12.4.8 Subsegment Pricing and Adoption Trends
- 12.4.9 Leading Suppliers and Competition
- 12.4.10 Regional Demand and Opportunities
- 12.5 By Application - Market Size and Forecast, 2025-2035
- 12.5.1 Segment Definition and Scope
- 12.5.2 Historical Market Size, 2018-2025
- 12.5.3 Revenue Forecast, 2025-2035
- 12.5.4 Volume Forecast, 2025-2035
- 12.5.5 Base-Year Market Share, 2025
- 12.5.6 Segment CAGR and Growth Drivers
- 12.5.7 Subsegment Market Size and Forecast
- 12.5.7.1 Transport Infrastructure
- 12.5.7.2 Building Construction
- 12.5.7.3 Utilities and Resources Infrastructure
- 12.5.8 Subsegment Pricing and Adoption Trends
- 12.5.9 Leading Suppliers and Competition
- 12.5.10 Regional Demand and Opportunities
- 12.6 By Customer Type - Market Size and Forecast, 2025-2035
- 12.6.1 Segment Definition and Scope
- 12.6.2 Historical Market Size, 2018-2025
- 12.6.3 Revenue Forecast, 2025-2035
- 12.6.4 Volume Forecast, 2025-2035
- 12.6.5 Base-Year Market Share, 2025
- 12.6.6 Segment CAGR and Growth Drivers
- 12.6.7 Subsegment Market Size and Forecast
- 12.6.7.1 Construction Contractors
- 12.6.7.2 Rental Fleet Operators
- 12.6.7.3 Public Asset Operators
- 12.6.8 Subsegment Pricing and Adoption Trends
- 12.6.9 Leading Suppliers and Competition
- 12.6.10 Regional Demand and Opportunities
- 12.7 Segment Growth Comparison
- 12.8 Segment Attractiveness and Priority Matrix
Chapter 13 Australia Electric and Hybrid Construction Equipment End-Use and Application Market Outlook
- 13.1 End-Use Industry and Customer Demand Structure
- 13.2 Leading Applications and Customer Groups
- 13.3 End-Use Market Size, Share and Forecast
- 13.4 Major End-Use Industry Deep Dives
- 13.4.1 Customer Requirements and Use Cases
- 13.4.2 Demand and Replacement Cycles
- 13.4.3 Technical and Regulatory Considerations
- 13.4.4 Purchasing and Procurement Models
- 13.4.5 Leading Vendors and Distribution Channels
- 13.4.6 Forecast and Commercial Opportunities
- 13.5 Emerging Applications and Cross-Segment Demand
- 13.6 End-Use Industry Investment Priorities
Chapter 14 Australia Electric and Hybrid Construction Equipment Geographic Market Outlook, 2025-2035
- 14.1 Domestic Market Distribution and Demand Clusters
- 14.2 State- or Province-Wise Market Size and Forecast, 2025-2035
- 14.3 City and Metropolitan Market Outlook
- 14.4 Industrial, Manufacturing and Commercial Clusters
- 14.5 Geographic Concentration of Key End Users
- 14.6 Local Pricing and Purchasing Differences
- 14.7 Domestic Production Facilities and Capacity Map
- 14.8 Local Infrastructure and Project Pipeline
- 14.9 State-Level Policy and Incentive Differences
- 14.10 Subnational Investment Hotspots and Opportunities
- 14.11 Distribution and Logistics Networks
- 14.12 Domestic Competitive Footprint
Chapter 15 Australia Electric and Hybrid Construction Equipment Technology, Innovation and Sustainability Outlook
- 15.1 Technology Landscape and Maturity
- 15.2 Product, Process and Service Innovation
- 15.3 AI, Automation and Digital Tools in the Industry
- 15.4 Technology Adoption and Performance Benchmarking
- 15.5 Innovation Pipeline and R&D Investment
- 15.6 Patent and Intellectual Property Trends
- 15.7 Energy Efficiency and Resource Management
- 15.8 Sustainability, Recycling and Circularity
- 15.9 Technology Roadmap, 2025-2035
- 15.10 Risks of Obsolescence and Technology Substitution
Chapter 16 Australia Electric and Hybrid Construction Equipment Market Key Strategic Imperatives
- 16.1 Growth and Market Entry Priorities
- 16.2 High-Return Products and Segments
- 16.3 Pricing, Profitability and Cost Optimization
- 16.4 Technology Investment and Product Differentiation
- 16.5 Supply Chain Localization and Resilience
- 16.6 Distribution and Customer Acquisition
- 16.7 Partnership, Acquisition and Capacity Strategy
- 16.8 Regional Expansion Priorities
- 16.9 Short-, Medium- and Long-Term Actions
Chapter 17 Competition Outlook
- 17.1 Industry Competition Characteristics
- 17.2 Market Structure and Concentration
- 17.3 Market Share and Competitive Positioning, 2025
- 17.4 Company-Wise Revenue and Product Benchmarking
- 17.5 Production and Service Capacity Benchmarking
- 17.6 Technology, Pricing and Differentiation
- 17.7 Regional Footprint and Distribution Strength
- 17.8 Mergers, Acquisitions and Strategic Alliances
- 17.9 New Entrants and Competitive Threats
- 17.10 Porter's Five Forces and Industry Attractiveness
- 17.11 Competitive Outlook, 2025-2035
Chapter 18 Company Profiles
- 18.1 Company Coverage and Selection Criteria
- 18.2 Komatsu
- 18.2.1 Business Description
- 18.2.2 Company Ownership and Geographic Presence
- 18.2.3 Product and Service Portfolio
- 18.2.4 Manufacturing and Operating Footprint
- 18.2.5 Production Capacity and Expansion Plans
- 18.2.6 Financial Performance and Investment
- 18.2.7 Market Share and Competitive Position
- 18.2.8 Technology and Innovation Capabilities
- 18.2.9 Strategic Alliances or Partnerships
- 18.2.10 Recent Developments
- 18.2.11 Growth Strategy and Outlook
- 18.3 Volvo Construction Equipment
- 18.4 LiuGong
- 18.5 Liebherr
- 18.6 JCB
- 18.7 Genie
- 18.8 JLG
- 18.9 Manitou
- 18.10 Takeuchi
- 18.11 Wacker Neuson
- 18.12 Other Relevant Market Participants
Note: Every listed company is profiled on the structure shown under the first company. The company list is preliminary and may change based on research findings, market developments, data availability and client requirements.
Chapter 19 Disclaimer
- 19.1 Research and Forecast Disclaimer
- 19.2 Data Source and Estimation Limitations
Note: The depth of individual sections depends on data availability for this market. Volume, capacity, trade and other unit-based metrics are included where applicable.

