
More lenses per handset lift module value faster than units
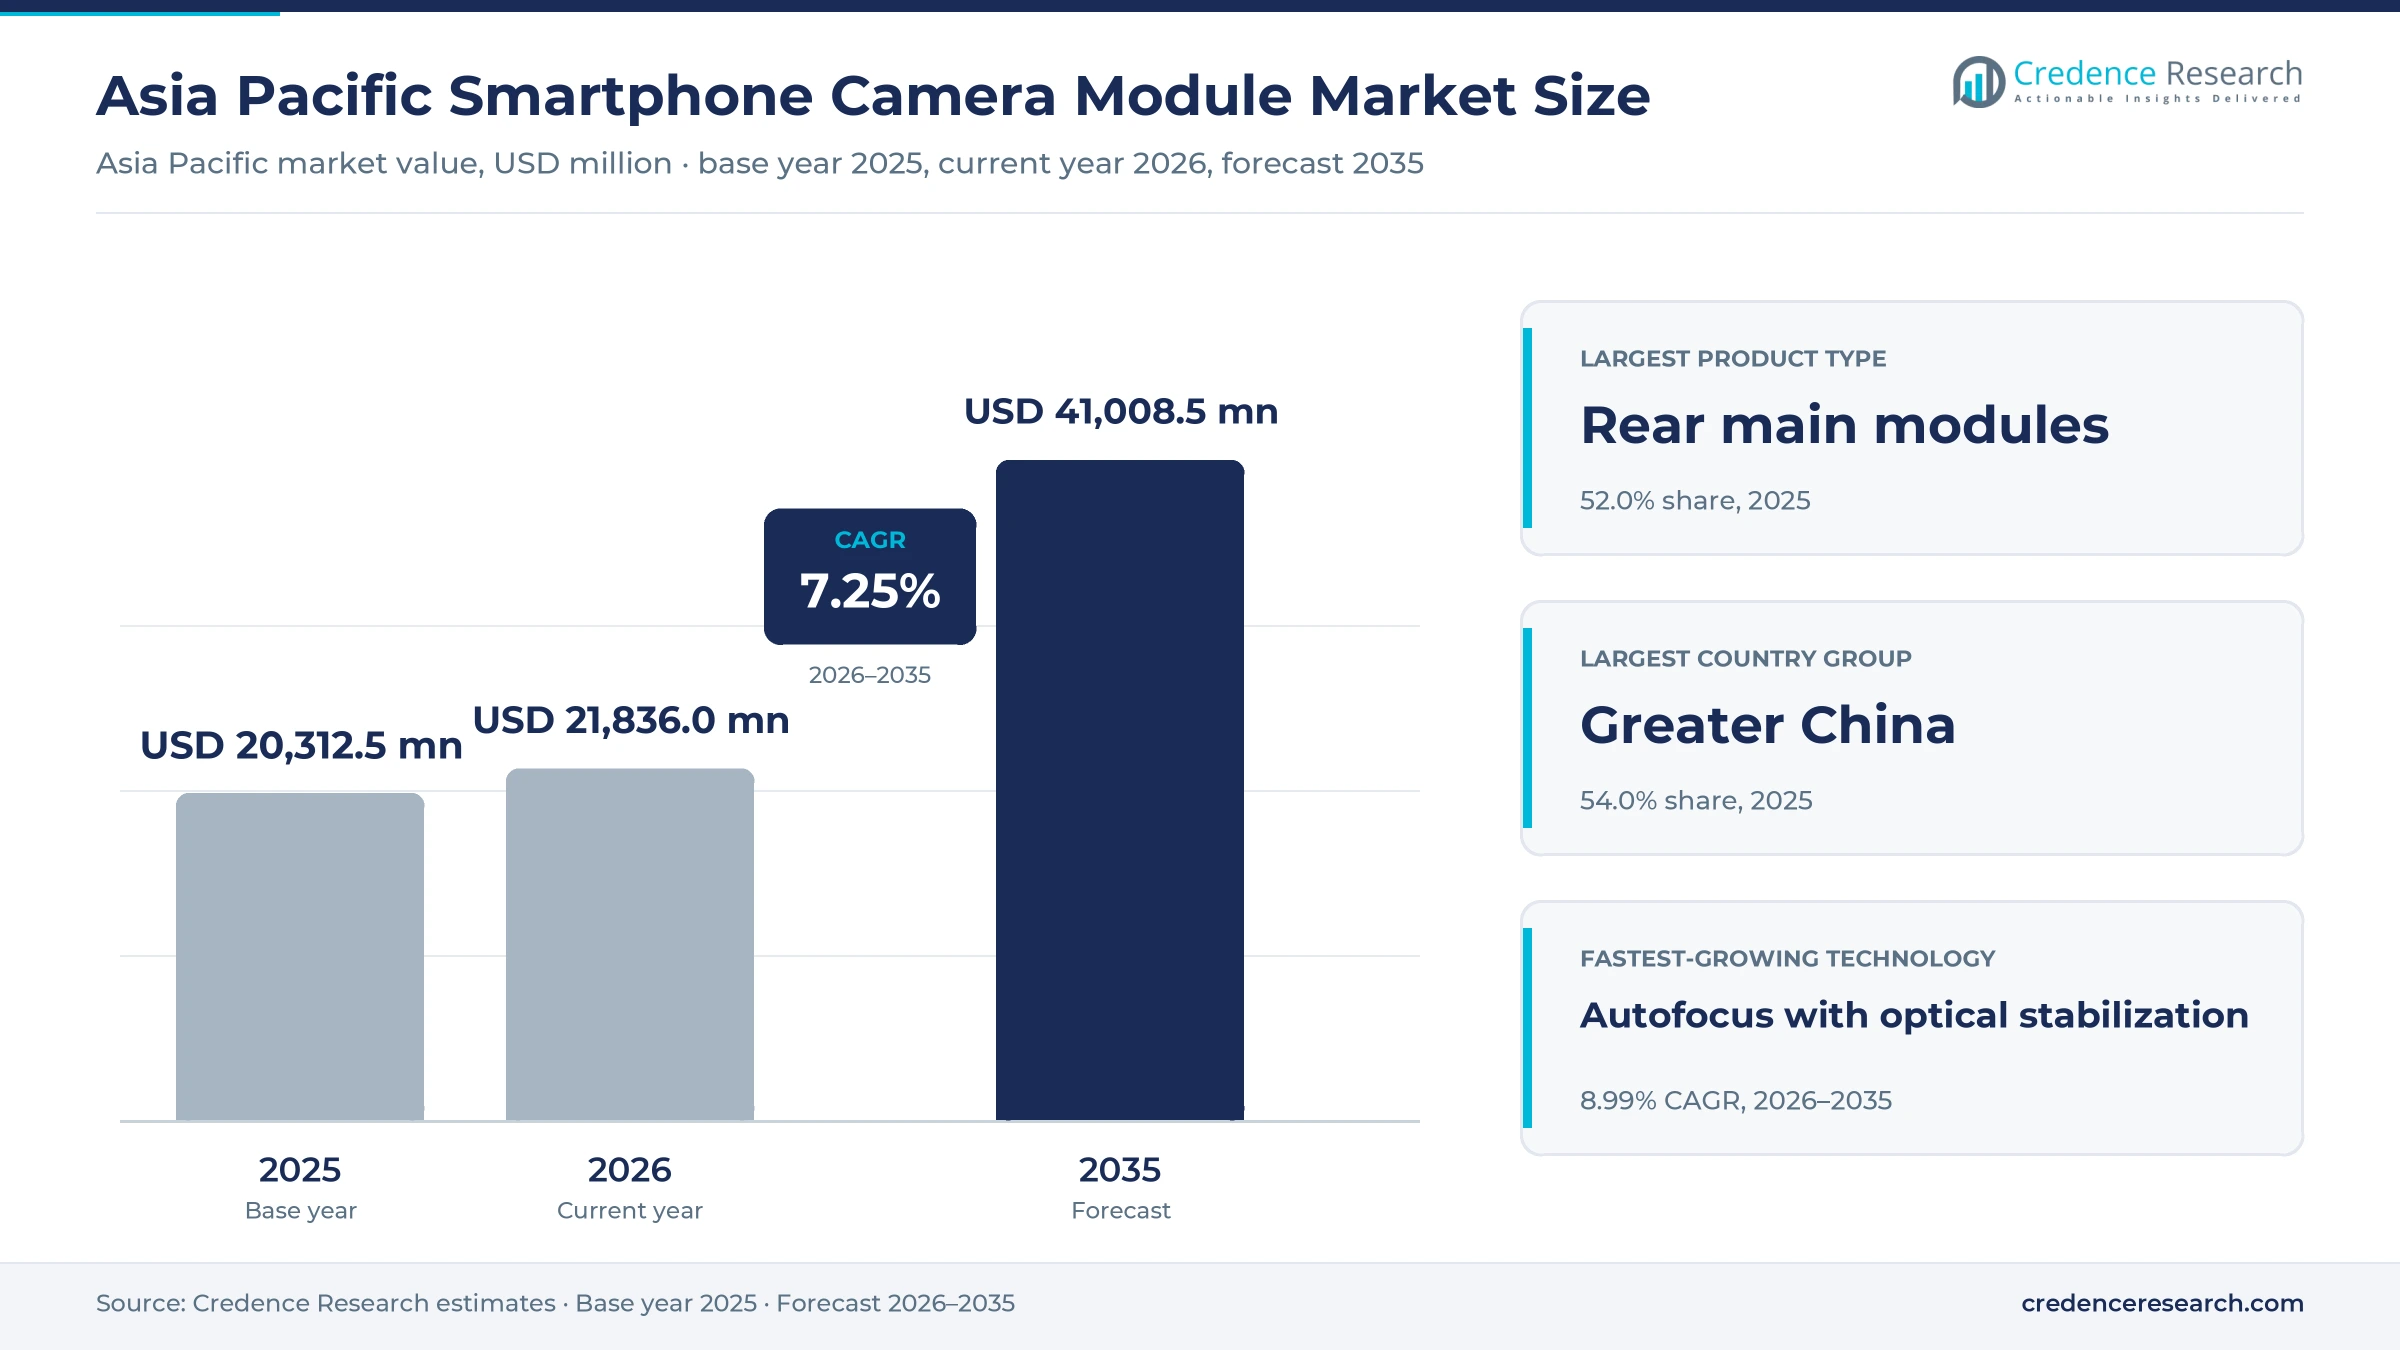
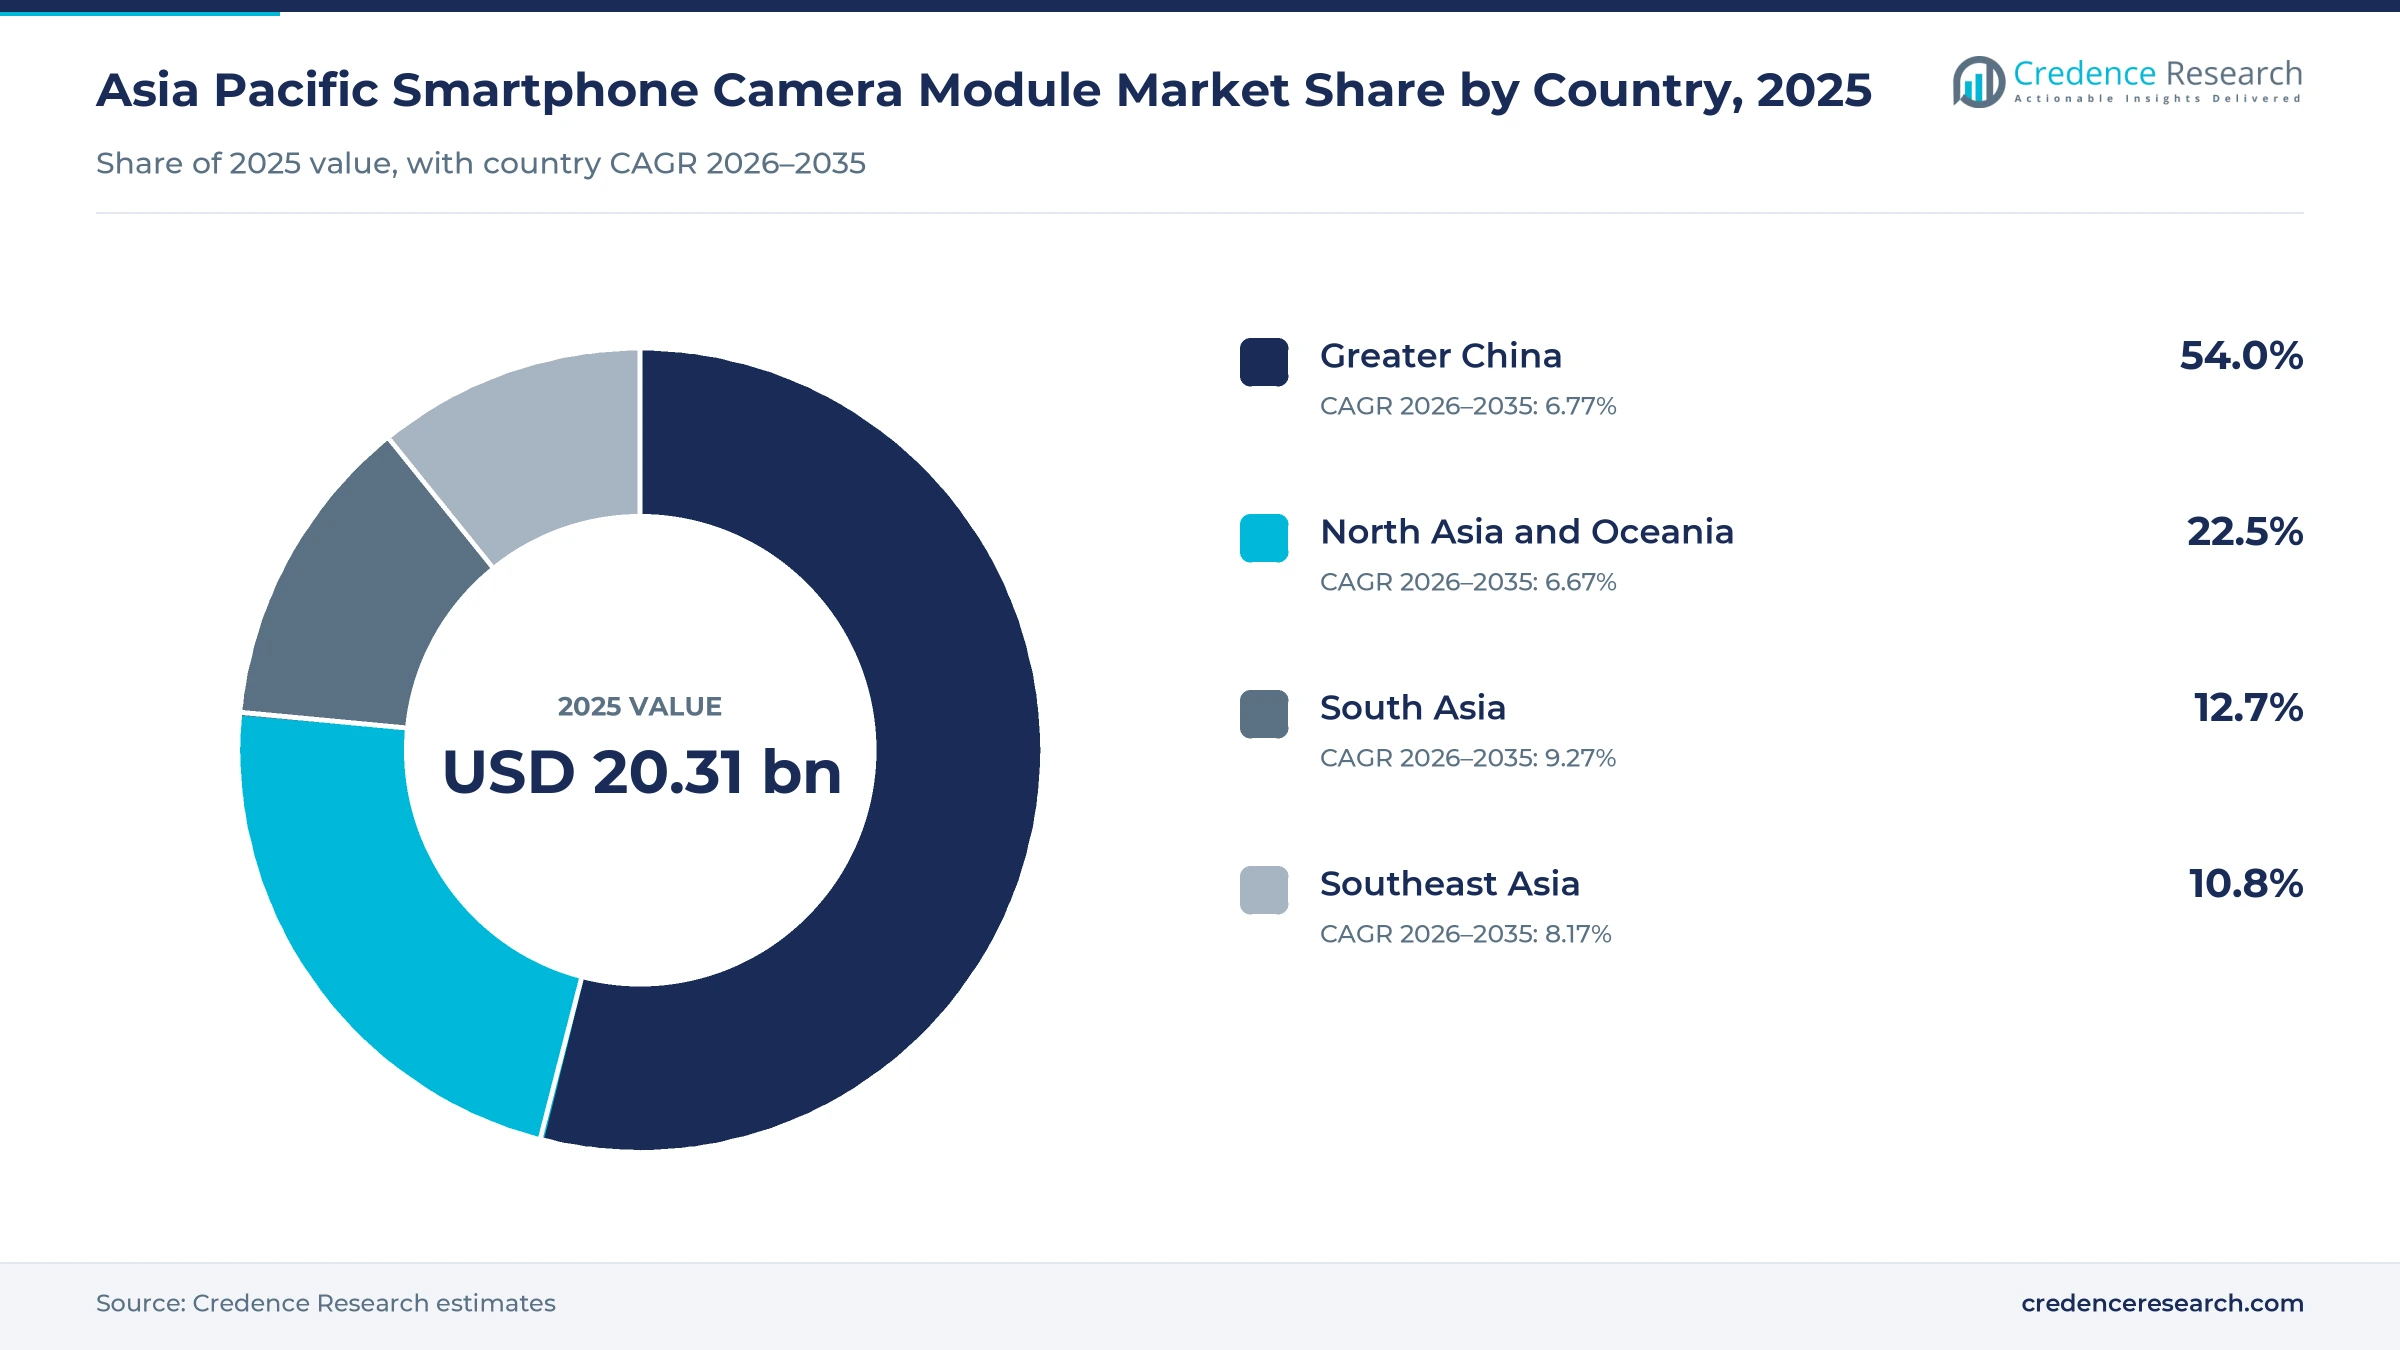
The Asia Pacific smartphone camera module market was valued at USD 20.31 billion in 2025 and is projected to increase from USD 21.84 billion in 2026 to USD 41.01 billion by 2035, registering a CAGR of 7.25% during 2026–2035. Demand comes from handset brands, original design manufacturers and contract assemblers that buy finished lens, sensor, actuator and circuit assemblies for every rear and front camera on a phone. Greater China held the largest country-group share, 54.0% in 2025, because most handset assembly and module production sits there. South Asia is the fastest-growing area at 9.27% a year, as India builds local module sub-assembly lines under a component incentive scheme. In turn, flagship launches with large telephoto sensors are pushing optical zoom and stabilized autofocus into more price tiers, which raises the value of each module faster than handset output grows.
Which modules and buyers does the estimate count?
The estimate measures spending across Asia Pacific on finished camera modules built into smartphones, covering rear main, rear auxiliary and front units that combine an image sensor, lens stack, focus or stabilization actuator and flexible circuit. It counts modules bought by handset brands directly, by original design manufacturers building phones for those brands, and by electronics manufacturing services companies that assemble phones under contract.
The estimate excludes camera modules for vehicles, tablets, laptops, security systems and robots, and it excludes bare image sensors or lens sets sold on their own. The value chain runs from sensor, lens and actuator makers through module assemblers to phone assembly plants in Greater China, South Asia, Southeast Asia and North Asia and Oceania.
Asia Pacific Smartphone Camera Module Market Insights
- The Asia Pacific smartphone camera module market was valued at USD 20.31 billion in 2025 and is projected to reach USD 41.01 billion by 2035, at a 7.25% CAGR during 2026–2035.
- Greater China held a 54.0% share of 2025 value, because most handset assembly and module production in the region is concentrated there.
- Rear main modules led product types with a 52.0% share of 2025 value, as every phone carries one and flagship units cost the most.
- India notified its Electronics Components Manufacturing Scheme on April 8, 2025, and approved camera module sub-assembly projects in Tamil Nadu and Noida.
- Autofocus with optical stabilization grows fastest among technologies at 8.99% a year during 2026–2035, as larger sensors move into mid-range phones.
Rear main units lead while zoom and stabilized optics gain
Why do rear main modules hold the most value?
Based on product type, the market is categorized into rear main modules, rear auxiliary modules and front modules. Rear main modules led with a 52.0% share of 2025 value, because every phone carries one and flagship versions use the largest sensors and stabilized lenses. Rear auxiliary modules grow fastest at 8.11% a year, as brands add telephoto and ultra-wide units to mid-range phones.
How quickly is zoom imaging gaining share?
Based on application, the market is categorized into general imaging, optical zoom imaging and depth sensing. General imaging led with a 68.0% share of 2025 value, because main, ultra-wide and front units all serve everyday photography and video. Optical zoom imaging grows fastest at 9.19% a year, as periscope and high-resolution telephoto designs move beyond the most expensive phones.
Which focus technologies set module prices?
Based on technology, the market is categorized into fixed focus, autofocus without optical stabilization and autofocus with optical stabilization. Autofocus without optical stabilization led with a 41.0% share of 2025 value, because entry and mid-range rear cameras still rely on simpler actuators. Autofocus with optical stabilization grows fastest at 8.99% a year, as larger sensors need stabilization to deliver sharp low-light images.
Who places the largest module purchase orders?
Based on customer type, the market is categorized into brand-led procurement, original design manufacturer procurement and electronics manufacturing services procurement. Brand-led procurement led with a 58.0% share of 2025 value, because flagship camera specifications are negotiated by brands themselves. Electronics manufacturing services procurement grows fastest at 8.16% a year, as contract assemblers in India take on module sourcing.
| Segment Group | Leading Sub-segment | Share, 2025 | Fastest-growing Sub-segment | CAGR, 2026–2035 |
|---|---|---|---|---|
| By Product Type | Rear main modules | 52.0% | Rear auxiliary modules | 8.11% |
| By Application | General imaging | 68.0% | Optical zoom imaging | 9.19% |
| By Technology | Autofocus without optical stabilization | 41.0% | Autofocus with optical stabilization | 8.99% |
| By Customer Type | Brand-led procurement | 58.0% | Electronics manufacturing services procurement | 8.16% |
Request a Free Sample
Fill in your details and we'll send you a free sample report.
- Sample data tables & charts
- Research methodology
Optical content, flagship imaging and India sourcing
How does higher optical content per phone lift demand?
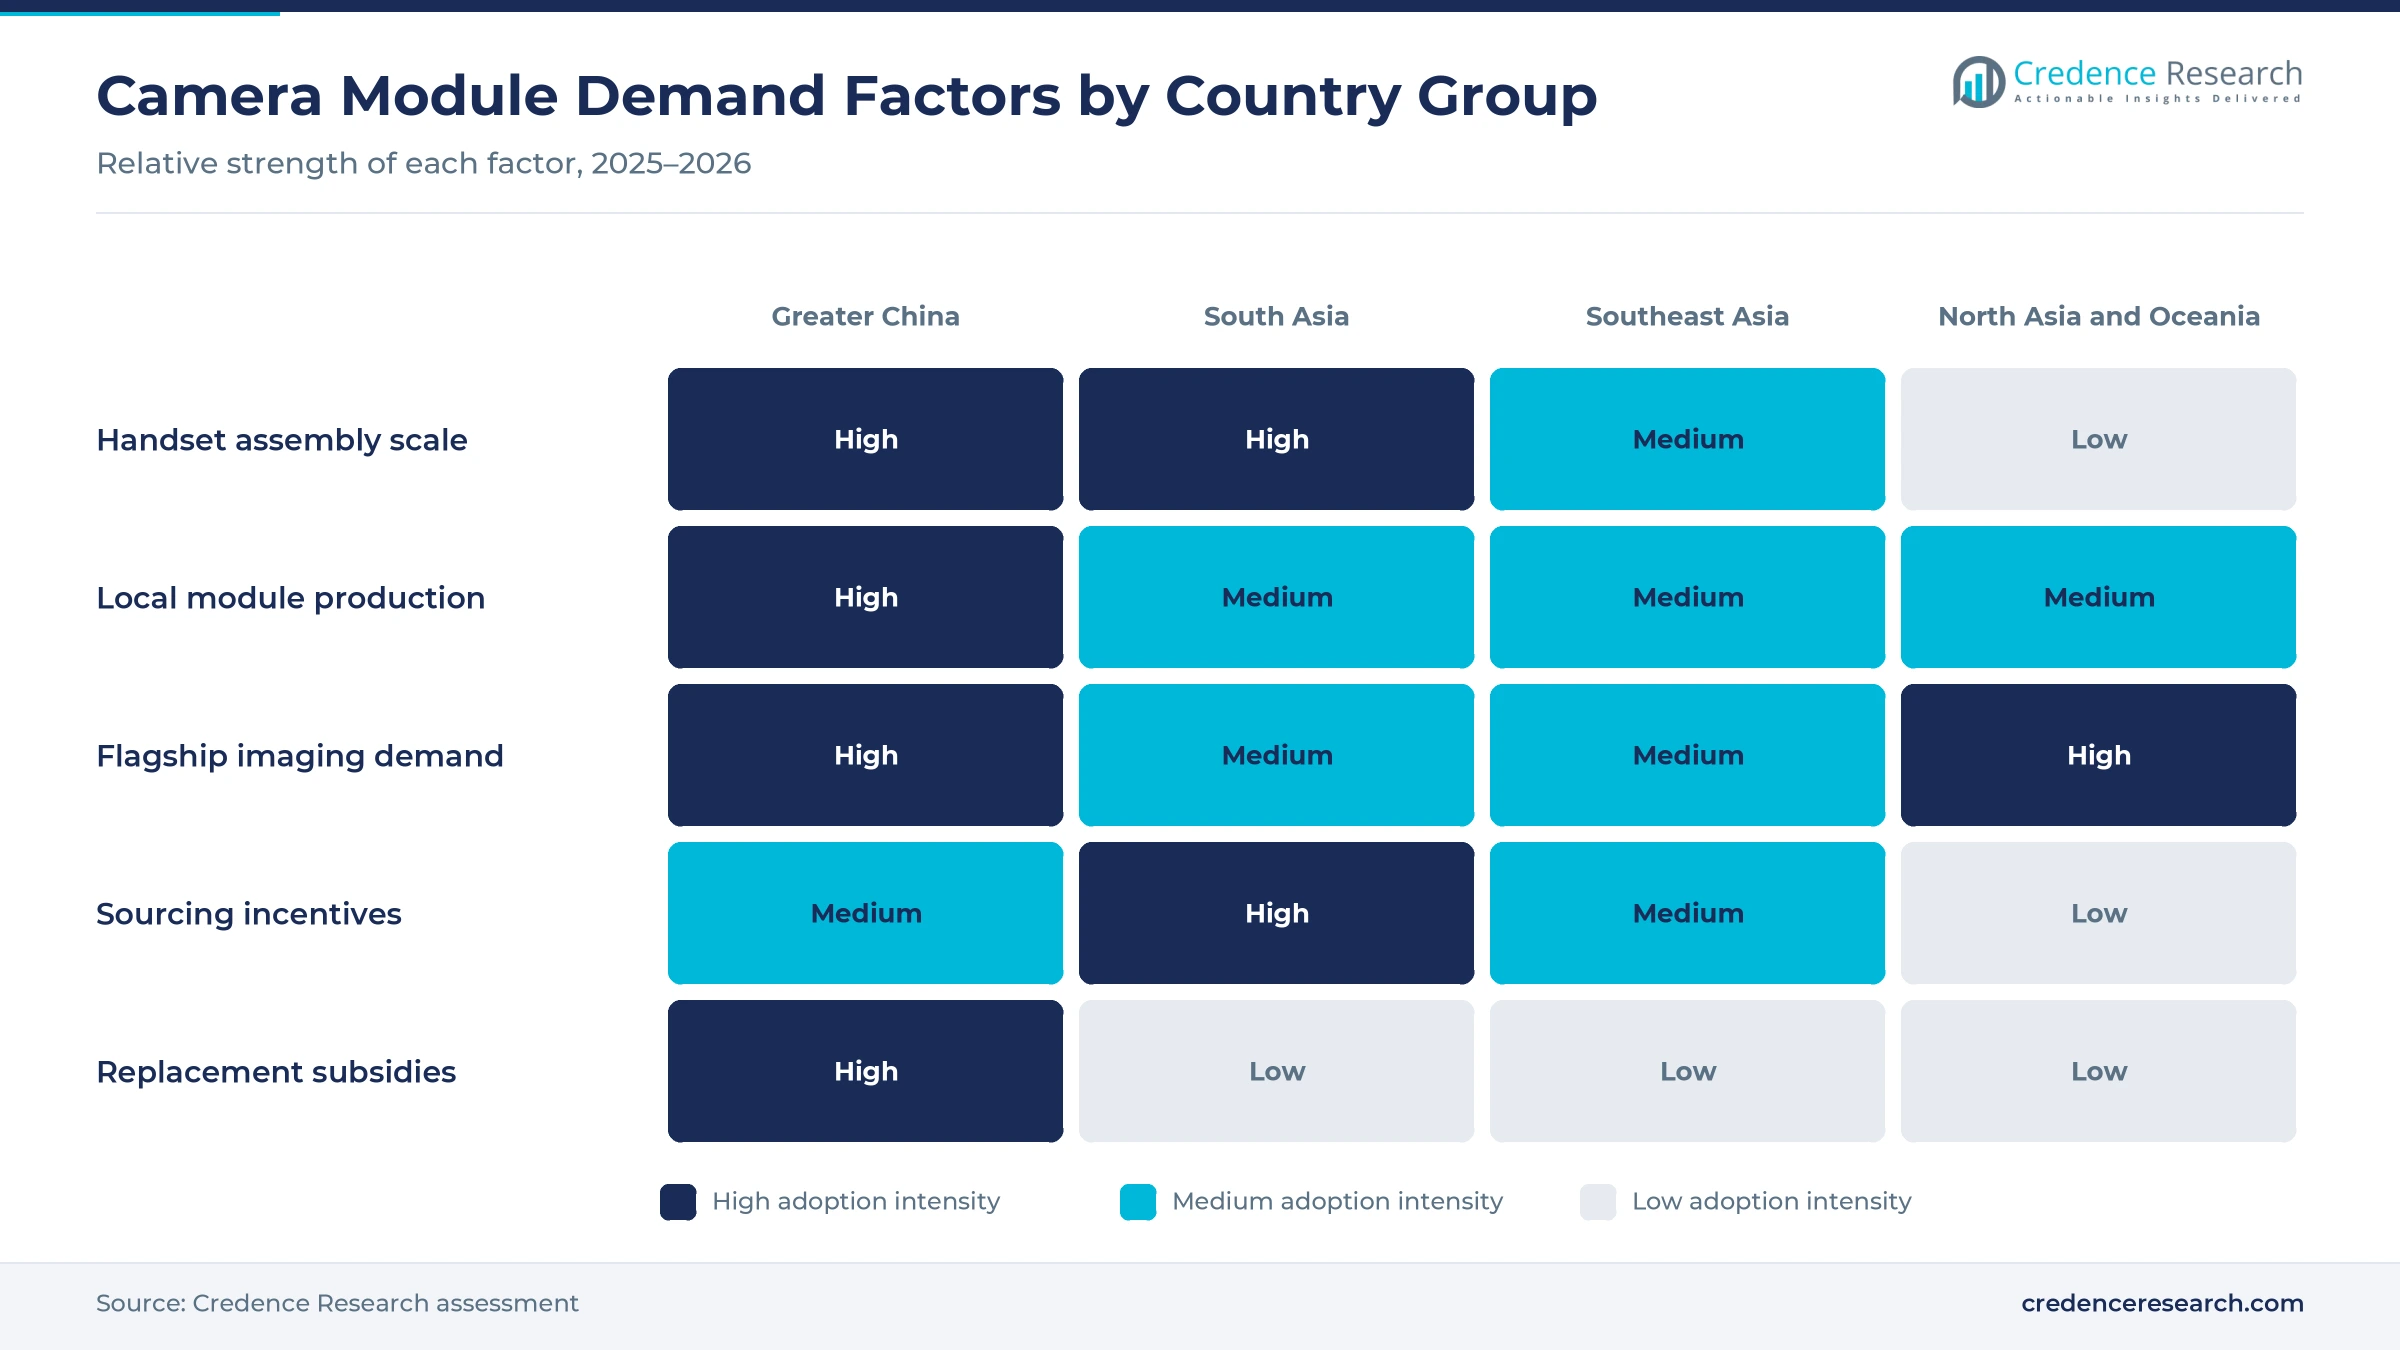
Brands now fit more lenses and cameras to each handset, so module spending rises even when total phone output barely moves. China produced 881 million smartphones in the first three quarters of 2025, only 1% more than a year earlier, according to the Ministry of Industry and Information Technology. However, Sunny Optical shipped 48.5 million handset camera modules in September 2025, up 32.0% year on year. Its November 2025 filing showed 41.5 million modules, up 10.9%, alongside 119.5 million handset lens sets, according to the company's exchange filing. As a result, rear auxiliary modules grow fastest at 8.11% a year as telephoto and ultra-wide units spread to cheaper phones.
Why does premium imaging competition raise module value?
Flagship phones now use larger sensors, longer zoom and more stabilized lenses than the models they replace, which raises the cost of each module. Apple unveiled the iPhone 17 Pro on Sept. 9, 2025, with three 48MP rear cameras, a telephoto sensor 56% larger than before and up to 8x optical-quality zoom, according to the company announcement. Samsung said on Jan. 23, 2025 that the Galaxy S25 Ultra moved its ultra-wide camera from 12MP to 50MP and that the series would be made at its Noida factory. Because these upgrades raise the cost of each unit, Rear main modules kept a 52.0% share of 2025 value, while flagship rivals respond with costlier telephoto designs of their own.
How is India component localization adding module demand?
Phone assembly in India has grown far faster than local supply of parts such as camera modules, which leaves a large sourcing gap to close. Mobile phone production rose from ₹18,000 crore in 2014-15 to ₹5.45 lakh crore in 2024-25, and exports reached ₹2 lakh crore, according to a government factsheet. The Electronics Components Manufacturing Scheme was notified on April 8, 2025, and its outlay rose from ₹22,919 crore to ₹40,000 crore in the 2026-27 budget. Kaynes Circuits India won approval on Oct. 27, 2025 for a ₹325 crore camera module sub-assembly project in Tamil Nadu. Consequently, South Asia gains share faster than any other country group through 2035.
What role do trade-in subsidies play in China?
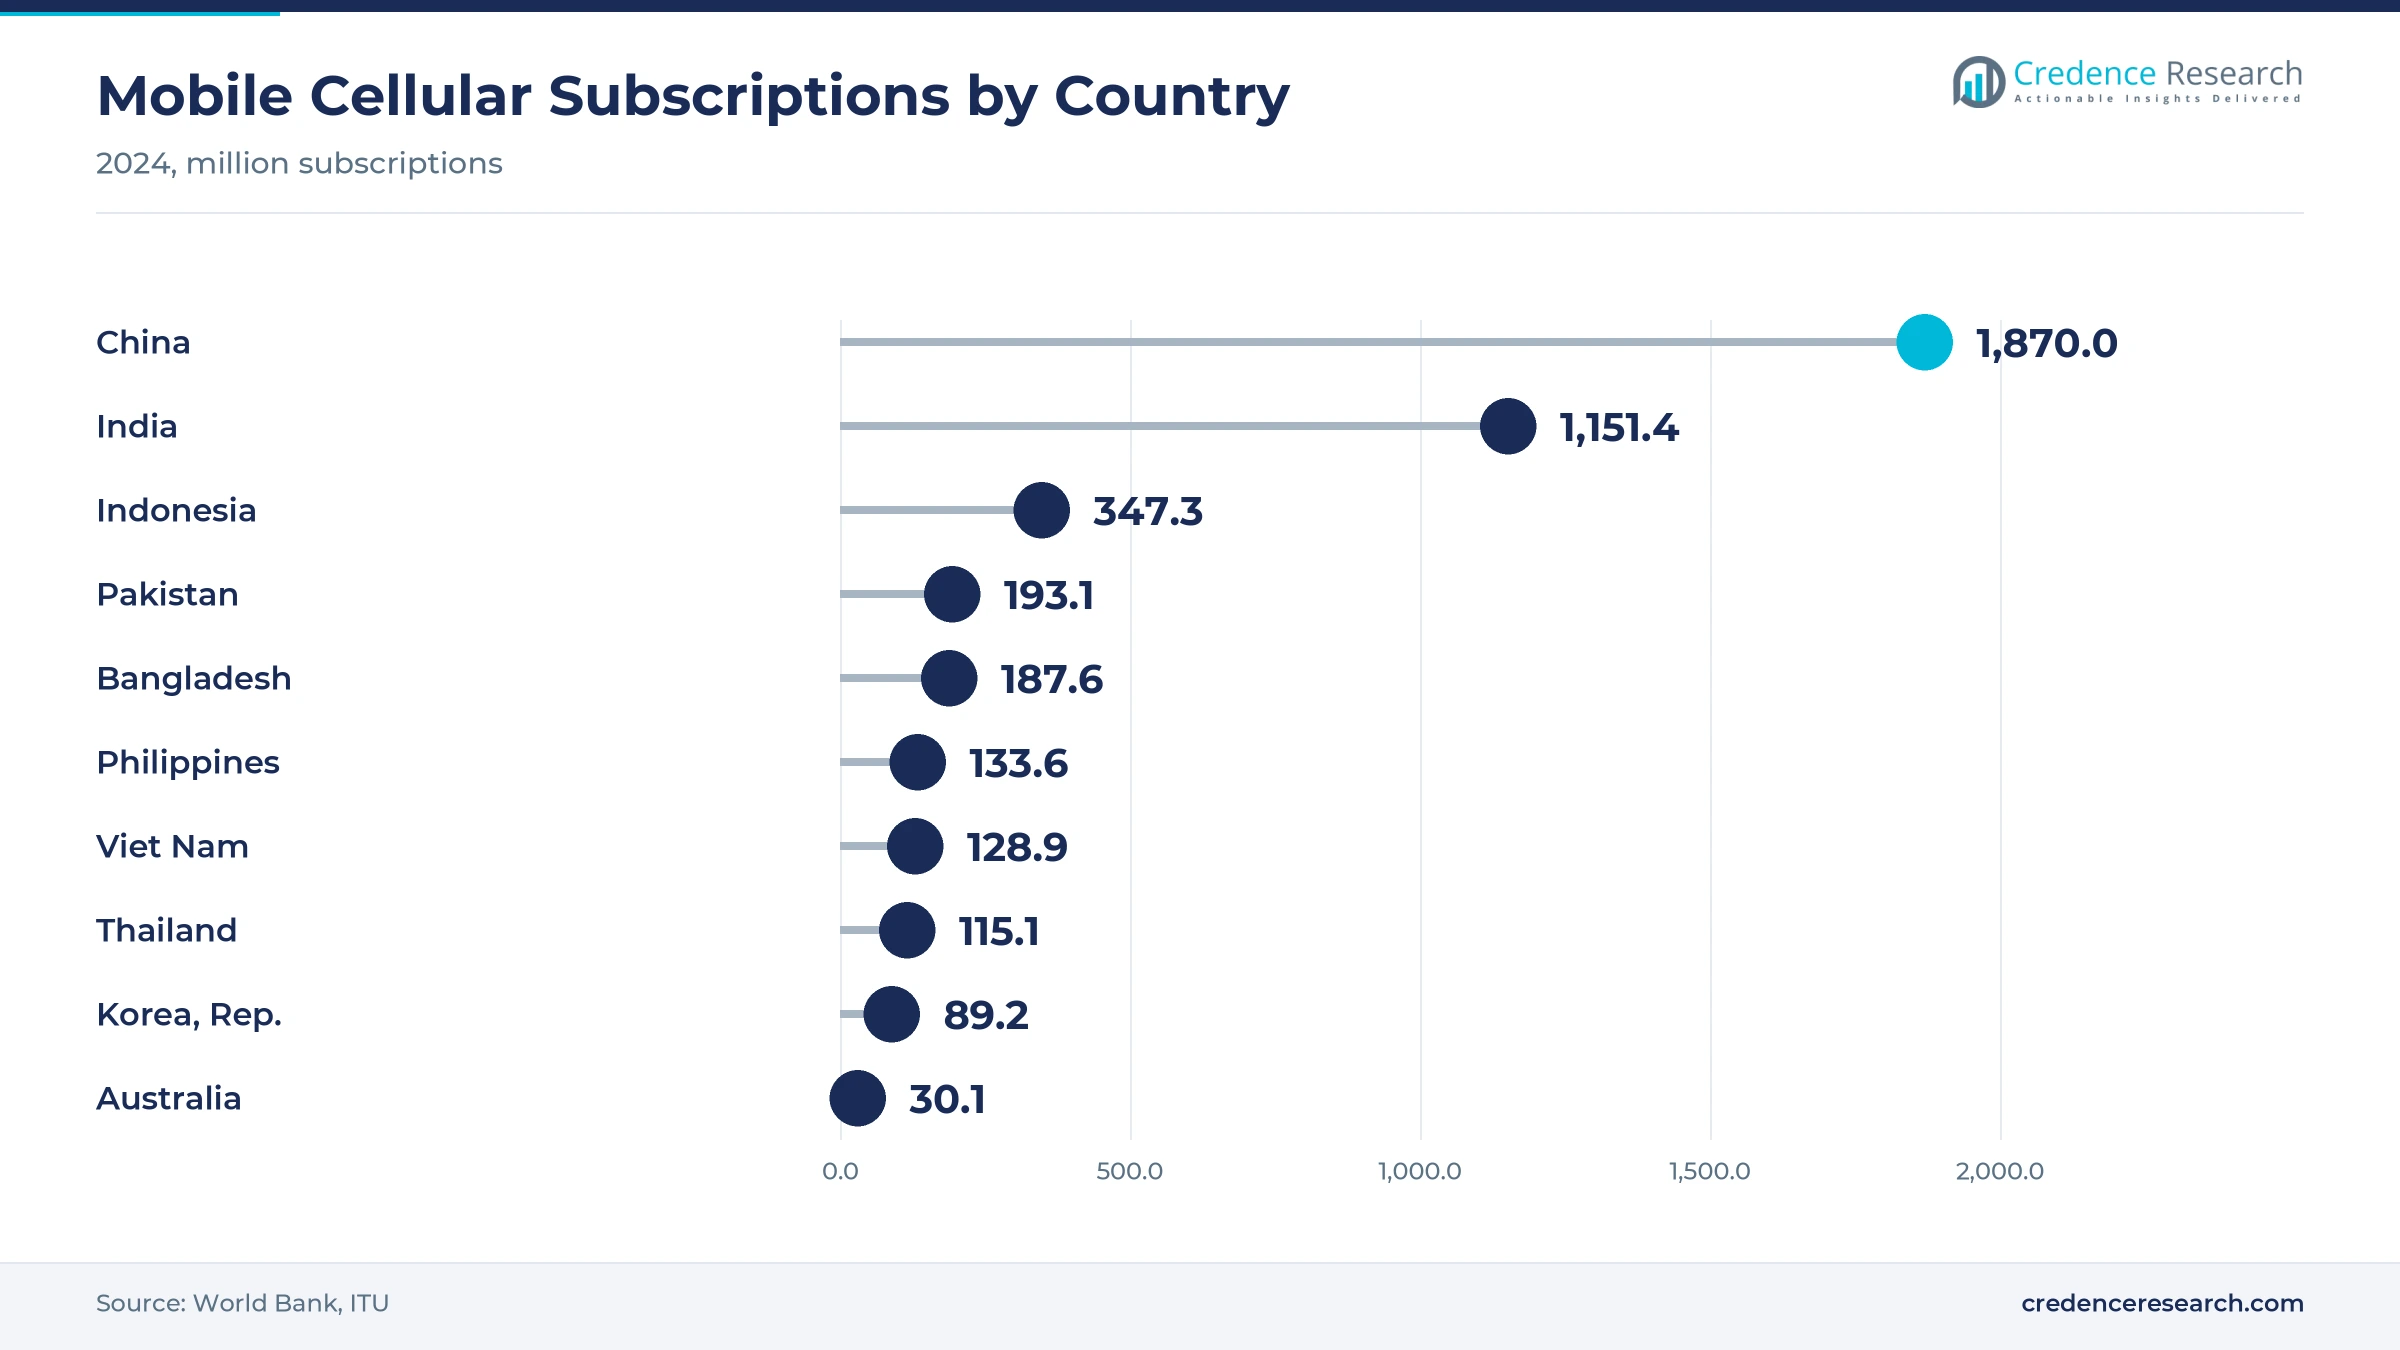
Each subsidized handset sold in China carries a fresh set of modules, regardless of how long the old phone lasted. From Jan. 20, 2025, buyers of phones priced under 6,000 yuan could claim 15% of the final price, capped at 500 yuan per item, under the national program. The 2026 program launched on Jan. 1, 2026, with 62.5 billion yuan of special treasury bond funds allocated in advance. China also counted about 1.87 billion mobile subscriptions in 2024, according to World Bank data. As a result, Greater China keeps the largest share of regional module value through the forecast period.
Telephoto upgrades and contract supply reshape buying
Why are 200MP telephoto designs spreading?
Brands increasingly compete on zoom quality rather than on the main camera alone, and 200MP telephoto sensors are the clearest sign of that change. OPPO launched the Find X9 Pro on Oct. 28, 2025, with a 200MP telephoto sensor co-developed with Hasselblad and lossless zoom up to 13.2x. Vivo followed in India on Dec. 2, 2025, with the X300 Pro and its 200MP ZEISS telephoto camera, built at its Greater Noida facility. Sony announced its 200MP LYTIA 901 sensor in November 2025, with in-sensor zoom up to 4x, which widens the supply of large CMOS image sensors. Consequently, optical zoom imaging grows fastest at 9.19% a year among applications.
How are contract assemblers reshaping module supply?
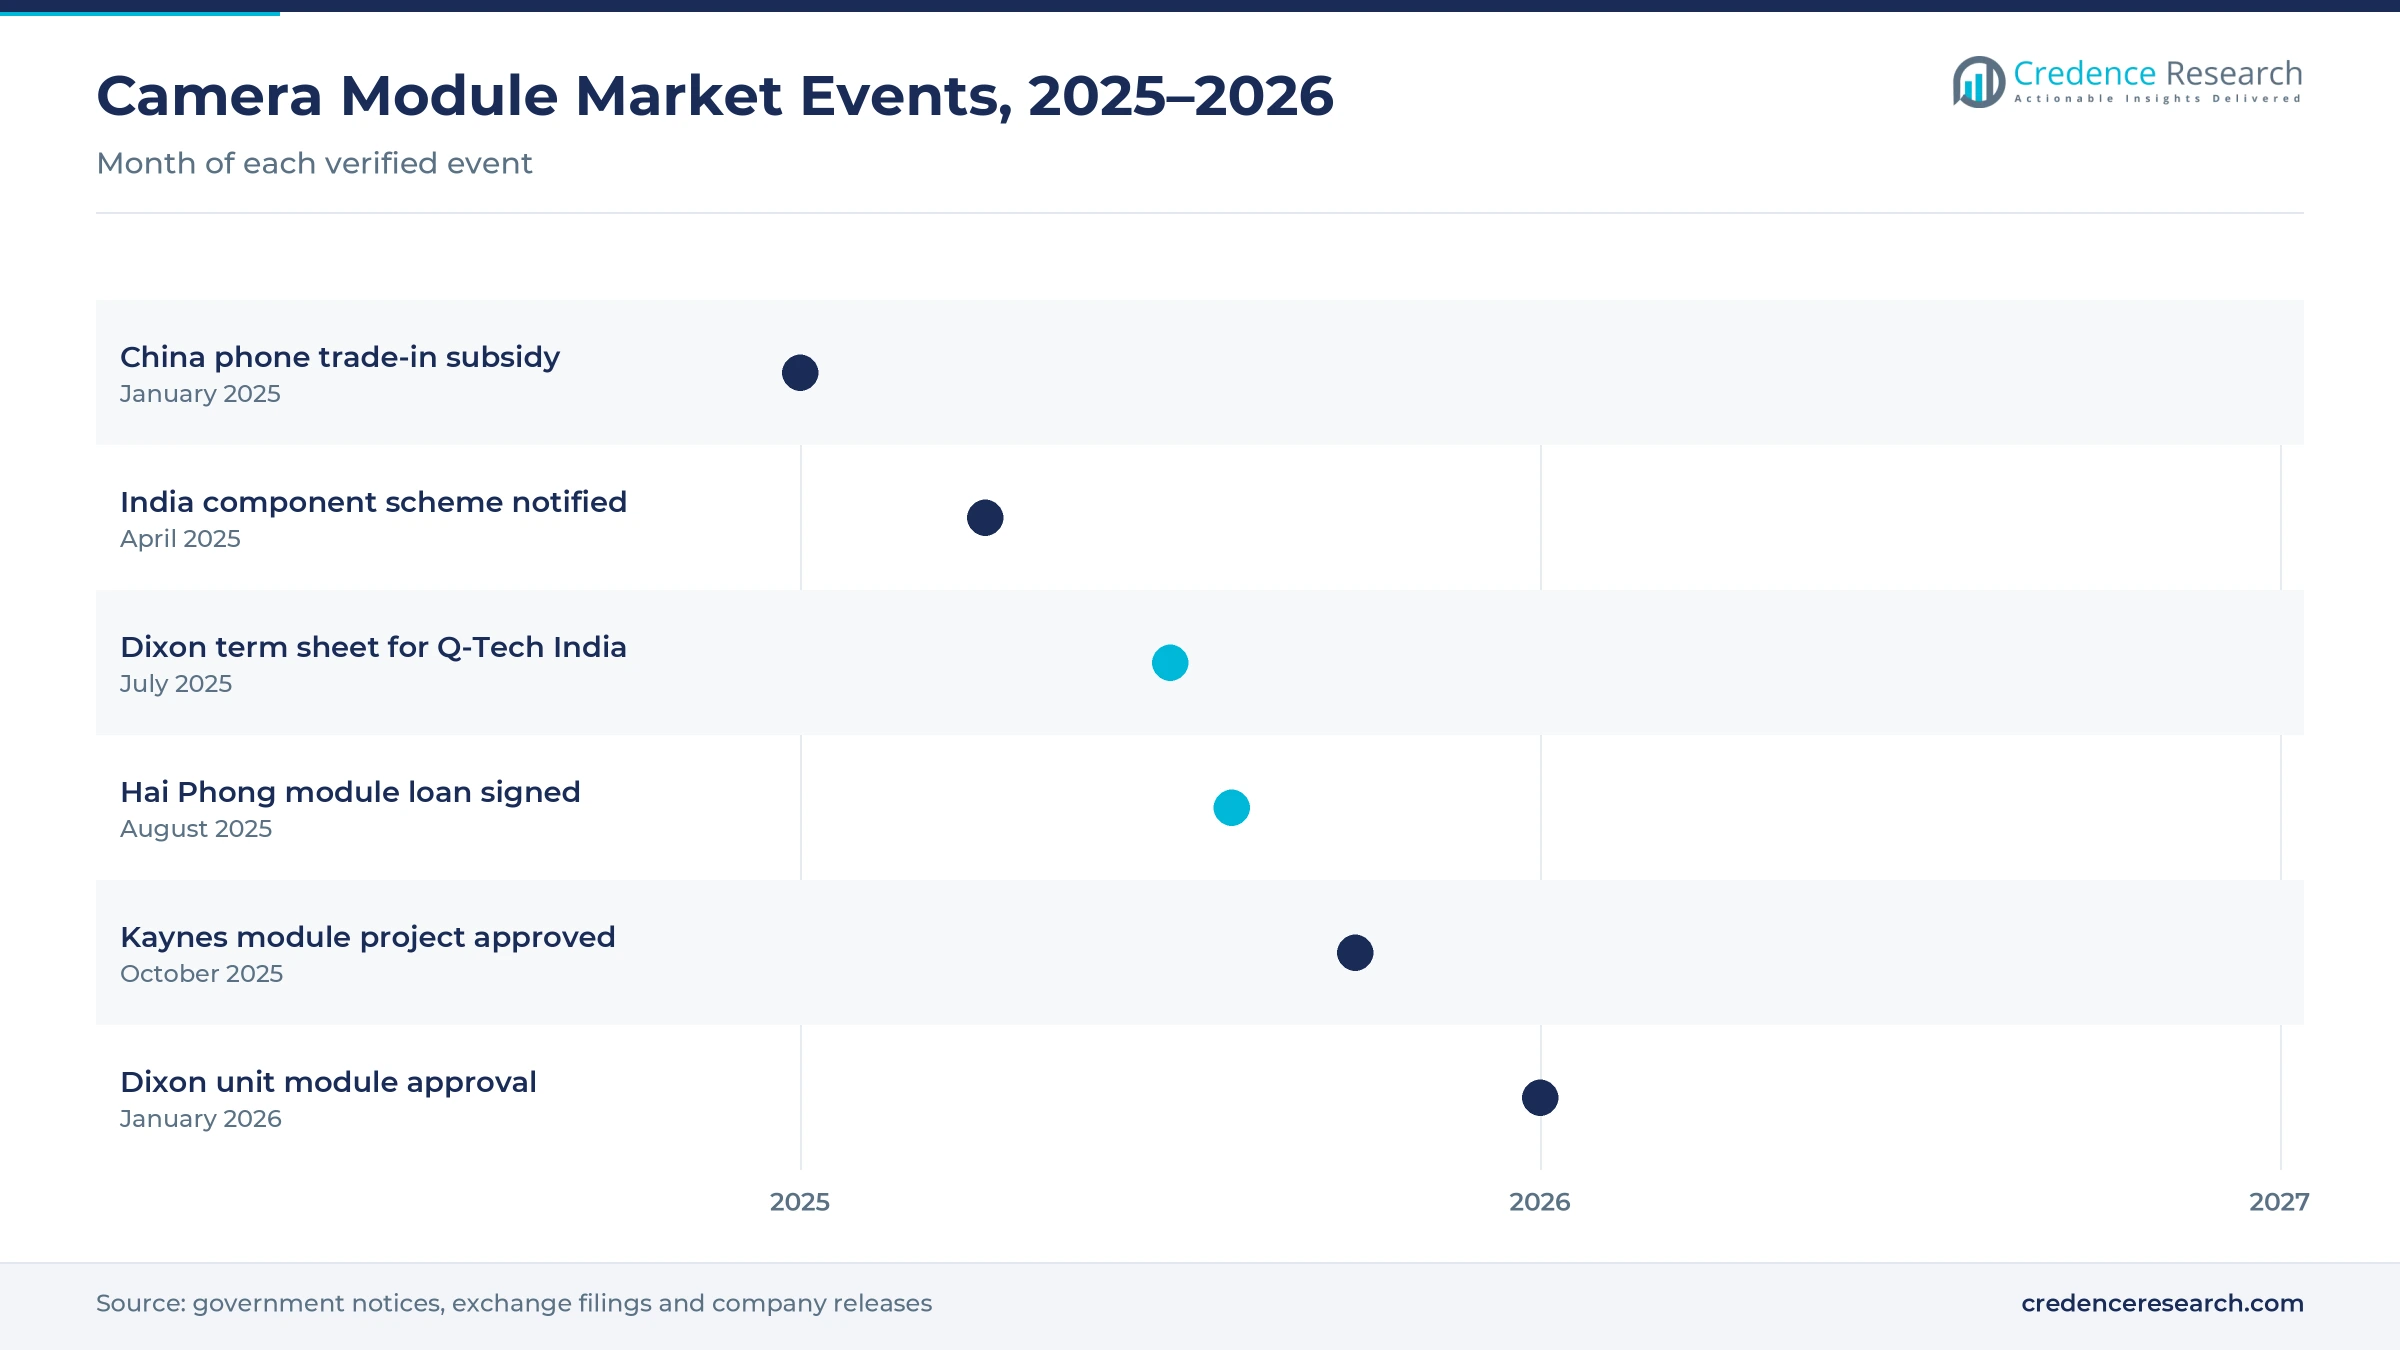
Indian contract assemblers want to capture the value of parts they already fit into phones, and camera modules are a large prize. Dixon Technologies signed a binding term sheet on July 15, 2025 to acquire 51% of Q-Tech India, a camera module maker based in India. Q Technology then deconsolidated Q Tech India on Sept. 26, 2025, and the Dixon subsidiary won scheme approval for camera module sub-assemblies on Jan. 2, 2026. Q Technology still sold 44.1 million phone camera modules in October 2025, up 15.2%, citing market share gains. In turn, electronics manufacturing services procurement grows fastest at 8.16% a year through the forecast.
Can Vietnam and Indonesia plants add module demand?
Brands want module supply close to phone plants outside China, and recent Vietnam investment shows how that capacity is moving. LG Innotek signed a sustainability-linked loan of up to $200 million on Aug. 27, 2025 to expand smartphone camera module capacity at Hai Phong, according to the lender's disclosure. Vietnam exported $50.8 billion of phones and parts through mid-November 2025, up 5%, based on preliminary customs data reported by Viet Nam News. Indonesia also requires 40% local components in phones sold there, its Industry Ministry said on Feb. 26, 2025. As a result, Southeast Asia grows at 8.17% a year.
Where do stabilized optics open mid-range gains?
Buyers now expect sharp night and zoom shots below flagship prices, which pulls stabilization into mid-range phones. Q Technology shipped 18.1 million modules of 32 megapixels and above in October 2025, about 41% of its phone camera modules that month. Vivo rates the stabilization on its X300 Pro at CIPA 5.5, which shows how far mid-range and flagship optics now overlap. Autofocus without optical stabilization still led with 41.0% of 2025 value, yet autofocus with optical stabilization grows fastest at 8.99% a year. Because image processing inside mobile processors now handles multi-frame fusion, suppliers that pair stabilization with that processing win mid-range designs.
Flat handset output and tighter optical tolerances
How does flat handset output limit module growth?
Content gains must offset phone volumes that barely rise, which limits how fast module spending can grow. China made 881 million smartphones in the first three quarters of 2025, up only 1% on a year earlier. As a result, module makers compete hard for each design win, which pressures prices in entry tiers. Suppliers respond by shifting mix toward telephoto and stabilized modules, where higher specifications justify a better price for each unit.
Why do tighter optical tolerances raise costs?
High-resolution sensors expose any lens tilt or decentering, so assembly costs climb with each sensor upgrade. OPPO said its active optical alignment process adds about 15% more resolution to the Find X9 Pro telephoto, which shows how much assembly precision matters. In turn, lines need costlier alignment tools and slower test cycles, and yields fall during ramps. Assemblers respond with automated alignment and closer work with suppliers of lenses and microlens arrays.
What risks surround cross-border module deals?
Governments review foreign stakes in component makers, which adds approval risk to cross-border module deals. Dixon's planned majority stake in Q-Tech India was subject to definitive agreements and regulatory approvals when it was announced in July 2025. Consequently, timelines for new capacity can slip while approvals are pending. Buyers respond by qualifying a second supplier for each module type, which spreads volume but raises qualification work for every phone program.
Can module makers manage swings in high-resolution demand?
Flagship launch timing moves high-end module volume between months and quarters, which makes line planning difficult for suppliers. Q Technology shipped 18.1 million modules of 32 megapixels and above in October 2025, down 11.3% year on year, even as total phone module volume rose. As a result, high-end lines can run below capacity between launches. Suppliers respond by sharing lines across phone, vehicle and connected-device modules.
Greater China leads as South Asia adds capacity fastest
| Country | Value, 2025 (USD billion) | Share, 2025 | CAGR, 2026–2035 |
|---|---|---|---|
| Greater China | 10.97 | 54.0% | 6.77% |
| North Asia and Oceania | 4.57 | 22.5% | 6.67% |
| South Asia | 2.58 | 12.7% | 9.27% |
| Southeast Asia | 2.19 | 10.8% | 8.17% |
Assembly scale and subsidies keep Greater China ahead
Greater China held a 54.0% share of 2025 value and grows at 6.77% a year. China produced 881 million smartphones in the first three quarters of 2025, and Sunny Optical and Q Technology each shipped more than 40 million phone camera modules in a single month late that year. Trade-in subsidies of up to 500 yuan per phone supported replacement from January 2025. Because brands, module makers and lens suppliers sit close together, pricing set in Greater China reaches buyers across the region.
Flagship buyers anchor North Asia and Oceania
North Asia and Oceania held a 22.5% share of 2025 value and grows at 6.67% a year. The Republic of Korea counted about 89.2 million mobile subscriptions and Australia about 30.1 million in 2024, and buyers in both lean toward premium phones. Korean suppliers LG Innotek and Samsung Electro-Mechanics build modules, while Japan-based Sony Semiconductor Solutions supplies image sensors. In turn, demand here favors telephoto, stabilized and foldable handset designs rather than entry fixed-focus units.
Why does South Asia grow fastest?
South Asia held a 12.7% share of 2025 value and grows fastest at 9.27% a year. India's mobile phone production reached ₹5.45 lakh crore in 2024-25, and approved projects under its component scheme include camera modules. Kaynes Circuits India won approval in October 2025 for camera module sub-assembly in Tamil Nadu, and a Dixon subsidiary followed in January 2026. As a result, a larger share of modules fitted in India will be assembled locally instead of imported finished from China.
New plants carry demand across Southeast Asia
Southeast Asia held a 10.8% share of 2025 value and grows at 8.17% a year. LG Innotek is expanding its Hai Phong module plant with lender support signed in August 2025, while Vietnam exported $50.8 billion of phones and parts through mid-November 2025. Indonesia requires 40% local components in phones sold within the country, according to its Industry Ministry. Because Vietnam, Indonesia, Thailand and the Philippines together hold more than 720 million mobile subscriptions, local assembly and replacement both lift module volume.
Plant approvals, flagship launches and deals, 2025–2026
| Development | Status and market relevance |
|---|---|
| In January 2025, China began subsidizing phones under 6,000 yuan at 15% of price, up to 500 yuan per item. | Supports replacement demand in Greater China |
| In April 2025, India notified the Electronics Components Manufacturing Scheme covering camera modules. | Starts local module sub-assembly |
| In July 2025, Dixon Technologies signed a binding term sheet to acquire 51% of Q-Tech India. | Moves module supply toward contract assemblers |
| In August 2025, LG Innotek signed a loan of up to $200 million to expand Hai Phong camera module capacity. | Adds Southeast Asian module capacity |
| In October 2025, Kaynes Circuits India won approval for a camera module sub-assembly project in Tamil Nadu. | Starts local camera module sub-assembly in Tamil Nadu |
Focus and stabilization choices set module price tiers
- Fixed focus modules serve entry rear cameras, depth units and many front cameras, where low cost and small size matter more than close focus.
- Autofocus without optical stabilization remains the volume choice for mid-range rear cameras, because voice coil actuators are cheap and well proven.
- Autofocus with optical stabilization moves lens or sensor to cancel hand shake, which large high-resolution sensors need for sharp low-light shots.
- Periscope telephoto optics fold the light path sideways so long focal lengths fit inside a thin phone body, which raises module price and alignment work.
Need a Custom Version of This Report?
Tailor the scope, geography, or segments to your exact requirements.
- Custom geography or segment scope
- Direct access to our analyst team
Chinese, Korean and Indian assemblers compete on scale
Competition runs between Chinese volume assemblers, Korean suppliers tied to flagship programs and new Indian entrants backed by incentives. Sunny Optical publishes monthly shipments and reported 41.5 million handset camera modules in November 2025, up 10.9%. Q Technology sold 44.1 million phone camera modules in October 2025 and credited market share gains. LG Innotek is expanding its Hai Phong plant with up to $200 million of lender support, while Samsung Electro-Mechanics makes camera modules at its manufacturing base in Vietnam. Sony Semiconductor Solutions supplies large sensors, including the 200MP LYTIA 901. In India, Dixon Technologies is taking a majority stake in Q-Tech India, and Kaynes Circuits India won approval for module sub-assembly in Tamil Nadu. Suppliers compete on alignment precision, sensor access and closeness to phone plants rather than on price alone.
Which module makers and sensor suppliers lead?
| Company | Type | Role in the market |
|---|---|---|
| Sunny Optical Technology (Group) Co., Ltd. | Module and lens maker | 41.5 million handset modules shipped in November 2025 |
| Q Technology (Group) Co., Ltd. | Module maker | 44.1 million phone modules sold in October 2025 |
| LG Innotek Co., Ltd. | Module maker | Hai Phong capacity expansion with lender support from August 2025 |
| Sony Semiconductor Solutions Corporation | Image sensor supplier | Announced the 200MP LYTIA 901 sensor in November 2025 |
| Dixon Technologies (India) Ltd. | Contract assembler | Term sheet for 51% of Q-Tech India signed in July 2025 |
| Kaynes Circuits India Pvt. Ltd. | Component maker | Camera module sub-assembly approval in Tamil Nadu, October 2025 |
Credence Research sees value shifting to zoom optics
Credence Research's view is that Asia Pacific camera module spending will grow faster than handset output through 2035, because each phone carries more cameras and costlier optics than the model it replaces. Rear main modules should keep the largest share, while auxiliary units, zoom imaging and stabilized autofocus add value fastest. Greater China will stay the largest country group, although South Asia gains share as Indian sub-assembly plants ramp up. However, flat phone volumes and tighter optical tolerances will reward suppliers with alignment precision and sensor access.
Module shipments and price tiers anchor the model
The report uses 2025 as the base year and 2035 as the forecast year. Market values come from the Credence Research model, which combines handset output, cameras per phone, module mix by specification and average prices by tier. Country-group shares, country-group growth rates and the splits by product type, application, technology and customer type are Credence Research estimates. Sources used are official statistics, government scheme documents, exchange filings, company announcements, lender disclosures and trade press, and no interviews or surveys were used.
Zoom optics and India sourcing shape demand to 2035
The Asia Pacific smartphone camera module market is expected to reach USD 41.01 billion by 2035, a 7.25% CAGR during 2026–2035, as richer optics and new assembly capacity keep spending rising. Spending is projected to rise from USD 21.84 billion in 2026 as telephoto upgrades and Indian sub-assembly lines ramp together. Growth should be strongest in zoom imaging, stabilized autofocus and South Asia, while Greater China keeps the largest country-group share. In contrast, flat handset volumes and launch-driven swings could slow growth in some years.
Frequently Asked Questions
How big is the Asia Pacific smartphone camera module market?
Which country group leads demand?
Which country group grows fastest?
Which product type holds the largest share?
Which technology grows fastest?
How is India changing module supply?
Who are the leading companies in this market?
What are the main risks to growth?
Table of Content
Chapter 1 Market Segmentation
- 1.1 Segmentation Framework
- 1.1.1 Product and Service Classification
- 1.1.2 Application and End-Use Classification
- 1.1.3 Technology and Solution Classification
- 1.1.4 Customer and Distribution Channel Classification
- 1.1.5 Geographic Segmentation
- 1.1.6 Market Segment Definitions and Boundaries
- 1.2 By Product Type
- 1.2.1 Rear main modules
- 1.2.2 Rear auxiliary modules
- 1.2.3 Front modules
- 1.3 By Application
- 1.3.1 General imaging
- 1.3.2 Optical zoom imaging
- 1.3.3 Depth sensing
- 1.4 By Technology
- 1.4.1 Fixed focus
- 1.4.2 Autofocus without optical stabilization
- 1.4.3 Autofocus with optical stabilization
- 1.5 By Customer Type
- 1.5.1 Brand-led procurement
- 1.5.2 Original design manufacturer procurement
- 1.5.3 Electronics manufacturing services procurement
- 1.6 By Country
- 1.6.1 Greater China
- 1.6.2 South Asia
- 1.6.3 Southeast Asia
- 1.6.4 North Asia and Oceania
Chapter 2 Introduction
- 2.1 Report Objectives and Scope
- 2.2 Product Definition and Industry Terminology
- 2.3 Market Inclusions and Exclusions
- 2.4 Research Process
- 2.4.1 Primary Research and Expert Interviews
- 2.4.2 Secondary Research and Source Review
- 2.4.3 Top-Down and Bottom-Up Estimation
- 2.4.4 Data Triangulation and Verification
- 2.5 Market Size Measurement Basis
- 2.5.1 2025: USD 20.31 billion → 2035: USD 41.01 billion
- 2.6 Historical and Forecast Reference Periods
- 2.6.1 Historical Period: 2018-2025
- 2.6.2 Base Year: 2025
- 2.6.3 Forecast Period: 2025-2035
- 2.7 Research Assumptions and Limitations
Chapter 3 Executive Summary
- 3.1 Market Snapshot and Key Findings
- 3.2 Base-Year Market Size, 2025
- 3.3 Forecast Market Size, 2035
- 3.4 Revenue and Volume Growth Outlook
- 3.5 Key Demand and Supply Indicators
- 3.6 Leading Market Segments
- 3.7 Fastest-Growing Market Opportunities
- 3.8 Regional Performance Highlights
- 3.9 Technology and Industry Transformation
- 3.10 Competitive Landscape Summary
- 3.11 Analyst View and Strategic Implications
Chapter 4 Asia Pacific Smartphone Camera Module Market Trends and Developments
- 4.1 Historical Industry Development, 2018-2025
- 4.2 Recent Market Trends and Developments
- 4.3 Demand and Customer Behavior Trends
- 4.4 Technology and Product Innovation
- 4.5 Artificial Intelligence, Automation and Digitalization
- 4.6 Local Manufacturing and Supply Chain Realignment
- 4.7 Industry Partnerships, Mergers and Acquisitions
- 4.8 Sustainability and Circular Economy Developments
- 4.9 Government and Private Sector Investment Trends
- 4.10 Emerging Business Models and Commercialization
- 4.11 Industry Developments and Announcements
Chapter 5 Asia Pacific Smartphone Camera Module Market Production, Supply and Demand Analysis
- 5.1 Demand Trend and Consumption Analysis, 2018-2025
- 5.2 Demand Forecast, 2025-2035
- 5.3 Production and Output Trend, 2018-2025
- 5.4 Production and Output Forecast, 2025-2035
- 5.5 Installed Capacity and Capacity Utilization
- 5.6 Company-Wise Production Plants and Statistics
- 5.6.1 Installed Production Capacity
- 5.6.2 Actual Production
- 5.6.3 Planned Capacity and Expansion Targets
- 5.7 Supply Chain Structure and Procurement Trends
- 5.8 Supply-Demand Gap and Bottlenecks
- 5.9 Import Dependence and Sourcing Structure
- 5.10 Contract Manufacturing and Outsourcing
- 5.11 Regional Supply and Demand Concentration
Chapter 6 Asia Pacific Smartphone Camera Module Market Pricing Analysis
- 6.1 Pricing Structure and Measurement
- 6.2 Historical Pricing Trends, 2018-2025
- 6.3 Pricing Outlook, 2025-2035
- 6.4 Average Selling Price and Unit Economics
- 6.5 Pricing by Product and Market Segment
- 6.6 Geographic Pricing Differences
- 6.7 Key Input, Energy, Labor and Logistics Costs
- 6.8 Contract Pricing and Purchasing Models
- 6.9 Pricing Sensitivity and Competitive Positioning
- 6.10 Price, Margin and Profitability Implications
Chapter 7 Asia Pacific Smartphone Camera Module Market Dynamics
- 7.1 Market Growth Drivers
- 7.1.1 Demand-Side Drivers
- 7.1.2 Technology and Innovation Drivers
- 7.1.3 Infrastructure and Investment Drivers
- 7.1.4 Regulatory and Policy Drivers
- 7.2 Market Restraints
- 7.2.1 Cost and Affordability Constraints
- 7.2.2 Technology and Adoption Barriers
- 7.2.3 Supply Chain and Operational Constraints
- 7.3 Market Challenges
- 7.3.1 Competitive Pressure and Margin Erosion
- 7.3.2 Skills, Infrastructure and Implementation Gaps
- 7.4 Emerging Market Opportunities
- 7.5 Market Dynamics Impact and Time-Horizon Assessment
Chapter 8 Asia Pacific Smartphone Camera Module Value Chain Analysis
- 8.1 Industry Value Chain Overview
- 8.2 Upstream Suppliers and Critical Inputs
- 8.3 Technology and Component Providers
- 8.4 Manufacturing or Service Delivery
- 8.5 Distribution, Channel Partners and Integrators
- 8.6 Downstream Applications and End Users
- 8.7 Value Addition and Profit Pools
- 8.8 Vertical Integration and Outsourcing
- 8.9 Supplier Concentration and Risk
- 8.10 Supply Chain Localization and Resilience
Chapter 9 Asia Pacific Smartphone Camera Module Market Regulations and Policies
- 9.1 Relevant Laws, Standards and Compliance Frameworks
- 9.2 Product, Service, Safety and Quality Requirements
- 9.3 Government Policies, Incentives and Subsidies
- 9.4 Imports, Exports and Trade Barriers
- 9.5 Public Procurement and Local Content Requirements
- 9.6 Environmental and Sustainability Compliance
- 9.7 Upcoming Policy Changes and Market Implications
Chapter 10 Asia Pacific Smartphone Camera Module Market Hotspots and Opportunities
- 10.1 Market Opportunity Mapping and Growth Hotspots
- 10.2 High-Growth Applications and Customer Groups
- 10.3 Underserved Markets and White-Space Opportunities
- 10.4 Emerging Technology and Product Opportunities
- 10.5 New Capacity and Investment Hotspots
- 10.6 Market Entry and Expansion Opportunities
- 10.7 Distribution and Partnership Opportunities
- 10.8 Near-Term and Long-Term Commercial Potential
- 10.9 Opportunity Attractiveness and Execution Risks
Chapter 11 Asia Pacific Smartphone Camera Module Market Outlook, 2025-2035
- 11.1 Market Size and Analysis
- 11.1.1 Revenue (Market Measurement: 2025: USD 20.31 billion → 2035: USD 41.01 billion)
- 11.1.2 Market Volume and Quantity Sold
- 11.1.3 Historical Market Size, 2018-2025
- 11.1.4 Base-Year Market Size, 2025
- 11.2 Market Forecast, 2025-2035
- 11.2.1 Revenue Forecast to 2035
- 11.2.2 Volume Forecast to 2035
- 11.2.3 CAGR and Year-on-Year Growth
- 11.2.4 Incremental Revenue Opportunity
- 11.3 Forecast Assumptions and Scenario Analysis
- 11.3.1 Base-Case Forecast
- 11.3.2 Optimistic and Conservative Scenarios
- 11.3.3 Technology, Pricing and Policy Sensitivities
- 11.4 Market Attractiveness and Growth Outlook
Chapter 12 Asia Pacific Smartphone Camera Module Market Segmentation and Outlook
- 12.1 Segmentation Summary and Market Shares, 2025
- 12.2 Largest and Fastest-Growing Segments
- 12.3 By Product Type - Market Size and Forecast, 2025-2035
- 12.3.1 Segment Definition and Scope
- 12.3.2 Historical Market Size, 2018-2025
- 12.3.3 Revenue Forecast, 2025-2035
- 12.3.4 Volume Forecast, 2025-2035
- 12.3.5 Base-Year Market Share, 2025
- 12.3.6 Segment CAGR and Growth Drivers
- 12.3.7 Subsegment Market Size and Forecast
- 12.3.7.1 Rear main modules
- 12.3.7.2 Rear auxiliary modules
- 12.3.7.3 Front modules
- 12.3.8 Subsegment Pricing and Adoption Trends
- 12.3.9 Leading Suppliers and Competition
- 12.3.10 Regional Demand and Opportunities
- 12.4 By Application - Market Size and Forecast, 2025-2035
- 12.4.1 Segment Definition and Scope
- 12.4.2 Historical Market Size, 2018-2025
- 12.4.3 Revenue Forecast, 2025-2035
- 12.4.4 Volume Forecast, 2025-2035
- 12.4.5 Base-Year Market Share, 2025
- 12.4.6 Segment CAGR and Growth Drivers
- 12.4.7 Subsegment Market Size and Forecast
- 12.4.7.1 General imaging
- 12.4.7.2 Optical zoom imaging
- 12.4.7.3 Depth sensing
- 12.4.8 Subsegment Pricing and Adoption Trends
- 12.4.9 Leading Suppliers and Competition
- 12.4.10 Regional Demand and Opportunities
- 12.5 By Technology - Market Size and Forecast, 2025-2035
- 12.5.1 Segment Definition and Scope
- 12.5.2 Historical Market Size, 2018-2025
- 12.5.3 Revenue Forecast, 2025-2035
- 12.5.4 Volume Forecast, 2025-2035
- 12.5.5 Base-Year Market Share, 2025
- 12.5.6 Segment CAGR and Growth Drivers
- 12.5.7 Subsegment Market Size and Forecast
- 12.5.7.1 Fixed focus
- 12.5.7.2 Autofocus without optical stabilization
- 12.5.7.3 Autofocus with optical stabilization
- 12.5.8 Subsegment Pricing and Adoption Trends
- 12.5.9 Leading Suppliers and Competition
- 12.5.10 Regional Demand and Opportunities
- 12.6 By Customer Type - Market Size and Forecast, 2025-2035
- 12.6.1 Segment Definition and Scope
- 12.6.2 Historical Market Size, 2018-2025
- 12.6.3 Revenue Forecast, 2025-2035
- 12.6.4 Volume Forecast, 2025-2035
- 12.6.5 Base-Year Market Share, 2025
- 12.6.6 Segment CAGR and Growth Drivers
- 12.6.7 Subsegment Market Size and Forecast
- 12.6.7.1 Brand-led procurement
- 12.6.7.2 Original design manufacturer procurement
- 12.6.7.3 Electronics manufacturing services procurement
- 12.6.8 Subsegment Pricing and Adoption Trends
- 12.6.9 Leading Suppliers and Competition
- 12.6.10 Regional Demand and Opportunities
- 12.7 By Country - Market Size and Forecast, 2025-2035
- 12.7.1 Segment Definition and Scope
- 12.7.2 Historical Market Size, 2018-2025
- 12.7.3 Revenue Forecast, 2025-2035
- 12.7.4 Volume Forecast, 2025-2035
- 12.7.5 Base-Year Market Share, 2025
- 12.7.6 Segment CAGR and Growth Drivers
- 12.7.7 Subsegment Market Size and Forecast
- 12.7.7.1 Greater China
- 12.7.7.2 South Asia
- 12.7.7.3 Southeast Asia
- 12.7.7.4 North Asia and Oceania
- 12.7.8 Subsegment Pricing and Adoption Trends
- 12.7.9 Leading Suppliers and Competition
- 12.7.10 Regional Demand and Opportunities
- 12.8 Segment Growth Comparison
- 12.9 Segment Attractiveness and Priority Matrix
Chapter 13 Asia Pacific Smartphone Camera Module End-Use and Application Market Outlook
- 13.1 End-Use Industry and Customer Demand Structure
- 13.2 Leading Applications and Customer Groups
- 13.3 End-Use Market Size, Share and Forecast
- 13.4 Major End-Use Industry Deep Dives
- 13.4.1 Customer Requirements and Use Cases
- 13.4.2 Demand and Replacement Cycles
- 13.4.3 Technical and Regulatory Considerations
- 13.4.4 Purchasing and Procurement Models
- 13.4.5 Leading Vendors and Distribution Channels
- 13.4.6 Forecast and Commercial Opportunities
- 13.5 Emerging Applications and Cross-Segment Demand
- 13.6 End-Use Industry Investment Priorities
Chapter 14 Asia Pacific Smartphone Camera Module Geographic Market Outlook, 2025-2035
- 14.1 Regional Market Size and Country-Level Shares, 2025
- 14.2 Country Market Size Comparison, 2025
- 14.3 Country Market Forecasts, 2025-2035
- 14.4 Subregional Industrial and Demand Clusters
- 14.5 Intra-Regional Pricing and Cost Differences
- 14.6 Cross-Border Trade and Supply Networks
- 14.7 Regional Supply and Demand Balances
- 14.8 Country Opportunity Comparison and Prioritization
Note: Every listed country is covered on the structure shown under the first country.
Chapter 15 Asia Pacific Smartphone Camera Module Technology, Innovation and Sustainability Outlook
- 15.1 Technology Landscape and Maturity
- 15.2 Product, Process and Service Innovation
- 15.3 AI, Automation and Digital Tools in the Industry
- 15.4 Technology Adoption and Performance Benchmarking
- 15.5 Innovation Pipeline and R&D Investment
- 15.6 Patent and Intellectual Property Trends
- 15.7 Energy Efficiency and Resource Management
- 15.8 Sustainability, Recycling and Circularity
- 15.9 Technology Roadmap, 2025-2035
- 15.10 Risks of Obsolescence and Technology Substitution
Chapter 16 Asia Pacific Smartphone Camera Module Market Key Strategic Imperatives
- 16.1 Growth and Market Entry Priorities
- 16.2 High-Return Products and Segments
- 16.3 Pricing, Profitability and Cost Optimization
- 16.4 Technology Investment and Product Differentiation
- 16.5 Supply Chain Localization and Resilience
- 16.6 Distribution and Customer Acquisition
- 16.7 Partnership, Acquisition and Capacity Strategy
- 16.8 Regional Expansion Priorities
- 16.9 Short-, Medium- and Long-Term Actions
Chapter 17 Competition Outlook
- 17.1 Industry Competition Characteristics
- 17.2 Market Structure and Concentration
- 17.3 Market Share and Competitive Positioning, 2025
- 17.4 Company-Wise Revenue and Product Benchmarking
- 17.5 Production and Service Capacity Benchmarking
- 17.6 Technology, Pricing and Differentiation
- 17.7 Regional Footprint and Distribution Strength
- 17.8 Mergers, Acquisitions and Strategic Alliances
- 17.9 New Entrants and Competitive Threats
- 17.10 Porter's Five Forces and Industry Attractiveness
- 17.11 Competitive Outlook, 2025-2035
Chapter 18 Company Profiles
- 18.1 Company Coverage and Selection Criteria
- 18.2 Sunny Optical Technology (Group) Co., Ltd.
- 18.2.1 Business Description
- 18.2.2 Company Ownership and Geographic Presence
- 18.2.3 Product and Service Portfolio
- 18.2.4 Manufacturing and Operating Footprint
- 18.2.5 Production Capacity and Expansion Plans
- 18.2.6 Financial Performance and Investment
- 18.2.7 Market Share and Competitive Position
- 18.2.8 Technology and Innovation Capabilities
- 18.2.9 Strategic Alliances or Partnerships
- 18.2.10 Recent Developments
- 18.2.11 Growth Strategy and Outlook
- 18.3 Q Technology (Group) Co., Ltd.
- 18.4 LG Innotek Co., Ltd.
- 18.5 Samsung Electro-Mechanics Co., Ltd.
- 18.6 Sony Semiconductor Solutions Corporation
- 18.7 Dixon Technologies (India) Ltd.
- 18.8 Kaynes Circuits India Pvt. Ltd.
- 18.9 Other Relevant Market Participants
Note: Every listed company is profiled on the structure shown under the first company. The company list is preliminary and may change based on research findings, market developments, data availability and client requirements.
Chapter 19 Disclaimer
- 19.1 Research and Forecast Disclaimer
- 19.2 Data Source and Estimation Limitations
Note: The depth of individual sections depends on data availability for this market. Volume, capacity, trade and other unit-based metrics are included where applicable.

