
Phone assembly, AI compute and new chip plants lift demand
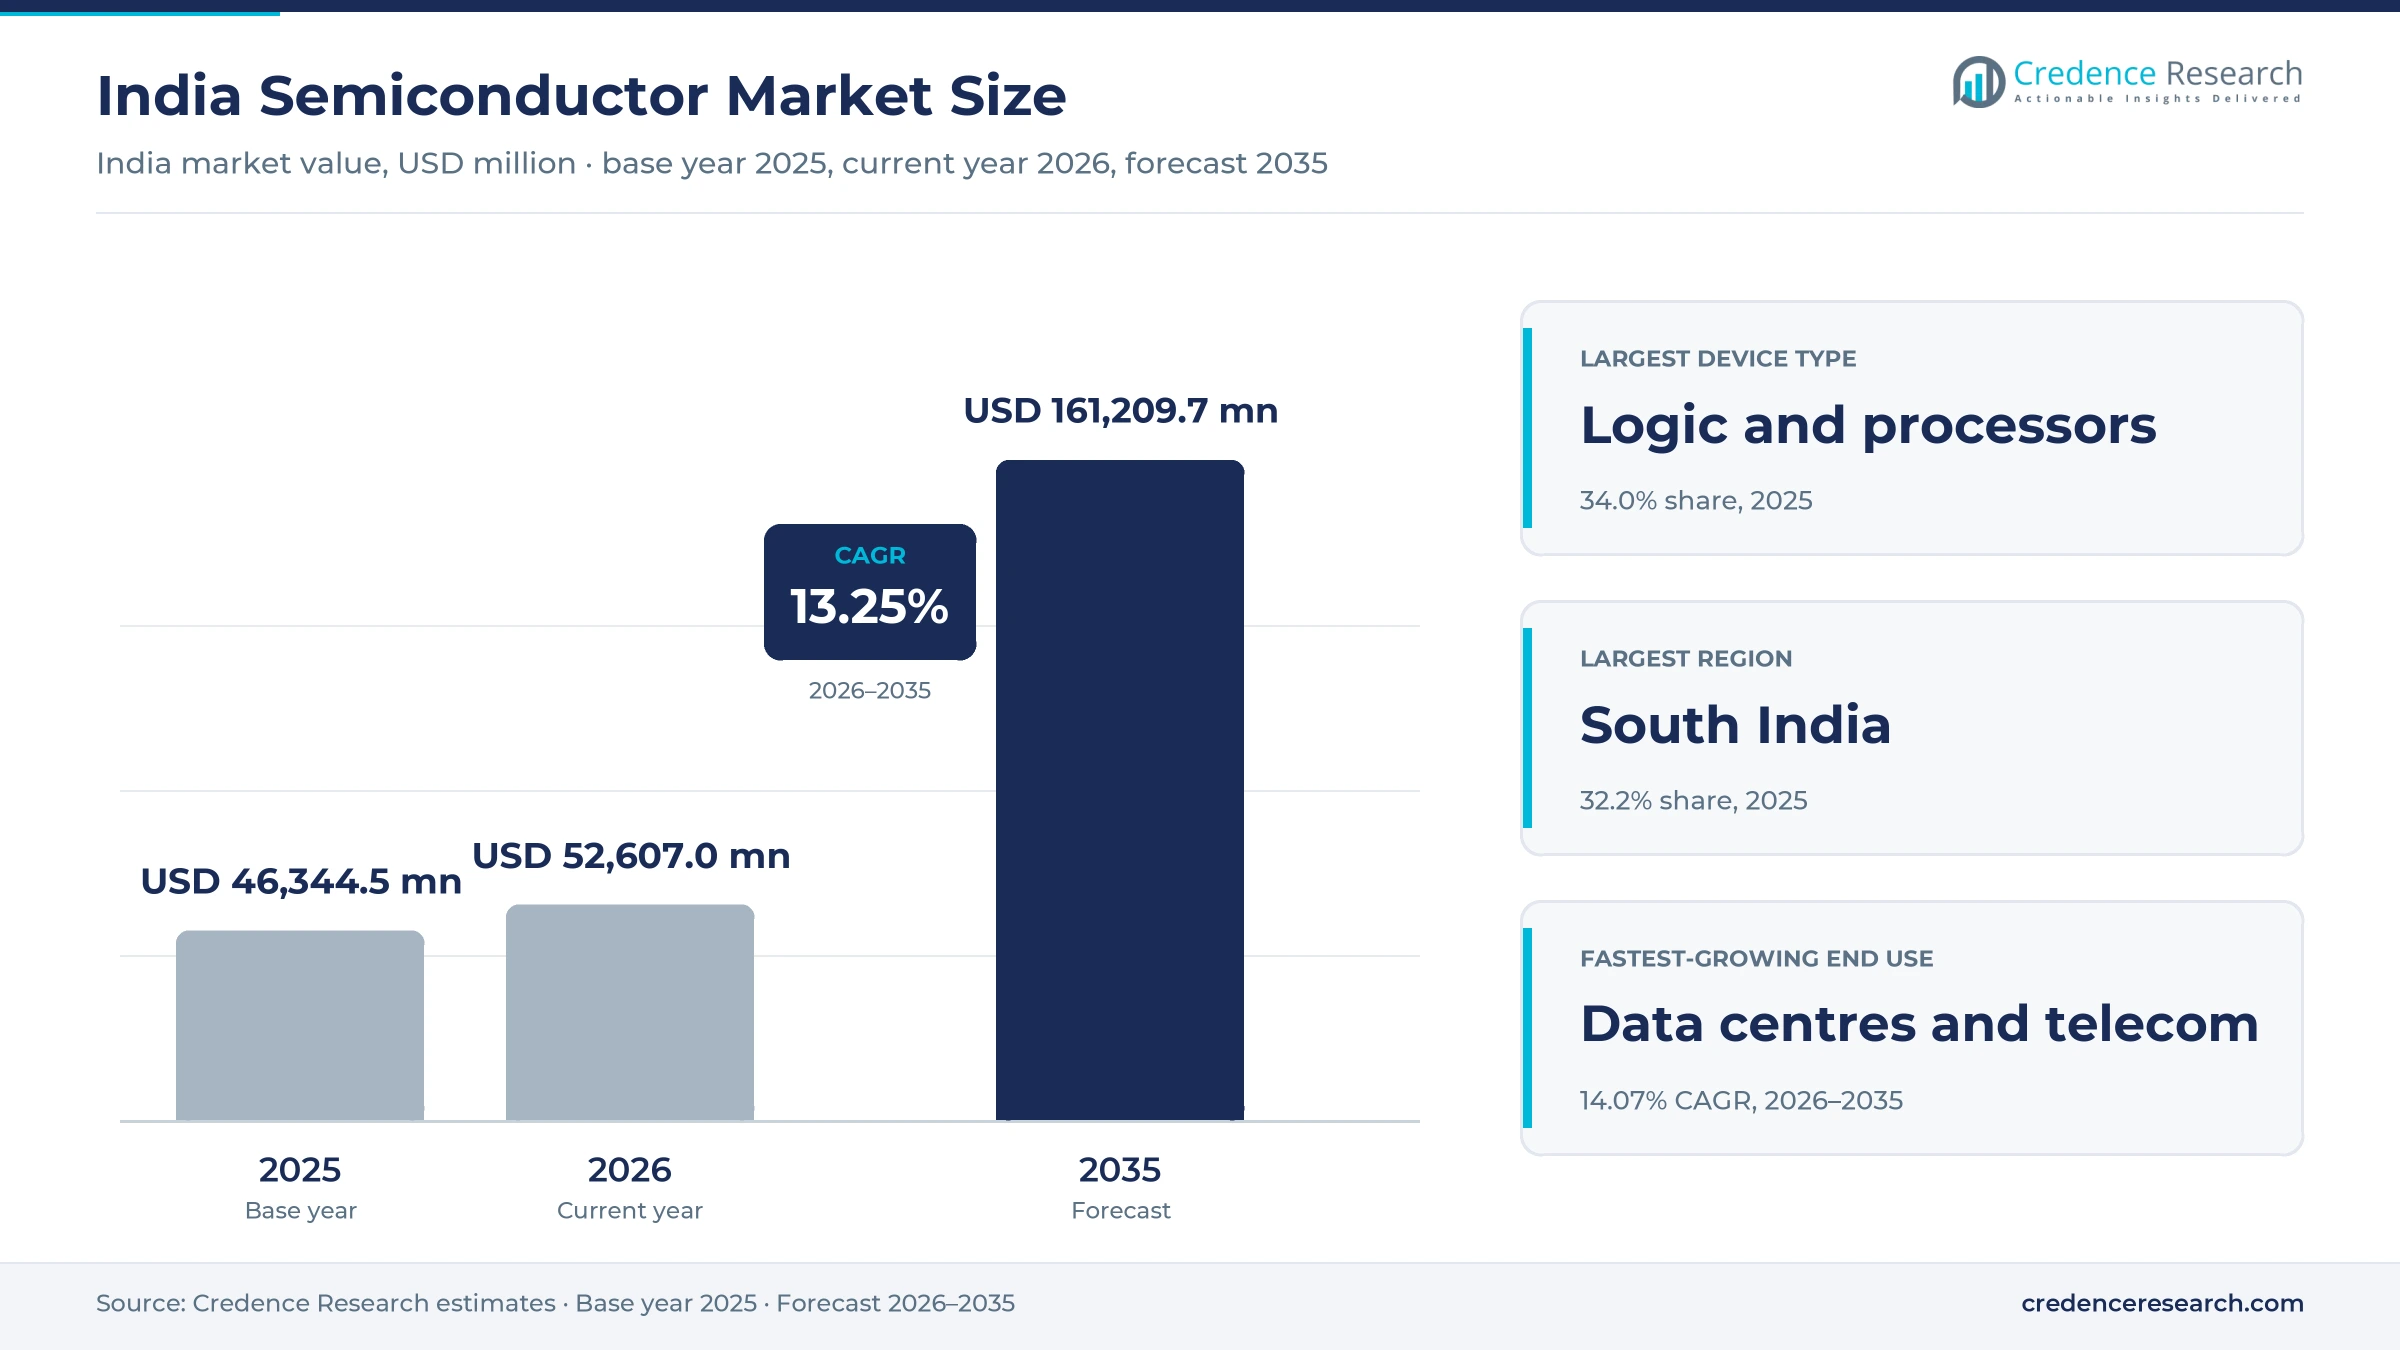
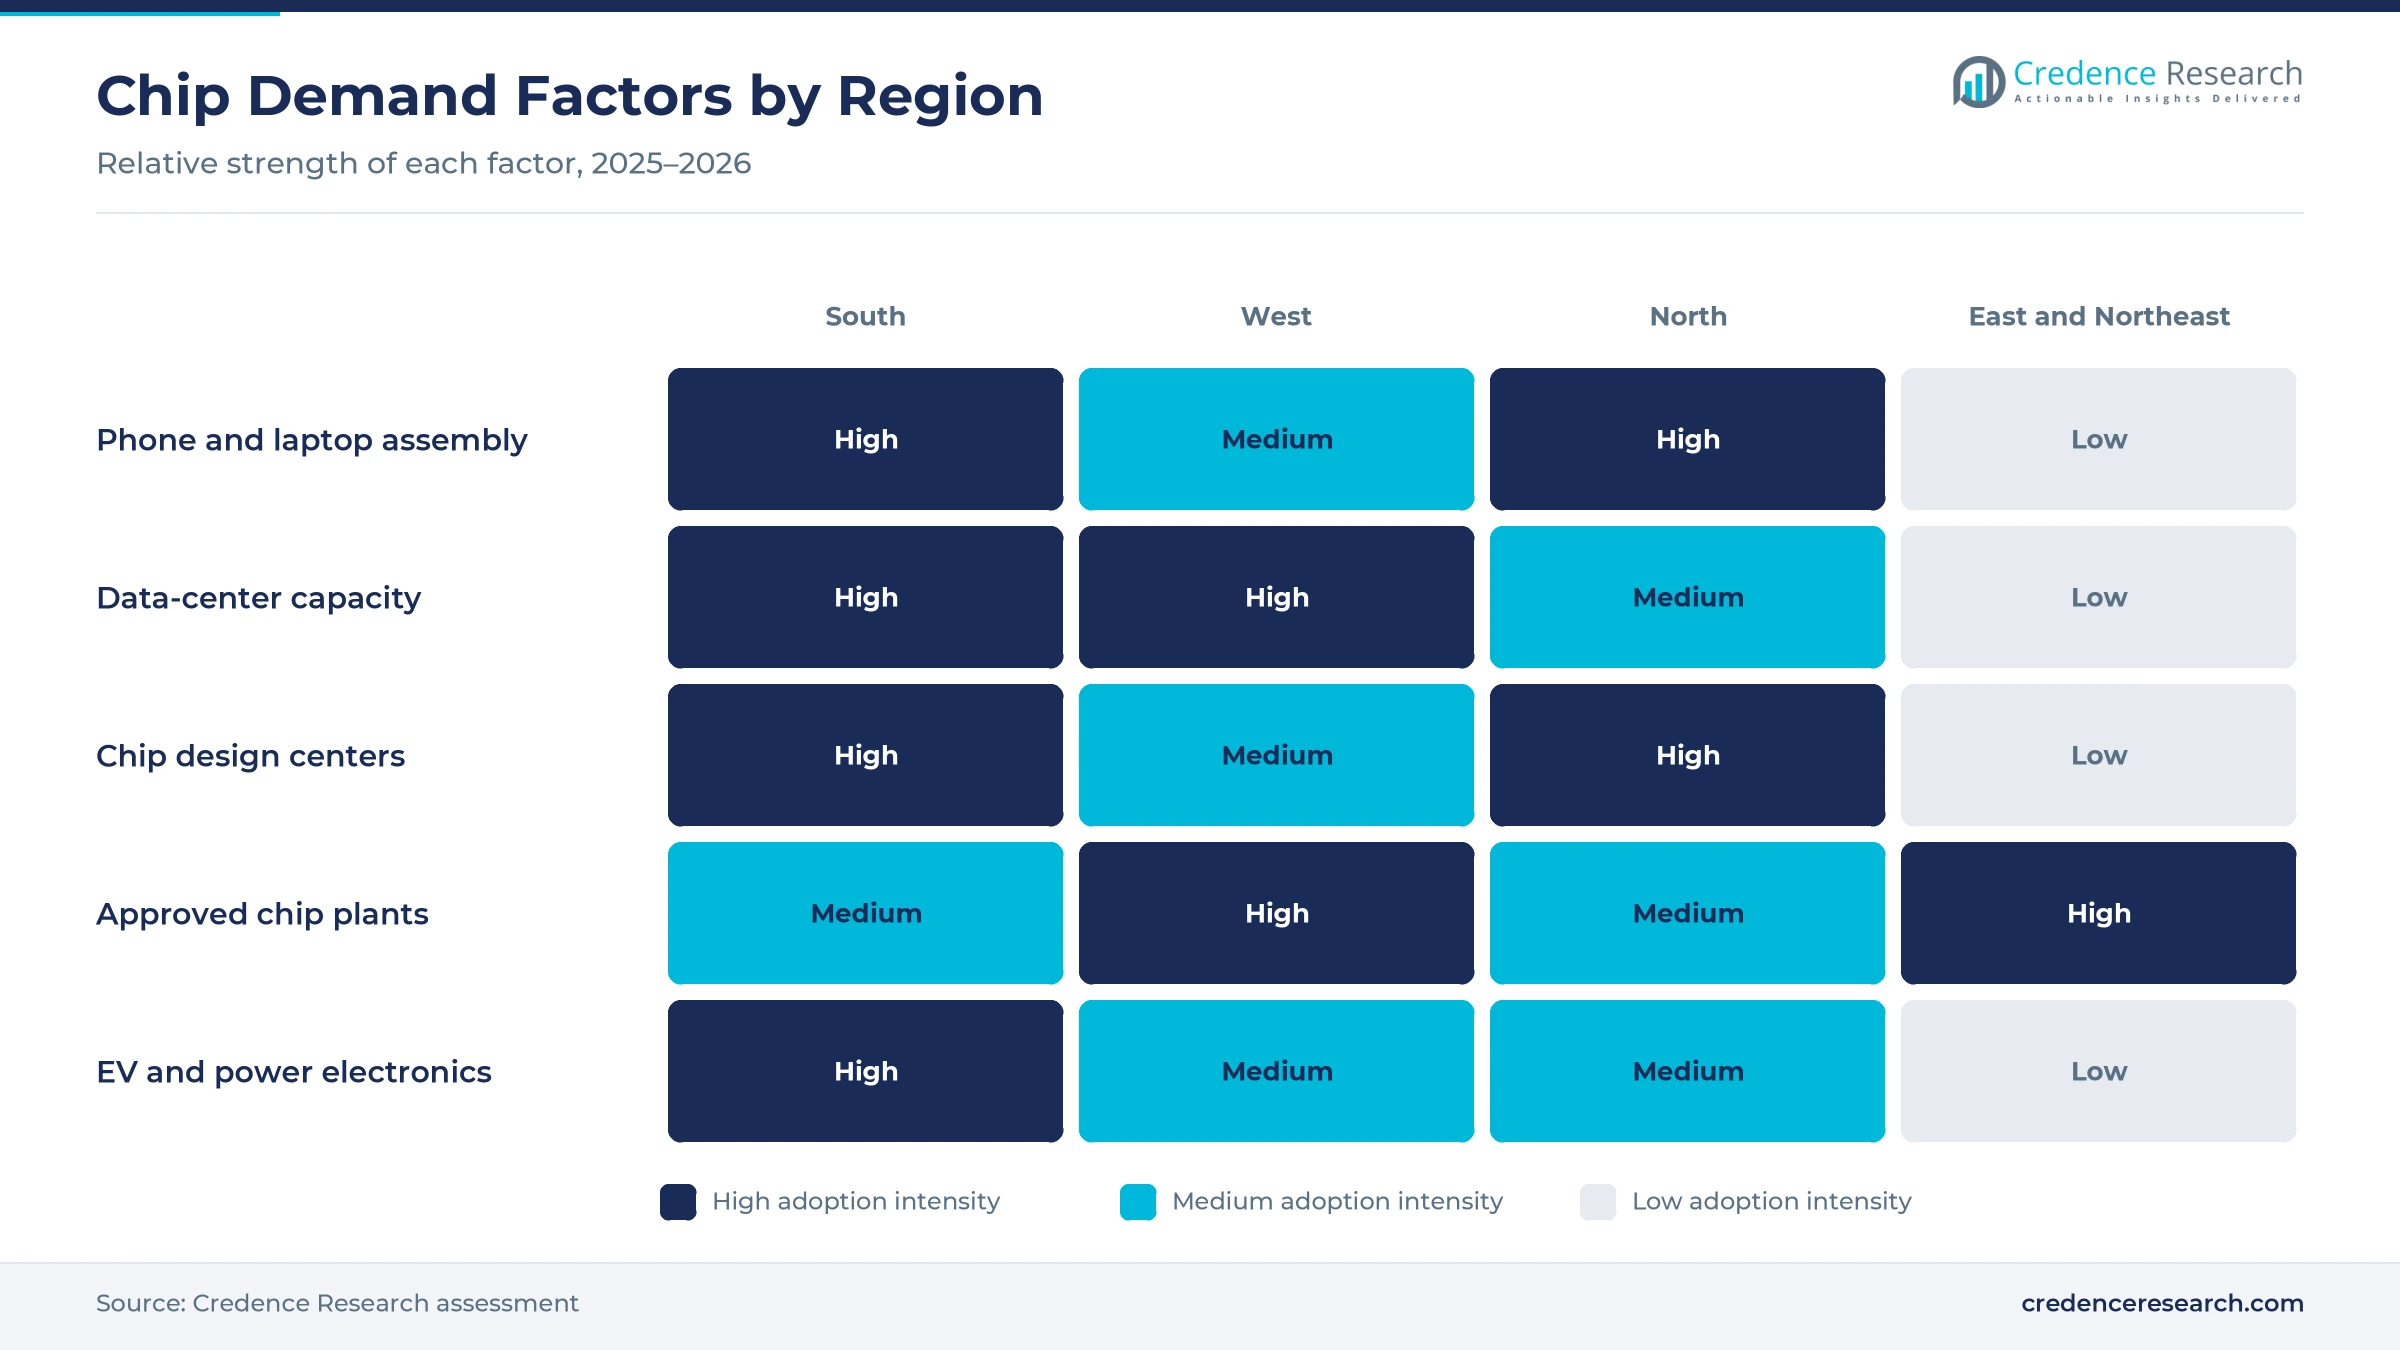
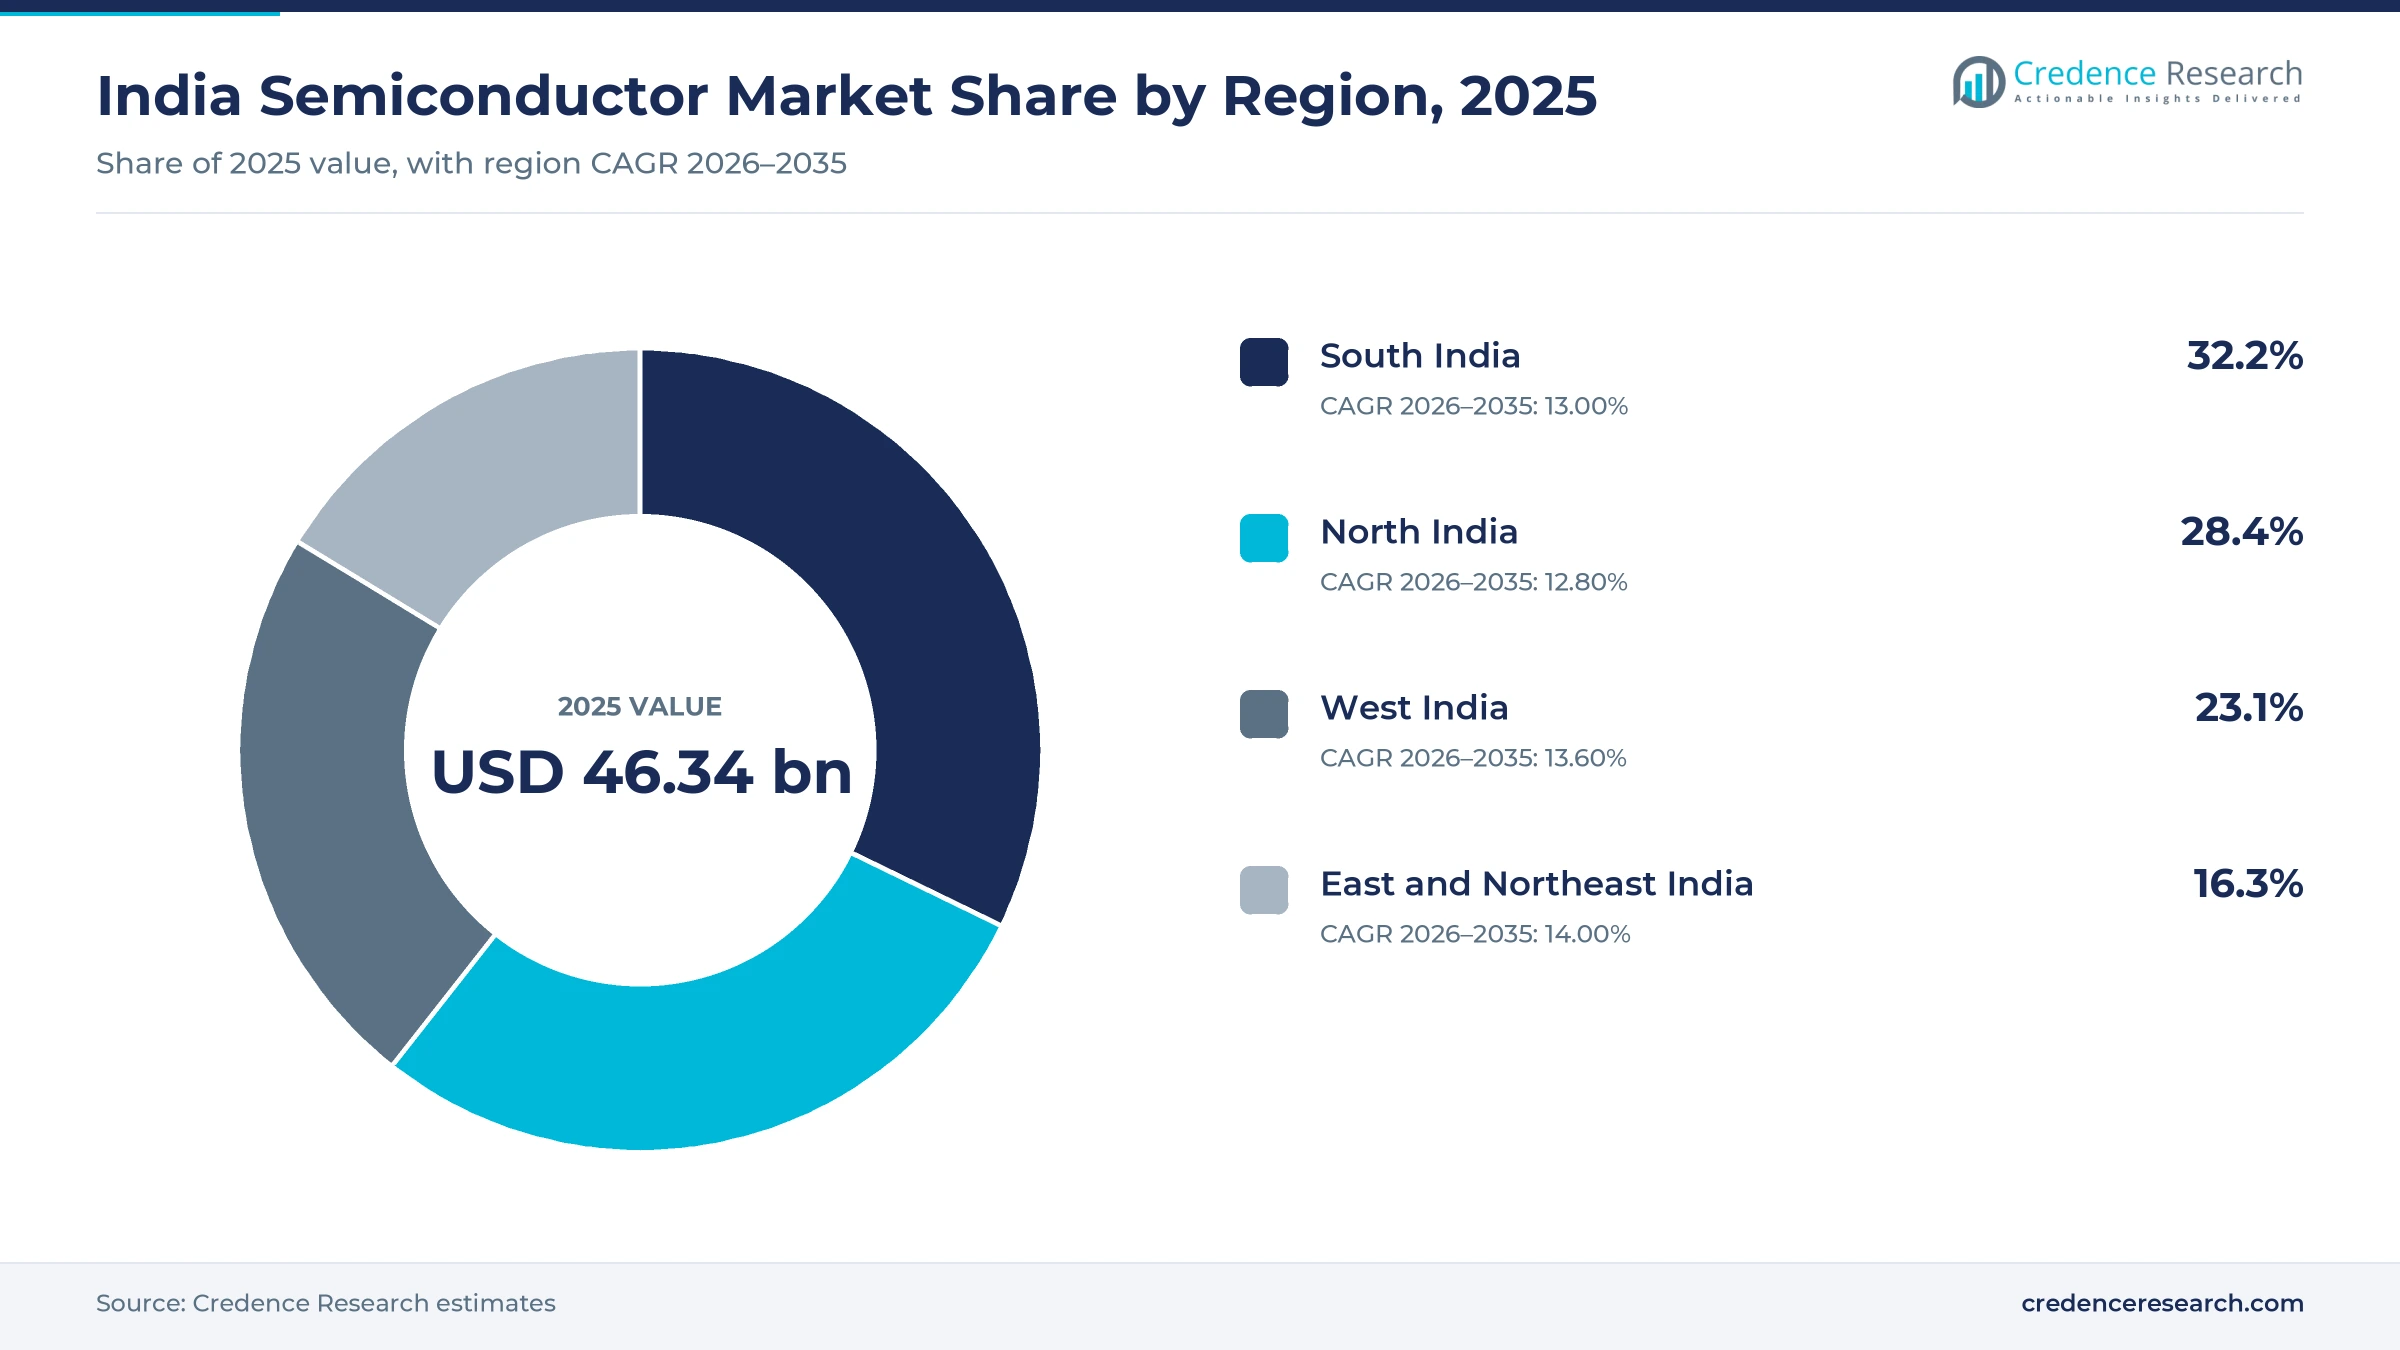
The India semiconductor market was valued at USD 46.34 billion in 2025 and is projected to increase from USD 52.61 billion in 2026 to USD 161.21 billion by 2035, registering a CAGR of 13.25% during 2026–2035. Demand comes from smartphone and laptop assemblers, data-center operators, telecom network builders, vehicle makers, industrial equipment producers and defense buyers that purchase processors, memory, analog and power chips. South India held the largest regional share, 32.2% in 2025, because phone assembly and chip design teams cluster around Chennai, Bengaluru and Hyderabad. East and Northeast India is the fastest-growing region at 14.00% a year, as assembly and test plants take shape in Assam and compound chip projects in Odisha. In turn, the start of commercial memory assembly in Gujarat in February 2026 marks the shift from pure import demand toward partial local supply.
Which chips and buyers does the estimate count?
The estimate measures spending in India on logic and processors, memory, analog integrated circuits and discrete and power devices bought by manufacturers, network operators and government users. It counts both imported chips and devices assembled or tested in the country, valued at the point of first sale to a buyer. Values are stated in USD million at current prices and exclude goods and services tax.
The estimate excludes wafer fab equipment, process chemicals, printed circuit boards, finished electronic products and design services sold as engineering work. The value chain runs from global foundries and memory makers through assembly and test sites, distributors and contract manufacturers to device brands and data-center buyers across the country.
India Semiconductor Market Insights
- The India semiconductor market was valued at USD 46.34 billion in 2025 and is projected to reach USD 161.21 billion by 2035, at a 13.25% CAGR during 2026–2035.
- South India held a 32.2% share of 2025 value, as phone assembly plants and chip design centers cluster in Tamil Nadu, Karnataka and Telangana.
- Logic and processors led device types with a 34.0% share of 2025 value, because phones, laptops and servers need application processors.
- Micron began commercial production at its Sanand assembly and test plant in February 2026, the first large memory back-end site in India.
- Data centres and telecommunications grow fastest among end uses at 14.07% a year during 2026–2035, as AI compute capacity expands.
Logic leads while power devices gain fastest
Why do logic chips and processors take the largest share?
Based on device type, the market is categorized into logic and processors, memory, analog integrated circuits and discrete and power devices. Logic and Processors led with a 34.0% share of 2025 value, because every phone, laptop and server needs a high-value application processor or accelerator. Discrete and Power Devices grow fastest at 13.68% a year, as electric vehicles, solar inverters and chargers use more power switches.
Why does consumer electronics still absorb the most chips?
Based on end-use industry, the market is categorized into consumer electronics, automotive, data centres and telecommunications, and industrial and defence. Consumer Electronics led with a 42.0% share of 2025 value, because smartphone assembly for local and export buyers is the largest chip user. Data Centres and Telecommunications grows fastest at 14.07% a year, as GPU clusters and AI data centers expand.
Which applications move fastest from compute to power?
Based on application, the market is categorized into computing and artificial intelligence, connectivity and communications, power conversion and control, and sensing and embedded control. Computing and Artificial Intelligence led with a 36.0% share of 2025 value, because processors and memory carry the highest unit prices. Power Conversion and Control grows fastest at 13.94% a year, as electric two-wheelers and renewable systems scale.
Do contracts or contract manufacturers buy most chips?
Based on sales channel, the market is categorized into direct OEM contracts, authorized distributors, electronics manufacturing services procurement, and digital and catalog distribution. Direct OEM Contracts led with a 40.0% share of 2025 value, because large brands negotiate chip supply directly with suppliers. Electronics Manufacturing Services Procurement grows fastest at 13.83% a year, as contract assemblers buy chips for brand owners.
| Segment Group | Leading Sub-segment | Share, 2025 | Fastest-growing Sub-segment | CAGR, 2026–2035 |
|---|---|---|---|---|
| By Device Type | Logic and Processors | 34.0% | Discrete and Power Devices | 13.68% |
| By End-Use Industry | Consumer Electronics | 42.0% | Data Centres and Telecommunications | 14.07% |
| By Application | Computing and Artificial Intelligence | 36.0% | Power Conversion and Control | 13.94% |
| By Sales Channel | Direct OEM Contracts | 40.0% | Electronics Manufacturing Services Procurement | 13.83% |
Request a Free Sample
Fill in your details and we'll send you a free sample report.
- Sample data tables & charts
- Research methodology
AI compute, phone exports and EV electronics drive chip use
How does AI and data-center demand lift chip spending?
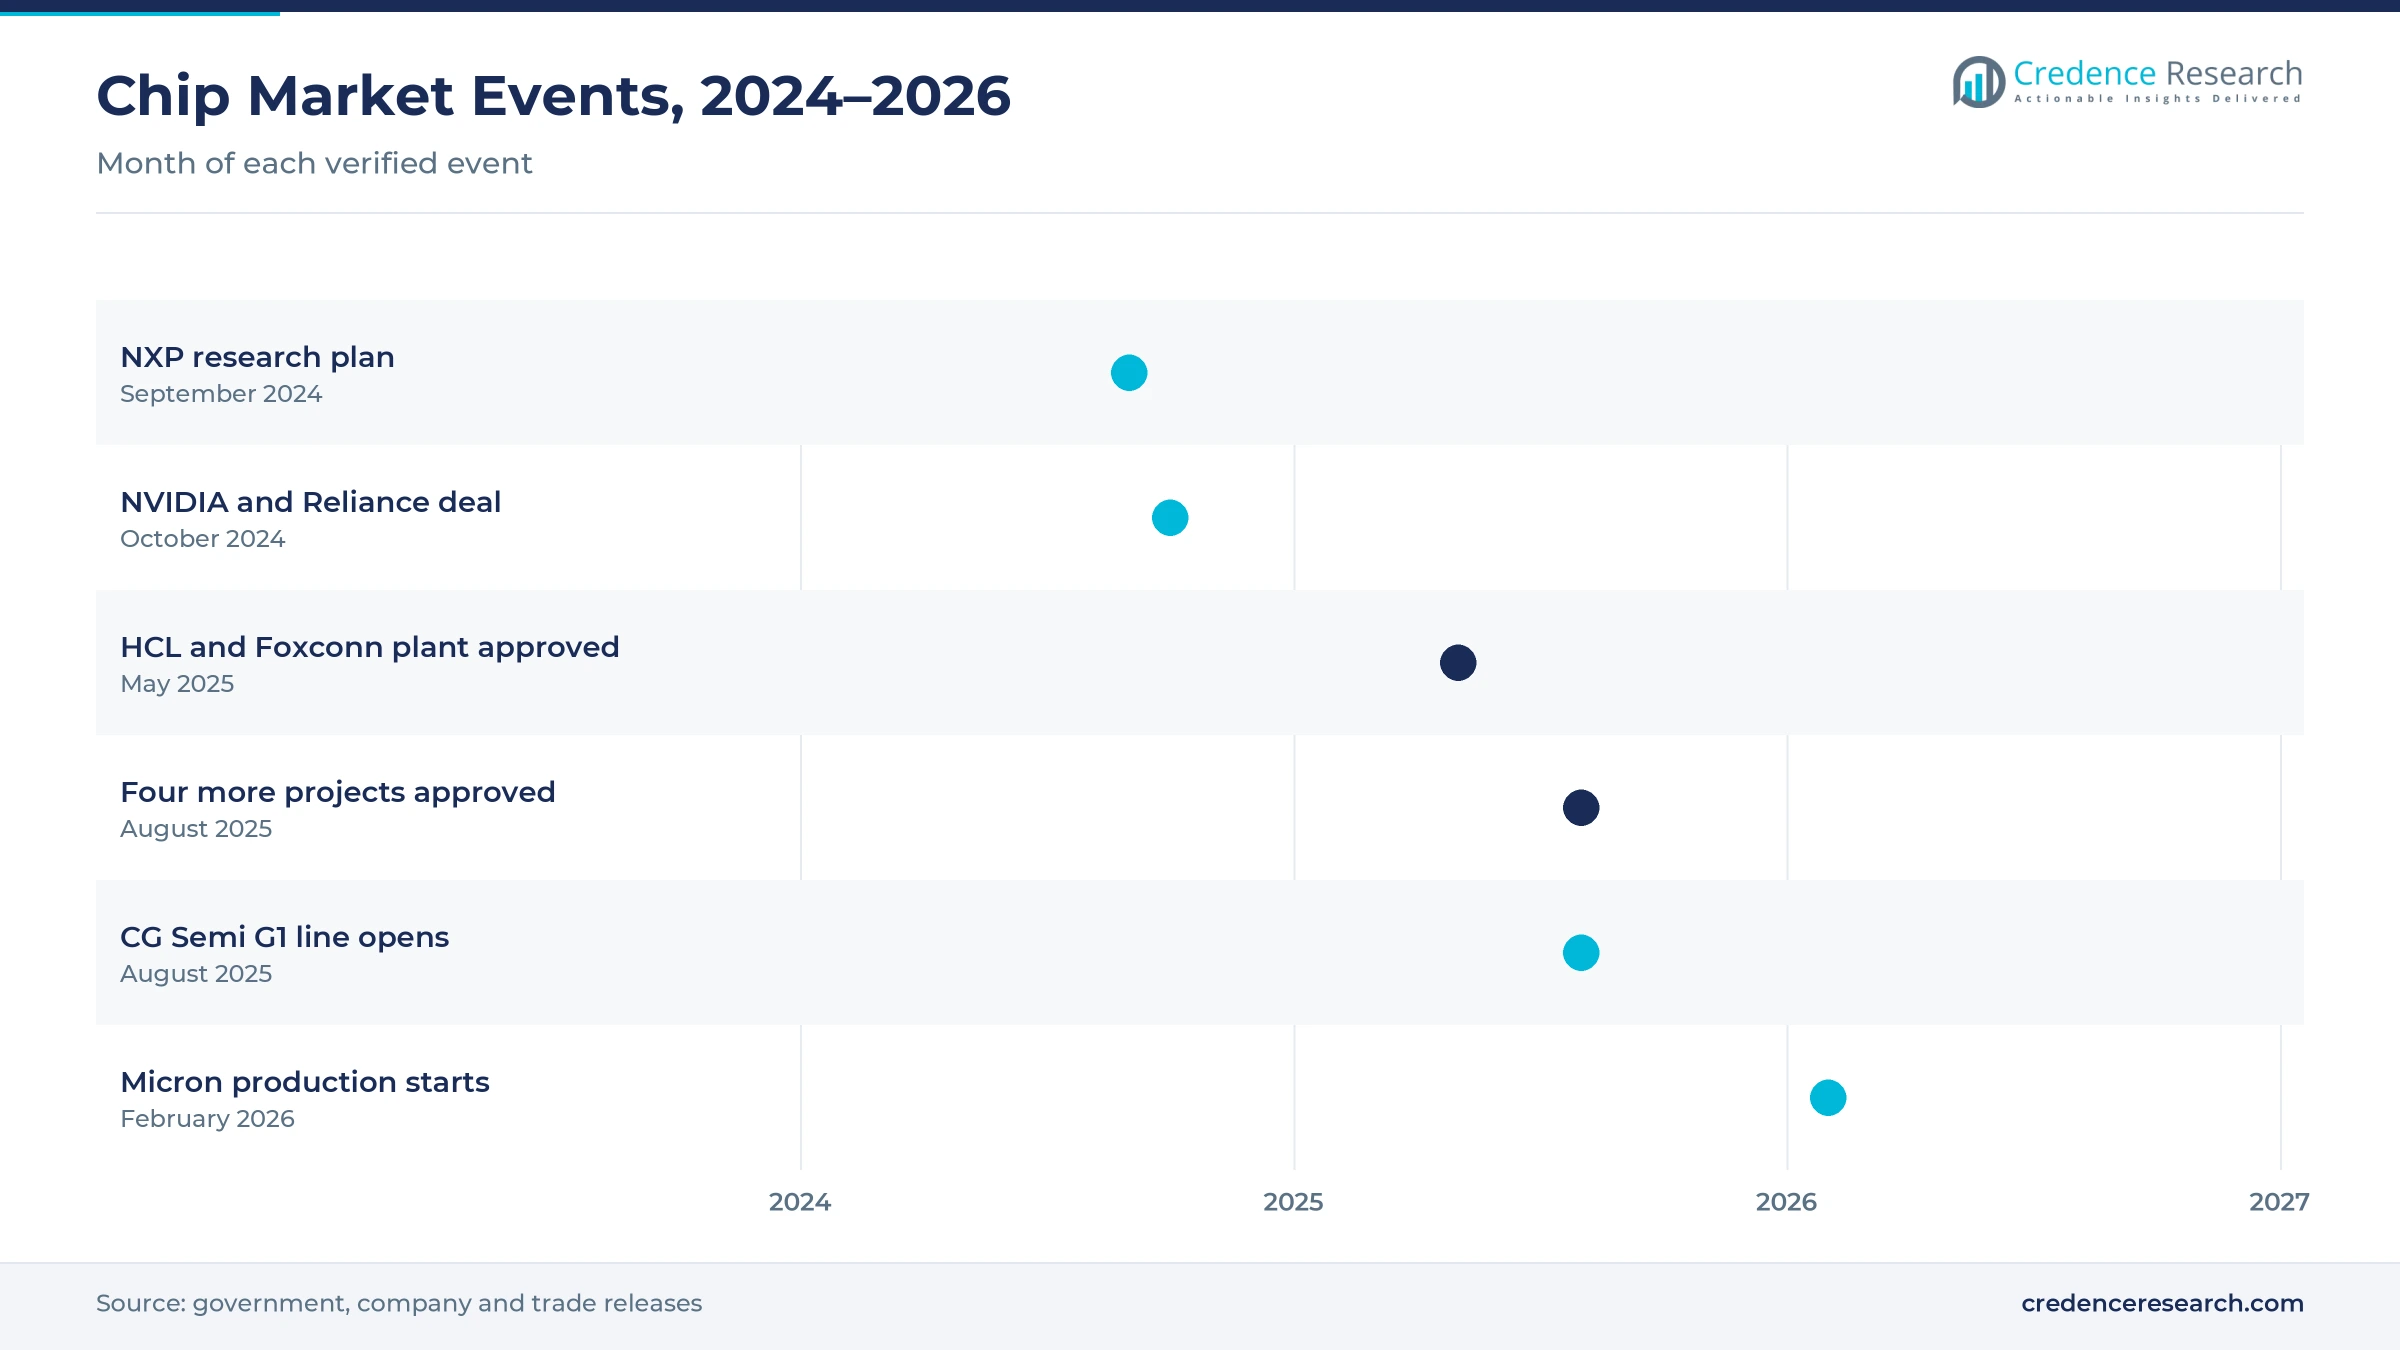
AI and data-center demand lifts chip spending, because accelerators, server processors and high-bandwidth memory carry far higher unit values than consumer chips. The national AI program has onboarded more than 38,000 GPUs with an outlay of Rs 10,372 crore, according to a government release. In October 2024, NVIDIA agreed to supply Blackwell processors for a planned one-gigawatt Reliance data center in Gujarat. In April 2026, Google moved to lay the foundation of a USD 15 billion, one-gigawatt AI hub in Visakhapatnam. As a result, growing data-center capacity makes data centres and telecommunications the fastest-growing end use at 14.07% a year, while computing and artificial intelligence keeps the largest application share at 36.0%.
Why do electronics manufacturing and 5G phones support demand?
Electronics manufacturing and 5G premiumization support demand, because each locally assembled phone, laptop and network unit needs processors, memory and radio chips. Electronics production reached Rs 11.3 lakh crore in 2024-25, while mobile phone production reached Rs 5.45 lakh crore and phone exports Rs 2 lakh crore. Electronics exports then crossed Rs 4 lakh crore in 2025, with iPhone exports at Rs 2.03 lakh crore. High-technology exports rose to USD 54.1 billion in 2024 from USD 40.9 billion in 2023, according to the World Bank. Consequently, consumer electronics keeps a 42.0% share of 2025 value, and contract assemblers that build phones for global brands buy a rising share of these chips.
How does electric-vehicle electronics expansion add orders?
Electric-vehicle electronics expansion adds orders, because motor controllers, battery management systems and chargers need many more power and analog chips than combustion vehicles. About 1.3 million electric two-wheelers were sold in India in 2024, about 6% of the two-wheeler market, according to the IEA. Electric three-wheeler sales reached nearly 700,000 in 2024, a record 57% sales share. Vahan data show about 2.3 million electric-vehicle registrations in 2025, or 8% of all new registrations. India also became the largest electric three-wheeler market in 2023 and kept that position in 2024. As a result, discrete and power devices grow fastest among device types at 13.68% a year.
Why do approved chip plants widen local supply?
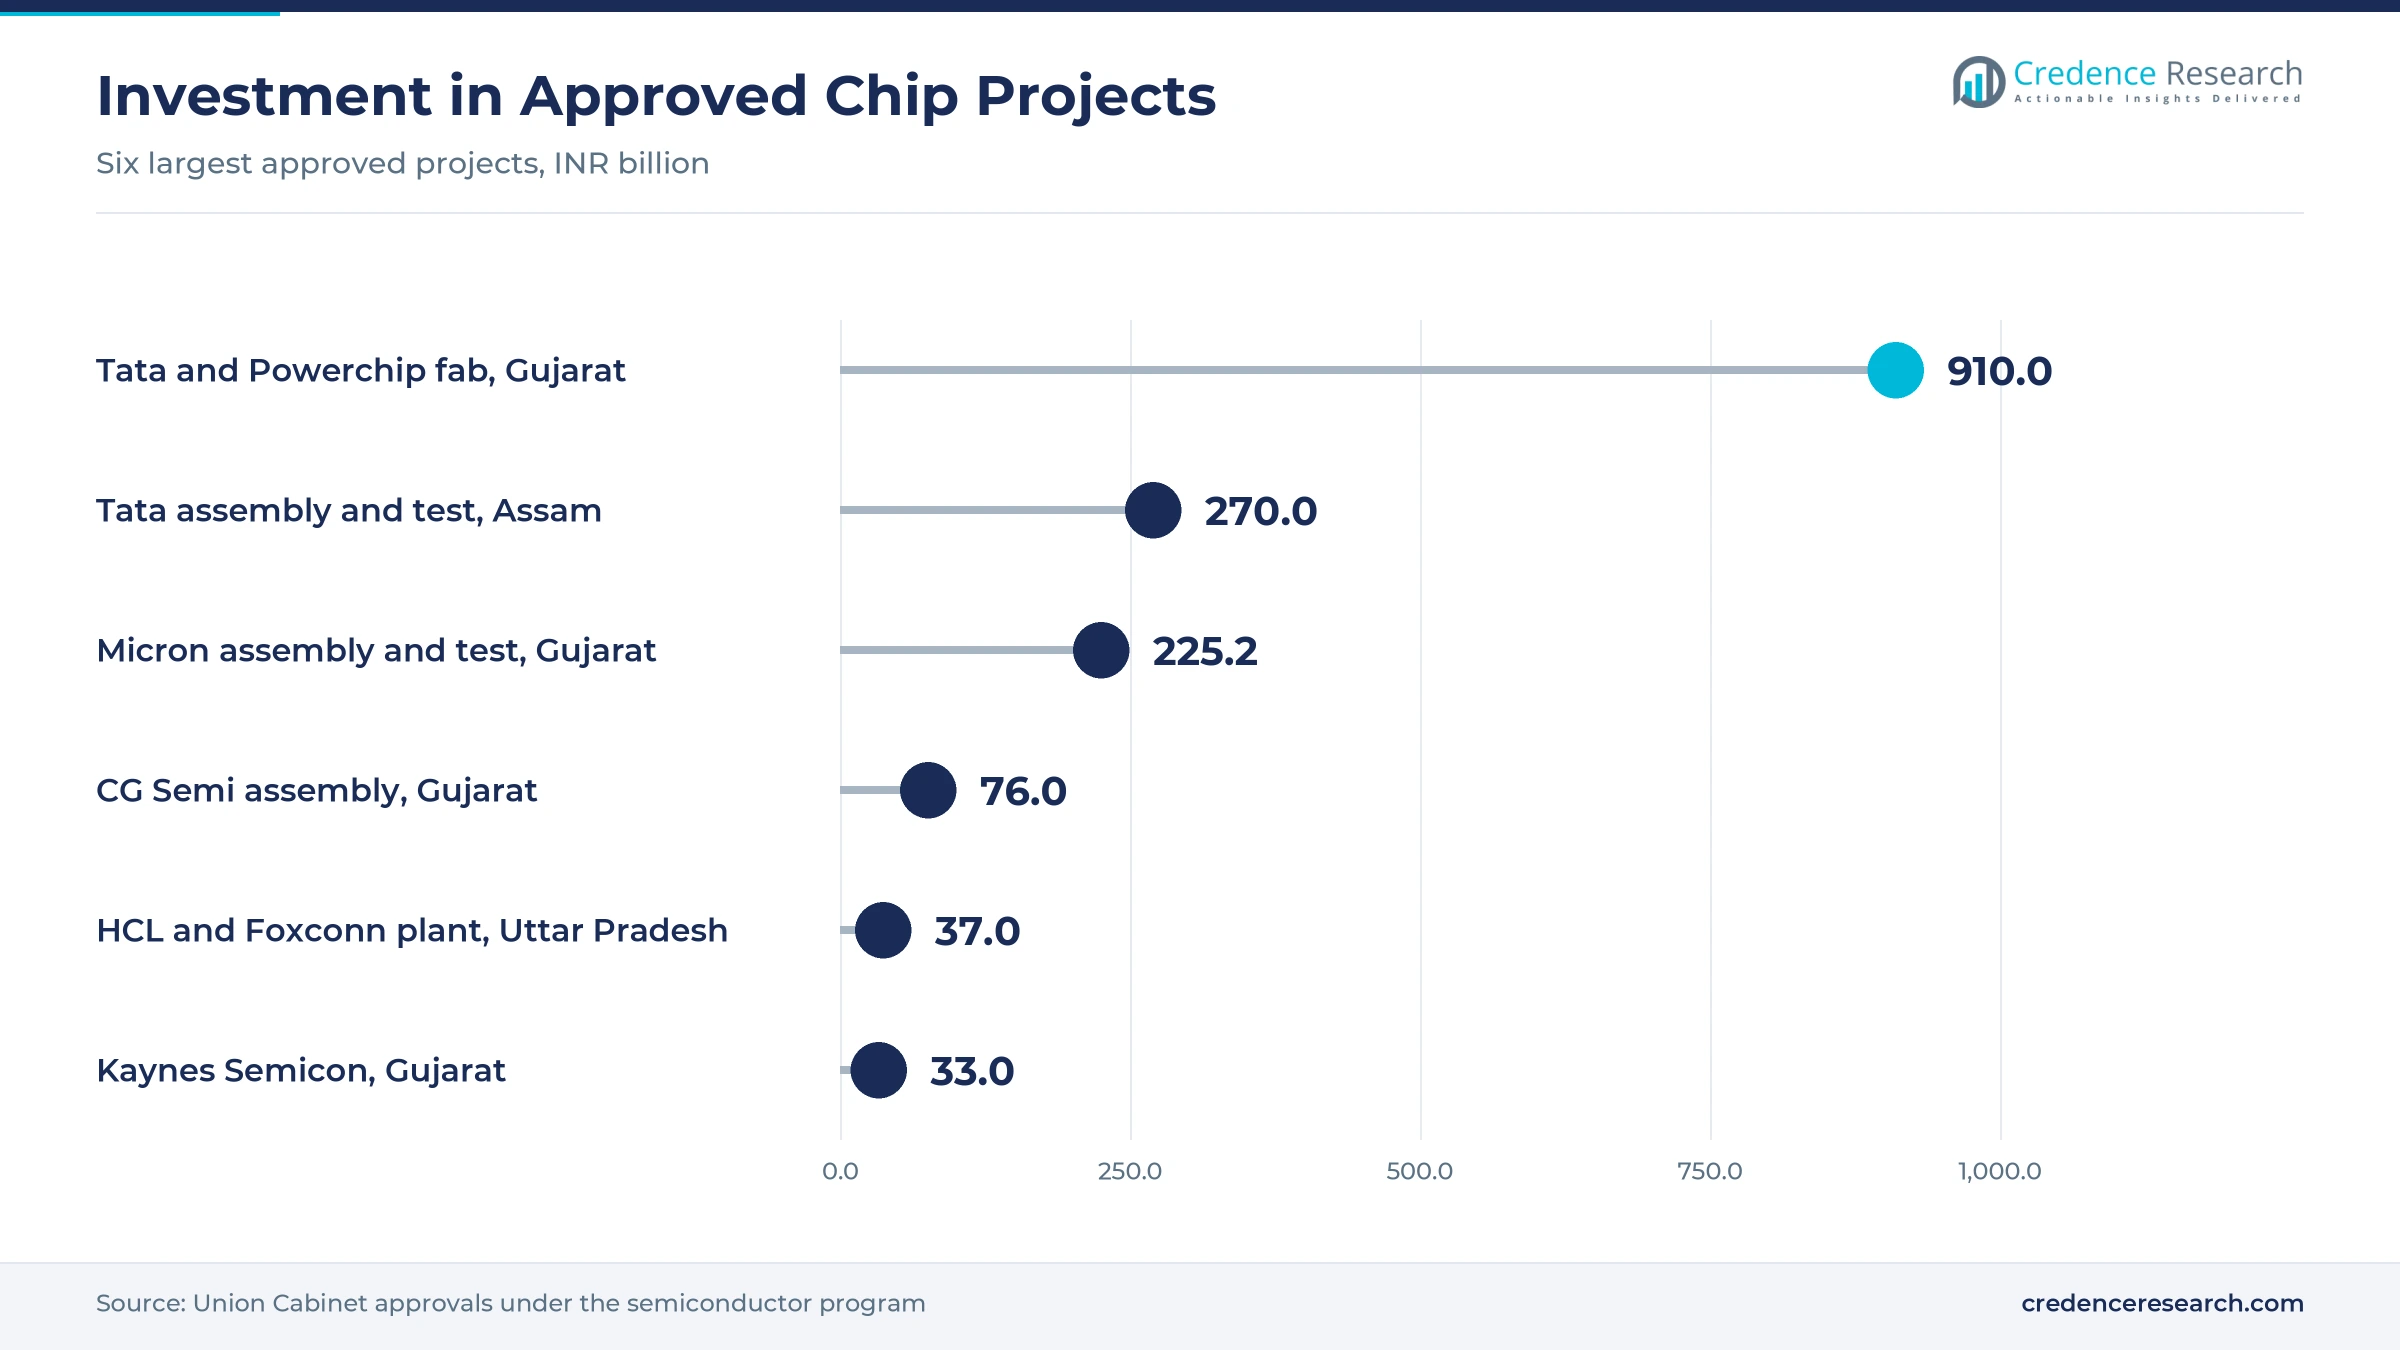
Approved chip plants widen local supply, because government support lowers the cost of building fabs and assembly sites that sell into Indian demand. Ten projects with a cumulative investment of about INR 1.60 trillion had been sanctioned by August 2025, according to a report on the approvals. The largest, a Tata Electronics fab with Powerchip at Dholera, is planned for 50,000 wafers a month. Micron started commercial production of DRAM and NAND products at Sanand on Feb. 28, 2026. In turn, direct OEM contracts keep a 40.0% share, while local sourcing lets brands shorten lead times and hold less imported stock.
Local packaging, power chips and design centers gain ground
How is the rise of local assembly and test changing supply?
The rise of local assembly and test is changing supply, because brands can now qualify chips packaged in India rather than only in East Asia. CG Semi opened its G1 pilot line at Sanand on Aug. 28, 2025, with output of 0.5 million chips a day, according to a business report. Its planned G2 plant targets about 14.5 million units a day under a Rs 7,600 crore investment with Renesas and Stars Microelectronics. Tata Semiconductor Assembly and Test is building a 48 million chips a day site in Assam. As a result, demand for outsourced assembly and test capacity rises alongside imports of finished wafers.
Why is power and compound chip production emerging?
Power and compound chip production is emerging, because EVs, renewable energy and fast chargers need silicon carbide and high-power discrete devices. In August 2025, SiCSem gained approval for a silicon carbide fab in Bhubaneswar with 60,000 wafers a year. Continental Device India gained approval in the same round to expand its Mohali plant for MOSFETs, IGBTs and Schottky diodes. In September 2025, Kaynes Semicon and Infineon began packaging power bare die wafers in India for solar, wind and industrial uses. The same round also approved a test and packaging plant in Andhra Pradesh for 96 million units a year. Consequently, power conversion and control grows fastest among applications at 13.94% a year.
Can design centers open a larger chip opportunity?
Design centers open a clear opportunity, because global chipmakers already run large engineering teams in India that can steer local sourcing. NXP said in September 2024 that it would invest more than USD 1 billion to roughly double its research and development in India. NXP already employs about 3,000 people across design centers in Noida, Bengaluru, Hyderabad and Pune. Qualcomm announced a Rs 177.27 crore design center in Chennai in January 2024 for up to 1,600 engineers working on wireless and 5G. As a result, South India keeps the largest regional share, because design work in Chennai, Bengaluru and Hyderabad feeds local chip selection for phones and cars.
Is there room for advanced packaging and glass substrates?
Advanced packaging offers room to grow, because AI processors and high-bandwidth memory depend on dense multi-chip packages that India does not yet make at scale. In August 2025, 3D Glass Solutions gained approval for an advanced packaging and embedded glass substrate site in Bhubaneswar. ASIP Technologies, with APACT of South Korea, gained approval for a 96 million units a year test and packaging plant in Andhra Pradesh. Kaynes Semicon was approved in September 2024 for 6.33 million chips a day at Sanand. Consequently, eastern and southern states gain packaging capacity, while chip buyers such as phone and server makers can qualify more locally finished parts.
Import reliance, talent gaps and capital needs slow growth
Why does reliance on imported wafers limit margins?
Reliance on imported wafers limits margins, because India has no commercial front-end fab in volume production yet and buys most chips from East Asian suppliers. As a result, buyers face currency swings, freight costs and allocation risk when global supply tightens. Local assembly reduces some exposure, although wafers still arrive from overseas. Suppliers respond with local buffer stock, long-term contracts and second sources in other countries.
How do talent gaps slow plant ramp-up?
Talent gaps slow plant ramp-up, because fabs and assembly sites need process engineers, equipment technicians and quality staff with years of training. In turn, new plants compete with design centers and with each other for experienced people. Delays in hiring can push back customer qualification and volume output. Companies respond with partnerships with universities, overseas training and transfer of staff from partner plants in Asia.
Why do high capital needs raise project risk?
High capital needs raise project risk, because a single wafer fab can cost tens of thousands of crore rupees before it earns revenue. The Tata and Powerchip fab at Dholera is the largest approved project at about INR 910 billion. Consequently, delays in subsidy release, land, water or power can stretch timelines. Developers respond with phased construction, government co-funding and partners that bring proven process technology.
Can buyers manage long qualification cycles?
Long qualification cycles limit early uptake, because automotive, telecom and defense buyers test chips for months before approving a new source. As a result, locally packaged chips may take one to two years to win volume orders. CG Semi said its G1 pilot output would first be used for customer qualification. Suppliers respond with joint testing, shared reliability data and early engagement with large brand owners.
South leads while East and Northeast gains fastest
| Region | Value, 2025 (USD billion) | Share, 2025 | CAGR, 2026–2035 |
|---|---|---|---|
| South India | 14.92 | 32.2% | 13.00% |
| North India | 13.16 | 28.4% | 12.80% |
| West India | 10.71 | 23.1% | 13.60% |
| East and Northeast India | 7.55 | 16.3% | 14.00% |
Phone assembly and design teams keep South India ahead
South India held a 32.2% share of 2025 value and grows at 13.00% a year. Qualcomm chose Chennai for a new design center for up to 1,600 engineers, while NXP runs design teams in Bengaluru and Hyderabad. Google is building a one-gigawatt AI hub in Visakhapatnam, and ASIP Technologies gained approval for a test and packaging plant in Andhra Pradesh. As a result, the region combines the largest phone assembly base with growing AI compute demand.
Why does North India hold a large share?
North India held a 28.4% share of 2025 value and grows at 12.80% a year. Uttar Pradesh hosts large phone assembly clusters around Noida, and NXP runs a design center in Noida. The HCL and Foxconn joint venture gained approval in May 2025 for a 20,000 wafers a month plant at Jewar. Continental Device India is expanding its Mohali plant in Punjab. Consequently, the region keeps strong demand from consumer electronics assembly and power devices.
Gujarat chip plants lift West India
West India held a 23.1% share of 2025 value and grows at 13.60% a year. Gujarat hosts the Micron memory plant, the CG Semi and Kaynes assembly lines at Sanand, and the Tata and Powerchip fab at Dholera. NVIDIA also agreed to supply processors for the planned Reliance data center in Gujarat. In turn, Maharashtra adds demand from data centers around Mumbai and Pune, where NXP runs a design center.
Assam and Odisha projects lift East and Northeast India
East and Northeast India held a 16.3% share of 2025 value and grows fastest at 14.00% a year. Tata Semiconductor Assembly and Test is building a 48 million chips a day site at Morigaon in Assam. SiCSem and 3D Glass Solutions gained approvals in August 2025 for plants in Bhubaneswar. As a result, the region shifts from a small user of imported chips toward a new base for packaging and compound chips.
Plant approvals, openings and AI deals, 2024–2026
| Development | Status and market relevance |
|---|---|
| In September 2024, NXP Semiconductors said it would invest more than USD 1 billion to double its research and development in India. | Deepens local design work |
| In October 2024, NVIDIA agreed to supply Blackwell processors for a planned one-gigawatt Reliance data center in Gujarat. | Lifts AI accelerator demand |
| In August 2025, the Union Cabinet approved four more chip projects in Odisha, Punjab and Andhra Pradesh, taking the total to ten. | Adds compound and packaging capacity |
| In September 2025, Kaynes Semicon and Infineon began packaging MEMS microphones and power bare die wafers in India. | Widens local power chip supply |
| In February 2026, Micron began commercial production of DRAM and NAND products at its Sanand assembly and test plant. | Starts local memory supply |
Advanced and mature nodes, packaging and compound chips
- Advanced logic nodes serve phone processors, AI accelerators and server chips, and they are still made entirely overseas for Indian buyers.
- Mature logic nodes serve microcontrollers, display drivers and power management chips, which the Dholera fab plans to target with 50,000 wafers a month.
- Advanced packaging joins dies into dense modules for AI and memory, and approved sites in Gujarat, Assam and Odisha aim to add this step locally.
- Compound semiconductors use silicon carbide and gallium nitride for EV inverters and fast chargers, led by the SiCSem fab approved for Bhubaneswar.
Need a Custom Version of This Report?
Tailor the scope, geography, or segments to your exact requirements.
- Custom geography or segment scope
- Direct access to our analyst team
Global chipmakers compete on design depth and local supply
Competition combines global chipmakers that sell into Indian assembly with companies building local design, assembly and test capacity. Micron began commercial production at Sanand in February 2026, making it the largest foreign chip company with a local back-end plant. Qualcomm and MediaTek supply phone processors to Indian assemblers and run design teams in India, while NXP plans more than USD 1 billion of research spending. Infineon works with Kaynes Semicon to package power and MEMS devices locally. NVIDIA supplies accelerators to Reliance and other large data-center builders in India. Samsung, Texas Instruments, STMicroelectronics and Intel also sell into India, although their recent local activity was not verified for this report. Companies compete on design support, product range, supply security and price.
Companies profiled and their roles in this market
| Company | Type | Role in the market |
|---|---|---|
| Micron Technology, Inc. | Memory maker | Sanand assembly and test plant in production since Feb. 2026 |
| Qualcomm Incorporated | Fabless chip designer | Phone processors; Chennai design center announced Jan. 2024 |
| NXP Semiconductors N.V. | Chipmaker | More than USD 1 billion research plan announced Sept. 2024 |
| Infineon Technologies AG | Chipmaker | Local power and MEMS packaging with Kaynes since Sept. 2025 |
| NVIDIA Corporation | AI accelerator designer | Blackwell supply for Reliance data center in Gujarat |
| MediaTek Inc. | Fabless chip designer | Phone processors; design teams in Noida and Bengaluru |
Credence Research sees AI and power chips setting pace
Credence Research's view is that the India semiconductor market will grow strongly through 2035, as AI compute, phone assembly and electric vehicles raise the chip content of locally made products. Logic and processors should keep the largest device share, while discrete and power devices gain most. South India will remain the largest region, although East and Northeast India adds demand fastest from a small base. However, import reliance, talent gaps and long qualification cycles will reward suppliers with local stock, design support and assembly partners in India.
Device demand by end use anchors the model
The report uses 2025 as the base year, with values in USD million at current prices. Market values come from the Credence Research model, which combines device output, chip content per device, data-center capacity and price tiers. The four regional zones and their 2025 shares follow the client brief, while regional growth and segment splits by device type, end-use industry, application and sales channel are Credence Research estimates. Sources used are official statistics, government releases, international agency data, company announcements and news reports, and no interviews or surveys were used to size the India semiconductor market.
Local assembly, AI compute and EVs shape demand to 2035
The market is expected to reach USD 161.21 billion by 2035, a 13.25% CAGR during 2026–2035, as AI compute, electronics exports and electric vehicles keep chip demand rising. Spending is projected to rise from USD 52.61 billion in 2026 as new assembly plants ramp up. Growth should be strongest in power devices, data center buyers and East and Northeast India, while South India keeps the largest share. In contrast, import reliance, high capital costs and slow customer qualification could delay local supply in some years.
Frequently Asked Questions
How big is the India semiconductor market?
Which region leads demand?
Which region grows fastest?
Which device type holds the largest share?
Which end use grows fastest?
How do new chip plants affect the market?
Who are the leading companies in this market?
What are the main risks to growth?
Table of Content
Chapter 1 Market Segmentation
- 1.1 Segmentation Framework
- 1.1.1 Product and Service Classification
- 1.1.2 Application and End-Use Classification
- 1.1.3 Technology and Solution Classification
- 1.1.4 Customer and Distribution Channel Classification
- 1.1.5 Geographic Segmentation
- 1.1.6 Market Segment Definitions and Boundaries
- 1.2 By Device Type
- 1.2.1 Logic and Processors
- 1.2.2 Memory
- 1.2.3 Analog Integrated Circuits
- 1.2.4 Discrete and Power Devices
- 1.3 By End-Use Industry
- 1.3.1 Consumer Electronics
- 1.3.2 Automotive
- 1.3.3 Data Centres and Telecommunications
- 1.3.4 Industrial and Defence
- 1.4 By Application
- 1.4.1 Computing and Artificial Intelligence
- 1.4.2 Connectivity and Communications
- 1.4.3 Power Conversion and Control
- 1.4.4 Sensing and Embedded Control
- 1.5 By Sales Channel
- 1.5.1 Direct OEM Contracts
- 1.5.2 Authorized Distributors
- 1.5.3 Electronics Manufacturing Services Procurement
- 1.5.4 Digital and Catalog Distribution
Chapter 2 Introduction
- 2.1 Report Objectives and Scope
- 2.2 Product Definition and Industry Terminology
- 2.3 Market Inclusions and Exclusions
- 2.4 Research Process
- 2.4.1 Primary Research and Expert Interviews
- 2.4.2 Secondary Research and Source Review
- 2.4.3 Top-Down and Bottom-Up Estimation
- 2.4.4 Data Triangulation and Verification
- 2.5 Market Size Measurement Basis
- 2.5.1 2025: USD 46.34 billion → 2035: USD 161.21 billion
- 2.6 Historical and Forecast Reference Periods
- 2.6.1 Historical Period: 2018-2025
- 2.6.2 Base Year: 2025
- 2.6.3 Forecast Period: 2025-2035
- 2.7 Research Assumptions and Limitations
Chapter 3 Executive Summary
- 3.1 Market Snapshot and Key Findings
- 3.2 Base-Year Market Size, 2025
- 3.3 Forecast Market Size, 2035
- 3.4 Revenue and Volume Growth Outlook
- 3.5 Key Demand and Supply Indicators
- 3.6 Leading Market Segments
- 3.7 Fastest-Growing Market Opportunities
- 3.8 Regional Performance Highlights
- 3.9 Technology and Industry Transformation
- 3.10 Competitive Landscape Summary
- 3.11 Analyst View and Strategic Implications
Chapter 4 India Semiconductor Market Trends and Developments
- 4.1 Historical Industry Development, 2018-2025
- 4.2 Recent Market Trends and Developments
- 4.3 Demand and Customer Behavior Trends
- 4.4 Technology and Product Innovation
- 4.5 Artificial Intelligence, Automation and Digitalization
- 4.6 Local Manufacturing and Supply Chain Realignment
- 4.7 Industry Partnerships, Mergers and Acquisitions
- 4.8 Sustainability and Circular Economy Developments
- 4.9 Government and Private Sector Investment Trends
- 4.10 Emerging Business Models and Commercialization
- 4.11 Industry Developments and Announcements
Chapter 5 India Semiconductor Market Production, Supply and Demand Analysis
- 5.1 Demand Trend and Consumption Analysis, 2018-2025
- 5.2 Demand Forecast, 2025-2035
- 5.3 Production and Output Trend, 2018-2025
- 5.4 Production and Output Forecast, 2025-2035
- 5.5 Installed Capacity and Capacity Utilization
- 5.6 Company-Wise Production Plants and Statistics
- 5.6.1 Installed Production Capacity
- 5.6.2 Actual Production
- 5.6.3 Planned Capacity and Expansion Targets
- 5.7 Supply Chain Structure and Procurement Trends
- 5.8 Supply-Demand Gap and Bottlenecks
- 5.9 Import Dependence and Sourcing Structure
- 5.10 Contract Manufacturing and Outsourcing
- 5.11 Regional Supply and Demand Concentration
Chapter 6 India Semiconductor Market Pricing Analysis
- 6.1 Pricing Structure and Measurement
- 6.2 Historical Pricing Trends, 2018-2025
- 6.3 Pricing Outlook, 2025-2035
- 6.4 Average Selling Price and Unit Economics
- 6.5 Pricing by Product and Market Segment
- 6.6 Geographic Pricing Differences
- 6.7 Key Input, Energy, Labor and Logistics Costs
- 6.8 Contract Pricing and Purchasing Models
- 6.9 Pricing Sensitivity and Competitive Positioning
- 6.10 Price, Margin and Profitability Implications
Chapter 7 India Semiconductor Market Dynamics
- 7.1 Market Growth Drivers
- 7.1.1 Demand-Side Drivers
- 7.1.2 Technology and Innovation Drivers
- 7.1.3 Infrastructure and Investment Drivers
- 7.1.4 Regulatory and Policy Drivers
- 7.2 Market Restraints
- 7.2.1 Cost and Affordability Constraints
- 7.2.2 Technology and Adoption Barriers
- 7.2.3 Supply Chain and Operational Constraints
- 7.3 Market Challenges
- 7.3.1 Competitive Pressure and Margin Erosion
- 7.3.2 Skills, Infrastructure and Implementation Gaps
- 7.4 Emerging Market Opportunities
- 7.5 Market Dynamics Impact and Time-Horizon Assessment
Chapter 8 India Semiconductor Value Chain Analysis
- 8.1 Industry Value Chain Overview
- 8.2 Upstream Suppliers and Critical Inputs
- 8.3 Technology and Component Providers
- 8.4 Manufacturing or Service Delivery
- 8.5 Distribution, Channel Partners and Integrators
- 8.6 Downstream Applications and End Users
- 8.7 Value Addition and Profit Pools
- 8.8 Vertical Integration and Outsourcing
- 8.9 Supplier Concentration and Risk
- 8.10 Supply Chain Localization and Resilience
Chapter 9 India Semiconductor Market Regulations and Policies
- 9.1 Relevant Laws, Standards and Compliance Frameworks
- 9.2 Product, Service, Safety and Quality Requirements
- 9.3 Government Policies, Incentives and Subsidies
- 9.4 Imports, Exports and Trade Barriers
- 9.5 Public Procurement and Local Content Requirements
- 9.6 Environmental and Sustainability Compliance
- 9.7 Upcoming Policy Changes and Market Implications
Chapter 10 India Semiconductor Market Hotspots and Opportunities
- 10.1 Market Opportunity Mapping and Growth Hotspots
- 10.2 High-Growth Applications and Customer Groups
- 10.3 Underserved Markets and White-Space Opportunities
- 10.4 Emerging Technology and Product Opportunities
- 10.5 New Capacity and Investment Hotspots
- 10.6 Market Entry and Expansion Opportunities
- 10.7 Distribution and Partnership Opportunities
- 10.8 Near-Term and Long-Term Commercial Potential
- 10.9 Opportunity Attractiveness and Execution Risks
Chapter 11 India Semiconductor Market Outlook, 2025-2035
- 11.1 Market Size and Analysis
- 11.1.1 Revenue (Market Measurement: 2025: USD 46.34 billion → 2035: USD 161.21 billion)
- 11.1.2 Market Volume and Quantity Sold
- 11.1.3 Historical Market Size, 2018-2025
- 11.1.4 Base-Year Market Size, 2025
- 11.2 Market Forecast, 2025-2035
- 11.2.1 Revenue Forecast to 2035
- 11.2.2 Volume Forecast to 2035
- 11.2.3 CAGR and Year-on-Year Growth
- 11.2.4 Incremental Revenue Opportunity
- 11.3 Forecast Assumptions and Scenario Analysis
- 11.3.1 Base-Case Forecast
- 11.3.2 Optimistic and Conservative Scenarios
- 11.3.3 Technology, Pricing and Policy Sensitivities
- 11.4 Market Attractiveness and Growth Outlook
Chapter 12 India Semiconductor Market Segmentation and Outlook
- 12.1 Segmentation Summary and Market Shares, 2025
- 12.2 Largest and Fastest-Growing Segments
- 12.3 By Device Type - Market Size and Forecast, 2025-2035
- 12.3.1 Segment Definition and Scope
- 12.3.2 Historical Market Size, 2018-2025
- 12.3.3 Revenue Forecast, 2025-2035
- 12.3.4 Volume Forecast, 2025-2035
- 12.3.5 Base-Year Market Share, 2025
- 12.3.6 Segment CAGR and Growth Drivers
- 12.3.7 Subsegment Market Size and Forecast
- 12.3.7.1 Logic and Processors
- 12.3.7.2 Memory
- 12.3.7.3 Analog Integrated Circuits
- 12.3.7.4 Discrete and Power Devices
- 12.3.8 Subsegment Pricing and Adoption Trends
- 12.3.9 Leading Suppliers and Competition
- 12.3.10 Regional Demand and Opportunities
- 12.4 By End-Use Industry - Market Size and Forecast, 2025-2035
- 12.4.1 Segment Definition and Scope
- 12.4.2 Historical Market Size, 2018-2025
- 12.4.3 Revenue Forecast, 2025-2035
- 12.4.4 Volume Forecast, 2025-2035
- 12.4.5 Base-Year Market Share, 2025
- 12.4.6 Segment CAGR and Growth Drivers
- 12.4.7 Subsegment Market Size and Forecast
- 12.4.7.1 Consumer Electronics
- 12.4.7.2 Automotive
- 12.4.7.3 Data Centres and Telecommunications
- 12.4.7.4 Industrial and Defence
- 12.4.8 Subsegment Pricing and Adoption Trends
- 12.4.9 Leading Suppliers and Competition
- 12.4.10 Regional Demand and Opportunities
- 12.5 By Application - Market Size and Forecast, 2025-2035
- 12.5.1 Segment Definition and Scope
- 12.5.2 Historical Market Size, 2018-2025
- 12.5.3 Revenue Forecast, 2025-2035
- 12.5.4 Volume Forecast, 2025-2035
- 12.5.5 Base-Year Market Share, 2025
- 12.5.6 Segment CAGR and Growth Drivers
- 12.5.7 Subsegment Market Size and Forecast
- 12.5.7.1 Computing and Artificial Intelligence
- 12.5.7.2 Connectivity and Communications
- 12.5.7.3 Power Conversion and Control
- 12.5.7.4 Sensing and Embedded Control
- 12.5.8 Subsegment Pricing and Adoption Trends
- 12.5.9 Leading Suppliers and Competition
- 12.5.10 Regional Demand and Opportunities
- 12.6 By Sales Channel - Market Size and Forecast, 2025-2035
- 12.6.1 Segment Definition and Scope
- 12.6.2 Historical Market Size, 2018-2025
- 12.6.3 Revenue Forecast, 2025-2035
- 12.6.4 Volume Forecast, 2025-2035
- 12.6.5 Base-Year Market Share, 2025
- 12.6.6 Segment CAGR and Growth Drivers
- 12.6.7 Subsegment Market Size and Forecast
- 12.6.7.1 Direct OEM Contracts
- 12.6.7.2 Authorized Distributors
- 12.6.7.3 Electronics Manufacturing Services Procurement
- 12.6.7.4 Digital and Catalog Distribution
- 12.6.8 Subsegment Pricing and Adoption Trends
- 12.6.9 Leading Suppliers and Competition
- 12.6.10 Regional Demand and Opportunities
- 12.7 Segment Growth Comparison
- 12.8 Segment Attractiveness and Priority Matrix
Chapter 13 India Semiconductor End-Use and Application Market Outlook
- 13.1 End-Use Industry and Customer Demand Structure
- 13.2 Leading Applications and Customer Groups
- 13.3 End-Use Market Size, Share and Forecast
- 13.4 Major End-Use Industry Deep Dives
- 13.4.1 Customer Requirements and Use Cases
- 13.4.2 Demand and Replacement Cycles
- 13.4.3 Technical and Regulatory Considerations
- 13.4.4 Purchasing and Procurement Models
- 13.4.5 Leading Vendors and Distribution Channels
- 13.4.6 Forecast and Commercial Opportunities
- 13.5 Emerging Applications and Cross-Segment Demand
- 13.6 End-Use Industry Investment Priorities
Chapter 14 India Semiconductor Geographic Market Outlook, 2025-2035
- 14.1 Domestic Market Distribution and Demand Clusters
- 14.2 State- or Province-Wise Market Size and Forecast, 2025-2035
- 14.3 City and Metropolitan Market Outlook
- 14.4 Industrial, Manufacturing and Commercial Clusters
- 14.5 Geographic Concentration of Key End Users
- 14.6 Local Pricing and Purchasing Differences
- 14.7 Domestic Production Facilities and Capacity Map
- 14.8 Local Infrastructure and Project Pipeline
- 14.9 State-Level Policy and Incentive Differences
- 14.10 Subnational Investment Hotspots and Opportunities
- 14.11 Distribution and Logistics Networks
- 14.12 Domestic Competitive Footprint
Chapter 15 India Semiconductor Technology, Innovation and Sustainability Outlook
- 15.1 Technology Landscape and Maturity
- 15.2 Product, Process and Service Innovation
- 15.3 AI, Automation and Digital Tools in the Industry
- 15.4 Technology Adoption and Performance Benchmarking
- 15.5 Innovation Pipeline and R&D Investment
- 15.6 Patent and Intellectual Property Trends
- 15.7 Energy Efficiency and Resource Management
- 15.8 Sustainability, Recycling and Circularity
- 15.9 Technology Roadmap, 2025-2035
- 15.10 Risks of Obsolescence and Technology Substitution
Chapter 16 India Semiconductor Market Key Strategic Imperatives
- 16.1 Growth and Market Entry Priorities
- 16.2 High-Return Products and Segments
- 16.3 Pricing, Profitability and Cost Optimization
- 16.4 Technology Investment and Product Differentiation
- 16.5 Supply Chain Localization and Resilience
- 16.6 Distribution and Customer Acquisition
- 16.7 Partnership, Acquisition and Capacity Strategy
- 16.8 Regional Expansion Priorities
- 16.9 Short-, Medium- and Long-Term Actions
Chapter 17 Competition Outlook
- 17.1 Industry Competition Characteristics
- 17.2 Market Structure and Concentration
- 17.3 Market Share and Competitive Positioning, 2025
- 17.4 Company-Wise Revenue and Product Benchmarking
- 17.5 Production and Service Capacity Benchmarking
- 17.6 Technology, Pricing and Differentiation
- 17.7 Regional Footprint and Distribution Strength
- 17.8 Mergers, Acquisitions and Strategic Alliances
- 17.9 New Entrants and Competitive Threats
- 17.10 Porter's Five Forces and Industry Attractiveness
- 17.11 Competitive Outlook, 2025-2035
Chapter 18 Company Profiles
- 18.1 Company Coverage and Selection Criteria
- 18.2 MediaTek Inc.
- 18.2.1 Business Description
- 18.2.2 Company Ownership and Geographic Presence
- 18.2.3 Product and Service Portfolio
- 18.2.4 Manufacturing and Operating Footprint
- 18.2.5 Production Capacity and Expansion Plans
- 18.2.6 Financial Performance and Investment
- 18.2.7 Market Share and Competitive Position
- 18.2.8 Technology and Innovation Capabilities
- 18.2.9 Strategic Alliances or Partnerships
- 18.2.10 Recent Developments
- 18.2.11 Growth Strategy and Outlook
- 18.3 Qualcomm Incorporated
- 18.4 Samsung Electronics Co., Ltd.
- 18.5 NVIDIA Corporation
- 18.6 Micron Technology, Inc.
- 18.7 Texas Instruments Incorporated
- 18.8 STMicroelectronics N.V.
- 18.9 Intel Corporation
- 18.10 Infineon Technologies AG
- 18.11 NXP Semiconductors N.V.
- 18.12 Other Relevant Market Participants
Note: Every listed company is profiled on the structure shown under the first company. The company list is preliminary and may change based on research findings, market developments, data availability and client requirements.
Chapter 19 Disclaimer
- 19.1 Research and Forecast Disclaimer
- 19.2 Data Source and Estimation Limitations
Note: The depth of individual sections depends on data availability for this market. Volume, capacity, trade and other unit-based metrics are included where applicable.

