
Server boards and refresh cycles anchor regional demand
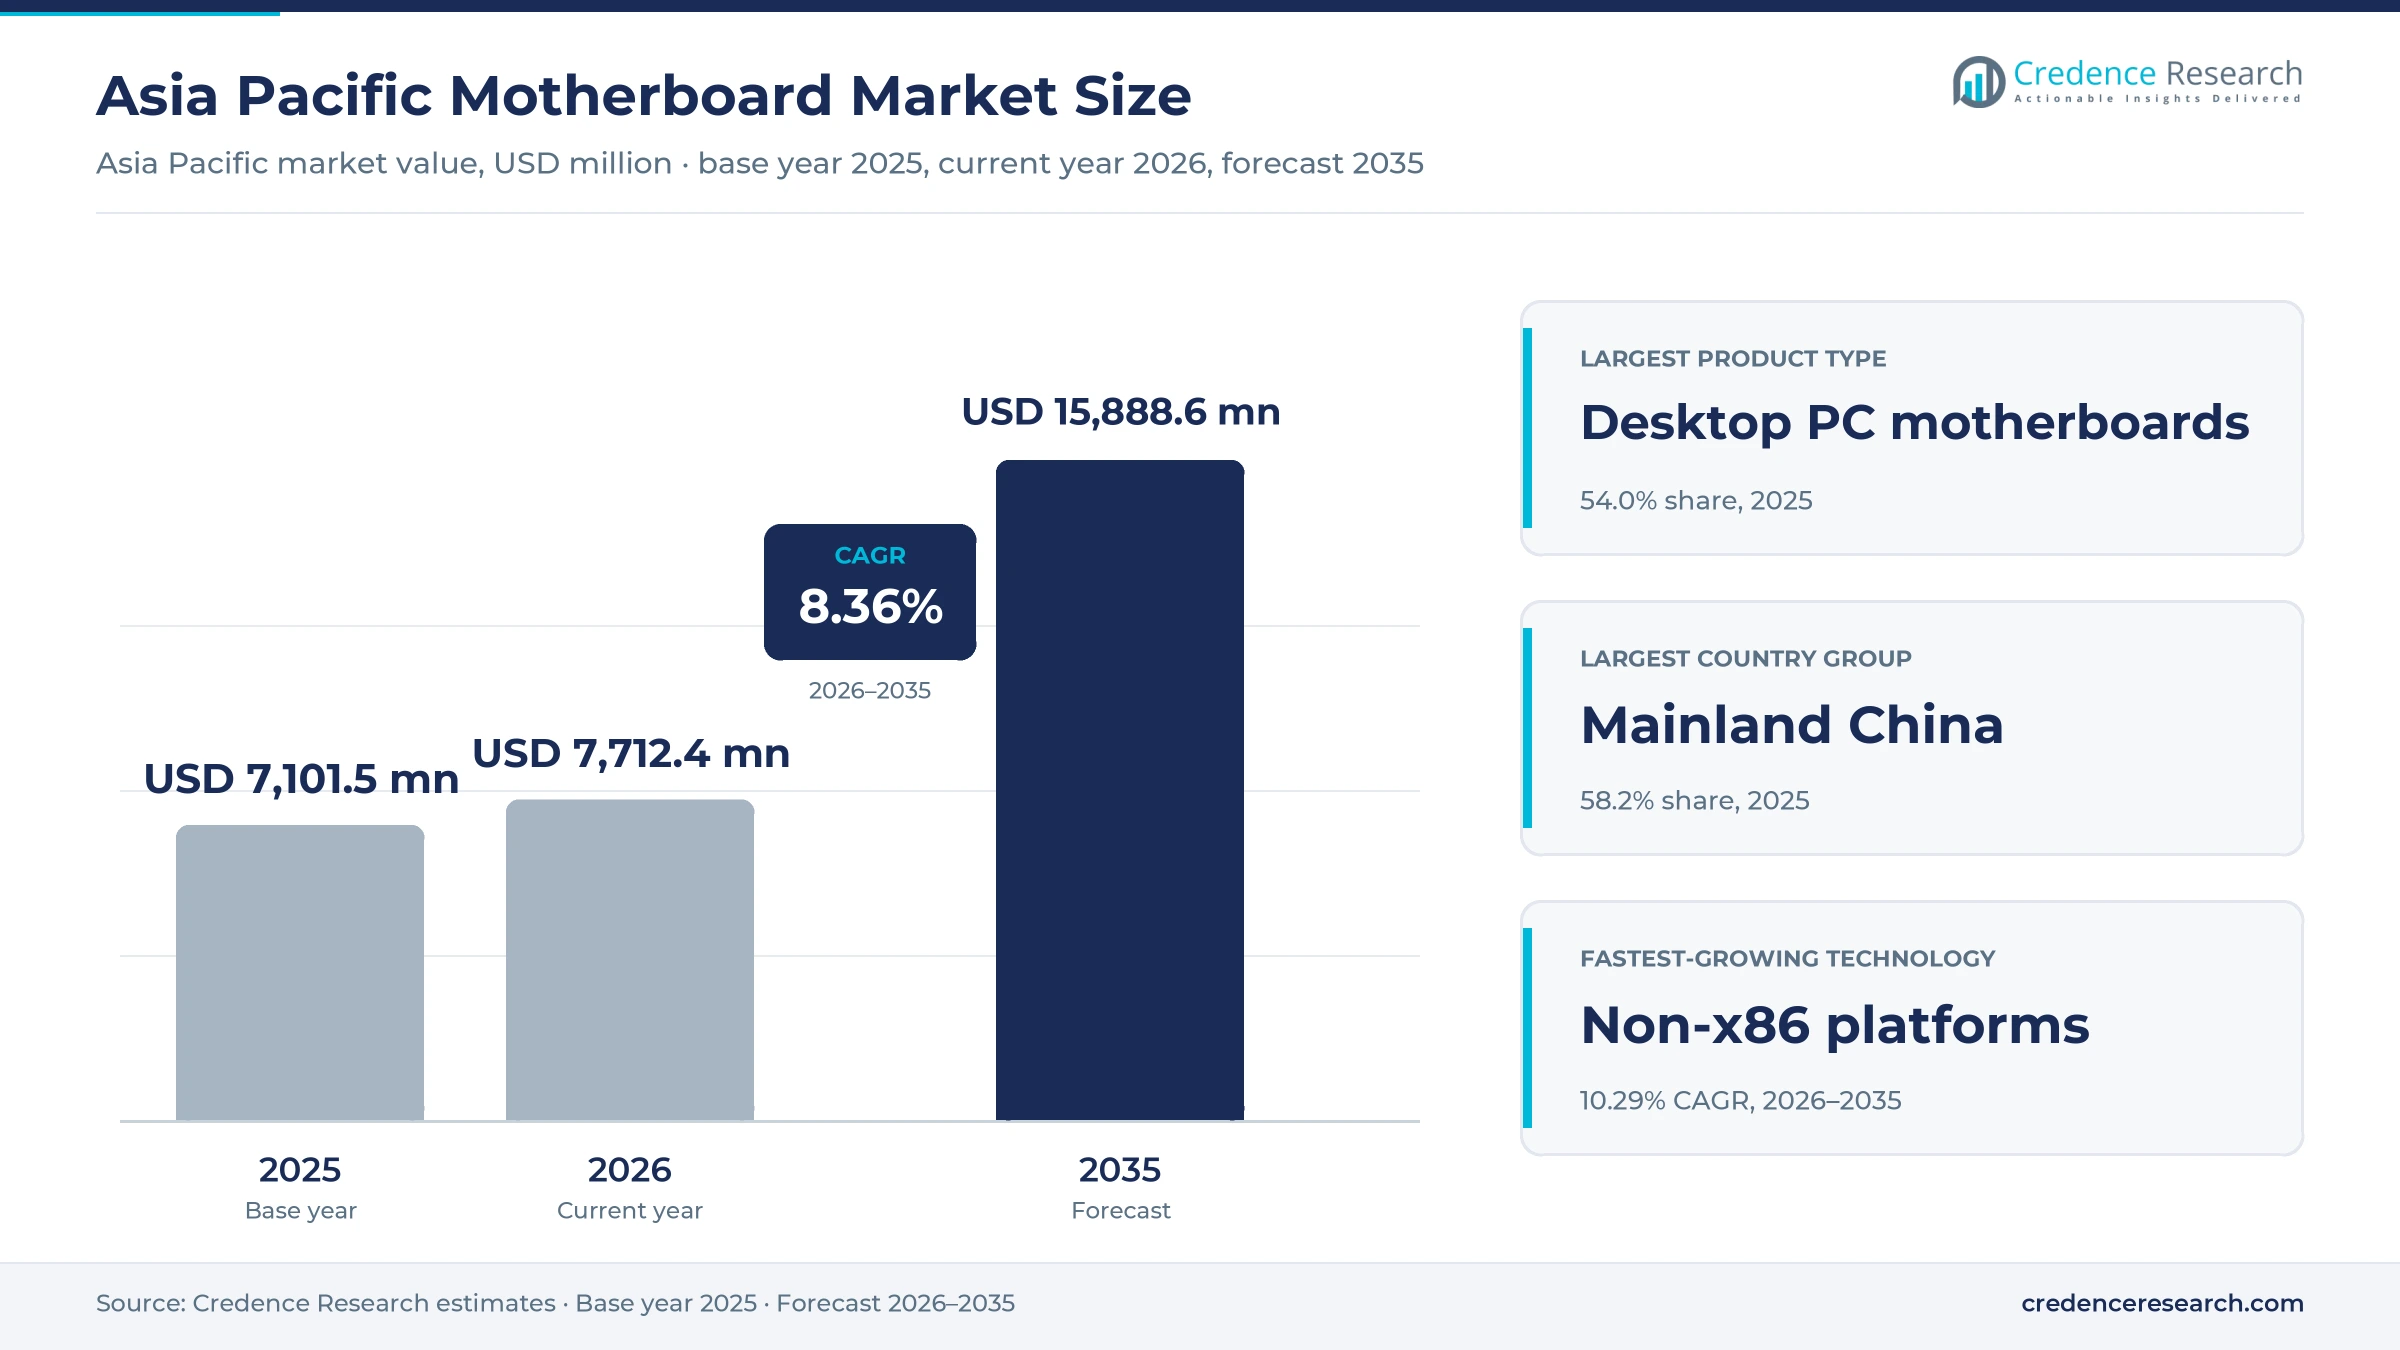
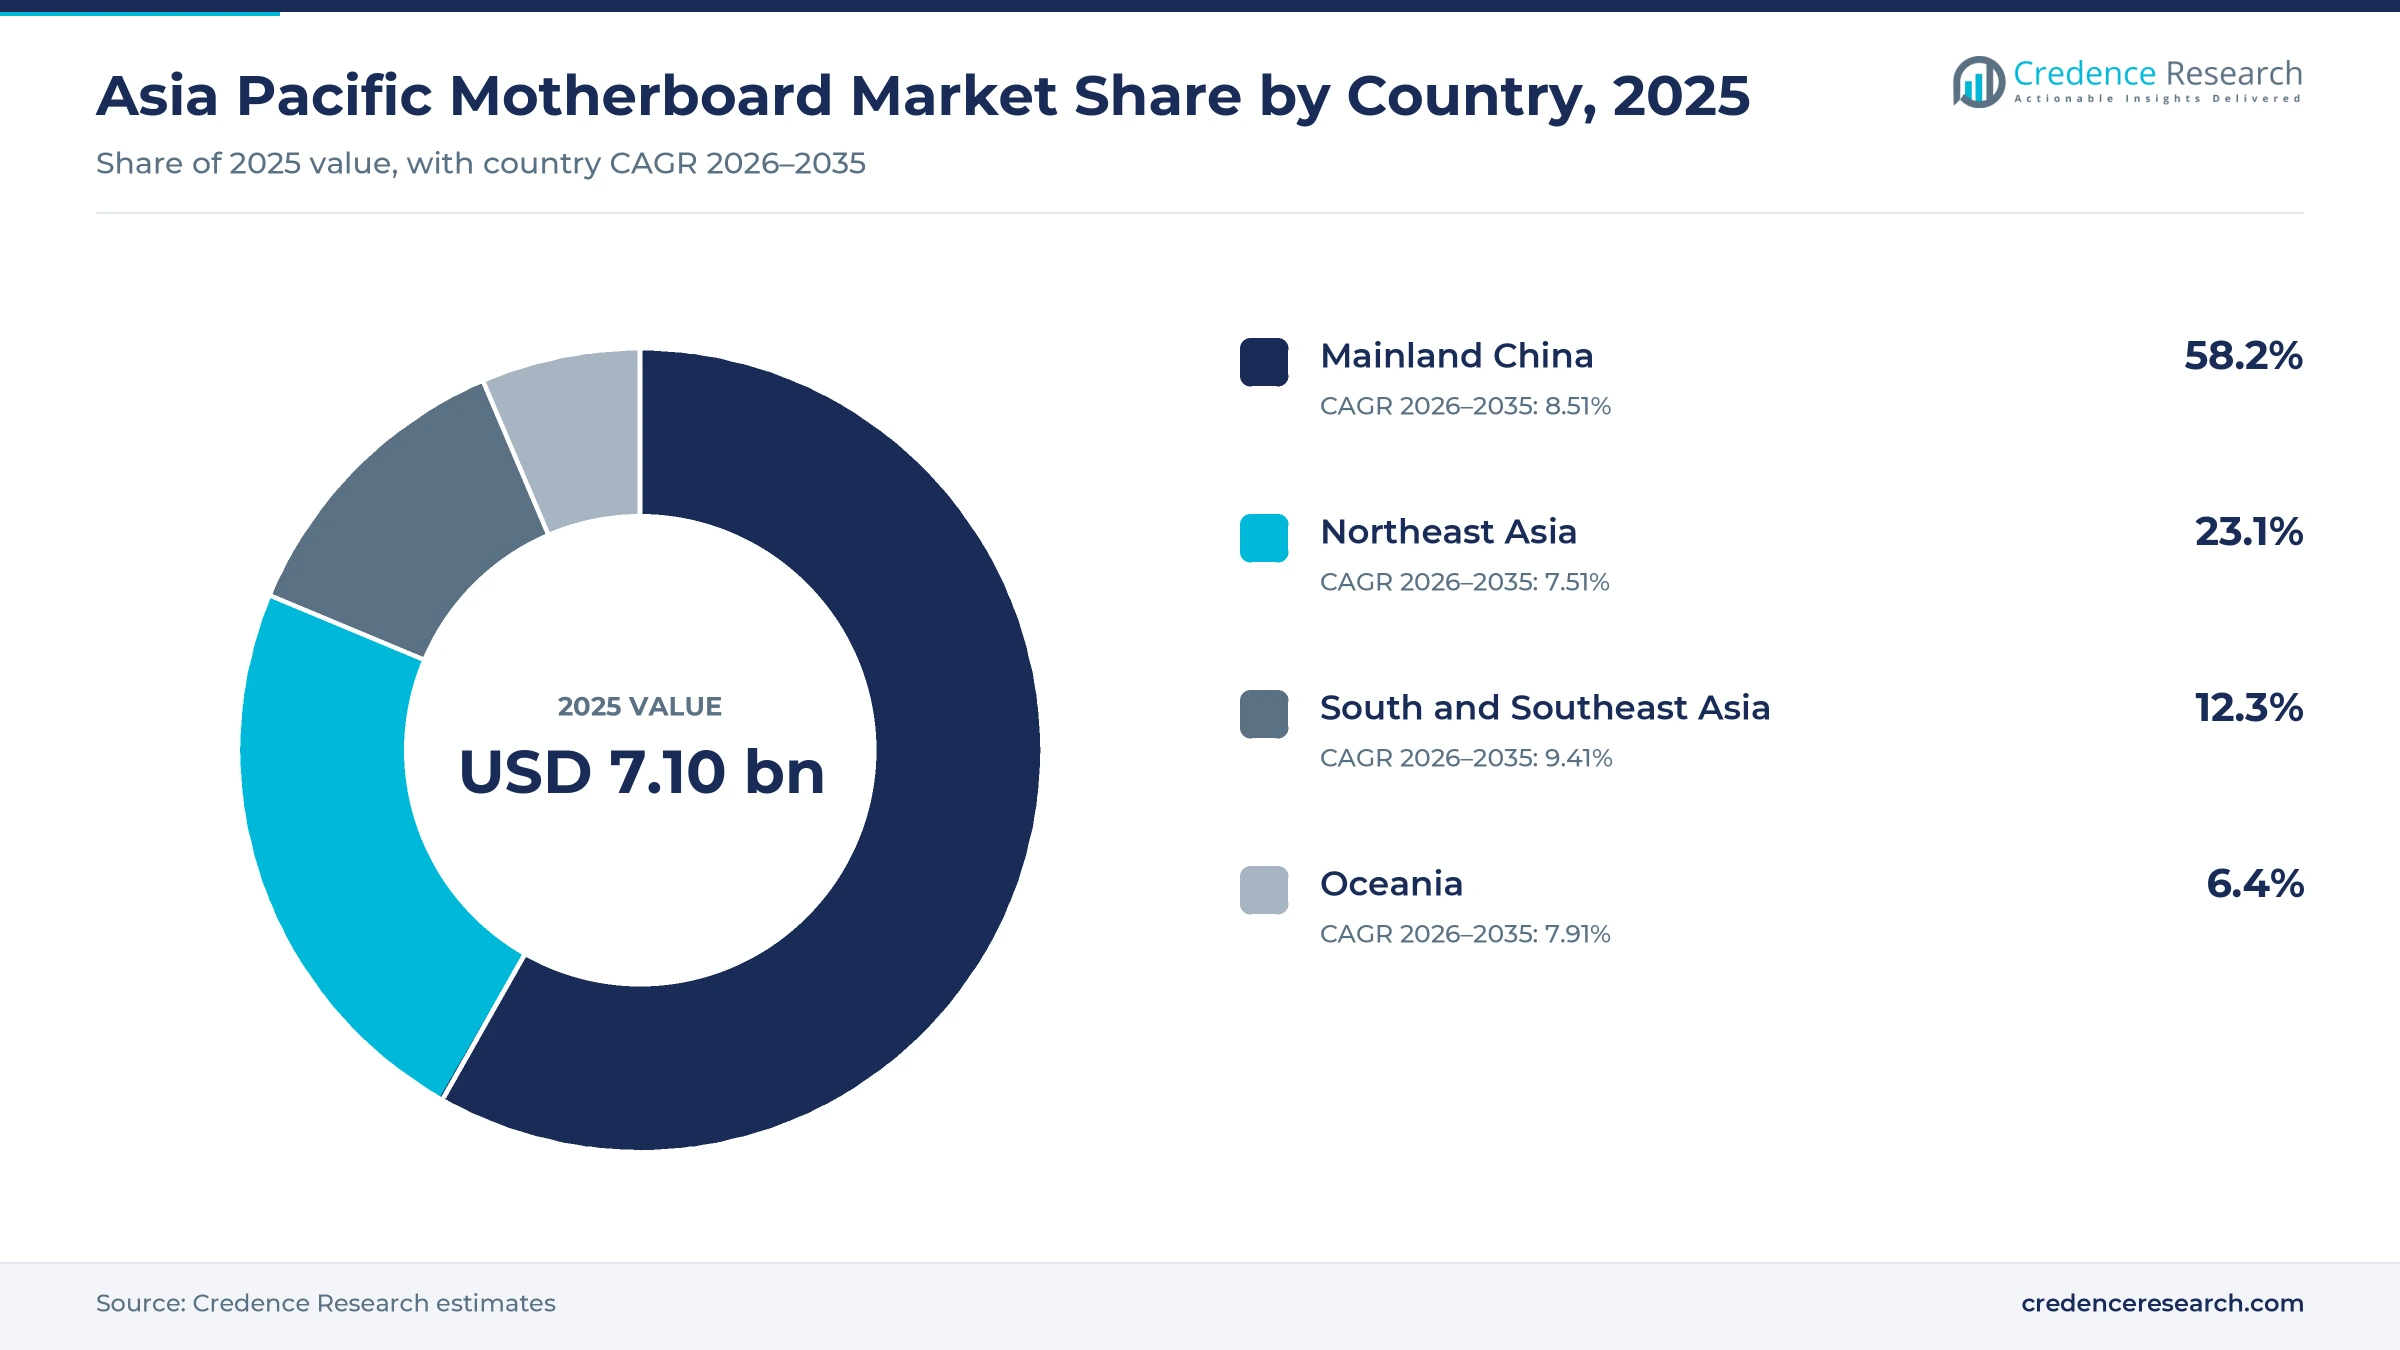
The Asia Pacific motherboard market was valued at USD 7.10 billion in 2025 and is projected to increase from USD 7.71 billion in 2026 to USD 15.89 billion by 2035, registering a CAGR of 8.36% during 2026–2035. Demand comes from individual buyers, system builders, cloud and enterprise operators and industrial equipment makers that need a validated board before any processor, memory or accelerator can be used. Mainland China held the largest country share, 58.2% in 2025, because board assembly, component supply and system building all concentrate there. South and Southeast Asia form the fastest-growing area at 9.41% a year, as new plants, data center campuses and automation projects raise local board consumption. In turn, the end of Windows 10 support and the buildout of accelerated computing are moving buyers toward newer sockets, denser power delivery and boards that cost more than the units they replace.
Which boards and buyers are counted in the estimate?
The estimate measures spending across Asia Pacific on printed motherboards sold for desktop computers, servers and industrial or embedded systems, including boards supplied inside complete systems and boards sold on their own. It covers Intel-compatible, AMD-compatible and non-x86 platforms bought by individual buyers, system builders, cloud and enterprise operators and equipment makers. Values are stated in USD million at current prices and cover the board itself rather than the finished system around it.
The estimate excludes notebook mainboards, smartphone and tablet boards, add-in cards, bare laminate and the processors, memory and storage fitted to a board. The value chain runs from board designers and contract assemblers through authorized distributors, independent traders and system integrators to buyers in every country of the region.
Asia Pacific Motherboard Market Insights
- The Asia Pacific motherboard market was valued at USD 7.10 billion in 2025 and is projected to reach USD 15.89 billion by 2035, at an 8.36% CAGR during 2026–2035.
- Mainland China held a 58.2% share of 2025 value, because board assembly, component supply and system building concentrate there.
- Desktop PC motherboards led product types with a 54.0% share of 2025 value, as consumer, gaming and office machines ship in the largest numbers.
- Windows 10 support ended on Oct. 14, 2025, which pushed commercial buyers toward newer platforms that older boards cannot support.
- Server motherboards grow fastest among product types at 10.09% a year during 2026–2035, as accelerated computing capacity expands.
Desktop boards lead while server boards gain fastest
Why do desktop boards still ship in the largest numbers?
Based on product type, the market is categorized into desktop PC motherboards, server motherboards and industrial and embedded motherboards. Desktop PC Motherboards led with a 54.0% share of 2025 value, because home, gaming and office machines ship in far larger unit numbers than any other class. Server Motherboards grow fastest at 10.09% a year, as operators add accelerated and high-density compute capacity.
How much board value sits with compute capacity?
Based on application, the market is categorized into consumer and gaming computing, commercial desktop computing, data centre and high-performance computing, and industrial edge computing. Data Centre and High-Performance Computing led with a 33.0% share of 2025 value, because each rack holds boards that cost far more than a home machine. Data Centre and High-Performance Computing also grows fastest at 9.84% a year through the forecast.
Which platform families hold the installed sockets?
Based on technology, the market is categorized into Intel-compatible x86 platforms, AMD-compatible x86 platforms and non-x86 platforms. Intel-Compatible x86 Platforms led with a 58.0% share of 2025 value, because most commercial fleets and retail boards still follow that socket roadmap. Non-x86 Platforms grow fastest at 10.29% a year, as Arm-based and domestic designs win server and edge sockets.
Is buying moving toward direct supply agreements?
Based on distribution channel, the market is categorized into direct manufacturer sales, authorized distribution and independent channel sales. Direct Manufacturer Sales led with a 44.0% share of 2025 value, because large builders and cloud operators contract board volume directly. Direct Manufacturer Sales grow fastest at 9.20% a year as validated supply matters more to buyers.
| Segment Group | Leading Sub-segment | Share, 2025 | Fastest-growing Sub-segment | CAGR, 2026–2035 |
|---|---|---|---|---|
| By Product Type | Desktop PC Motherboards | 54.0% | Server Motherboards | 10.09% |
| By Application | Data Centre and High-Performance Computing | 33.0% | Data Centre and High-Performance Computing | 9.84% |
| By Technology | Intel-Compatible x86 Platforms | 58.0% | Non-x86 Platforms | 10.29% |
| By Distribution Channel | Direct Manufacturer Sales | 44.0% | Direct Manufacturer Sales | 9.20% |
Request a Free Sample
Fill in your details and we'll send you a free sample report.
- Sample data tables & charts
- Research methodology
Refresh work, server builds and edge wins lift volume
How does commercial refresh work raise board demand?
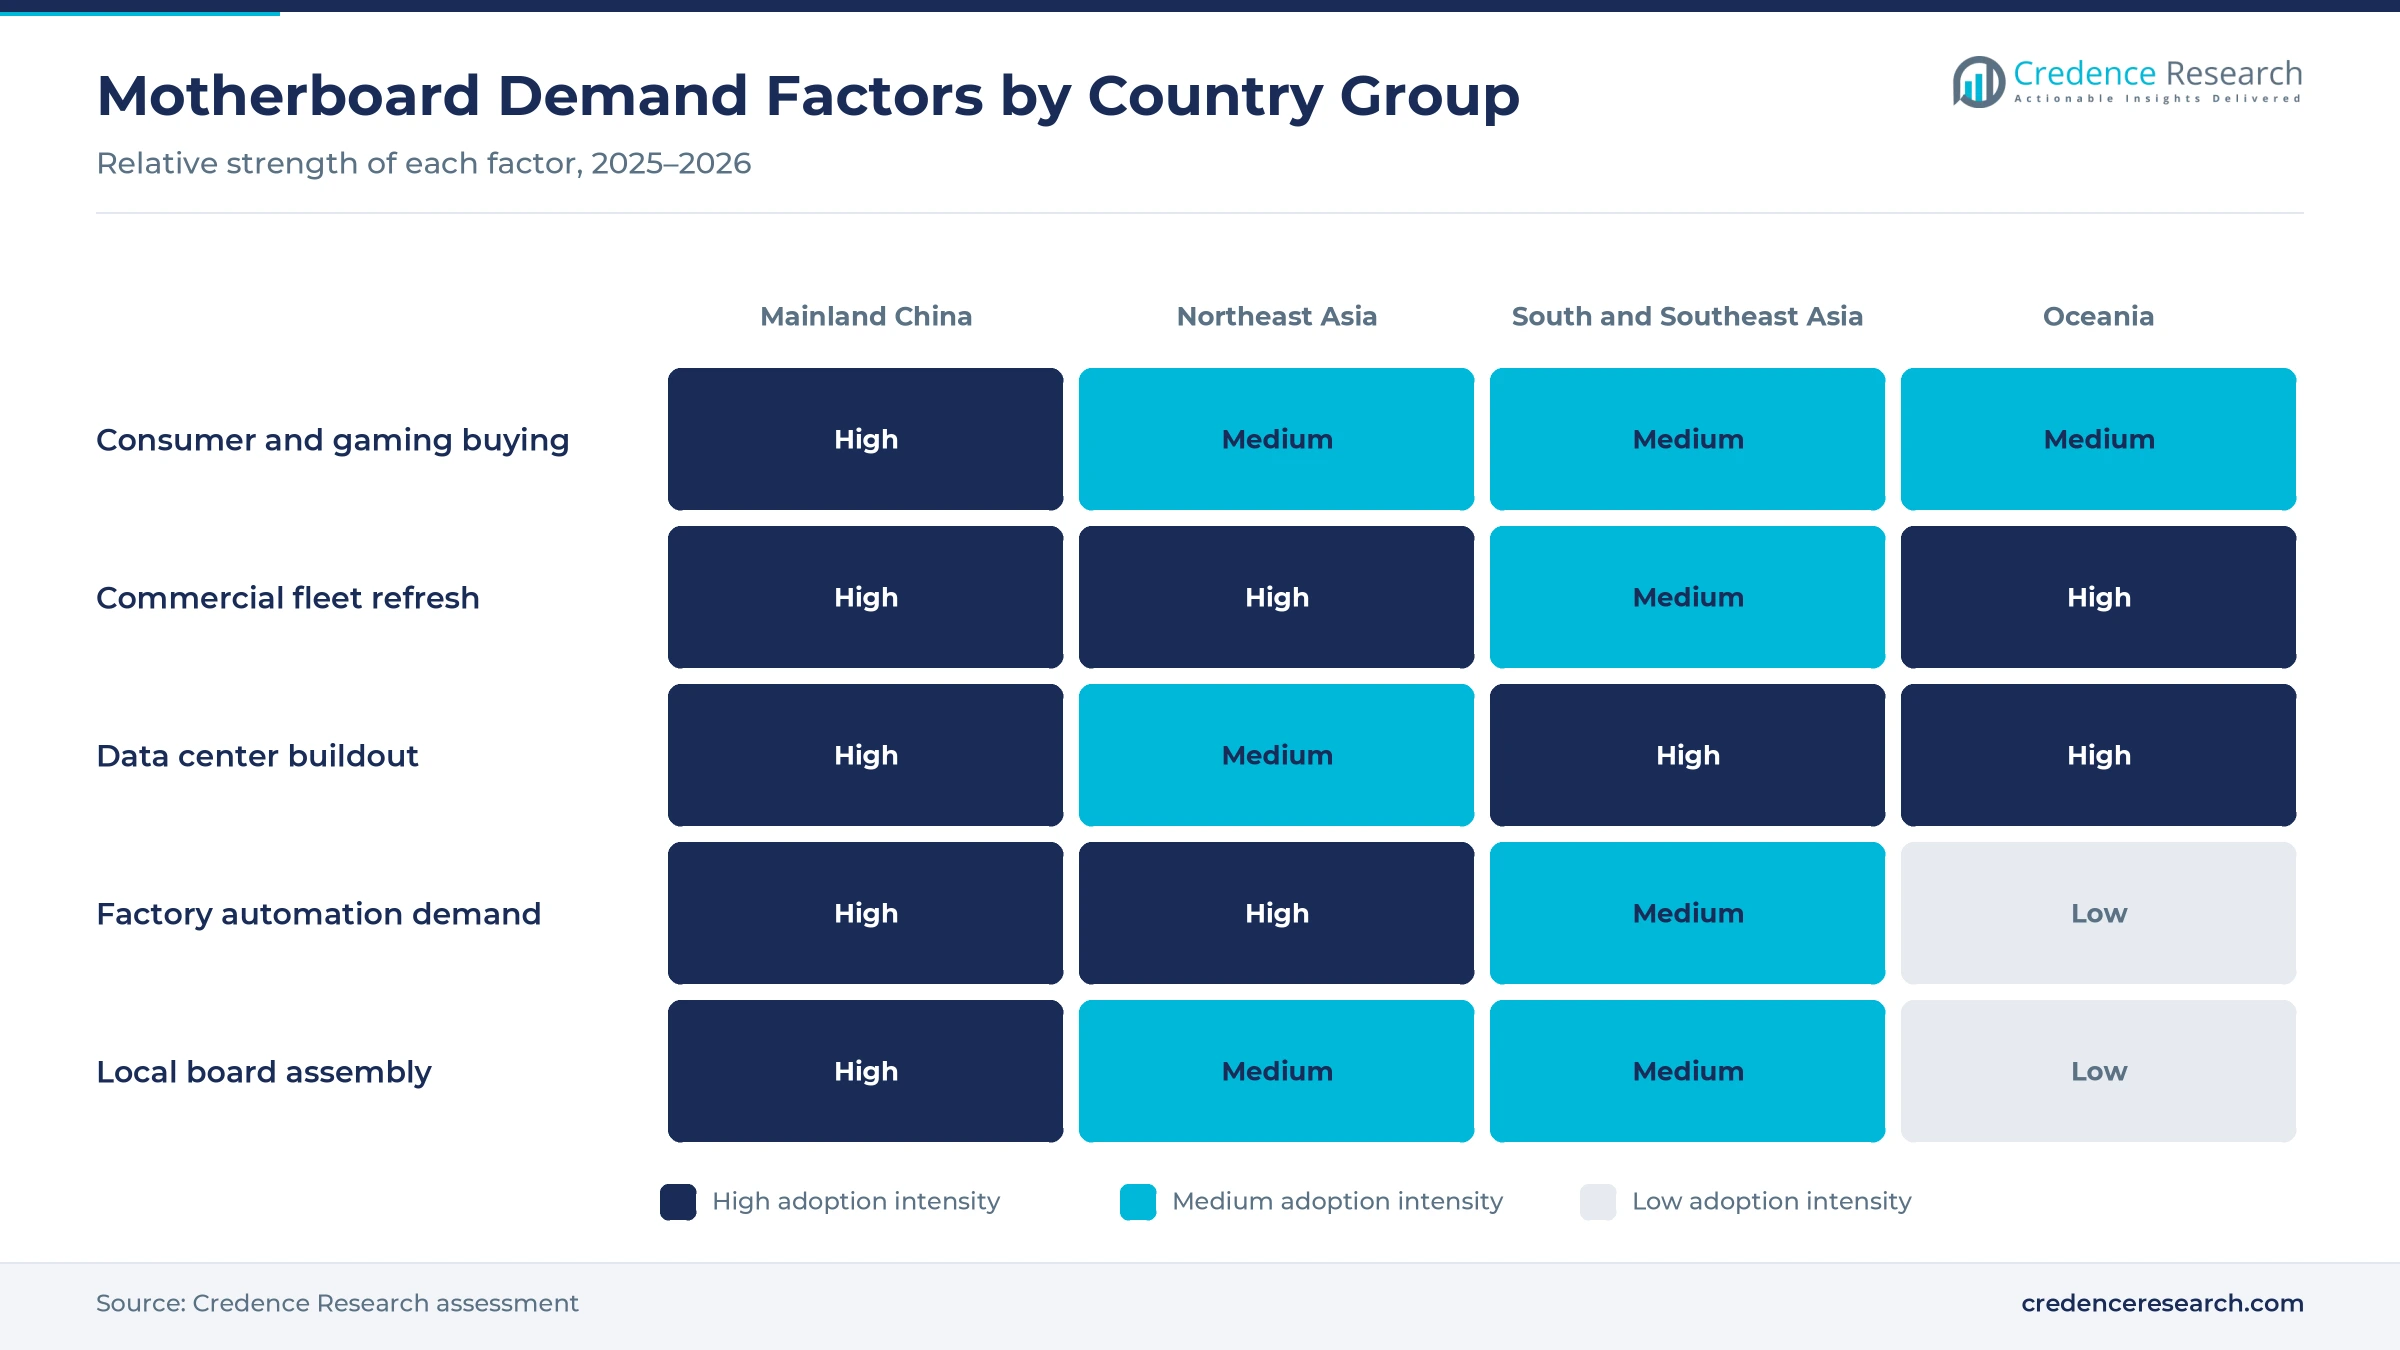
Commercial refresh work raises board demand, because an operating system change forces buyers to replace whole platforms rather than single parts. Windows 10 support ended on Oct. 14, 2025, and the consumer extended security update program runs only to Oct. 12, 2027, according to the vendor support notice. Office fleets that cannot meet the newer platform requirements therefore move to current sockets, which carry different chipsets, memory standards and power delivery. Desktop PC motherboards still led product types with a 54.0% share of 2025 value because of this installed base. As a result, commercial desktop computing keeps a large share of regional board value while replacement cycles run through the second half of the decade.
Why does server platform complexity lift board value?
Server platform complexity lifts board value, because accelerated systems need more layers, tighter power delivery and validated firmware than an office board. Google said on Oct. 15, 2025 that it would invest about $15 billion from 2026 to 2030 in an AI hub at Visakhapatnam with gigawatt-scale compute capacity, working with AdaniConnex and Airtel, according to reported project plans. China held more than 13.73 million standard racks and about 1.59 million PFLOPS of intelligent computing power at the end of 2025. Because each rack carries boards priced far above consumer units, data center work leads applications at 33.0% of 2025 value, and demand for data center servers grows with it.
What makes industrial edge design wins durable?
Industrial edge design wins are durable, because a board qualified into a machine stays in production for years. Asia accounted for 74% of the 542,000 industrial robots installed worldwide in 2024, with 295,000 units in China and a record 9,100 in India, according to robotics industry data. Advantech, Taiwan's largest industrial computer maker, said in May 2026 that it would invest more than NT$8.2 billion over five years to expand manufacturing, and it is building a plant at Hwa Ya Technology Park to double Taiwan capacity. Consequently, industrial and embedded boards hold steady demand even when consumer buying slows across the region.
How does regional manufacturing scale support supply?
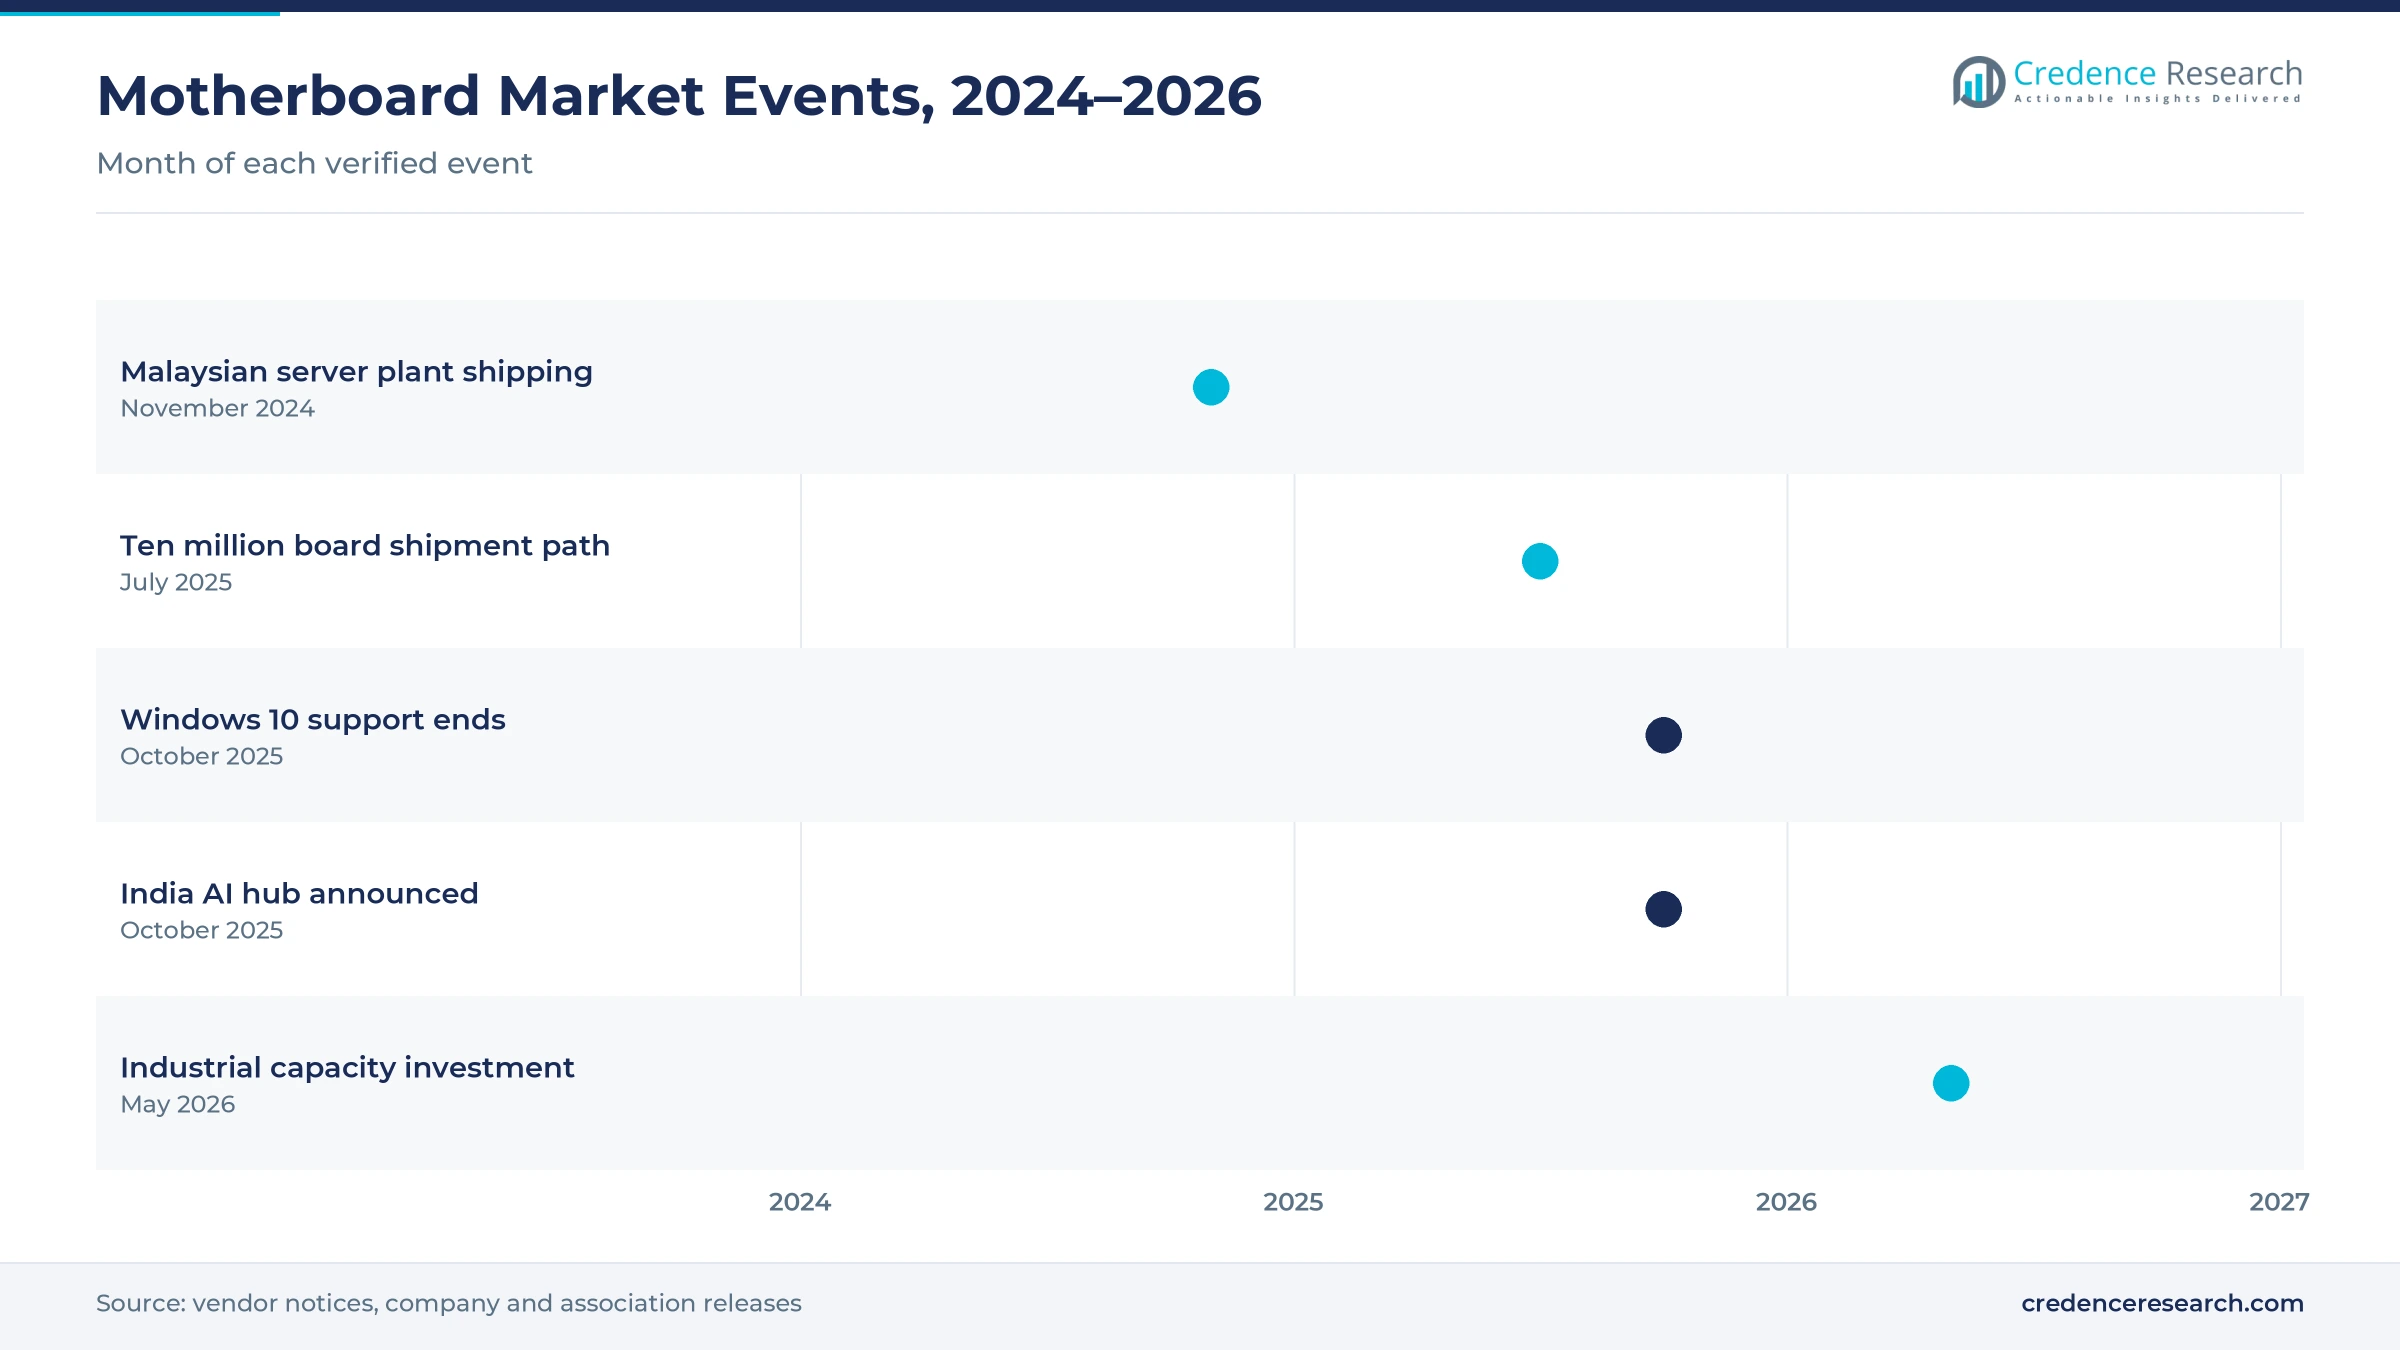
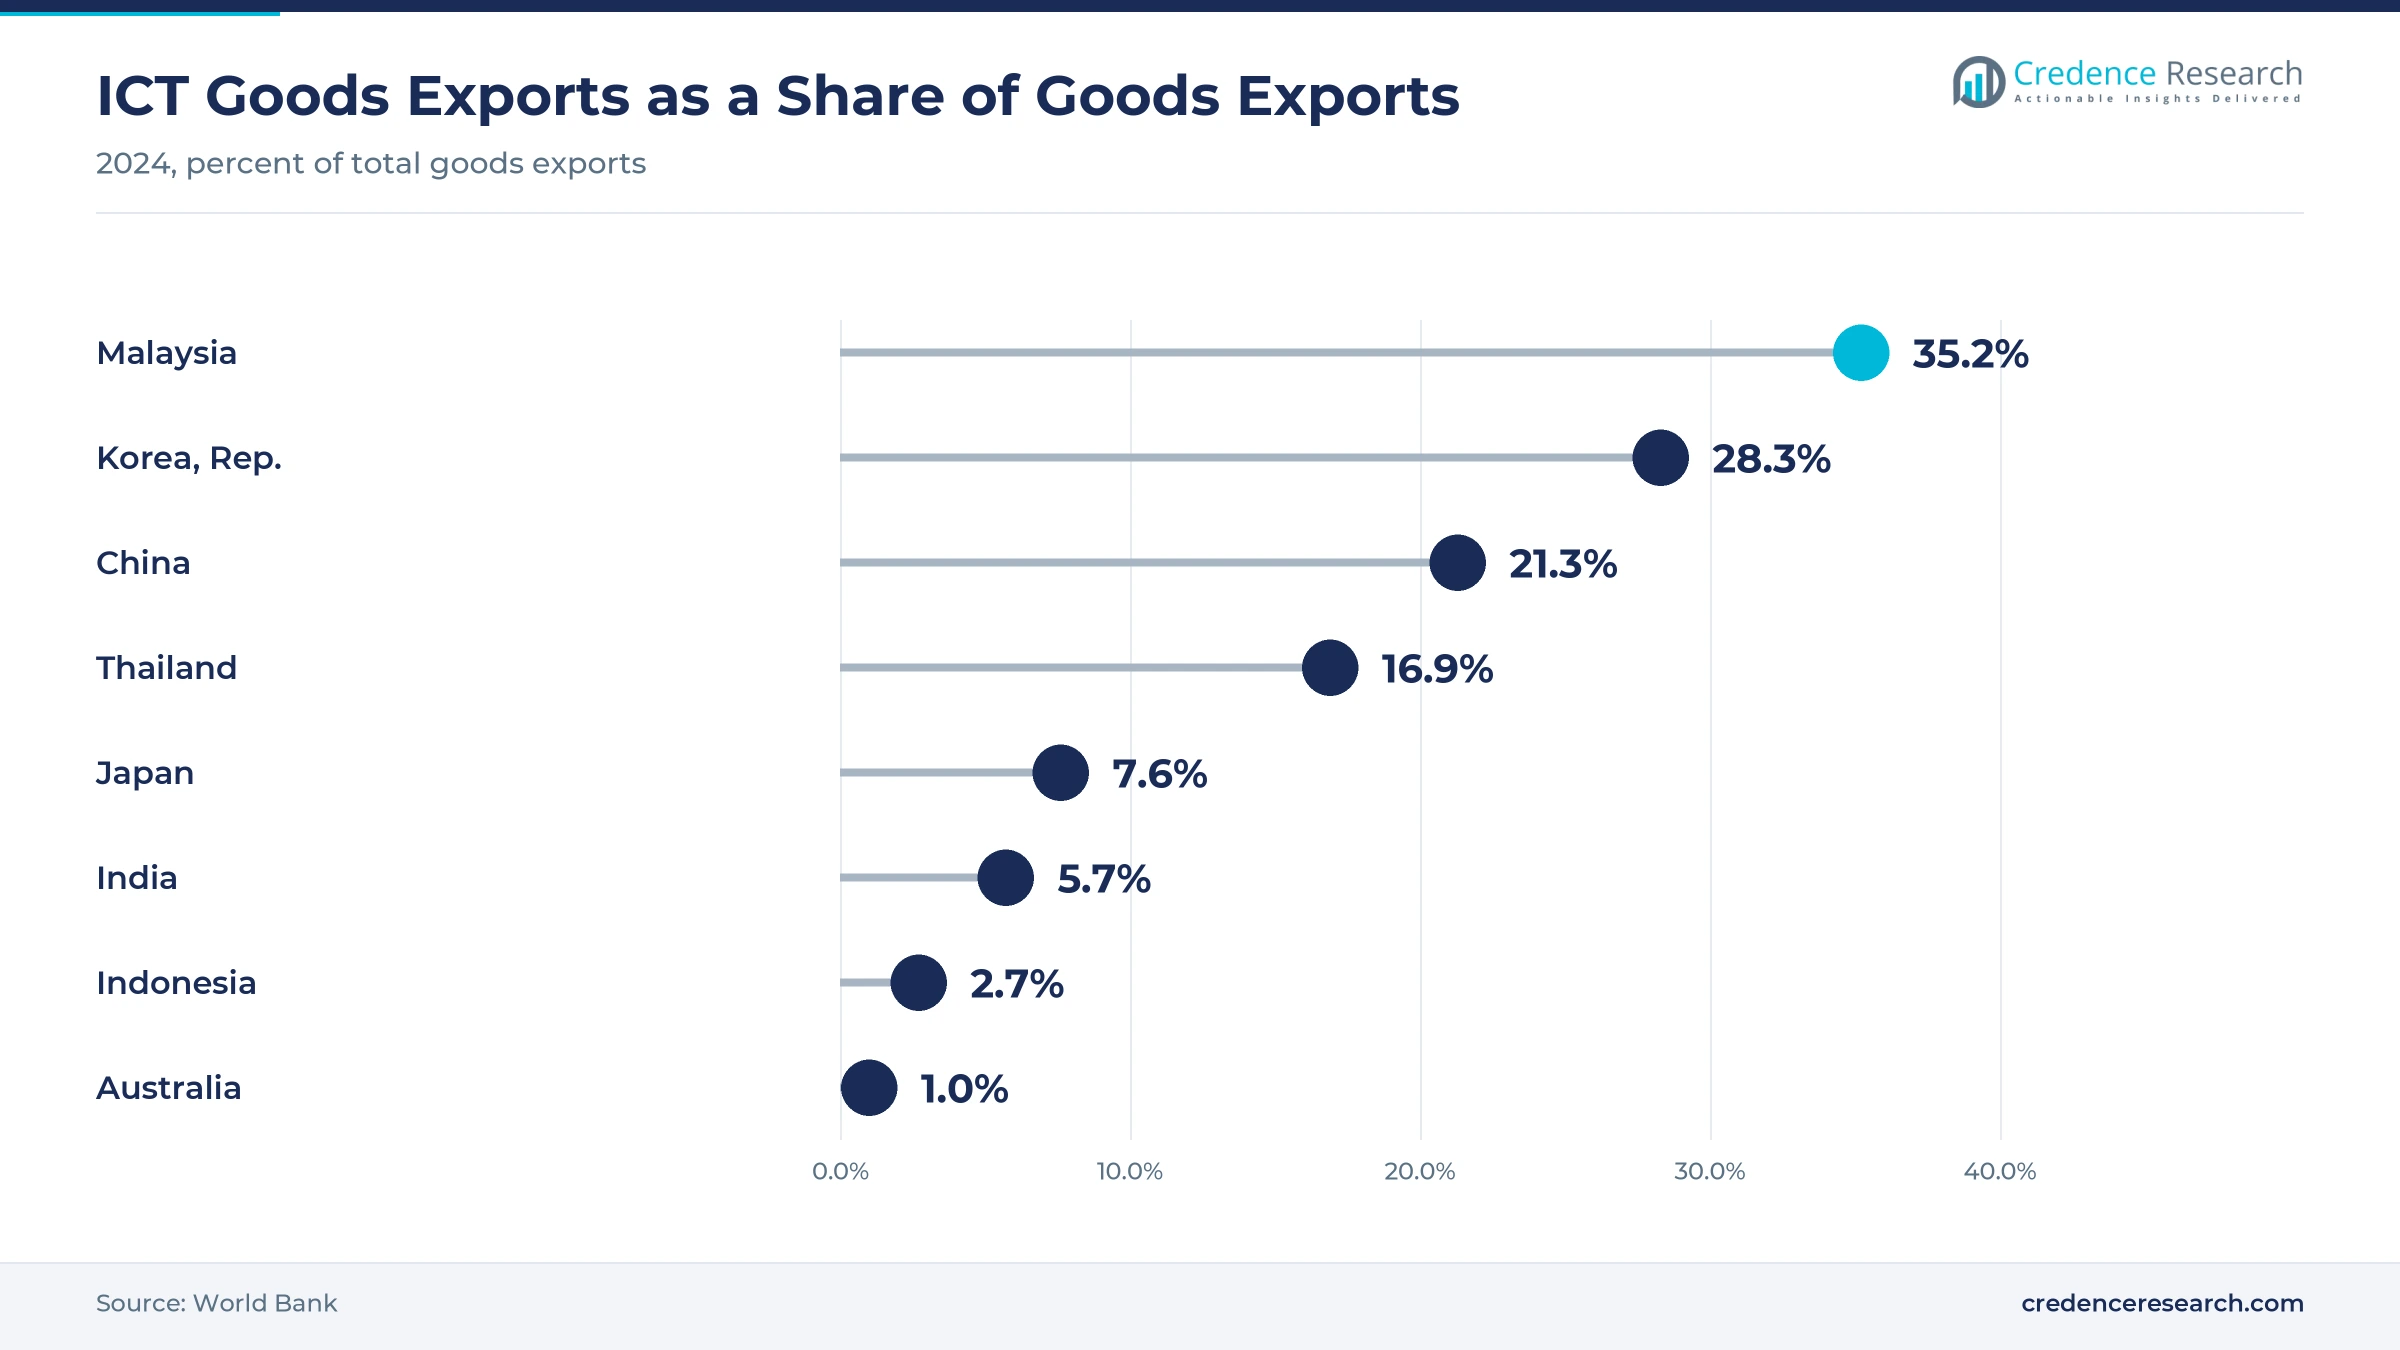
Regional manufacturing scale supports supply, because board assembly, component supply and system building sit inside the same countries that buy the output. Information and communication technology goods made up 35.2% of Malaysian goods exports in 2024, 28.3% in the Republic of Korea and 21.3% in China, according to World Bank trade data. Super Micro Computer said in November 2024 that it expected to ship from its Malaysian factory before the end of that year. India approved 27 manufacturers under its second information technology hardware incentive scheme, which covers servers and personal computers. In turn, demand for printed circuit boards follows board assembly into these countries.
Value shifts to costlier boards and new platforms
Why is value moving toward costlier boards?
Value is moving toward costlier boards, because server and workstation designs carry more layers, sockets and power stages than mainstream desktop products. Micro-Star International was reported in July 2025 to be on track to ship about 10 million motherboards during 2025, a scale matched by Gigabyte Technology. Direct manufacturer sales already led channels with a 44.0% share of 2025 value, which suits buyers contracting high-value boards. Server boards also grow fastest among product types at 10.09% a year, which lifts average selling prices. As a result, unit growth understates spending growth, and boards sold alongside graphics cards carry higher prices than a decade ago.
How fast are platforms spreading beyond one socket family?
Platforms are spreading beyond one socket family, because buyers want competing roadmaps for price, power and supply security. Intel-compatible platforms still led technologies with a 58.0% share of 2025 value, yet non-x86 platforms grow fastest at 10.29% a year. ASRock, the third-largest motherboard brand and owned by Pegatron since 2010, entered industrial and server board work in 2012, which widened platform choice for buyers. Advantech said in October 2026 that customers increasingly want industrial edge servers with built-in computing. Because domestic Chinese designs also need boards, platform variety rises faster than total unit shipments, including at edge computing sites that run compact systems.
Can automation projects open a clear board opening?
Automation projects open a clear board opening, because every controller, inspection system and robot cell needs an embedded board with long availability. Japan installed 44,500 industrial robots in 2024 and the Republic of Korea installed 30,600, so Northeast Asia keeps a 23.1% share of regional board value. Advantech opened its North American headquarters in Tustin, California, in August 2026 while expanding plants in Taiwan and Japan, which signals confidence in long-life board demand. Compute-heavy applications grow fastest at 9.84% a year, and industrial edge work follows close behind that pace. In turn, suppliers that hold ten-year supply commitments win designs that rarely change hands.
Where does new cloud capacity create board demand?
New cloud capacity creates board demand, because each site fills racks with server boards before any service runs. Amazon set out plans on June 14, 2025 to invest AU$20 billion in Australian data center infrastructure from 2025 to 2029, including three new solar farms supplying more than 170 megawatts, according to the company announcement. Oceania held a 6.4% share of 2025 value and grows at 7.91% a year on that work. Because operators buy validated boards in volume rather than single units, this demand lands with direct supply agreements. As a result, hyperscale site operators now shape board specifications across the region.
Component costs, thin margins and socket changes bite
How do component cost swings affect board makers?
Component cost swings affect board makers, because memory, power stages and controllers are bought in advance of demand. A sharp rise in any of those inputs lands on a board that was already quoted to a builder. As a result, suppliers either absorb the cost or renegotiate orders that are part-built, which pressures margins. Larger brands respond with long-term component agreements and by shifting mix toward boards where the added cost can be recovered in the price.
Why are entry-level boards hard to profit from?
Entry-level boards are hard to profit from, because the design work is similar yet the selling price is a fraction of a server product. Independent channel sales, where the cheapest boards move, grow slowest among channels at 9.20% pace behind direct supply, which limits recovery of design cost. Consequently, brands trim entry ranges and push buyers toward mid-tier boards. Suppliers respond by sharing layouts across several models so that engineering cost spreads over more volume.
What problems do frequent socket changes create?
Frequent socket changes create planning problems, because each new processor family can require a different board, chipset and memory standard. Builders holding older inventory then face a write-down risk when a platform is replaced. In turn, industrial buyers insist on long availability commitments before qualifying a board into a machine. Suppliers respond with extended-life product lines and clear roadmaps so that customers can plan replacements years ahead.
Can smaller brands match validation requirements?
Smaller brands struggle with validation requirements, because cloud and enterprise buyers demand firmware security, thermal testing and compliance records for every board. Meeting those requirements needs engineering staff that entry-focused brands may not carry. As a result, large contracts concentrate with a handful of suppliers across the region. Smaller companies respond by serving system builders and independent traders where documentation demands are lighter and turnaround matters more.
China leads while South and Southeast Asia gains fastest
| Country | Value, 2025 (USD billion) | Share, 2025 | CAGR, 2026–2035 |
|---|---|---|---|
| Mainland China | 4.13 | 58.2% | 8.51% |
| Northeast Asia | 1.64 | 23.1% | 7.51% |
| South and Southeast Asia | 0.87 | 12.3% | 9.41% |
| Oceania | 0.45 | 6.4% | 7.91% |
Assembly and system building keep Mainland China ahead
Mainland China held a 58.2% share of 2025 value and grows at 8.51% a year. The country held more than 13.73 million standard racks and about 1.59 million PFLOPS of intelligent computing power at the end of 2025, which absorbs large volumes of server boards. Information and communication technology goods also made up 21.3% of its goods exports in 2024. Because domestic brands such as Colorful Group and MAXSUN sell into the same market where boards are assembled, pricing and supply decisions made in China reach buyers across the region.
Design and factory automation anchor Northeast Asia
Northeast Asia held a 23.1% share of 2025 value and grows at 7.51% a year. Japan installed 44,500 industrial robots in 2024 and the Republic of Korea installed 30,600, which keeps embedded board demand steady in both countries. Information and communication technology goods made up 28.3% of Korean goods exports in 2024 and 7.6% of Japanese goods exports. In turn, demand here leans on industrial controllers, workstation platforms and enterprise servers rather than on retail board sales to individual buyers.
Why does South and Southeast Asia grow fastest?
South and Southeast Asia held a 12.3% share of 2025 value and grow fastest at 9.41% a year. India installed a record 9,100 industrial robots in 2024, up 7% on a year earlier, and approved 27 manufacturers under its second hardware incentive scheme covering servers and personal computers. Information and communication technology goods reached 35.2% of Malaysian goods exports in 2024. As a result, new assembly plants and data center campuses lift board consumption faster than in any other part of the region.
Cloud capacity carries demand across Oceania
Oceania held a 6.4% share of 2025 value and grows at 7.91% a year. Amazon set out a plan in June 2025 to invest AU$20 billion in Australian data center infrastructure through 2029, with expansion around Sydney and Melbourne. Information and communication technology goods made up only 1.0% of Australian goods exports in 2024, so almost every board is imported. Because buyers here are cloud operators, enterprises and retail builders rather than assemblers, demand concentrates in server boards and mid-tier desktop products.
Plant starts, platform dates and AI plans, 2024–2026
| Development | Status and market relevance |
|---|---|
| In November 2024, Super Micro Computer said it expected to ship from its Malaysian factory before year-end. | Adds regional server board capacity |
| In July 2025, Micro-Star International was reported on track to ship about 10 million motherboards in 2025. | Shows scale of brand shipments |
| In October 2025, Windows 10 reached the end of support, with consumer updates running only to October 2027. | Forces commercial platform replacement |
| In October 2025, Google announced about $15 billion for an AI hub at Visakhapatnam in India. | Lifts server board demand in India |
| In May 2026, Advantech announced more than NT$8.2 billion of manufacturing investment over five years. | Expands embedded board capacity |
Intel, AMD and non-x86 platforms compete for sockets
- Intel-compatible platforms hold most commercial fleets and retail sockets, so chipset and memory changes on that roadmap move the largest share of board volume.
- AMD-compatible platforms win price-sensitive gaming builds and core-dense servers, which has lifted their share of regional board value.
- Non-x86 platforms cover Arm-based and domestic designs in servers and edge systems, where power efficiency and local supply matter most.
- Board form factor and power design decides which chassis a board fits and how much accelerated hardware it can feed, so it shapes price more than branding does.
Need a Custom Version of This Report?
Tailor the scope, geography, or segments to your exact requirements.
- Custom geography or segment scope
- Direct access to our analyst team
Taiwanese brands compete on channels and validation
Competition runs between Taiwanese board brands, Chinese domestic brands and industrial specialists that qualify boards into machines. Gigabyte Technology, based in New Taipei City, treats motherboards as its principal business alongside graphics cards and server hardware, and it shipped 4.8 million boards in the first quarter of 2015 as the leading vendor of that period. Micro-Star International was reported in July 2025 to be heading for about 10 million board shipments in 2025. ASRock, founded in Taipei in May 2002 and acquired by Pegatron in 2010, is the third-largest motherboard brand and added industrial and server boards in 2012. Advantech leads Taiwan industrial computing and is doubling home capacity. Super Micro Computer builds server platforms at its Malaysian factory for regional and export customers. Brands compete on validation, channel reach and long availability rather than on price alone.
Which suppliers have verified Asia Pacific board activity?
| Company | Type | Role in the market |
|---|---|---|
| Gigabyte Technology Co., Ltd. | Board brand | New Taipei City base with motherboards as principal business |
| Micro-Star International Co., Ltd. | Board brand | Reported path to about 10 million board shipments in 2025 |
| ASRock Inc. | Board brand | Taipei base, Pegatron-owned, industrial and server boards since 2012 |
| ASUSTeK Computer Inc. | Board brand | Taiwanese group that spun off ASRock as a separate brand in 2002 |
| Advantech Co., Ltd. | Industrial specialist | Taiwan industrial computing leader expanding Taoyuan capacity |
| Super Micro Computer, Inc. | Server platform maker | Malaysian factory shipping server systems since late 2024 |
Credence Research sees server and edge value rising
Credence Research's view is that Asia Pacific motherboard spending will grow faster than unit shipments through 2035, because server, workstation and edge designs cost more than the desktop boards they sit beside. Desktop products should keep the largest share of units, while server boards and non-x86 platforms add value fastest. Mainland China will stay the largest country group, although South and Southeast Asia gain share as assembly and cloud capacity expand. However, component cost swings, thin entry margins and socket changes will reward brands with validation depth and long availability.
Board shipments and price tiers anchor the model
The report uses 2025 as the base year, with values in USD million at current prices. Market values come from the Credence Research model, which combines board shipments by class, average prices by tier, system build rates and replacement cycles. The four country groups and their 2025 shares follow the client brief, while country growth rates and the splits by product type, application, technology and distribution channel are Credence Research estimates. Sources used are official trade and statistical data, vendor support notices, industry association data, company announcements and trade press, and no interviews or surveys were used.
Compute buildout shapes board demand through 2035
The Asia Pacific motherboard market is expected to reach USD 15.89 billion by 2035, an 8.36% CAGR during 2026–2035, as compute buildout, platform changes and automation keep board demand rising. Spending is projected to rise from USD 7.71 billion in 2026 as refresh work and new data center capacity land together. Growth should be strongest in server boards, non-x86 platforms and South and Southeast Asia, while Mainland China keeps the largest country share. In contrast, component cost swings and weaker consumer buying could slow unit growth in some years.
Frequently Asked Questions
How big is the Asia Pacific motherboard market?
Which country group leads demand?
Which country group grows fastest?
Which product type holds the largest share?
Which product type grows fastest?
How did the Windows 10 cutoff affect buyers?
Who are the leading companies in this market?
What are the main risks to growth?
Table of Content
Chapter 1 Market Segmentation
- 1.1 Segmentation Framework
- 1.1.1 Product and Service Classification
- 1.1.2 Application and End-Use Classification
- 1.1.3 Technology and Solution Classification
- 1.1.4 Customer and Distribution Channel Classification
- 1.1.5 Geographic Segmentation
- 1.1.6 Market Segment Definitions and Boundaries
- 1.2 By Product Type
- 1.2.1 Desktop PC Motherboards
- 1.2.2 Server Motherboards
- 1.2.3 Industrial and Embedded Motherboards
- 1.3 By Application
- 1.3.1 Consumer and Gaming Computing
- 1.3.2 Commercial Desktop Computing
- 1.3.3 Data Centre and High-Performance Computing
- 1.3.4 Industrial Edge Computing
- 1.4 By Technology
- 1.4.1 Intel-Compatible x86 Platforms
- 1.4.2 AMD-Compatible x86 Platforms
- 1.4.3 Non-x86 Platforms
- 1.5 By Country
- 1.5.1 Mainland China
- 1.5.2 Northeast Asia
- 1.5.3 South and Southeast Asia
- 1.5.4 Oceania
Chapter 2 Introduction
- 2.1 Report Objectives and Scope
- 2.2 Product Definition and Industry Terminology
- 2.3 Market Inclusions and Exclusions
- 2.4 Research Process
- 2.4.1 Primary Research and Expert Interviews
- 2.4.2 Secondary Research and Source Review
- 2.4.3 Top-Down and Bottom-Up Estimation
- 2.4.4 Data Triangulation and Verification
- 2.5 Market Size Measurement Basis
- 2.5.1 2025: USD 7.10 billion → 2035: USD 15.89 billion
- 2.6 Historical and Forecast Reference Periods
- 2.6.1 Historical Period: 2018-2025
- 2.6.2 Base Year: 2025
- 2.6.3 Forecast Period: 2025-2035
- 2.7 Research Assumptions and Limitations
Chapter 3 Executive Summary
- 3.1 Market Snapshot and Key Findings
- 3.2 Base-Year Market Size, 2025
- 3.3 Forecast Market Size, 2035
- 3.4 Revenue and Volume Growth Outlook
- 3.5 Key Demand and Supply Indicators
- 3.6 Leading Market Segments
- 3.7 Fastest-Growing Market Opportunities
- 3.8 Regional Performance Highlights
- 3.9 Technology and Industry Transformation
- 3.10 Competitive Landscape Summary
- 3.11 Analyst View and Strategic Implications
Chapter 4 Asia Pacific Motherboard Market Trends and Developments
- 4.1 Historical Industry Development, 2018-2025
- 4.2 Recent Market Trends and Developments
- 4.3 Demand and Customer Behavior Trends
- 4.4 Technology and Product Innovation
- 4.5 Artificial Intelligence, Automation and Digitalization
- 4.6 Local Manufacturing and Supply Chain Realignment
- 4.7 Industry Partnerships, Mergers and Acquisitions
- 4.8 Sustainability and Circular Economy Developments
- 4.9 Government and Private Sector Investment Trends
- 4.10 Emerging Business Models and Commercialization
- 4.11 Industry Developments and Announcements
Chapter 5 Asia Pacific Motherboard Market Production, Supply and Demand Analysis
- 5.1 Demand Trend and Consumption Analysis, 2018-2025
- 5.2 Demand Forecast, 2025-2035
- 5.3 Production and Output Trend, 2018-2025
- 5.4 Production and Output Forecast, 2025-2035
- 5.5 Installed Capacity and Capacity Utilization
- 5.6 Company-Wise Production Plants and Statistics
- 5.6.1 Installed Production Capacity
- 5.6.2 Actual Production
- 5.6.3 Planned Capacity and Expansion Targets
- 5.7 Supply Chain Structure and Procurement Trends
- 5.8 Supply-Demand Gap and Bottlenecks
- 5.9 Import Dependence and Sourcing Structure
- 5.10 Contract Manufacturing and Outsourcing
- 5.11 Regional Supply and Demand Concentration
Chapter 6 Asia Pacific Motherboard Market Pricing Analysis
- 6.1 Pricing Structure and Measurement
- 6.2 Historical Pricing Trends, 2018-2025
- 6.3 Pricing Outlook, 2025-2035
- 6.4 Average Selling Price and Unit Economics
- 6.5 Pricing by Product and Market Segment
- 6.6 Geographic Pricing Differences
- 6.7 Key Input, Energy, Labor and Logistics Costs
- 6.8 Contract Pricing and Purchasing Models
- 6.9 Pricing Sensitivity and Competitive Positioning
- 6.10 Price, Margin and Profitability Implications
Chapter 7 Asia Pacific Motherboard Market Dynamics
- 7.1 Market Growth Drivers
- 7.1.1 Demand-Side Drivers
- 7.1.2 Technology and Innovation Drivers
- 7.1.3 Infrastructure and Investment Drivers
- 7.1.4 Regulatory and Policy Drivers
- 7.2 Market Restraints
- 7.2.1 Cost and Affordability Constraints
- 7.2.2 Technology and Adoption Barriers
- 7.2.3 Supply Chain and Operational Constraints
- 7.3 Market Challenges
- 7.3.1 Competitive Pressure and Margin Erosion
- 7.3.2 Skills, Infrastructure and Implementation Gaps
- 7.4 Emerging Market Opportunities
- 7.5 Market Dynamics Impact and Time-Horizon Assessment
Chapter 8 Asia Pacific Motherboard Value Chain Analysis
- 8.1 Industry Value Chain Overview
- 8.2 Upstream Suppliers and Critical Inputs
- 8.3 Technology and Component Providers
- 8.4 Manufacturing or Service Delivery
- 8.5 Distribution, Channel Partners and Integrators
- 8.6 Downstream Applications and End Users
- 8.7 Value Addition and Profit Pools
- 8.8 Vertical Integration and Outsourcing
- 8.9 Supplier Concentration and Risk
- 8.10 Supply Chain Localization and Resilience
Chapter 9 Asia Pacific Motherboard Market Regulations and Policies
- 9.1 Relevant Laws, Standards and Compliance Frameworks
- 9.2 Product, Service, Safety and Quality Requirements
- 9.3 Government Policies, Incentives and Subsidies
- 9.4 Imports, Exports and Trade Barriers
- 9.5 Public Procurement and Local Content Requirements
- 9.6 Environmental and Sustainability Compliance
- 9.7 Upcoming Policy Changes and Market Implications
Chapter 10 Asia Pacific Motherboard Market Hotspots and Opportunities
- 10.1 Market Opportunity Mapping and Growth Hotspots
- 10.2 High-Growth Applications and Customer Groups
- 10.3 Underserved Markets and White-Space Opportunities
- 10.4 Emerging Technology and Product Opportunities
- 10.5 New Capacity and Investment Hotspots
- 10.6 Market Entry and Expansion Opportunities
- 10.7 Distribution and Partnership Opportunities
- 10.8 Near-Term and Long-Term Commercial Potential
- 10.9 Opportunity Attractiveness and Execution Risks
Chapter 11 Asia Pacific Motherboard Market Outlook, 2025-2035
- 11.1 Market Size and Analysis
- 11.1.1 Revenue (Market Measurement: 2025: USD 7.10 billion → 2035: USD 15.89 billion)
- 11.1.2 Market Volume and Quantity Sold
- 11.1.3 Historical Market Size, 2018-2025
- 11.1.4 Base-Year Market Size, 2025
- 11.2 Market Forecast, 2025-2035
- 11.2.1 Revenue Forecast to 2035
- 11.2.2 Volume Forecast to 2035
- 11.2.3 CAGR and Year-on-Year Growth
- 11.2.4 Incremental Revenue Opportunity
- 11.3 Forecast Assumptions and Scenario Analysis
- 11.3.1 Base-Case Forecast
- 11.3.2 Optimistic and Conservative Scenarios
- 11.3.3 Technology, Pricing and Policy Sensitivities
- 11.4 Market Attractiveness and Growth Outlook
Chapter 12 Asia Pacific Motherboard Market Segmentation and Outlook
- 12.1 Segmentation Summary and Market Shares, 2025
- 12.2 Largest and Fastest-Growing Segments
- 12.3 By Product Type - Market Size and Forecast, 2025-2035
- 12.3.1 Segment Definition and Scope
- 12.3.2 Historical Market Size, 2018-2025
- 12.3.3 Revenue Forecast, 2025-2035
- 12.3.4 Volume Forecast, 2025-2035
- 12.3.5 Base-Year Market Share, 2025
- 12.3.6 Segment CAGR and Growth Drivers
- 12.3.7 Subsegment Market Size and Forecast
- 12.3.7.1 Desktop PC Motherboards
- 12.3.7.2 Server Motherboards
- 12.3.7.3 Industrial and Embedded Motherboards
- 12.3.8 Subsegment Pricing and Adoption Trends
- 12.3.9 Leading Suppliers and Competition
- 12.3.10 Regional Demand and Opportunities
- 12.4 By Application - Market Size and Forecast, 2025-2035
- 12.4.1 Segment Definition and Scope
- 12.4.2 Historical Market Size, 2018-2025
- 12.4.3 Revenue Forecast, 2025-2035
- 12.4.4 Volume Forecast, 2025-2035
- 12.4.5 Base-Year Market Share, 2025
- 12.4.6 Segment CAGR and Growth Drivers
- 12.4.7 Subsegment Market Size and Forecast
- 12.4.7.1 Consumer and Gaming Computing
- 12.4.7.2 Commercial Desktop Computing
- 12.4.7.3 Data Centre and High-Performance Computing
- 12.4.7.4 Industrial Edge Computing
- 12.4.8 Subsegment Pricing and Adoption Trends
- 12.4.9 Leading Suppliers and Competition
- 12.4.10 Regional Demand and Opportunities
- 12.5 By Technology - Market Size and Forecast, 2025-2035
- 12.5.1 Segment Definition and Scope
- 12.5.2 Historical Market Size, 2018-2025
- 12.5.3 Revenue Forecast, 2025-2035
- 12.5.4 Volume Forecast, 2025-2035
- 12.5.5 Base-Year Market Share, 2025
- 12.5.6 Segment CAGR and Growth Drivers
- 12.5.7 Subsegment Market Size and Forecast
- 12.5.7.1 Intel-Compatible x86 Platforms
- 12.5.7.2 AMD-Compatible x86 Platforms
- 12.5.7.3 Non-x86 Platforms
- 12.5.8 Subsegment Pricing and Adoption Trends
- 12.5.9 Leading Suppliers and Competition
- 12.5.10 Regional Demand and Opportunities
- 12.6 By Country - Market Size and Forecast, 2025-2035
- 12.6.1 Segment Definition and Scope
- 12.6.2 Historical Market Size, 2018-2025
- 12.6.3 Revenue Forecast, 2025-2035
- 12.6.4 Volume Forecast, 2025-2035
- 12.6.5 Base-Year Market Share, 2025
- 12.6.6 Segment CAGR and Growth Drivers
- 12.6.7 Subsegment Market Size and Forecast
- 12.6.7.1 Mainland China
- 12.6.7.2 Northeast Asia
- 12.6.7.3 South and Southeast Asia
- 12.6.7.4 Oceania
- 12.6.8 Subsegment Pricing and Adoption Trends
- 12.6.9 Leading Suppliers and Competition
- 12.6.10 Regional Demand and Opportunities
- 12.7 Segment Growth Comparison
- 12.8 Segment Attractiveness and Priority Matrix
Chapter 13 Asia Pacific Motherboard End-Use and Application Market Outlook
- 13.1 End-Use Industry and Customer Demand Structure
- 13.2 Leading Applications and Customer Groups
- 13.3 End-Use Market Size, Share and Forecast
- 13.4 Major End-Use Industry Deep Dives
- 13.4.1 Customer Requirements and Use Cases
- 13.4.2 Demand and Replacement Cycles
- 13.4.3 Technical and Regulatory Considerations
- 13.4.4 Purchasing and Procurement Models
- 13.4.5 Leading Vendors and Distribution Channels
- 13.4.6 Forecast and Commercial Opportunities
- 13.5 Emerging Applications and Cross-Segment Demand
- 13.6 End-Use Industry Investment Priorities
Chapter 14 Asia Pacific Motherboard Geographic Market Outlook, 2025-2035
- 14.1 Regional Market Size and Country-Level Shares, 2025
- 14.2 Country Market Size Comparison, 2025
- 14.3 Country Market Forecasts, 2025-2035
- 14.4 Subregional Industrial and Demand Clusters
- 14.5 Intra-Regional Pricing and Cost Differences
- 14.6 Cross-Border Trade and Supply Networks
- 14.7 Regional Supply and Demand Balances
- 14.8 Country Opportunity Comparison and Prioritization
Note: Every listed country is covered on the structure shown under the first country.
Chapter 15 Asia Pacific Motherboard Technology, Innovation and Sustainability Outlook
- 15.1 Technology Landscape and Maturity
- 15.2 Product, Process and Service Innovation
- 15.3 AI, Automation and Digital Tools in the Industry
- 15.4 Technology Adoption and Performance Benchmarking
- 15.5 Innovation Pipeline and R&D Investment
- 15.6 Patent and Intellectual Property Trends
- 15.7 Energy Efficiency and Resource Management
- 15.8 Sustainability, Recycling and Circularity
- 15.9 Technology Roadmap, 2025-2035
- 15.10 Risks of Obsolescence and Technology Substitution
Chapter 16 Asia Pacific Motherboard Market Key Strategic Imperatives
- 16.1 Growth and Market Entry Priorities
- 16.2 High-Return Products and Segments
- 16.3 Pricing, Profitability and Cost Optimization
- 16.4 Technology Investment and Product Differentiation
- 16.5 Supply Chain Localization and Resilience
- 16.6 Distribution and Customer Acquisition
- 16.7 Partnership, Acquisition and Capacity Strategy
- 16.8 Regional Expansion Priorities
- 16.9 Short-, Medium- and Long-Term Actions
Chapter 17 Competition Outlook
- 17.1 Industry Competition Characteristics
- 17.2 Market Structure and Concentration
- 17.3 Market Share and Competitive Positioning, 2025
- 17.4 Company-Wise Revenue and Product Benchmarking
- 17.5 Production and Service Capacity Benchmarking
- 17.6 Technology, Pricing and Differentiation
- 17.7 Regional Footprint and Distribution Strength
- 17.8 Mergers, Acquisitions and Strategic Alliances
- 17.9 New Entrants and Competitive Threats
- 17.10 Porter's Five Forces and Industry Attractiveness
- 17.11 Competitive Outlook, 2025-2035
Chapter 18 Company Profiles
- 18.1 Company Coverage and Selection Criteria
- 18.2 ASUSTeK Computer Inc.
- 18.2.1 Business Description
- 18.2.2 Company Ownership and Geographic Presence
- 18.2.3 Product and Service Portfolio
- 18.2.4 Manufacturing and Operating Footprint
- 18.2.5 Production Capacity and Expansion Plans
- 18.2.6 Financial Performance and Investment
- 18.2.7 Market Share and Competitive Position
- 18.2.8 Technology and Innovation Capabilities
- 18.2.9 Strategic Alliances or Partnerships
- 18.2.10 Recent Developments
- 18.2.11 Growth Strategy and Outlook
- 18.3 Gigabyte Technology Co., Ltd.
- 18.4 Micro-Star International Co., Ltd.
- 18.5 Colorful Group
- 18.6 Advantech Co., Ltd.
- 18.7 Super Micro Computer, Inc.
- 18.8 ASRock Inc.
- 18.9 MAXSUN
- 18.10 Biostar Microtech International Corp.
- 18.11 Elitegroup Computer Systems Co., Ltd.
- 18.12 Other Relevant Market Participants
Note: Every listed company is profiled on the structure shown under the first company. The company list is preliminary and may change based on research findings, market developments, data availability and client requirements.
Chapter 19 Disclaimer
- 19.1 Research and Forecast Disclaimer
- 19.2 Data Source and Estimation Limitations
Note: The depth of individual sections depends on data availability for this market. Volume, capacity, trade and other unit-based metrics are included where applicable.

