
Grid upgrades and rooftop batteries raise protection demand
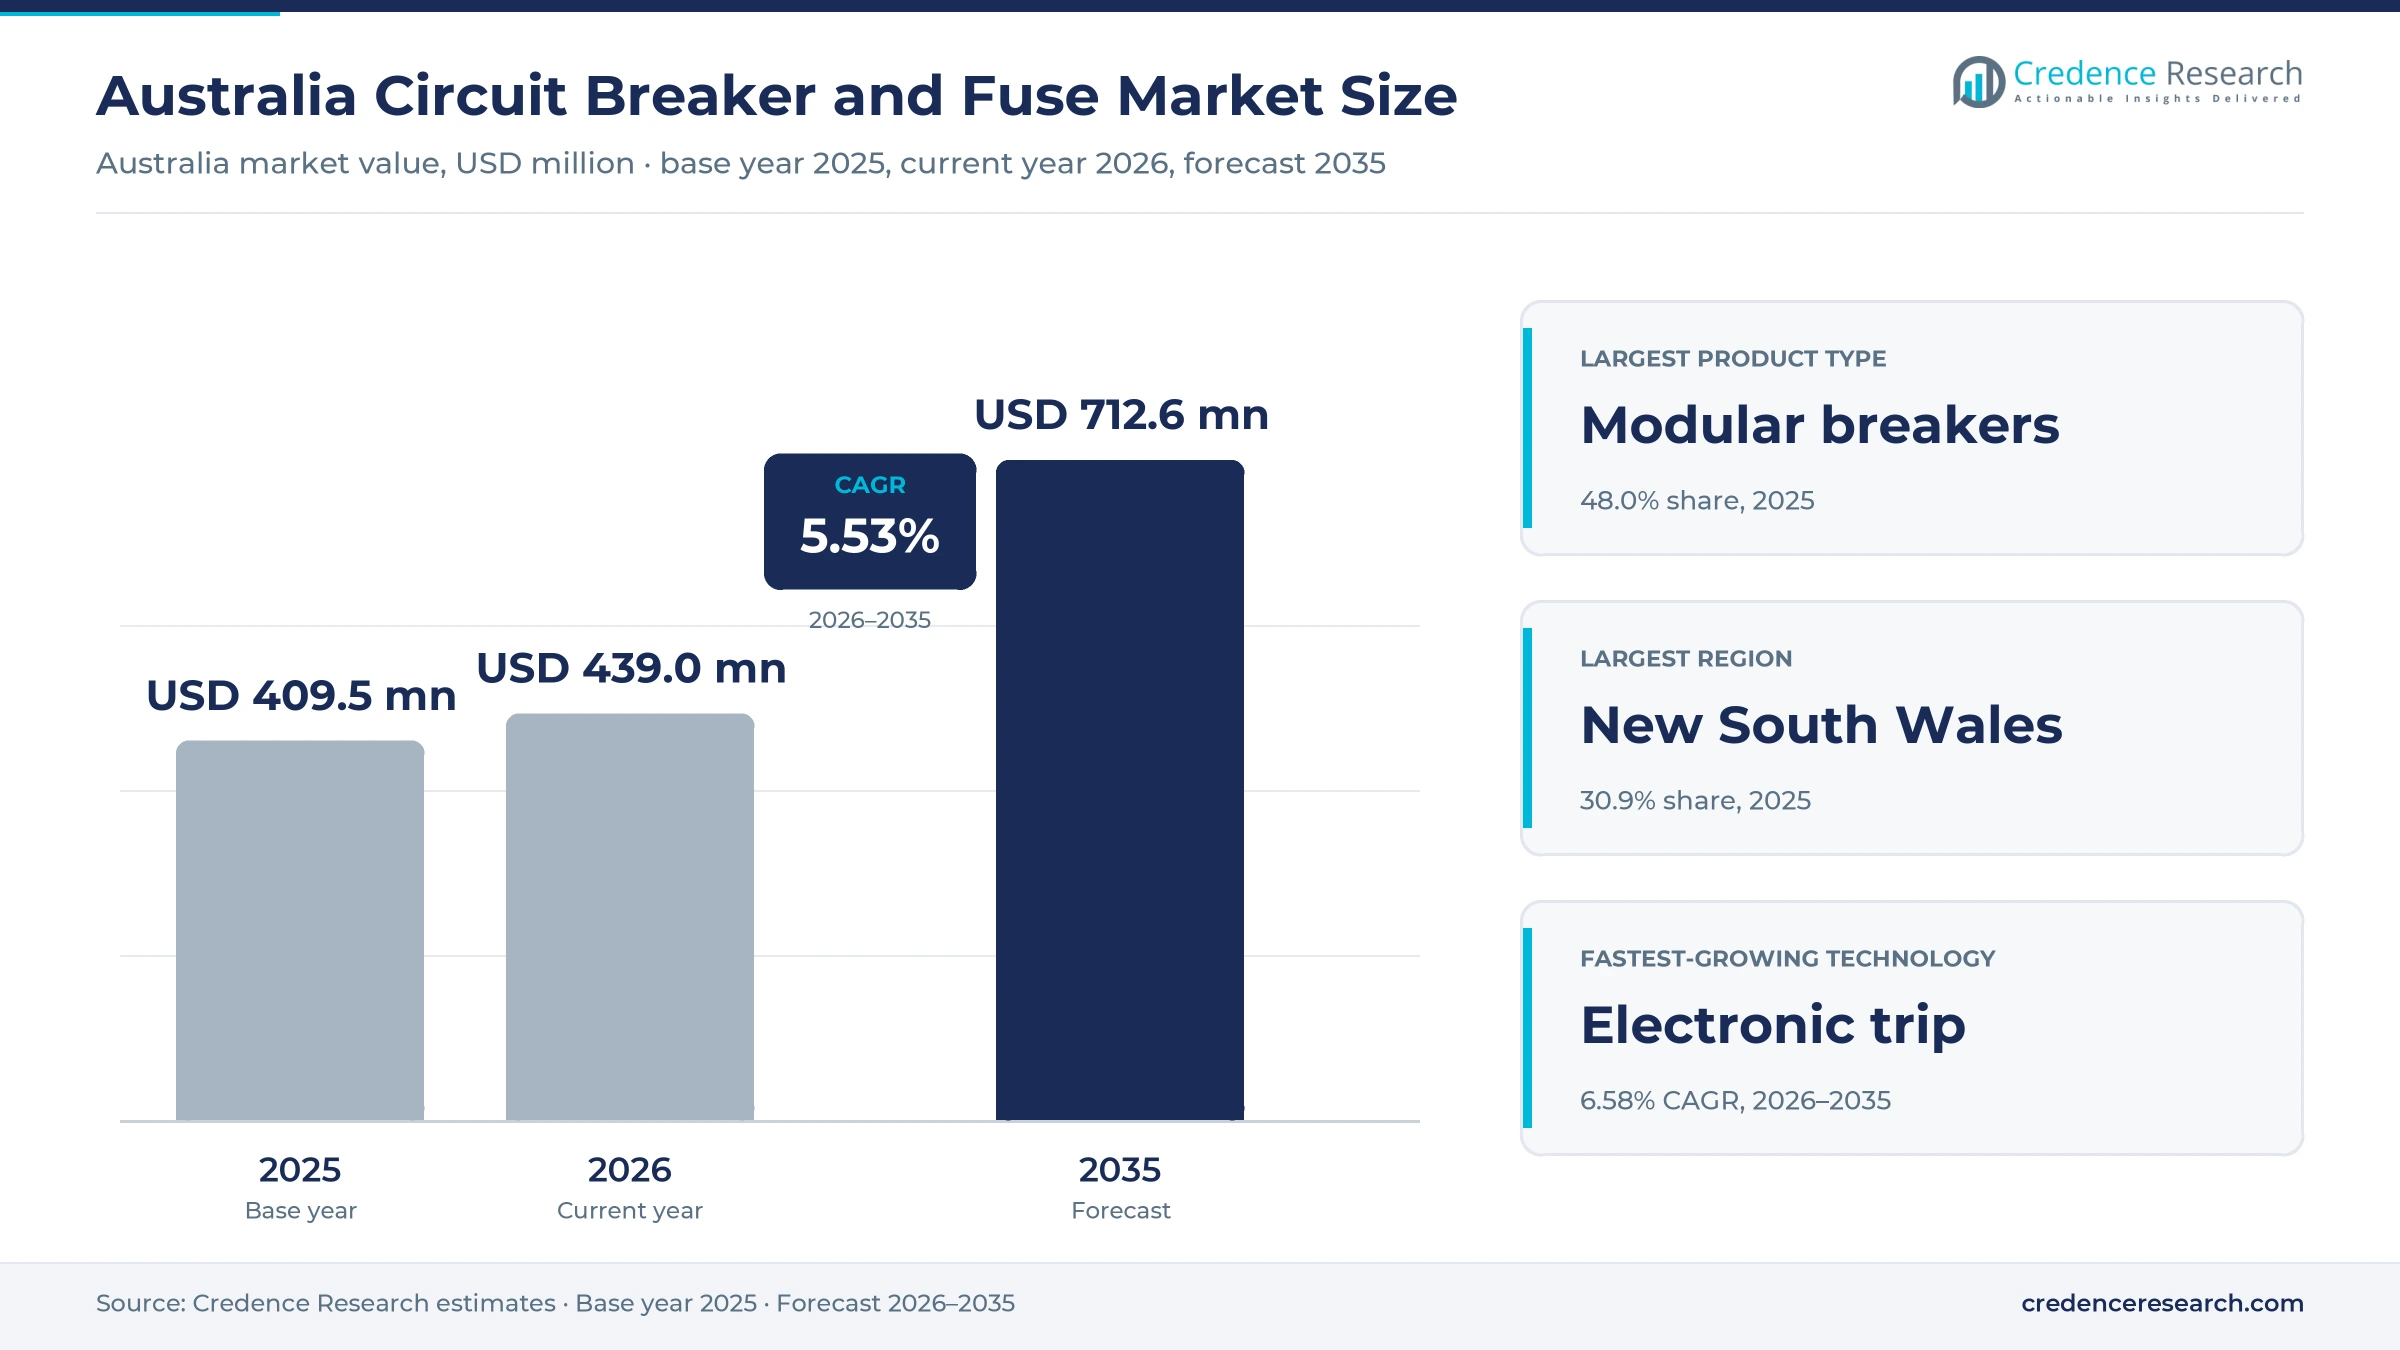
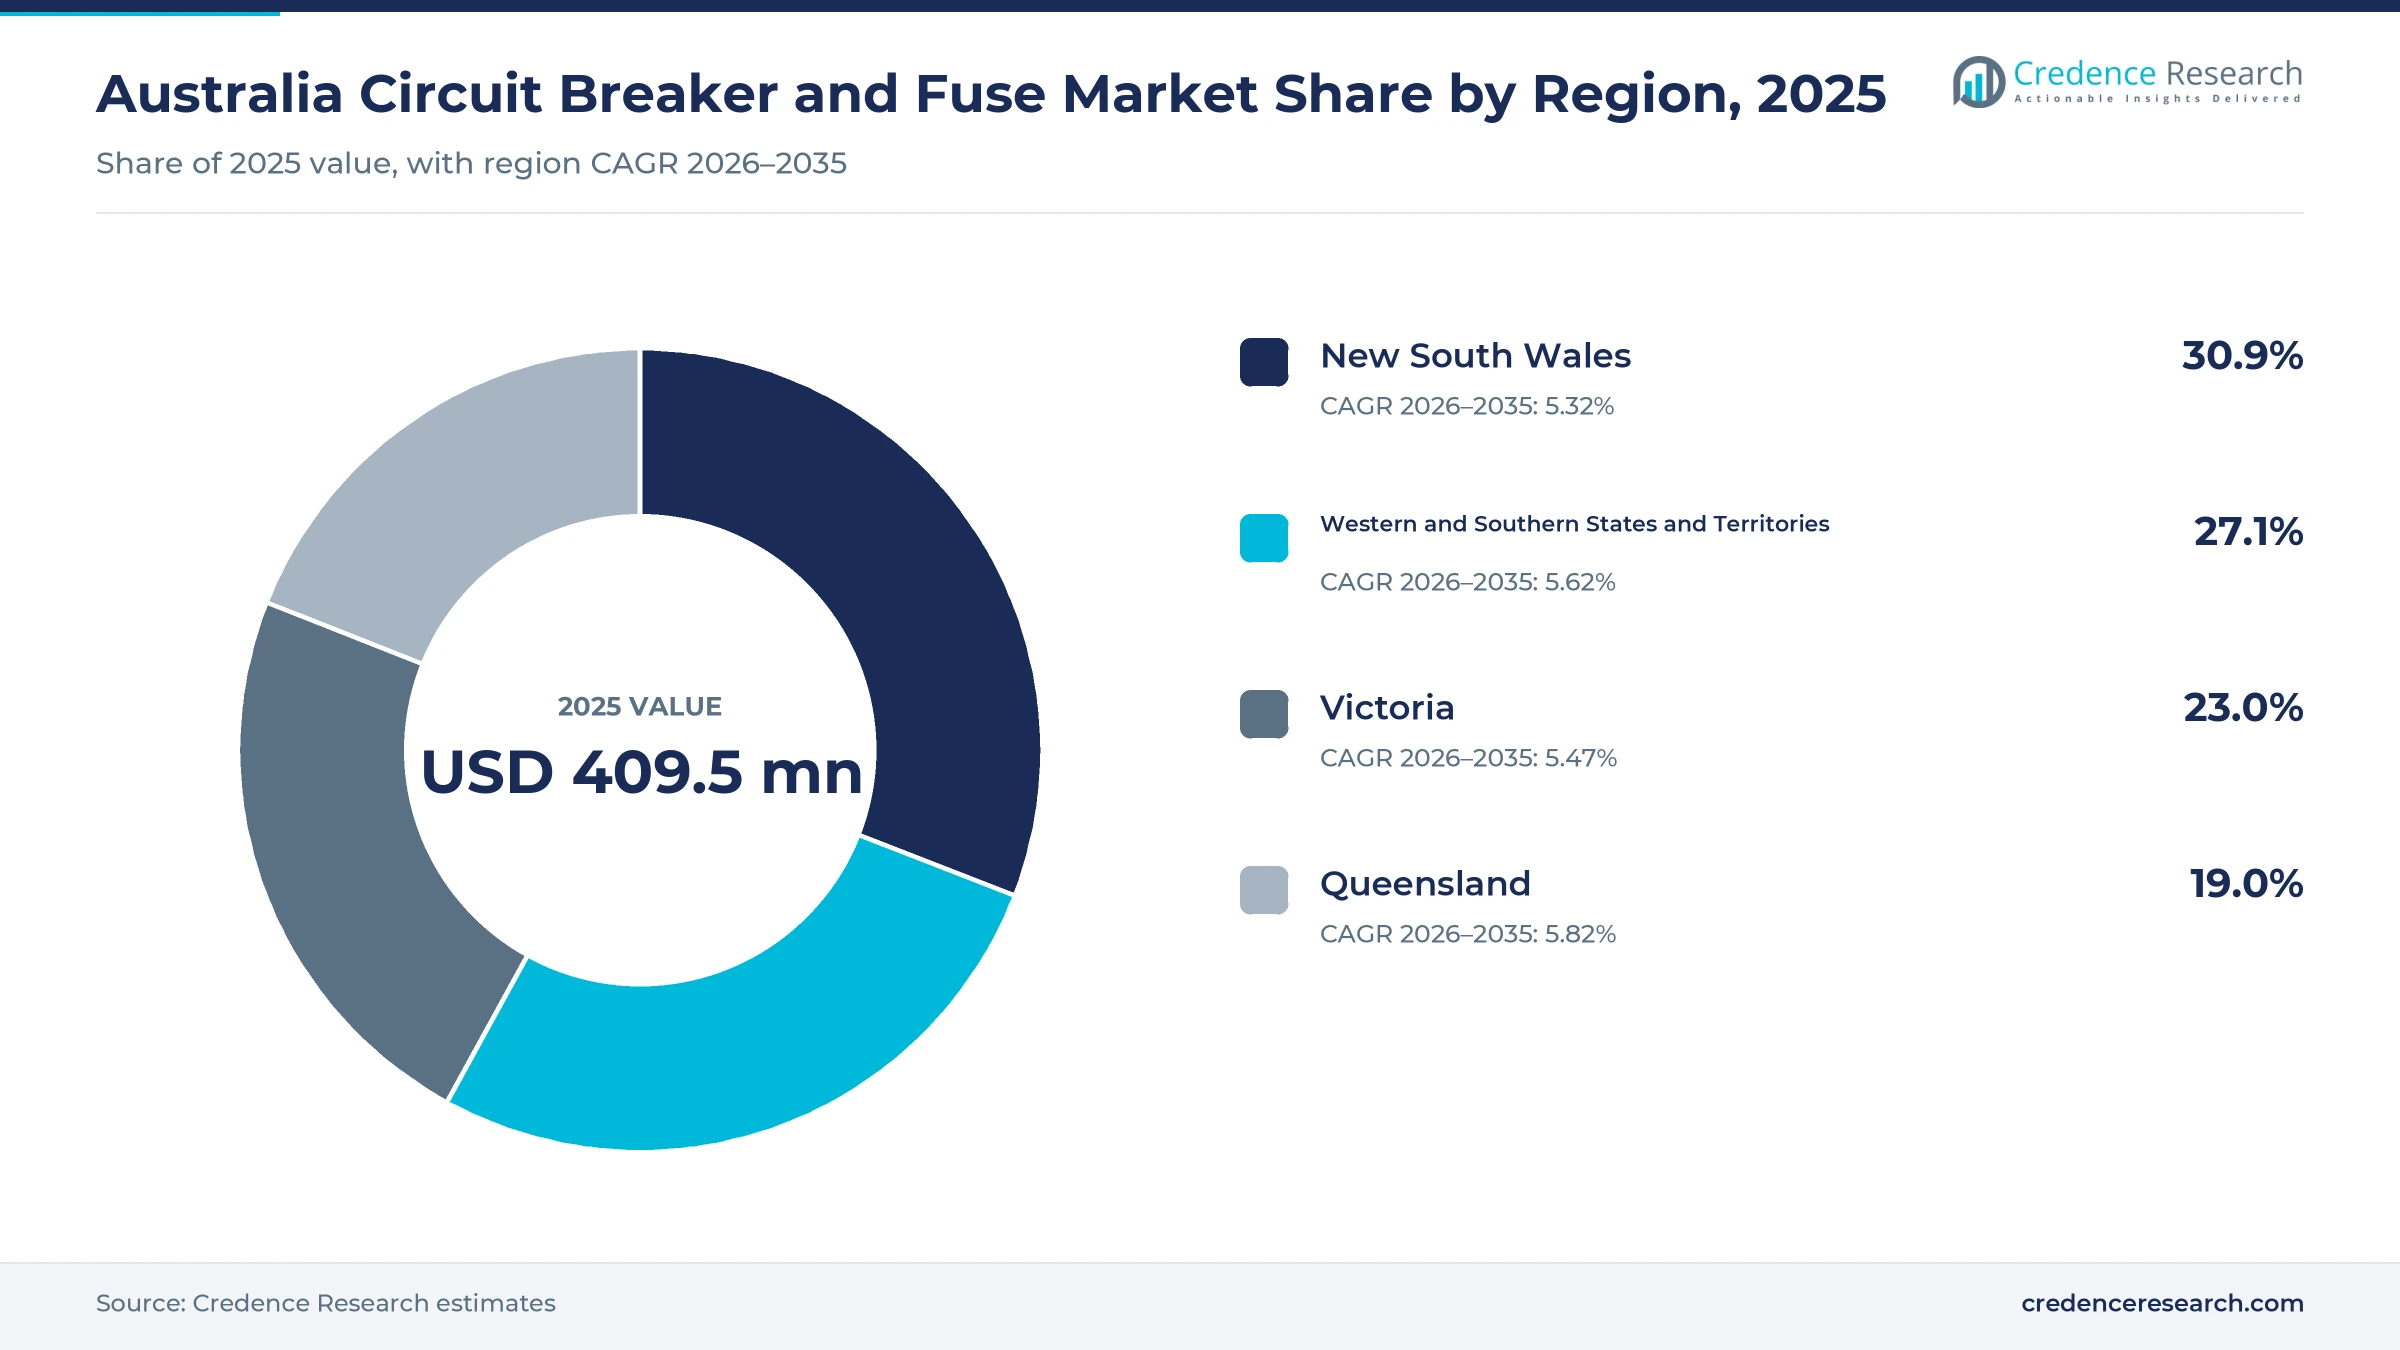
The Australia circuit breaker and fuse market was valued at USD 409.5 million in 2025 and is projected to increase from USD 439.0 million in 2026 to USD 712.6 million by 2035, registering a CAGR of 5.53% during 2026–2035. Demand comes from electricians, switchboard builders, utilities and project contractors that install modular breakers, power breakers and fuses in homes, buildings, plants and networks. New South Wales held the largest regional share, 30.9% in 2025, because it has the largest population and building stock in the country. Queensland is the fastest-growing region at 5.82% a year, as rooftop solar replacements and home batteries spread across the state. However, a federal home battery rebate has pushed installations past half a million since July 2025, which is changing the protection content of each residential switchboard.
Which protection devices and end uses does the estimate cover?
The estimate measures the value of modular circuit breakers, power circuit breakers and fuses sold in Australia for low-voltage, medium-voltage and high-voltage protection. It counts thermal-magnetic, electronic trip, residual-current-only and fusible devices bought for new installations, retrofits and maintenance work.
The estimate excludes complete switchboards, enclosures, cables, relays sold on their own and installation labor. The value chain runs from global and regional manufacturers through electrical wholesalers, specialist distributors and direct project teams to electricians, panel builders, utilities and facility owners.
Australia Circuit Breaker and Fuse Market Insights
- The Australia circuit breaker and fuse market was valued at USD 409.5 million in 2025 and is projected to reach USD 712.6 million by 2035, registering a CAGR of 5.53% during 2026–2035.
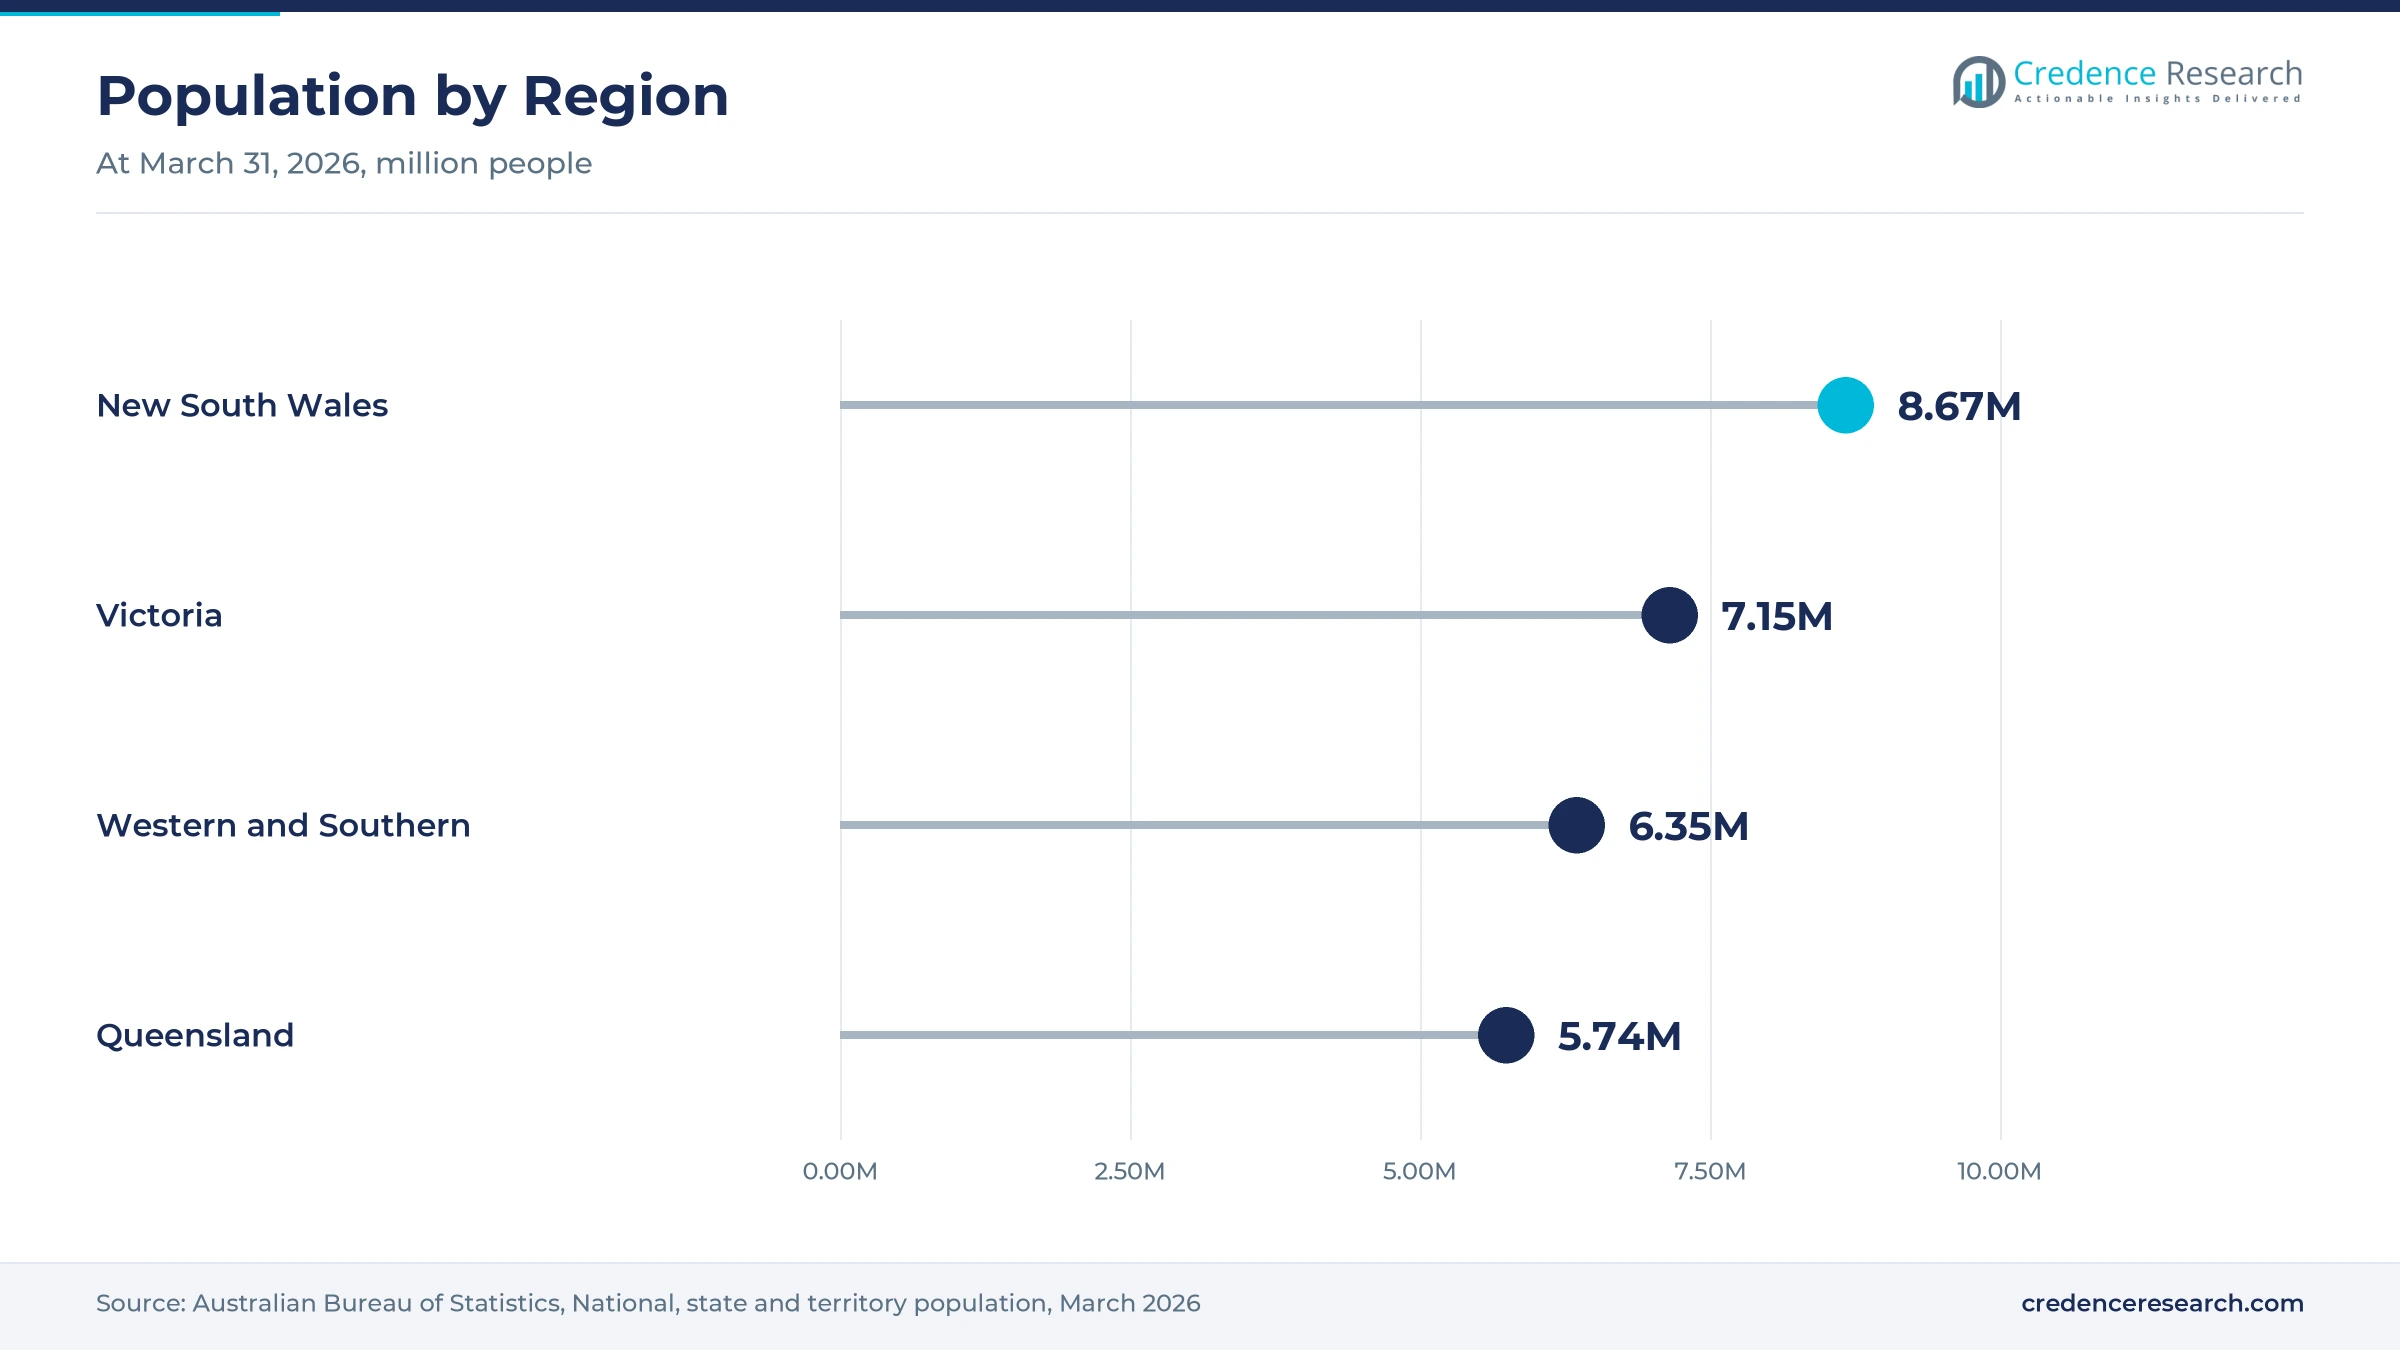
- New South Wales held a 30.9% share of 2025 value, because the state had 8.67 million residents at March 31, 2026, the most of any state.
- Modular circuit breakers led with a 48.0% share of 2025 value, because every home and small building switchboard uses them for final subcircuit protection.
- Australia installed 791 MW of rooftop solar across 77,000 systems in the first quarter of 2026, up 21% in capacity on a year earlier.
- Electronic trip protection grows fastest at 6.58% a year during 2026–2035, as data centers, mines and grid assets need adjustable and monitored protection.
Modular devices lead while power units grow fastest
Why do modular circuit breakers hold the largest value?
Based on product type, the market is categorized into modular circuit breakers, power circuit breakers and fuses. Modular Circuit Breakers led with a 48.0% share of 2025 value, because every home and small building switchboard uses them for final subcircuit protection. Power Circuit Breakers grow fastest at 5.97% a year, as data centers, mines and grid projects buy larger frames.
How does residential demand anchor end-use value?
Based on end-use industry, the market is categorized into residential, commercial buildings, industrial facilities and utility and infrastructure. Residential led with a 30.0% share of 2025 value, because new homes, solar and battery systems need several protective devices. Utility and Infrastructure grows fastest at 6.39% a year, as transmission and renewable connection work expands. Commercial buildings and industrial facilities add steady demand from fit-outs, plant upgrades and maintenance.
Why does thermal-magnetic protection still lead?
Based on technology, the market is categorized into thermal-magnetic protection, electronic trip protection, residual-current-only protection and fusible protection. Thermal-Magnetic Protection led with a 46.0% share of 2025 value, because it is the standard trip method in miniature and molded case breakers. Electronic Trip Protection grows fastest at 6.58% a year, as large sites want adjustable settings and monitoring.
Which sales channels move the most protection devices?
Based on sales channel, the market is categorized into electrical wholesalers, direct project sales and specialist distributors. Electrical Wholesalers led with a 55.0% share of 2025 value, because most electricians buy devices from local trade counters. Direct Project Sales grows fastest at 5.86% a year, as utilities, data center builders and mines buy protection in large project packages.
| Segment Group | Leading Sub-segment | Share, 2025 | Fastest-growing Sub-segment | CAGR, 2026–2035 |
|---|---|---|---|---|
| By Product Type | Modular Circuit Breakers | 48.0% | Power Circuit Breakers | 5.97% |
| By End-Use Industry | Residential | 30.0% | Utility and Infrastructure | 6.39% |
| By Technology | Thermal-Magnetic Protection | 46.0% | Electronic Trip Protection | 6.58% |
| By Sales Channel | Electrical Wholesalers | 55.0% | Direct Project Sales | 5.86% |
Request a Free Sample
Fill in your details and we'll send you a free sample report.
- Sample data tables & charts
- Research methodology
Transmission, solar storage and safety rules lift demand
How do grid reinforcement and renewable connections lift demand?
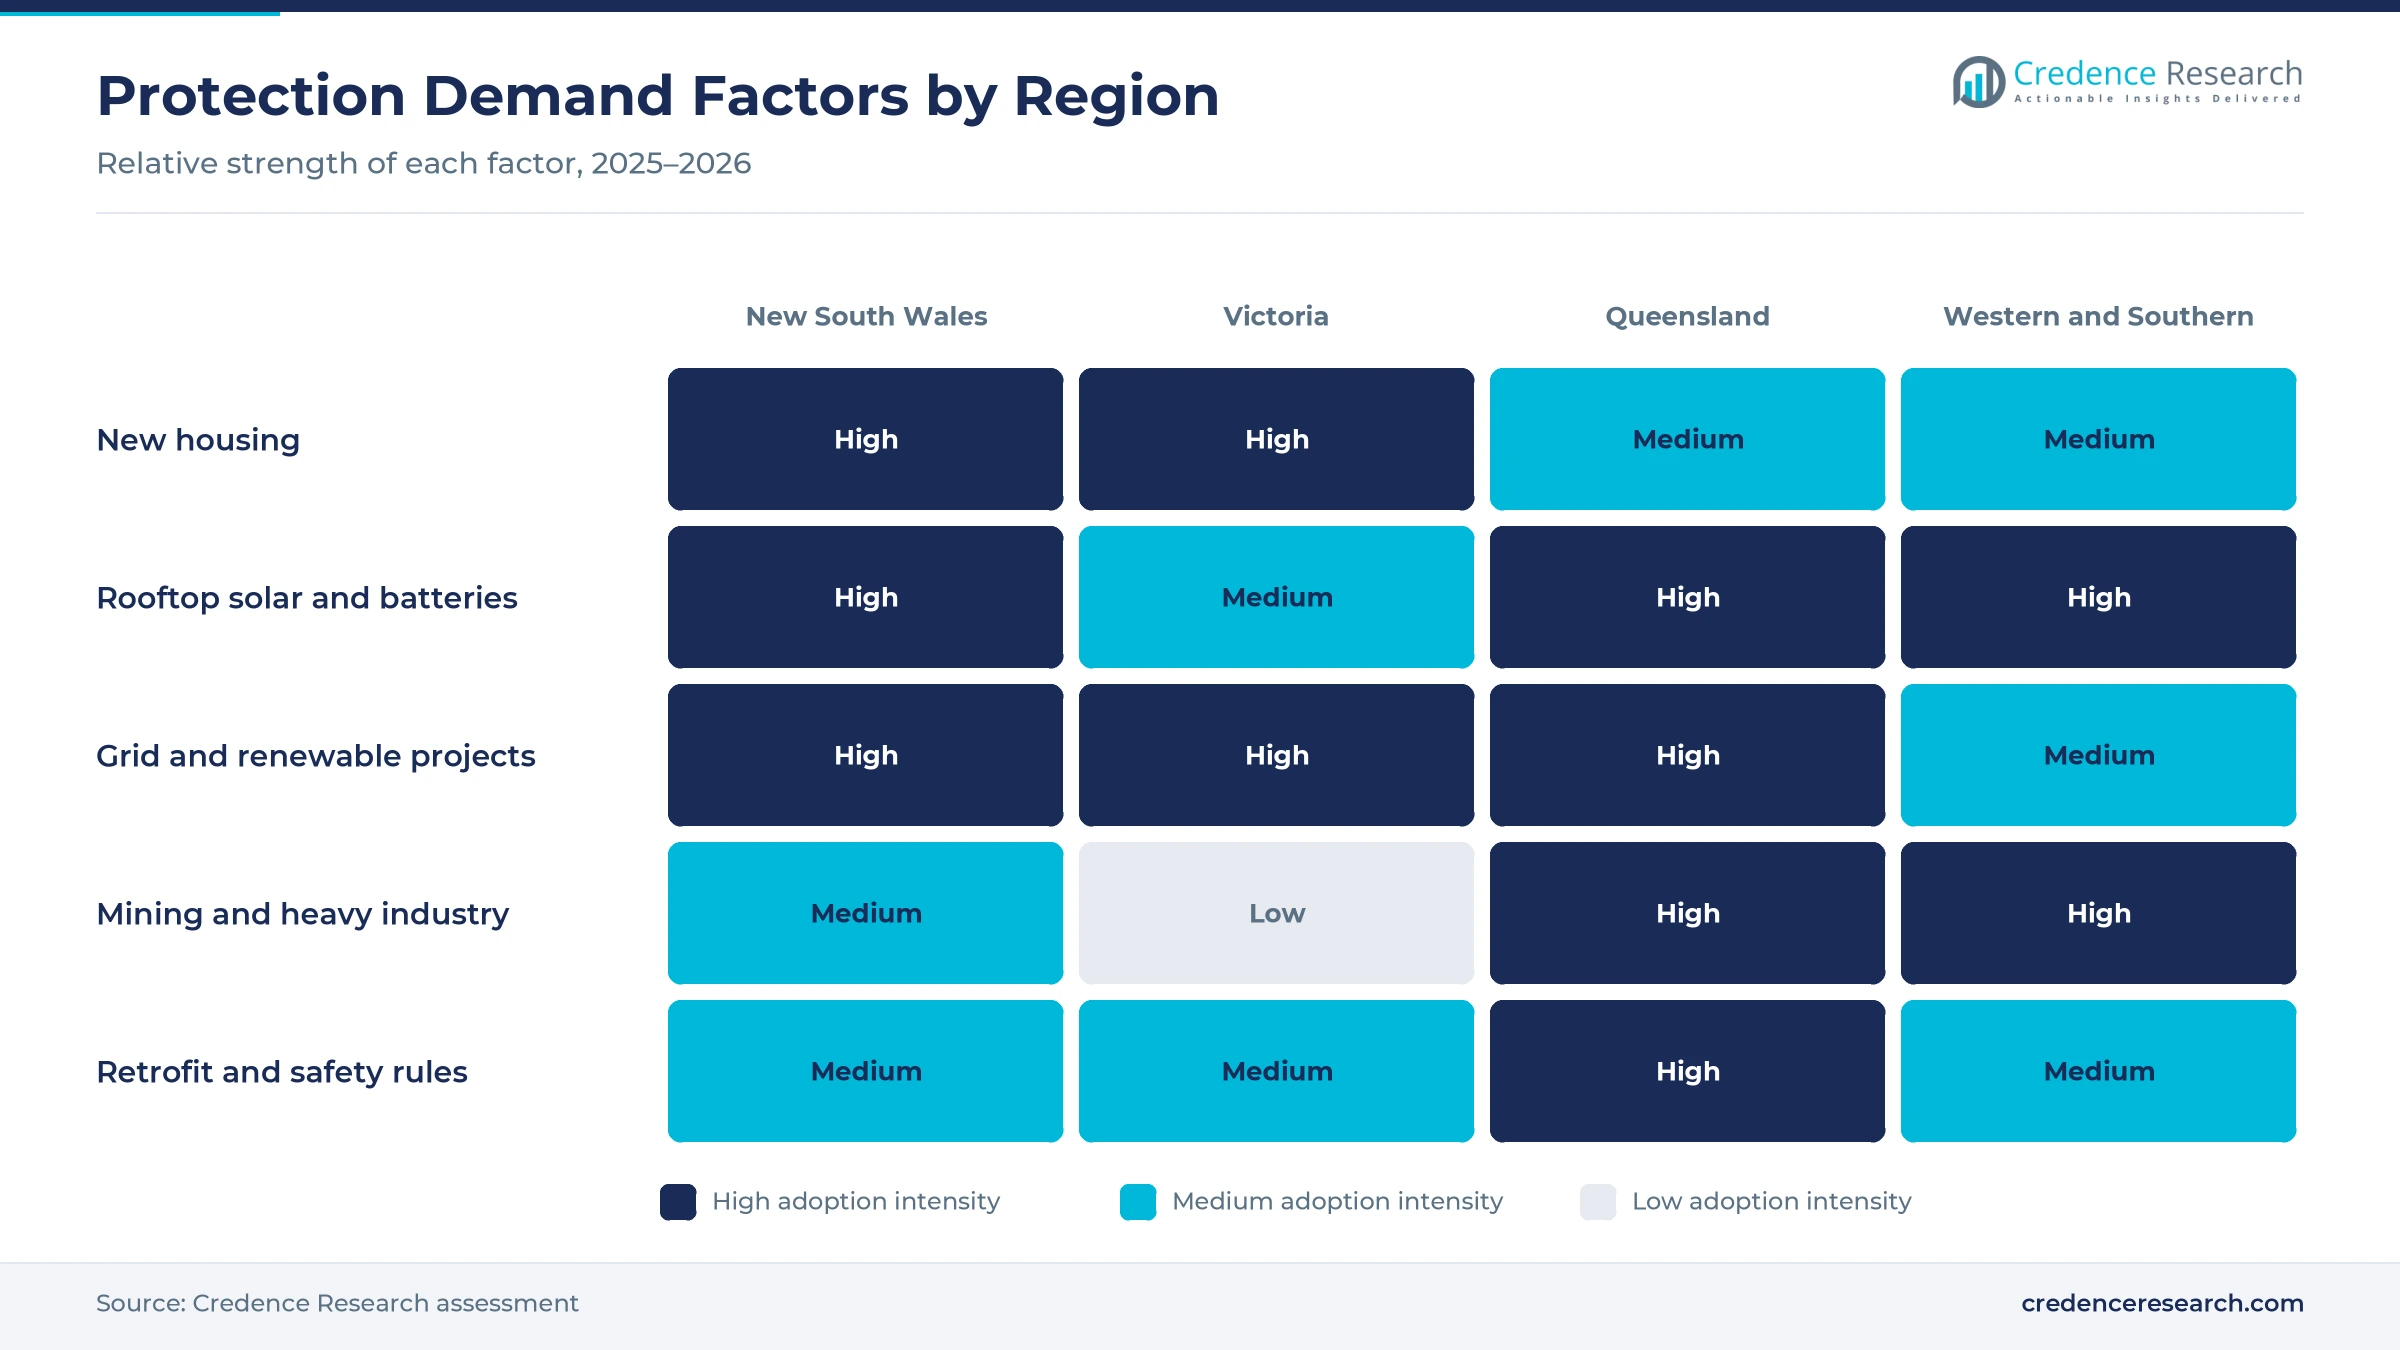
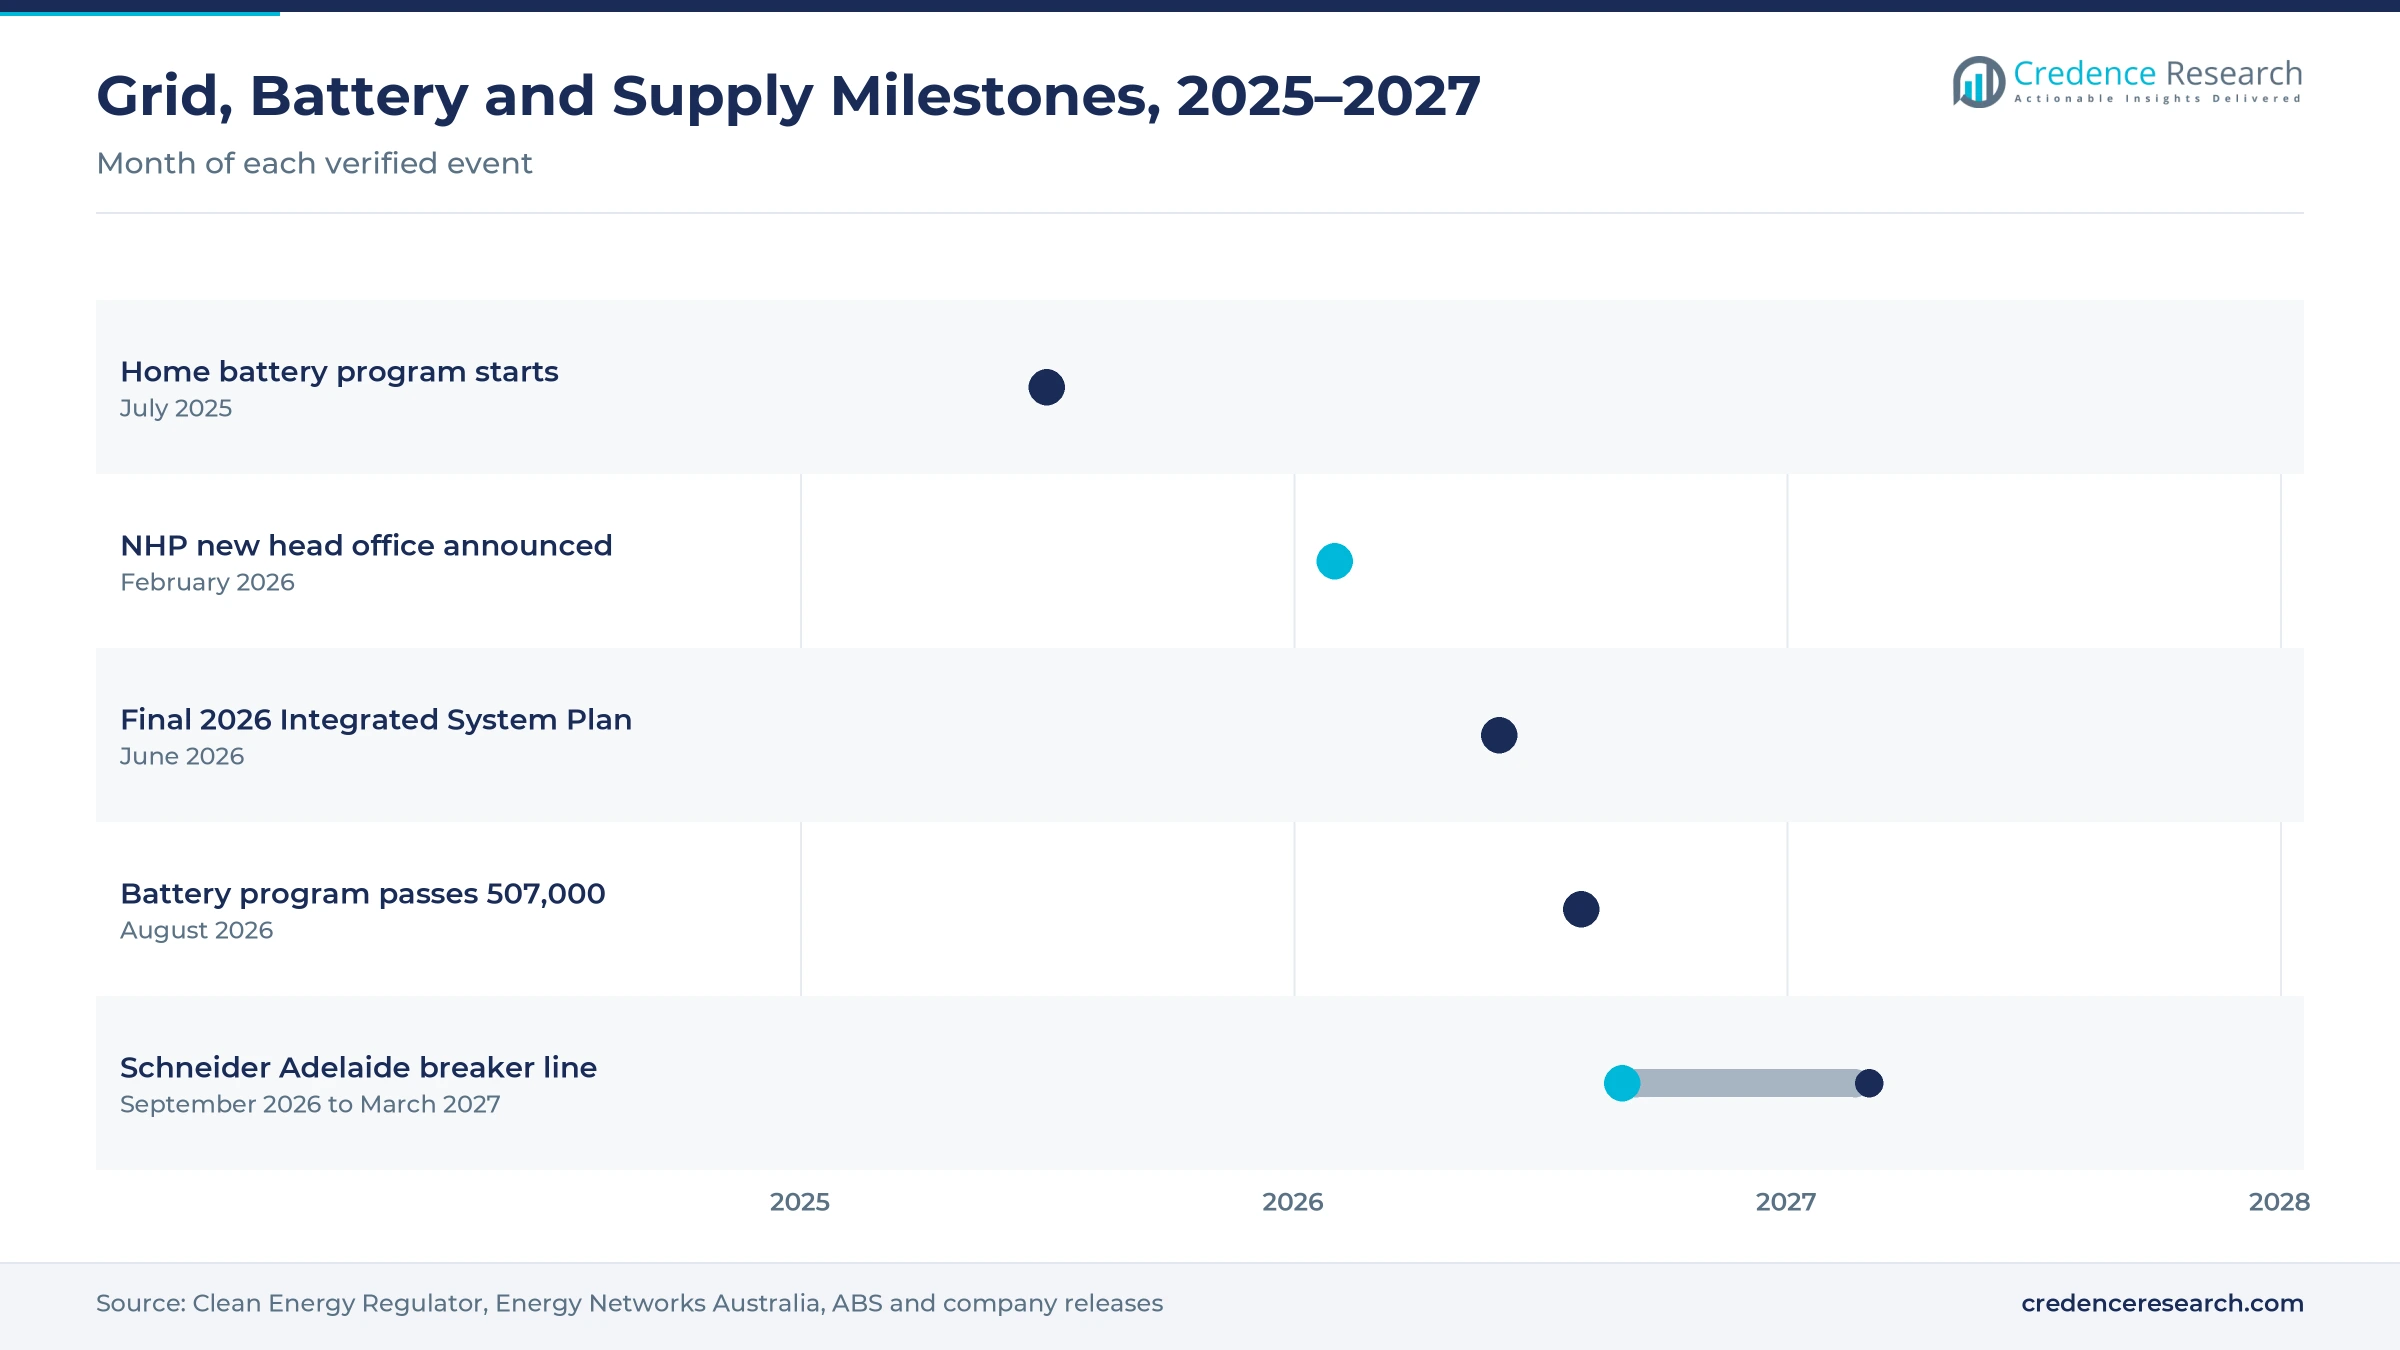
Grid reinforcement and renewable connections lift demand, because every new line, substation and solar or wind farm needs breakers and fuses to isolate faults quickly and safely. Renewables supplied 34% of Australian electricity in 2023, or 92,216 GWh of 274,475 GWh, according to IRENA. Solar capacity grew 16.9% and wind capacity grew 18.4% between 2023 and 2024. The final 2026 Integrated System Plan points to about 6,000 km of new transmission, which would extend the existing network by about 14%. As a result, utility and infrastructure grows fastest at 6.39% a year, because new switchgear bays carry power breakers and high-voltage fuses.
Why does distributed solar and storage integration add devices?
Distributed solar and storage integration adds devices, because each rooftop system and home battery needs its own protected circuits at the switchboard. Australia installed 791 MW of rooftop solar across 77,000 systems in the first quarter of 2026, up 21% in capacity, according to the Clean Energy Regulator. The average system size reached 10.3 kW, and 71% of solar systems were installed with a battery. The federal home battery program also passed 507,000 installations by August 2026 after starting in July 2025. In turn, residential users hold 30.0% of 2025 value, because energy storage systems add breakers to existing boards.
How do industrial continuity needs drive protection upgrades?
Industrial continuity needs drive protection upgrades, because a single fault can stop a mine, plant or data hall and cost far more than the protective device. Schneider Electric is investing $2.5 million in a smart circuit breaker line at its Adelaide site, according to Australian Manufacturing. The line will build ComPacT NS and MasterPacT MTZ breakers used in data centers and mining. It is expected to double air and molded case breaker production for the Pacific region from the first quarter of 2027. The value of total building work done also rose 1.1% to $45.8 billion in the June 2026 quarter. As a result, power circuit breakers grow fastest at 5.97% a year during 2026–2035.
Why do wiring rules and safety switch laws raise device counts?
Wiring rules and safety switch laws raise device counts, because they require residual current protection on more circuits in every home. The national wiring rules require 30 mA RCDs on all final subcircuits in new homes, with at least two devices and no more than three circuits on each, according to Hager. Since May 1, 2023, regulators have advised that only Type A, Type B and Type F devices should be used. Queensland rental owners must also fit safety switches on general power circuits within 90 days of a tenancy, with fines of up to $1,500. In turn, modular circuit breakers hold 48.0% of 2025 value, because combined breaker and RCD units fill most new boards.
Per-circuit protection and bigger home systems take hold
How is the shift to per-circuit protection changing switchboards?
The shift to per-circuit protection is changing switchboards, because installers now fit one combined breaker and RCD to each circuit instead of sharing devices. Wiring rule guidance recommends a separate RCBO for each final subcircuit, so one fault does not cut power to several rooms. Older Type AC devices are being replaced by Type A units under regulator advice issued in 2023. NHP added the MOD6+ Lightning Loadcentre to its residential range on Sept. 1, 2026, offering more space for modular devices. The same rules already require 30 mA protection on every final subcircuit and no more than three circuits per RCD. As a result, thermal-magnetic protection keeps 46.0% of 2025 value, because most combined units still trip on thermal and magnetic elements.
Why is the rise of larger home energy systems notable?
The rise of larger home energy systems is notable, because bigger batteries and solar arrays need higher-rated protection and more circuits. Average usable battery capacity reached 30.6 kWh in the first quarter of 2026, up from 19.7 kWh in the third quarter of 2025. Replacements made up 27% of solar installations in that quarter, up from 19% a year earlier, and Queensland reached 40%. Validated and pending home battery capacity also reached 11.4 GWh across more than 400,000 installations by mid-May 2026. In turn, retrofit purchasers become a larger part of residential demand, because every battery upgrade adds new protection to an older switchboard.
Can electronic trip units for critical sites open new demand?
Electronic trip units for critical sites can open new demand, because data centers, mines and hospitals want adjustable settings, metering and remote alarms. The Adelaide line planned by Schneider Electric will make air and molded case breakers with these features for the Pacific region. The site already employs more than 400 people, and the expansion is expected to add more than 25 jobs. The line is about 21 meters long and is due to start production in the first quarter of 2027. As a result, electronic trip protection grows fastest at 6.58% a year during 2026–2035, because critical sites pay more for monitored protection.
Is there room to grow in the new housing pipeline?
The new housing pipeline offers room to grow, because every new dwelling needs a fully protected switchboard with RCD protection under current wiring rules. Australian dwelling commencements rose 7.0% to 52,201 in the June 2026 quarter in seasonally adjusted terms, according to national building statistics. New private house commencements rose 11.6% to 31,707 in the same quarter. Completions reached 47,168, up 15.9% on a year earlier, which lifts near-term demand for boards, electrical conduits and protection devices. In turn, electrical wholesalers hold 55.0% of 2025 value, because residential electricians buy most devices over the trade counter close to each building site.
Imports, price pressure and skills gaps squeeze suppliers
How do noncompliant imports expose buyers to risk?
Noncompliant imports expose buyers to risk, because cheap devices sold online may not meet Australian standards for breaking capacity or trip behavior. As a result, faulty units can fail to clear faults and damage switchboards or cause fires. Regulators respond with equipment registration, recalls and audits, while reputable brands promote traceable supply. This risk stays high while some buyers choose devices on price alone.
Why does price pressure squeeze device margins?
Price pressure squeezes device margins, because miniature breakers and fuses are high-volume products that wholesalers and builders buy on tight price lists. In turn, suppliers struggle to pass on higher copper, silver and freight costs to customers. Manufacturers respond with premium combined units, monitoring features and bundled switchboard ranges, which lift value per board. This pressure favors suppliers with broad ranges and local stock.
How do electrician shortages slow installation work?
Electrician shortages slow installation work, because solar, battery, housing and grid projects all compete for the same licensed workers. As a result, retrofit jobs and switchboard upgrades can wait weeks in busy regions, which delays device sales. Suppliers respond with training, prewired boards and simpler mounting systems, which cut time on site. This constraint remains strongest in fast-growing suburbs and regional areas.
Why does a long-lived installed base slow replacement?
A long-lived installed base slows replacement, because breakers and fuses in older buildings can stay in service for decades without failing. In turn, many owners only upgrade protection when they add solar, batteries or new circuits. Suppliers respond with retrofit kits and safety campaigns that explain the value of modern RCDs and arc protection. This pattern makes new installations and retrofits the main sources of growth.
Sydney leads while Queensland grows fastest
| Region | Value, 2025 (USD million) | Share, 2025 | CAGR, 2026–2035 |
|---|---|---|---|
| New South Wales | 126.5 | 30.9% | 5.32% |
| Western and Southern States and Territories | 111.0 | 27.1% | 5.62% |
| Victoria | 94.2 | 23.0% | 5.47% |
| Queensland | 77.8 | 19.0% | 5.82% |
Why does new South Wales hold the top share?
New South Wales held a 30.9% share of 2025 value and grows at 5.32% a year, because the state had 8.67 million residents at March 31, 2026, the most of any state. It completed 13,332 dwellings in the June 2026 quarter in seasonally adjusted terms. Several electorates in Sydney and the Hunter also recorded strong home battery uptake. As a result, this zone buys the largest volume of modular devices for homes and commercial buildings.
How does Victoria support protection device demand?
Victoria held a 23.0% share of 2025 value and grows at 5.47% a year, because the state added 109,500 residents in the year to March 2026. Victoria completed 14,191 dwellings in the June 2026 quarter, the most of any state. NHP, a major Australian distributor, also moved its head office to Hawthorn East in Melbourne in 2026. In turn, this zone combines strong housing demand with a large distribution base for switchboard builders.
Why is Queensland growing fastest?
Queensland held a 19.0% share of 2025 value and grows fastest at 5.82% a year, because 40% of its rooftop solar installations in the first quarter of 2026 were replacements. The state completed 9,549 dwellings in the June 2026 quarter. Queensland rental owners must also fit safety switches on general power circuits, which adds retrofit demand. As a result, this zone adds protection devices faster than the others.
What supports demand in the western and southern states?
The Western and Southern States and Territories held a 27.1% share of 2025 value and grow at 5.62% a year, because Western Australia grew fastest at 2.1% in the year to March 2026. Schneider Electric makes power breakers at Gepps Cross in Adelaide. South Australia also reached a 31% solar replacement rate in early 2026. In turn, mining, grid and rooftop work support demand across this zone.
Factory lines, battery milestones and grid plans
| Development | Status and market relevance |
|---|---|
| In July 2025, the federal home battery rebate program began accepting installations. | Adds battery circuits to residential switchboards |
| In February 2026, NHP announced a new head office location in Hawthorn East, Melbourne. | Strengthens a major local distribution base |
| In June 2026, the final 2026 Integrated System Plan identified about 6,000 km of new transmission. | Sets the pipeline for utility protection equipment |
| In August 2026, the home battery program passed 507,000 installations. | Confirms rapid growth in residential protection demand |
| In September 2026, Schneider Electric announced a $2.5 million breaker line at its Adelaide site. | Doubles regional air and molded case breaker capacity from 2027 |
Electronic trip units and type a devices set the pace
- Electronic trip units measure current with sensors and microprocessors, which lets engineers set precise trip curves and read load data from large breakers.
- Type A residual current devices detect pulsating DC leakage as well as AC leakage, which suits homes with inverters, chargers and modern appliances.
- Combined breaker and RCD units protect each circuit against overload, short circuit and earth leakage in one module, which saves board space and limits outages.
- High-rupturing capacity fuses clear very large fault currents quickly, which protects transformers, solar inverters and feeders in utility and industrial systems.
Need a Custom Version of This Report?
Tailor the scope, geography, or segments to your exact requirements.
- Custom geography or segment scope
- Direct access to our analyst team
Global makers and local distributors share the field
Competition combines global manufacturers with Australian distributors that hold stock and support switchboard builders. Schneider Electric makes air and molded case breakers at Gepps Cross in Adelaide and announced a $2.5 million investment in September 2026 to double that capacity from 2027. NHP Electrical Engineering Products runs 24 branches and 25 regional locations across Australia and New Zealand, selling breakers, RCDs, fuses and loadcentres alongside brands such as Terasaki and Socomec, and it launched a new online ordering platform in September 2026. Hager supplies modular devices and publishes wiring rule guidance for Australian electricians. ABB expanded its partnership with IPD in 2021 and sells its low-voltage distribution range through IPD as preferred Australian distributor. Suppliers compete on compliance, product range, breaking capacity, local stock, price and support for solar, battery and data center projects. Larger buyers increasingly ask for monitored protection, while residential electricians favor compact combined units that fit more circuits on each board.
Which manufacturers and distributors serve Australian buyers?
| Company | Type | Role in the market |
|---|---|---|
| Schneider Electric | Manufacturer | Makes air and molded case breakers in Adelaide |
| NHP Electrical Engineering Products | Distributor and supplier | Sells breakers, RCDs and fuses through 24 branches |
| Hager | Manufacturer | Supplies modular devices and wiring rule guidance |
| ABB | Manufacturer | Sells low-voltage distribution products through IPD |
Credence Research view on protection device demand
Credence Research's view is that Australian demand for circuit breakers and fuses will grow faster than general construction because grid reinforcement, rooftop solar and home batteries add protected circuits to every part of the power system. Modular devices remain the largest product type, while power breakers and electronic trip units grow fastest. Suppliers that combine local stock, compliant Type A devices and monitored protection for critical sites should gain the most share by 2035, while Queensland offers the strongest regional growth.
How the national protection device estimate was built
The report uses 2025 as the base year on a calendar basis, and market values come from the Credence Research model. That model combines official population and building statistics, renewable energy data, grid planning documents, wiring rule guidance and company releases. Segment splits and zone growth rates are Credence Research estimates, while zone shares follow the client's regional split. Sources used are official statistics, regulator data, industry body releases and company releases, and no interviews or surveys were used.
Grid build and home batteries carry growth to 2035
The Australia circuit breaker and fuse market is expected to reach USD 712.6 million by 2035, a 5.53% CAGR during 2026–2035, as grid projects, rooftop solar, home batteries and new housing keep adding protected circuits. Growth should be strongest in power breakers, electronic trip protection, utility and infrastructure, and Queensland, because these areas gain most from new connections and retrofits. Imports, price pressure and electrician shortages could slow some suppliers, while wiring rules and safety laws keep demand for compliant devices firm.
Frequently Asked Questions
How big is the Australia circuit breaker and fuse market?
Which product type leads protection device value?
Which region leads the market?
How do home batteries affect protection demand?
What do the wiring rules require for new homes?
How much new transmission does the grid plan include?
Who are the leading companies in the Australian circuit breaker and fuse market?
What are the main challenges for protection device suppliers?
Table of Content
Chapter 1 Market Segmentation
- 1.1 Segmentation Framework
- 1.1.1 Product and Service Classification
- 1.1.2 Application and End-Use Classification
- 1.1.3 Technology and Solution Classification
- 1.1.4 Customer and Distribution Channel Classification
- 1.1.5 Geographic Segmentation
- 1.1.6 Market Segment Definitions and Boundaries
- 1.2 By Product Type
- 1.2.1 Modular Circuit Breakers
- 1.2.2 Power Circuit Breakers
- 1.2.3 Fuses
- 1.3 By End-Use Industry
- 1.3.1 Residential
- 1.3.2 Commercial Buildings
- 1.3.3 Industrial Facilities
- 1.3.4 Utility and Infrastructure
- 1.4 By Technology
- 1.4.1 Thermal-Magnetic Protection
- 1.4.2 Electronic Trip Protection
- 1.4.3 Residual-Current-Only Protection
- 1.4.4 Fusible Protection
- 1.5 By Sales Channel
- 1.5.1 Electrical Wholesalers
- 1.5.2 Direct Project Sales
- 1.5.3 Specialist Distributors
Chapter 2 Introduction
- 2.1 Report Objectives and Scope
- 2.2 Product Definition and Industry Terminology
- 2.3 Market Inclusions and Exclusions
- 2.4 Research Process
- 2.4.1 Primary Research and Expert Interviews
- 2.4.2 Secondary Research and Source Review
- 2.4.3 Top-Down and Bottom-Up Estimation
- 2.4.4 Data Triangulation and Verification
- 2.5 Market Size Measurement Basis
- 2.5.1 2025: USD 409.5 million → 2035: USD 712.6 million
- 2.6 Historical and Forecast Reference Periods
- 2.6.1 Historical Period: 2018-2025
- 2.6.2 Base Year: 2025
- 2.6.3 Forecast Period: 2025-2035
- 2.7 Research Assumptions and Limitations
Chapter 3 Executive Summary
- 3.1 Market Snapshot and Key Findings
- 3.2 Base-Year Market Size, 2025
- 3.3 Forecast Market Size, 2035
- 3.4 Revenue and Volume Growth Outlook
- 3.5 Key Demand and Supply Indicators
- 3.6 Leading Market Segments
- 3.7 Fastest-Growing Market Opportunities
- 3.8 Regional Performance Highlights
- 3.9 Technology and Industry Transformation
- 3.10 Competitive Landscape Summary
- 3.11 Analyst View and Strategic Implications
Chapter 4 Australia Circuit Breaker and Fuse Market Trends and Developments
- 4.1 Historical Industry Development, 2018-2025
- 4.2 Recent Market Trends and Developments
- 4.3 Demand and Customer Behavior Trends
- 4.4 Technology and Product Innovation
- 4.5 Artificial Intelligence, Automation and Digitalization
- 4.6 Local Manufacturing and Supply Chain Realignment
- 4.7 Industry Partnerships, Mergers and Acquisitions
- 4.8 Sustainability and Circular Economy Developments
- 4.9 Government and Private Sector Investment Trends
- 4.10 Emerging Business Models and Commercialization
- 4.11 Industry Developments and Announcements
Chapter 5 Australia Circuit Breaker and Fuse Market Production, Supply and Demand Analysis
- 5.1 Demand Trend and Consumption Analysis, 2018-2025
- 5.2 Demand Forecast, 2025-2035
- 5.3 Production and Output Trend, 2018-2025
- 5.4 Production and Output Forecast, 2025-2035
- 5.5 Installed Capacity and Capacity Utilization
- 5.6 Company-Wise Production Plants and Statistics
- 5.6.1 Installed Production Capacity
- 5.6.2 Actual Production
- 5.6.3 Planned Capacity and Expansion Targets
- 5.7 Supply Chain Structure and Procurement Trends
- 5.8 Supply-Demand Gap and Bottlenecks
- 5.9 Import Dependence and Sourcing Structure
- 5.10 Contract Manufacturing and Outsourcing
- 5.11 Regional Supply and Demand Concentration
Chapter 6 Australia Circuit Breaker and Fuse Market Pricing Analysis
- 6.1 Pricing Structure and Measurement
- 6.2 Historical Pricing Trends, 2018-2025
- 6.3 Pricing Outlook, 2025-2035
- 6.4 Average Selling Price and Unit Economics
- 6.5 Pricing by Product and Market Segment
- 6.6 Geographic Pricing Differences
- 6.7 Key Input, Energy, Labor and Logistics Costs
- 6.8 Contract Pricing and Purchasing Models
- 6.9 Pricing Sensitivity and Competitive Positioning
- 6.10 Price, Margin and Profitability Implications
Chapter 7 Australia Circuit Breaker and Fuse Market Dynamics
- 7.1 Market Growth Drivers
- 7.1.1 Demand-Side Drivers
- 7.1.2 Technology and Innovation Drivers
- 7.1.3 Infrastructure and Investment Drivers
- 7.1.4 Regulatory and Policy Drivers
- 7.2 Market Restraints
- 7.2.1 Cost and Affordability Constraints
- 7.2.2 Technology and Adoption Barriers
- 7.2.3 Supply Chain and Operational Constraints
- 7.3 Market Challenges
- 7.3.1 Competitive Pressure and Margin Erosion
- 7.3.2 Skills, Infrastructure and Implementation Gaps
- 7.4 Emerging Market Opportunities
- 7.5 Market Dynamics Impact and Time-Horizon Assessment
Chapter 8 Australia Circuit Breaker and Fuse Value Chain Analysis
- 8.1 Industry Value Chain Overview
- 8.2 Upstream Suppliers and Critical Inputs
- 8.3 Technology and Component Providers
- 8.4 Manufacturing or Service Delivery
- 8.5 Distribution, Channel Partners and Integrators
- 8.6 Downstream Applications and End Users
- 8.7 Value Addition and Profit Pools
- 8.8 Vertical Integration and Outsourcing
- 8.9 Supplier Concentration and Risk
- 8.10 Supply Chain Localization and Resilience
Chapter 9 Australia Circuit Breaker and Fuse Market Regulations and Policies
- 9.1 Relevant Laws, Standards and Compliance Frameworks
- 9.2 Product, Service, Safety and Quality Requirements
- 9.3 Government Policies, Incentives and Subsidies
- 9.4 Imports, Exports and Trade Barriers
- 9.5 Public Procurement and Local Content Requirements
- 9.6 Environmental and Sustainability Compliance
- 9.7 Upcoming Policy Changes and Market Implications
Chapter 10 Australia Circuit Breaker and Fuse Market Hotspots and Opportunities
- 10.1 Market Opportunity Mapping and Growth Hotspots
- 10.2 High-Growth Applications and Customer Groups
- 10.3 Underserved Markets and White-Space Opportunities
- 10.4 Emerging Technology and Product Opportunities
- 10.5 New Capacity and Investment Hotspots
- 10.6 Market Entry and Expansion Opportunities
- 10.7 Distribution and Partnership Opportunities
- 10.8 Near-Term and Long-Term Commercial Potential
- 10.9 Opportunity Attractiveness and Execution Risks
Chapter 11 Australia Circuit Breaker and Fuse Market Outlook, 2025-2035
- 11.1 Market Size and Analysis
- 11.1.1 Revenue (Market Measurement: 2025: USD 409.5 million → 2035: USD 712.6 million)
- 11.1.2 Market Volume and Quantity Sold
- 11.1.3 Historical Market Size, 2018-2025
- 11.1.4 Base-Year Market Size, 2025
- 11.2 Market Forecast, 2025-2035
- 11.2.1 Revenue Forecast to 2035
- 11.2.2 Volume Forecast to 2035
- 11.2.3 CAGR and Year-on-Year Growth
- 11.2.4 Incremental Revenue Opportunity
- 11.3 Forecast Assumptions and Scenario Analysis
- 11.3.1 Base-Case Forecast
- 11.3.2 Optimistic and Conservative Scenarios
- 11.3.3 Technology, Pricing and Policy Sensitivities
- 11.4 Market Attractiveness and Growth Outlook
Chapter 12 Australia Circuit Breaker and Fuse Market Segmentation and Outlook
- 12.1 Segmentation Summary and Market Shares, 2025
- 12.2 Largest and Fastest-Growing Segments
- 12.3 By Product Type - Market Size and Forecast, 2025-2035
- 12.3.1 Segment Definition and Scope
- 12.3.2 Historical Market Size, 2018-2025
- 12.3.3 Revenue Forecast, 2025-2035
- 12.3.4 Volume Forecast, 2025-2035
- 12.3.5 Base-Year Market Share, 2025
- 12.3.6 Segment CAGR and Growth Drivers
- 12.3.7 Subsegment Market Size and Forecast
- 12.3.7.1 Modular Circuit Breakers
- 12.3.7.2 Power Circuit Breakers
- 12.3.7.3 Fuses
- 12.3.8 Subsegment Pricing and Adoption Trends
- 12.3.9 Leading Suppliers and Competition
- 12.3.10 Regional Demand and Opportunities
- 12.4 By End-Use Industry - Market Size and Forecast, 2025-2035
- 12.4.1 Segment Definition and Scope
- 12.4.2 Historical Market Size, 2018-2025
- 12.4.3 Revenue Forecast, 2025-2035
- 12.4.4 Volume Forecast, 2025-2035
- 12.4.5 Base-Year Market Share, 2025
- 12.4.6 Segment CAGR and Growth Drivers
- 12.4.7 Subsegment Market Size and Forecast
- 12.4.7.1 Residential
- 12.4.7.2 Commercial Buildings
- 12.4.7.3 Industrial Facilities
- 12.4.7.4 Utility and Infrastructure
- 12.4.8 Subsegment Pricing and Adoption Trends
- 12.4.9 Leading Suppliers and Competition
- 12.4.10 Regional Demand and Opportunities
- 12.5 By Technology - Market Size and Forecast, 2025-2035
- 12.5.1 Segment Definition and Scope
- 12.5.2 Historical Market Size, 2018-2025
- 12.5.3 Revenue Forecast, 2025-2035
- 12.5.4 Volume Forecast, 2025-2035
- 12.5.5 Base-Year Market Share, 2025
- 12.5.6 Segment CAGR and Growth Drivers
- 12.5.7 Subsegment Market Size and Forecast
- 12.5.7.1 Thermal-Magnetic Protection
- 12.5.7.2 Electronic Trip Protection
- 12.5.7.3 Residual-Current-Only Protection
- 12.5.7.4 Fusible Protection
- 12.5.8 Subsegment Pricing and Adoption Trends
- 12.5.9 Leading Suppliers and Competition
- 12.5.10 Regional Demand and Opportunities
- 12.6 By Sales Channel - Market Size and Forecast, 2025-2035
- 12.6.1 Segment Definition and Scope
- 12.6.2 Historical Market Size, 2018-2025
- 12.6.3 Revenue Forecast, 2025-2035
- 12.6.4 Volume Forecast, 2025-2035
- 12.6.5 Base-Year Market Share, 2025
- 12.6.6 Segment CAGR and Growth Drivers
- 12.6.7 Subsegment Market Size and Forecast
- 12.6.7.1 Electrical Wholesalers
- 12.6.7.2 Direct Project Sales
- 12.6.7.3 Specialist Distributors
- 12.6.8 Subsegment Pricing and Adoption Trends
- 12.6.9 Leading Suppliers and Competition
- 12.6.10 Regional Demand and Opportunities
- 12.7 Segment Growth Comparison
- 12.8 Segment Attractiveness and Priority Matrix
Chapter 13 Australia Circuit Breaker and Fuse End-Use and Application Market Outlook
- 13.1 End-Use Industry and Customer Demand Structure
- 13.2 Leading Applications and Customer Groups
- 13.3 End-Use Market Size, Share and Forecast
- 13.4 Major End-Use Industry Deep Dives
- 13.4.1 Customer Requirements and Use Cases
- 13.4.2 Demand and Replacement Cycles
- 13.4.3 Technical and Regulatory Considerations
- 13.4.4 Purchasing and Procurement Models
- 13.4.5 Leading Vendors and Distribution Channels
- 13.4.6 Forecast and Commercial Opportunities
- 13.5 Emerging Applications and Cross-Segment Demand
- 13.6 End-Use Industry Investment Priorities
Chapter 14 Australia Circuit Breaker and Fuse Geographic Market Outlook, 2025-2035
- 14.1 Domestic Market Distribution and Demand Clusters
- 14.2 State- or Province-Wise Market Size and Forecast, 2025-2035
- 14.3 City and Metropolitan Market Outlook
- 14.4 Industrial, Manufacturing and Commercial Clusters
- 14.5 Geographic Concentration of Key End Users
- 14.6 Local Pricing and Purchasing Differences
- 14.7 Domestic Production Facilities and Capacity Map
- 14.8 Local Infrastructure and Project Pipeline
- 14.9 State-Level Policy and Incentive Differences
- 14.10 Subnational Investment Hotspots and Opportunities
- 14.11 Distribution and Logistics Networks
- 14.12 Domestic Competitive Footprint
Chapter 15 Australia Circuit Breaker and Fuse Technology, Innovation and Sustainability Outlook
- 15.1 Technology Landscape and Maturity
- 15.2 Product, Process and Service Innovation
- 15.3 AI, Automation and Digital Tools in the Industry
- 15.4 Technology Adoption and Performance Benchmarking
- 15.5 Innovation Pipeline and R&D Investment
- 15.6 Patent and Intellectual Property Trends
- 15.7 Energy Efficiency and Resource Management
- 15.8 Sustainability, Recycling and Circularity
- 15.9 Technology Roadmap, 2025-2035
- 15.10 Risks of Obsolescence and Technology Substitution
Chapter 16 Australia Circuit Breaker and Fuse Market Key Strategic Imperatives
- 16.1 Growth and Market Entry Priorities
- 16.2 High-Return Products and Segments
- 16.3 Pricing, Profitability and Cost Optimization
- 16.4 Technology Investment and Product Differentiation
- 16.5 Supply Chain Localization and Resilience
- 16.6 Distribution and Customer Acquisition
- 16.7 Partnership, Acquisition and Capacity Strategy
- 16.8 Regional Expansion Priorities
- 16.9 Short-, Medium- and Long-Term Actions
Chapter 17 Competition Outlook
- 17.1 Industry Competition Characteristics
- 17.2 Market Structure and Concentration
- 17.3 Market Share and Competitive Positioning, 2025
- 17.4 Company-Wise Revenue and Product Benchmarking
- 17.5 Production and Service Capacity Benchmarking
- 17.6 Technology, Pricing and Differentiation
- 17.7 Regional Footprint and Distribution Strength
- 17.8 Mergers, Acquisitions and Strategic Alliances
- 17.9 New Entrants and Competitive Threats
- 17.10 Porter's Five Forces and Industry Attractiveness
- 17.11 Competitive Outlook, 2025-2035
Chapter 18 Company Profiles
- 18.1 Company Coverage and Selection Criteria
- 18.2 Schneider Electric
- 18.2.1 Business Description
- 18.2.2 Company Ownership and Geographic Presence
- 18.2.3 Product and Service Portfolio
- 18.2.4 Manufacturing and Operating Footprint
- 18.2.5 Production Capacity and Expansion Plans
- 18.2.6 Financial Performance and Investment
- 18.2.7 Market Share and Competitive Position
- 18.2.8 Technology and Innovation Capabilities
- 18.2.9 Strategic Alliances or Partnerships
- 18.2.10 Recent Developments
- 18.2.11 Growth Strategy and Outlook
- 18.3 NHP Electrical Engineering Products
- 18.4 ABB
- 18.5 Siemens
- 18.6 Legrand
- 18.7 Eaton
- 18.8 Hager
- 18.9 Littelfuse
- 18.10 CHINT
- 18.11 SIBA
- 18.12 Other Relevant Market Participants
Note: Every listed company is profiled on the structure shown under the first company. The company list is preliminary and may change based on research findings, market developments, data availability and client requirements.
Chapter 19 Disclaimer
- 19.1 Research and Forecast Disclaimer
- 19.2 Data Source and Estimation Limitations
Note: The depth of individual sections depends on data availability for this market. Volume, capacity, trade and other unit-based metrics are included where applicable.

