
Phone power adapters move from bundled to bought in India
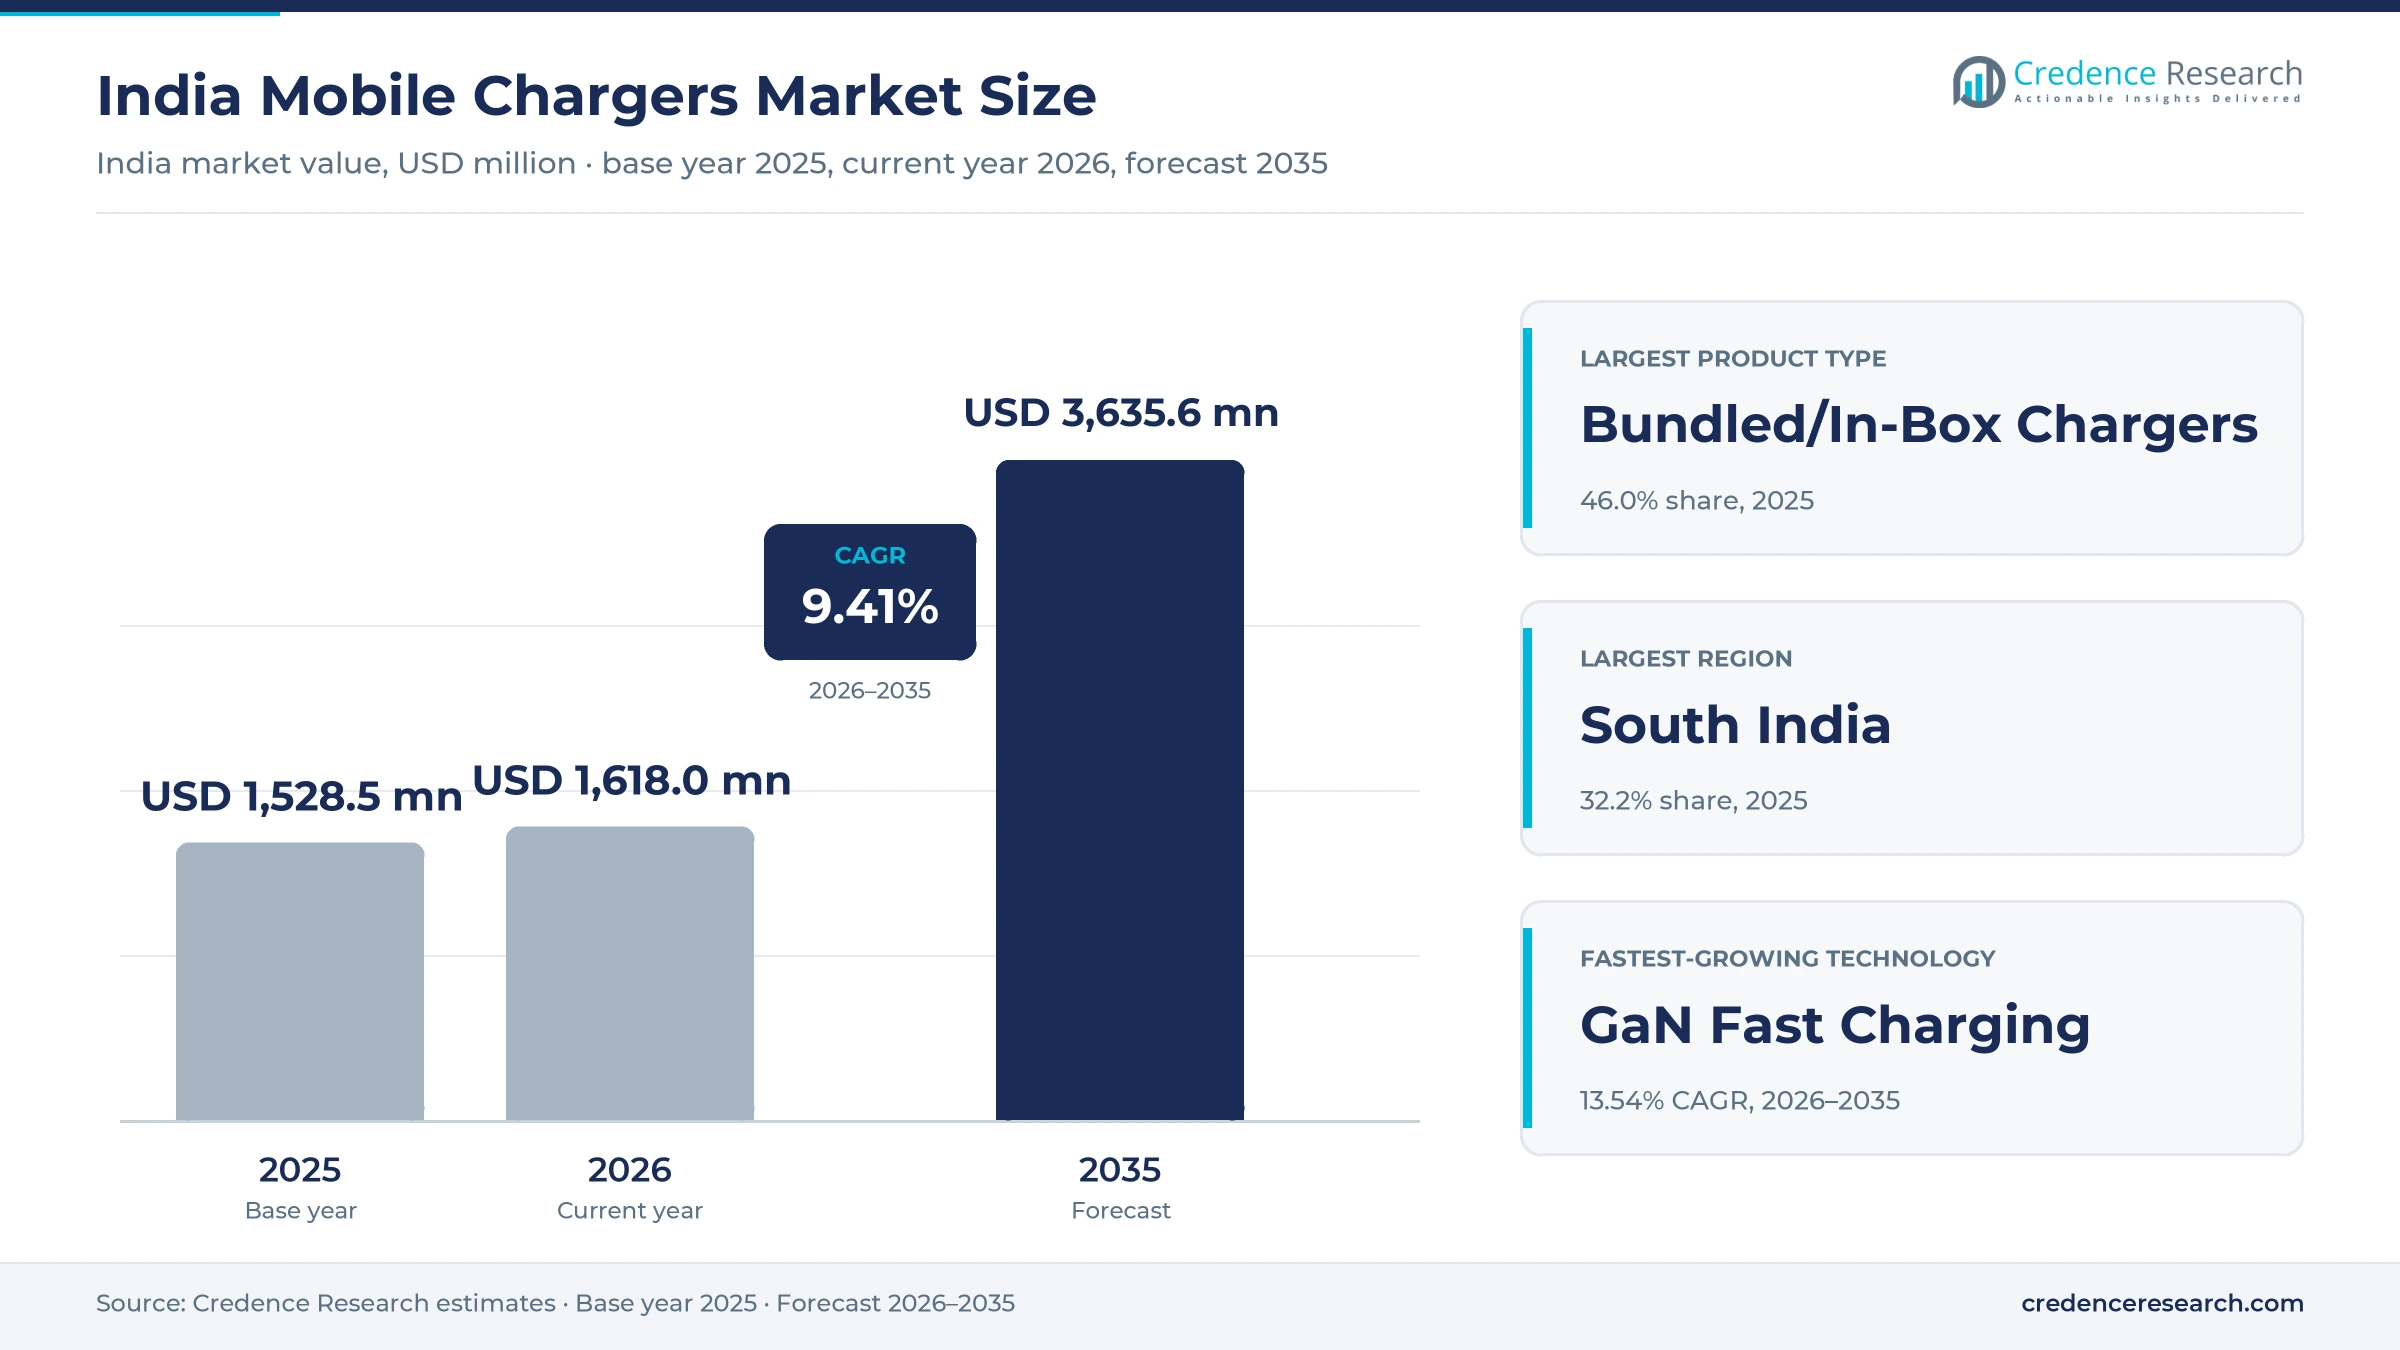
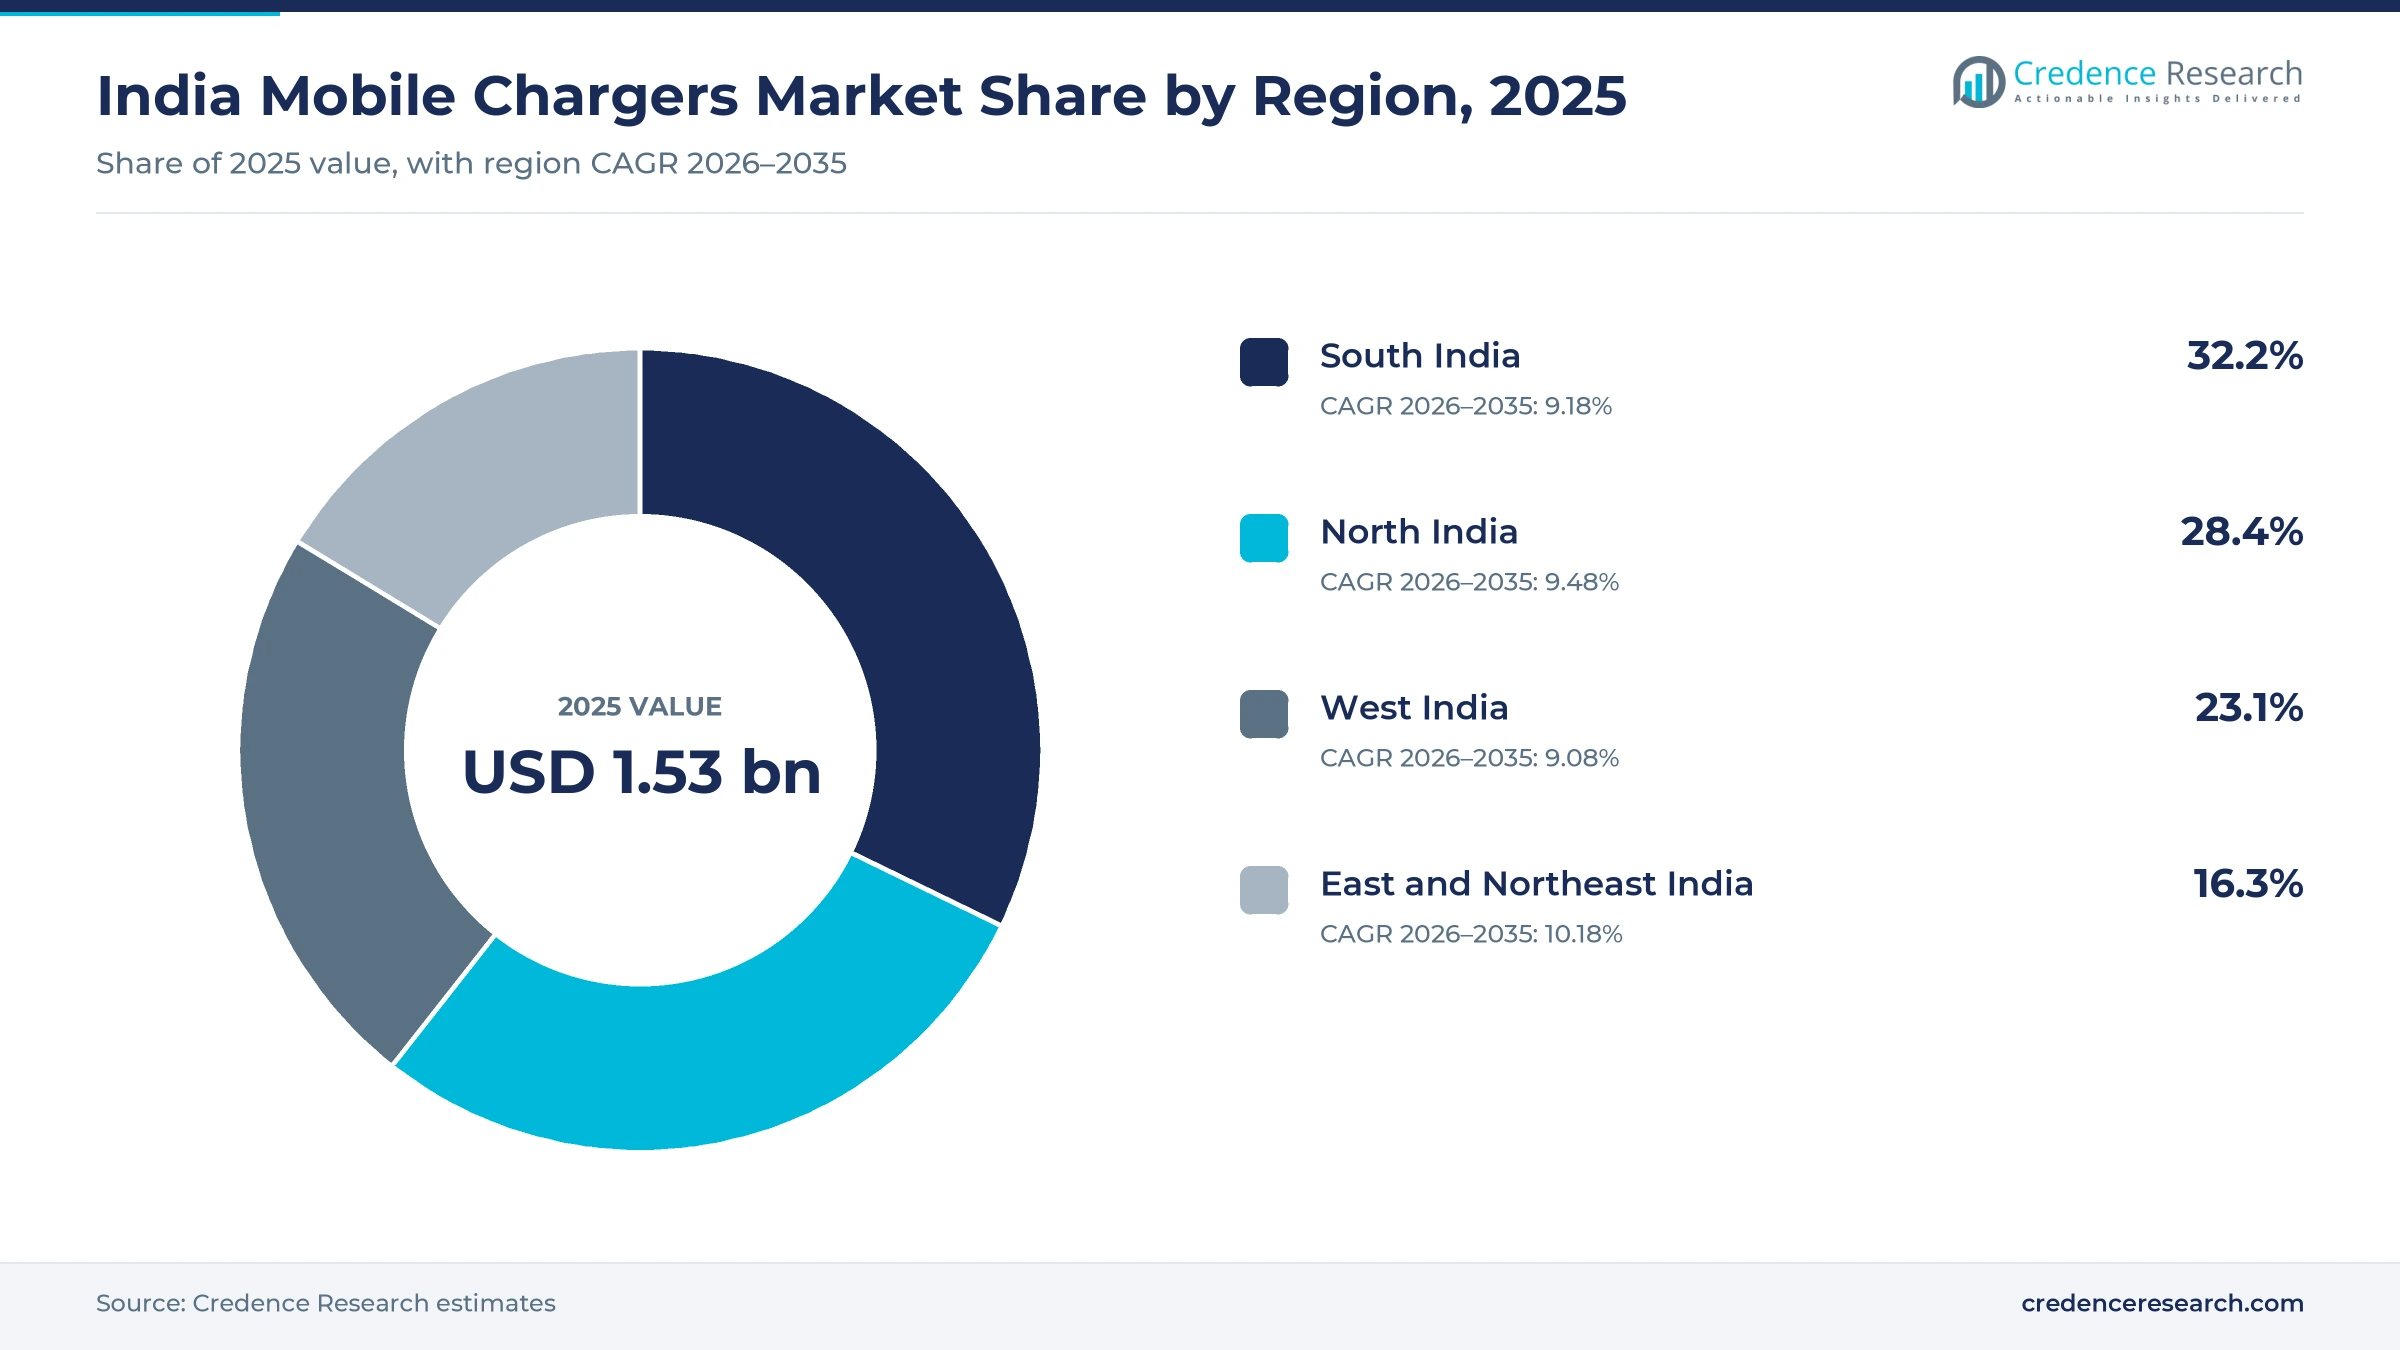
The India mobile chargers market was valued at USD 1.53 billion in 2025 and is projected to increase from USD 1.62 billion in 2026 to USD 3.64 billion by 2035, registering a CAGR of 9.41% during 2026–2035. Demand comes from more than a billion mobile connections, frequent adapter replacement and a steady shift toward fast and wireless charging that buyers pay extra for. South India held the largest regional share, 32.2% in 2025, because its large urban smartphone base and adapter assembly near Chennai support both supply and retail demand. East and Northeast India is the fastest-growing region at 10.18% a year, as online delivery and dealer networks reach more smaller towns. In turn, the technology setting has shifted, because the Wireless Power Consortium released the Qi2 25W standard in July 2025 and Indian accessory brands began selling certified magnetic pads within months.
Which phone power adapters and charging pads does the estimate count?
The estimate measures the value of wall adapters, wireless pads and stands, and car adapters sold in India to charge smartphones, feature phones and other handheld devices. It counts adapters supplied in the box with new phones at their factory value, plus standalone units bought through online, retail and dealer channels.
The estimate excludes power banks, charging cables sold on their own, laptop-only power supplies and electric vehicle charging equipment. The value chain runs from chip, transformer and casing suppliers through contract assemblers and brand owners to marketplaces, retailers and dealers that sell each adapter to the final buyer.
India Mobile Chargers Market Insights
- The India mobile chargers market was valued at USD 1.53 billion in 2025 and is projected to reach USD 3.64 billion by 2035, registering a CAGR of 9.41% during 2026–2035.
- South India held a 32.2% share of 2025 value, because its dense urban smartphone base and assembly sites near Chennai support both supply and demand.
- Bundled and in-box adapters led with a 46.0% share of 2025 value, because many phones sold in India still ship with an adapter in the box.
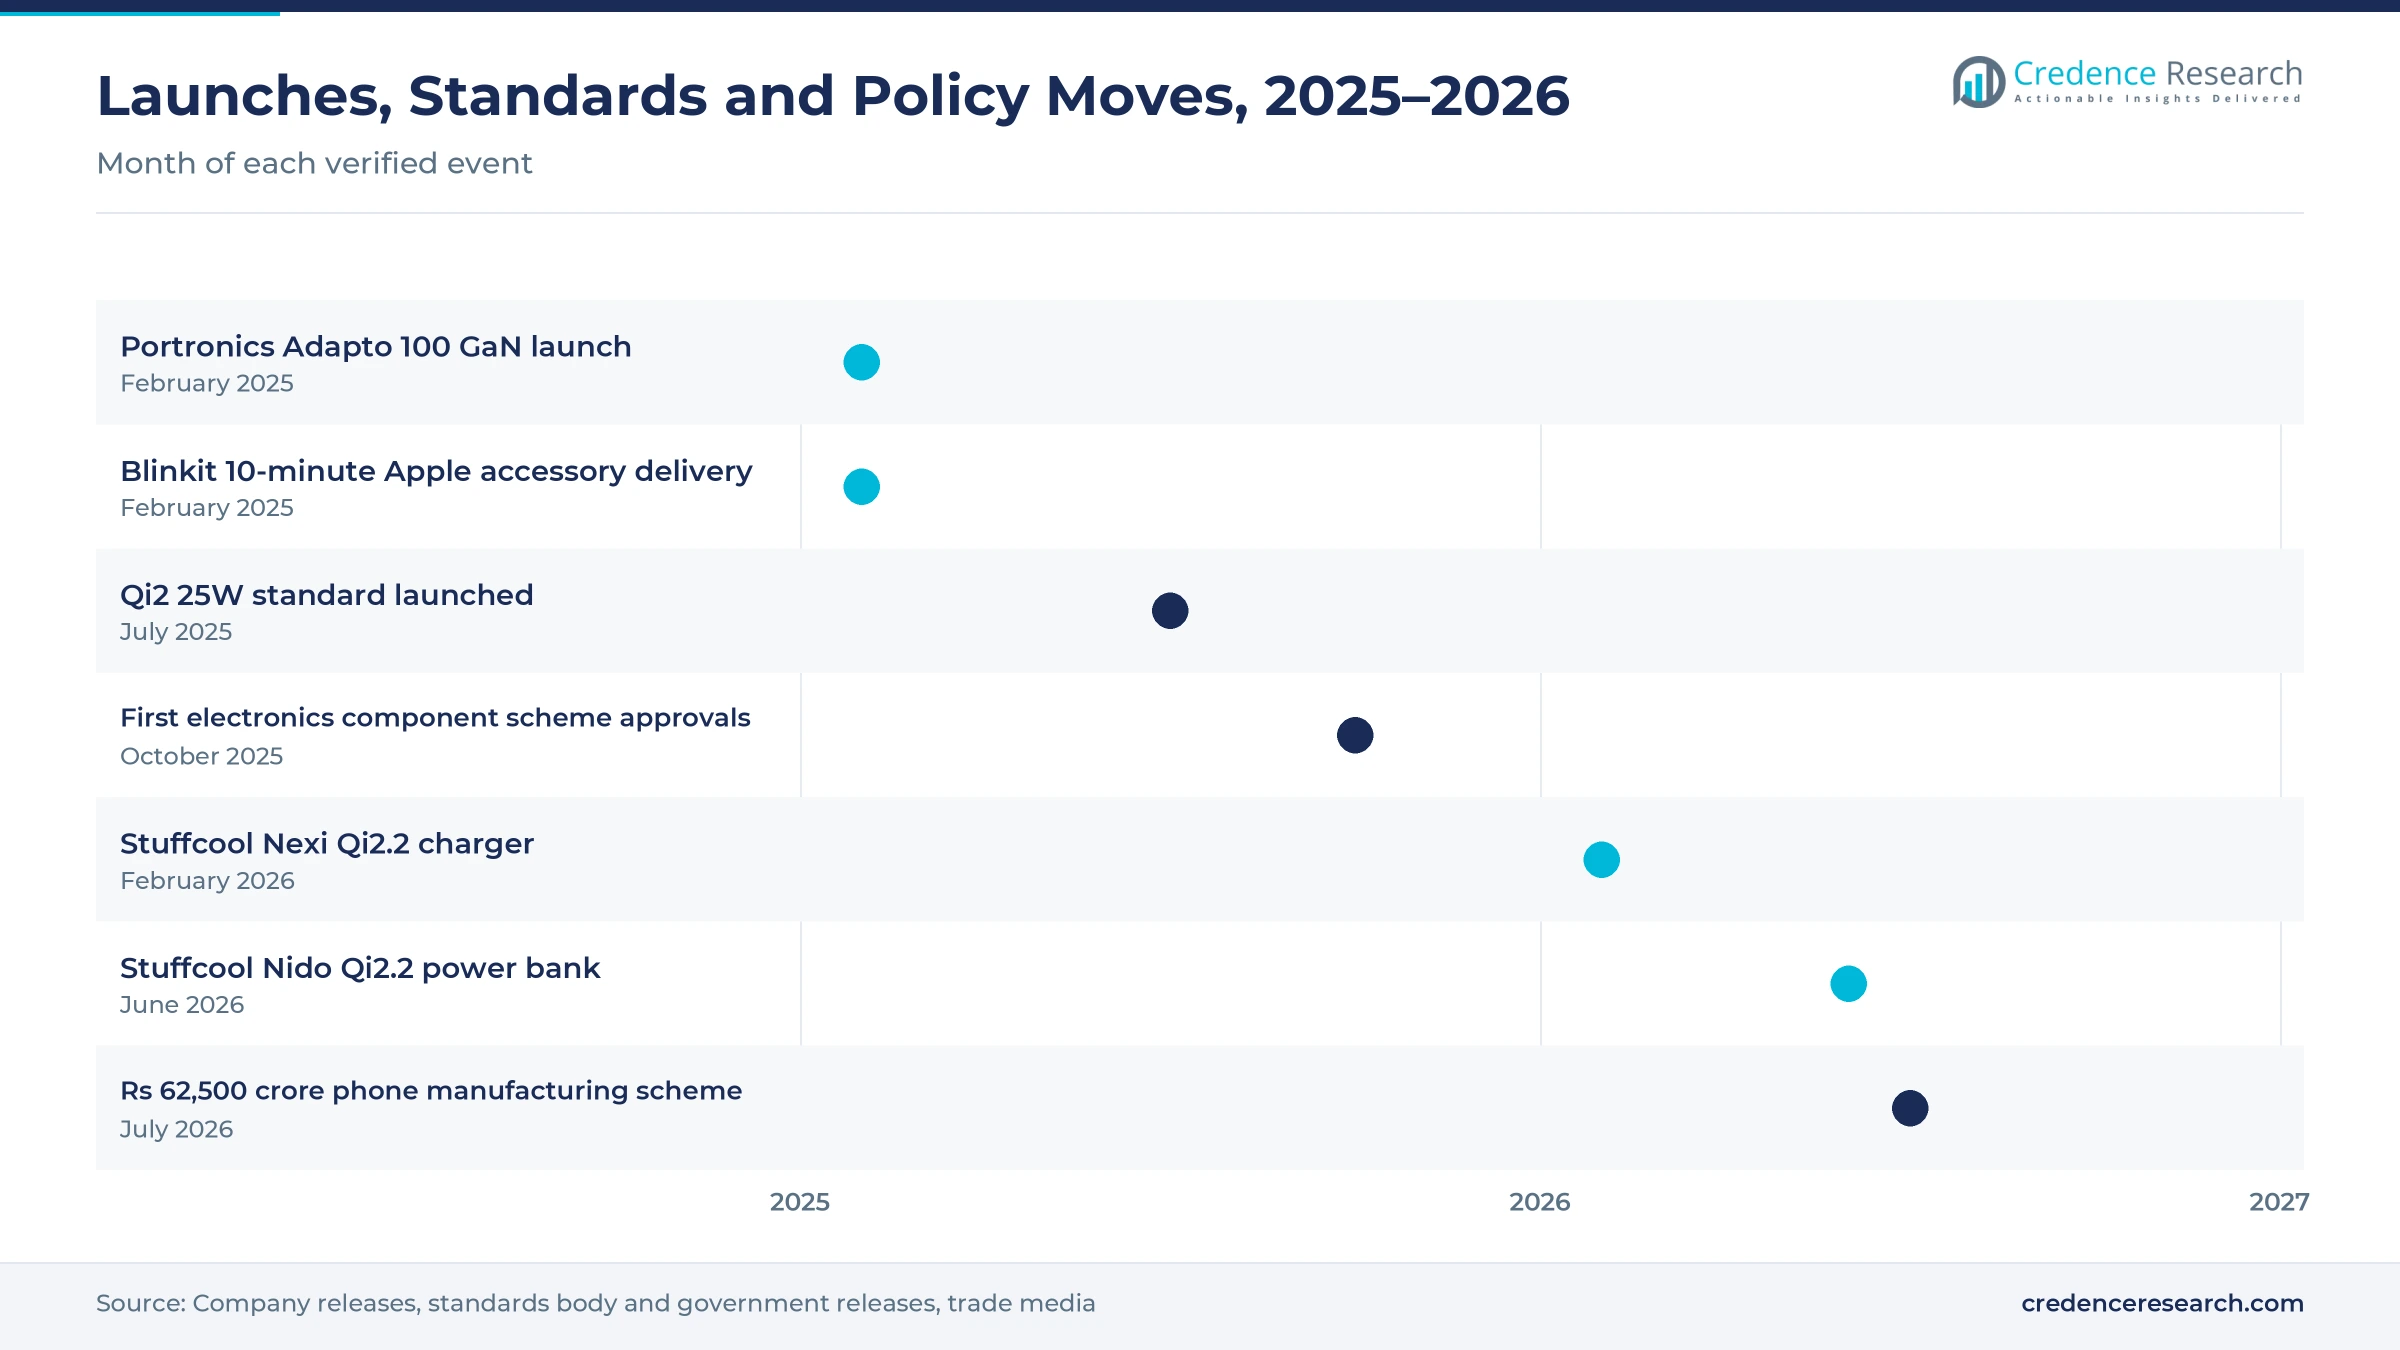
- The Wireless Power Consortium released Qi2 25W on July 23, 2025, and Stuffcool launched a Qi2.2-certified 25W foldable charger in India in February 2026.
- The Union Cabinet approved a Rs 62,500 crore mobile phone manufacturing scheme in July 2026, which supports local demand for adapters and their parts.
In-box adapters lead while wireless pads grow fastest
Why do bundled adapters still hold the largest share?
Based on product type, the market is categorized into bundled and in-box chargers, standalone wall chargers, wireless chargers and car chargers. Bundled/In-Box Chargers led with a 46.0% share of 2025 value, because many budget and mid-range phones still include an adapter. Wireless Chargers grow fastest at 13.30% a year, as magnetic pads and stands spread from premium to mid-range phones.
How fast are GaN and power delivery adapters gaining ground?
Based on technology, the market is categorized into conventional silicon charging, USB Power Delivery and PPS, GaN fast charging and Qi and Qi2 wireless charging. Conventional Silicon Charging led with a 44.0% share of 2025 value, because low-cost adapters still dominate entry phones. GaN Fast Charging grows fastest at 13.54% a year, as smaller, cooler multi-port adapters replace older bricks.
Which charging uses generate the most adapter spending?
Based on application, the market is categorized into smartphone charging, feature phone charging, multi-device charging and in-vehicle charging. Smartphone Charging led with a 78.0% share of 2025 value, because smartphones dominate new device sales and replacements. Multi-Device Charging grows fastest at 12.41% a year, as buyers charge phones, earbuds, watches and tablets from one adapter.
Where do Indian buyers purchase replacement adapters?
Based on distribution channel, the market is categorized into e-commerce marketplaces, brand D2C websites, multi-brand electronics retail and mobile and accessory dealers. E-Commerce Marketplaces led with a 41.0% share of 2025 value, because wide choice and fast delivery suit low-ticket accessories. Brand D2C Websites grow fastest at 11.68% a year, as accessory brands sell directly with launch offers.
| Segment Group | Leading Sub-segment | Share, 2025 | Fastest-growing Sub-segment | CAGR, 2026–2035 |
|---|---|---|---|---|
| By Product Type | Bundled/In-Box Chargers | 46.0% | Wireless Chargers | 13.30% |
| By Technology | Conventional Silicon Charging | 44.0% | GaN Fast Charging | 13.54% |
| By Application | Smartphone Charging | 78.0% | Multi-Device Charging | 12.41% |
| By Distribution Channel | E-Commerce Marketplaces | 41.0% | Brand D2C Websites | 11.68% |
Request a Free Sample
Fill in your details and we'll send you a free sample report.
- Sample data tables & charts
- Research methodology
Phone base, faster charging and online reach drive demand
How does the large installed phone base sustain replacement demand?
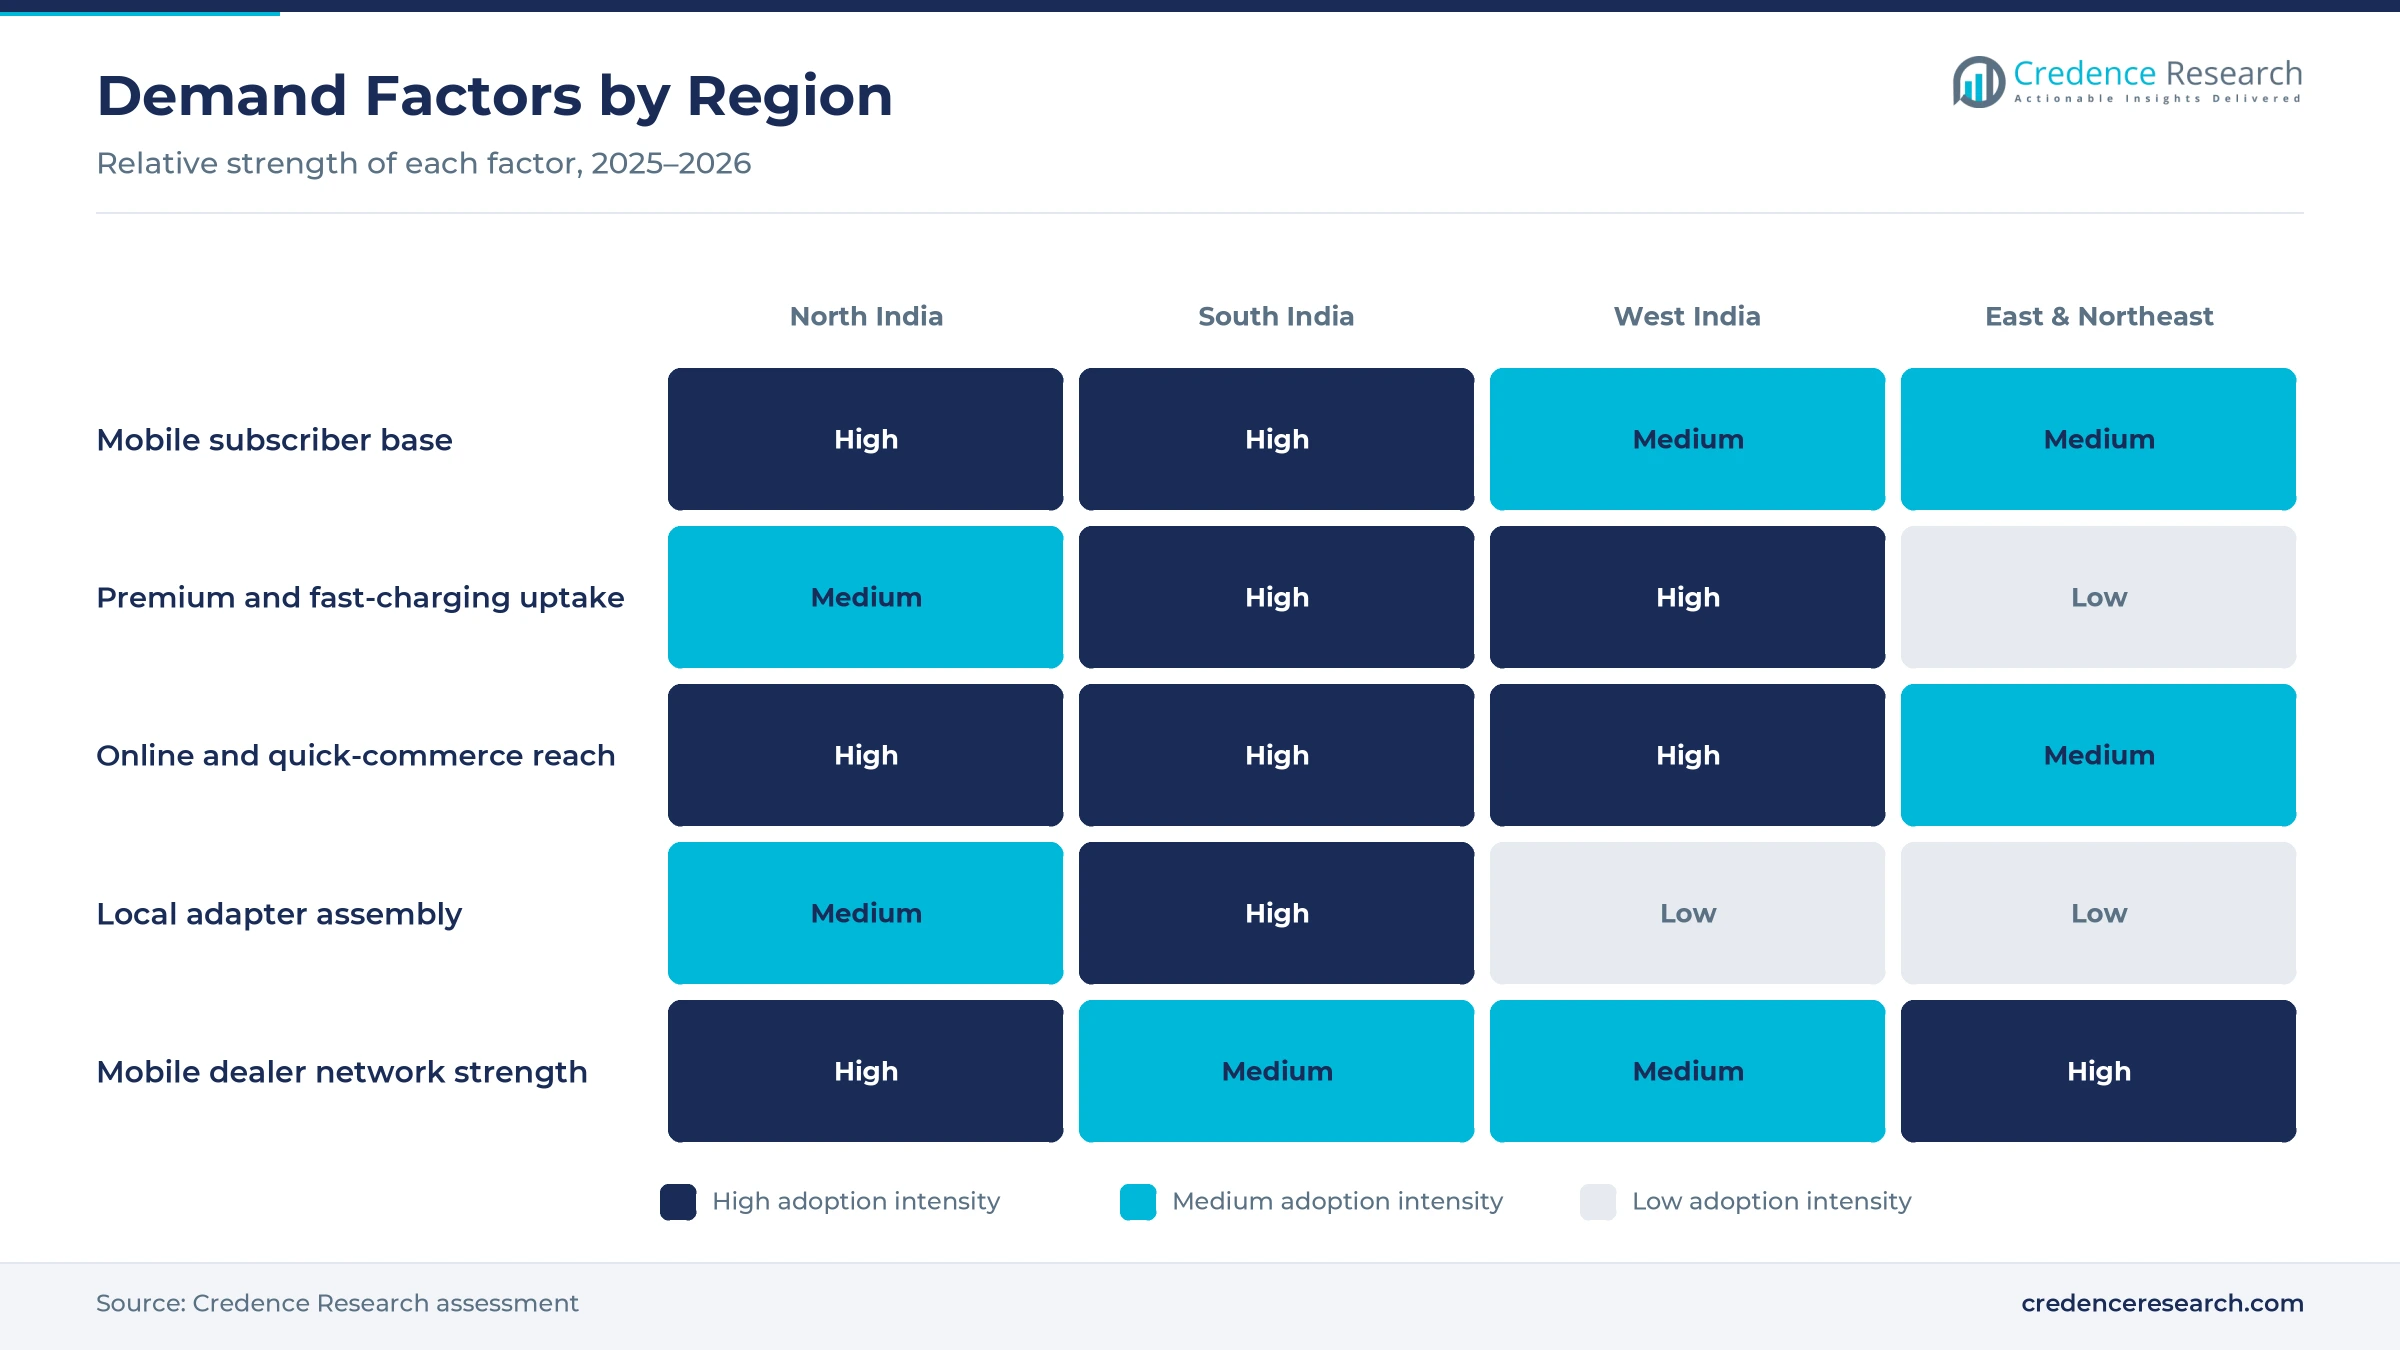
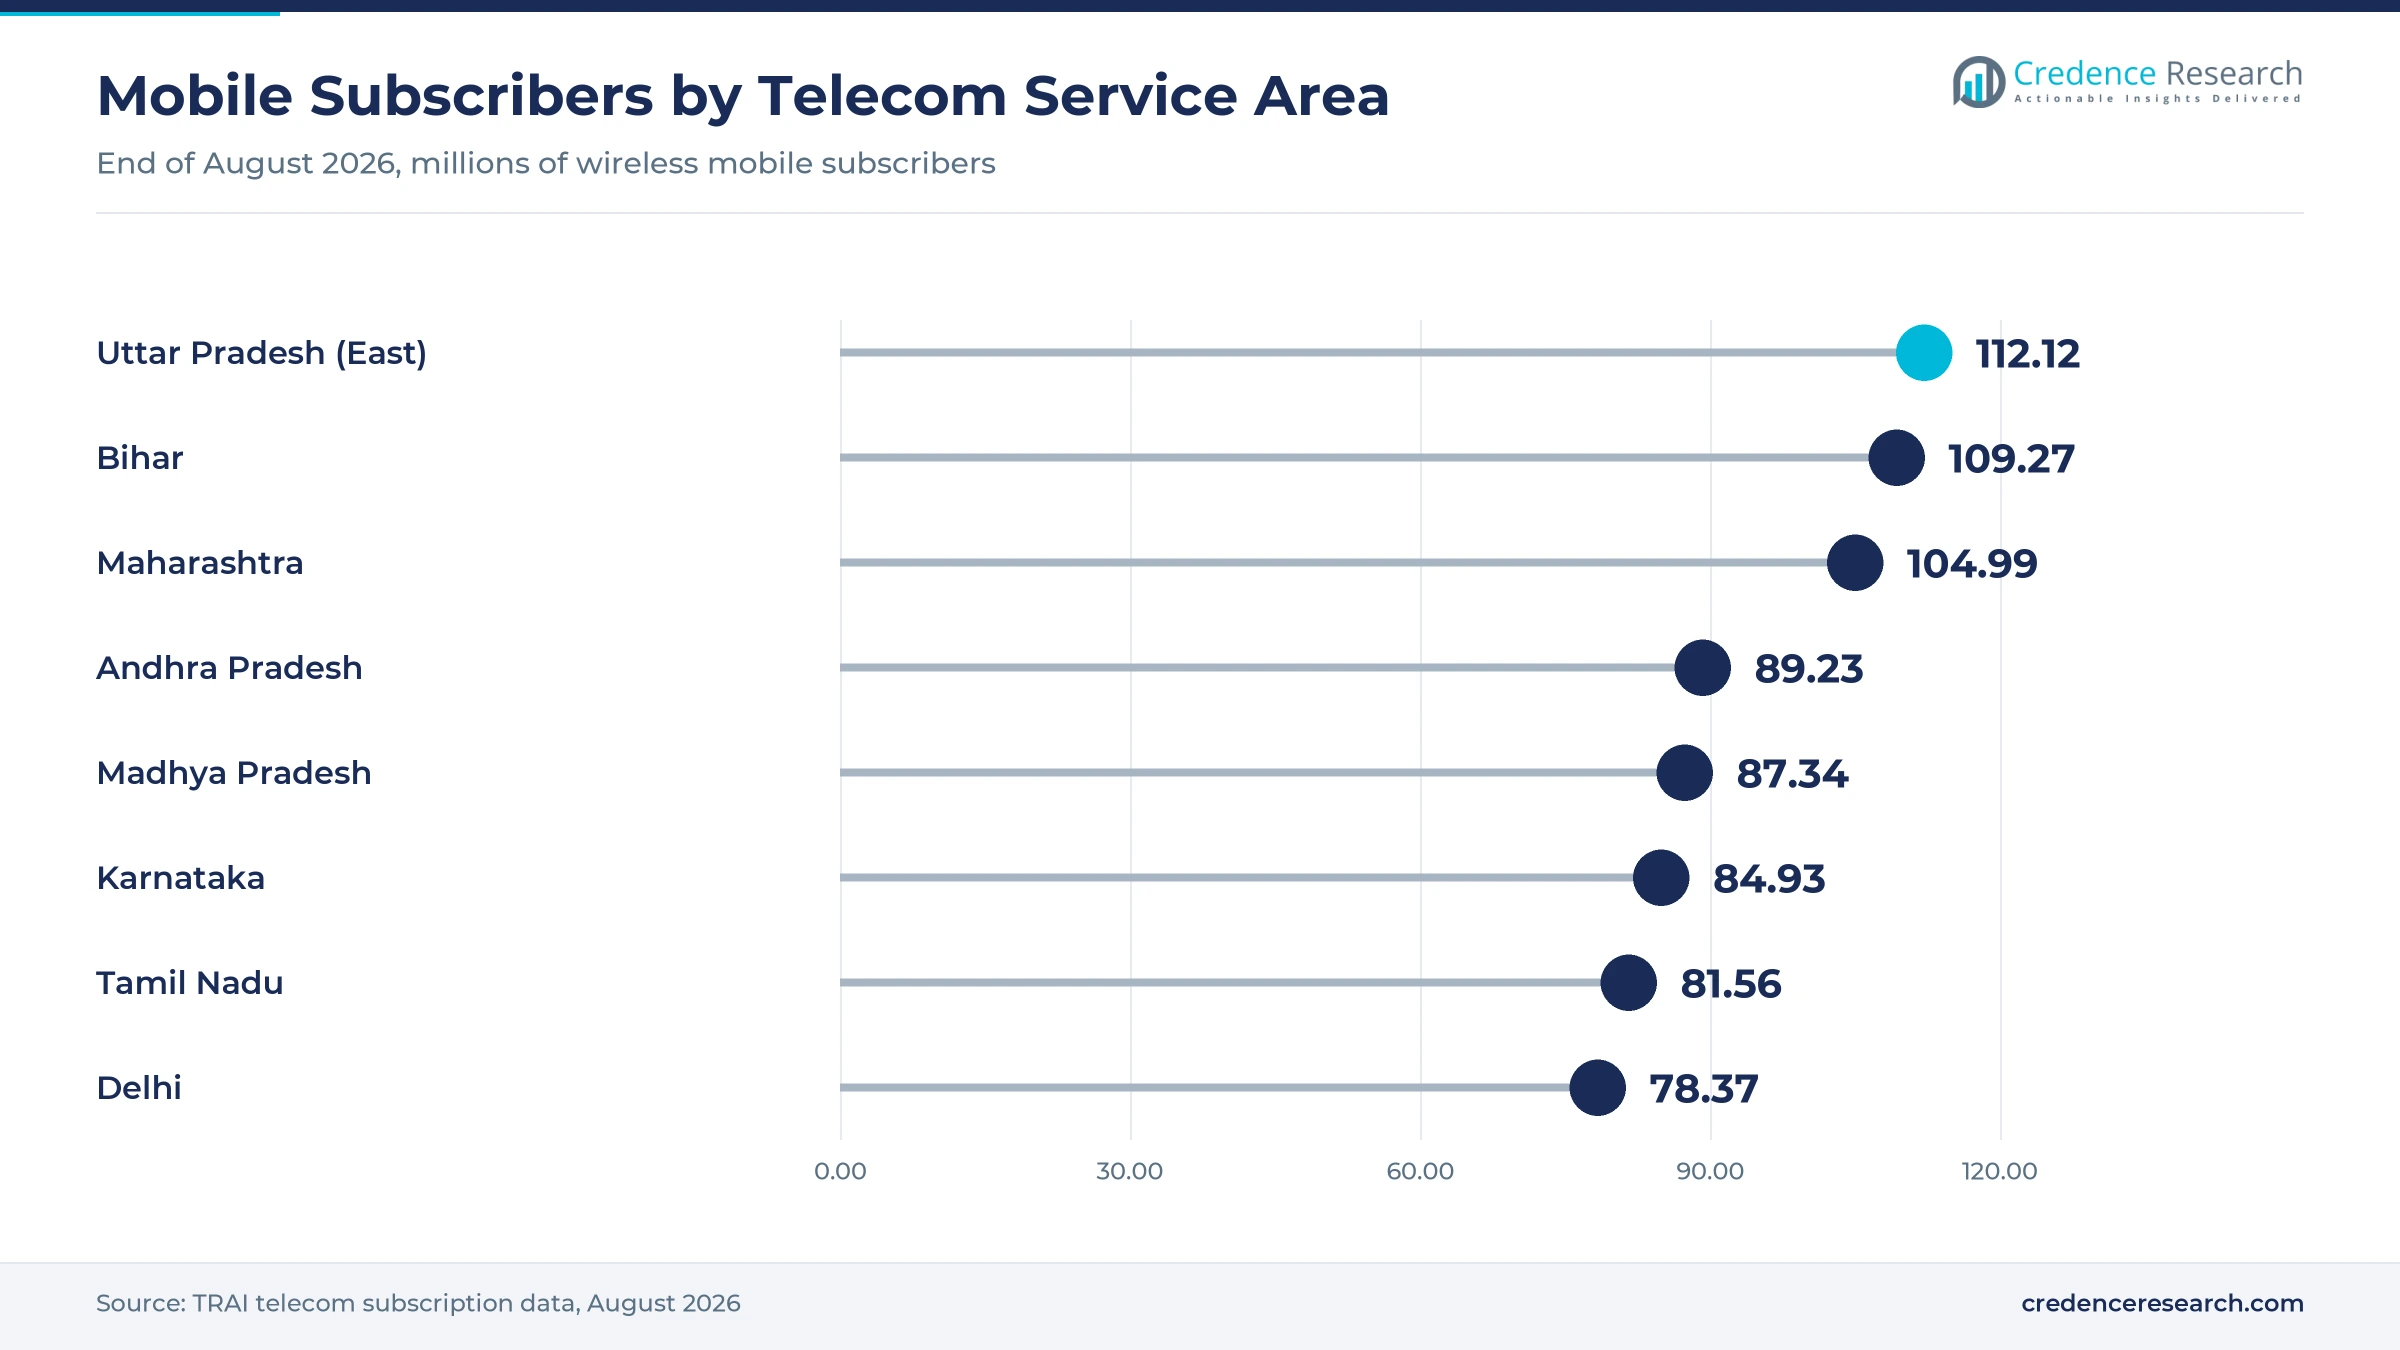
The large installed smartphone base sustains replacement demand, because adapters are lost, damaged or outgrown far more often than the phones they charge. India had 1,293.43 million wireless mobile subscribers at the end of August 2026, according to TRAI subscription data, and the total including fixed wireless access reached 1,312.25 million. Uttar Pradesh East, Bihar and Maharashtra each counted more than 100 million mobile subscribers in that release. Indian mobile phone production also rose from Rs 2,13,773 crore in 2020-21 to about Rs 5,25,000 crore in 2024-25, which adds a steady flow of new handsets. As a result, smartphone charging accounts for 78.0% of 2025 value.
Why do fast charging and wireless pads lift average prices?
Fast charging and wireless pads lift average prices, because buyers pay more for adapters that refill a phone in less time and fit several devices. The Wireless Power Consortium launched Qi2 25W on July 23, 2025, according to the consortium and said it delivers nearly 70% more power than the original 15-watt Qi2. Fourteen devices completed certification in the first week, and several hundred more entered testing. Samsung India lists a 25-watt travel adaptor with USB PD 3.0 and PPS output, which matches the charging profile of its newer phones. In turn, wireless chargers grow at 13.30% a year, the fastest of all product types.
How do online marketplaces and quick commerce widen reach?
Online marketplaces and quick commerce widen reach, because shoppers in smaller towns can now compare and receive branded adapters within days or even minutes. Portronics launched its 100-watt Adapto 100 GaN adapter on Feb. 6, 2025, at Rs 2,999 through its own site, Amazon and Flipkart, according to The Tech Outlook. Blinkit began delivering Apple products and accessories within 10 minutes in 11 cities in February 2025. Stuffcool sold its Nido magnetic power bank through its own website and Amazon India from June 2026. As a result, e-commerce marketplaces held 41.0% of 2025 value, the largest channel share, while dealers still serve buyers who want to test an adapter first.
Why does domestic electronics manufacturing support adapter demand?
Domestic electronics manufacturing supports adapter demand, because every phone assembled for local sale or export needs a compatible power supply. The Union Cabinet approved a Rs 62,500 crore mobile phone manufacturing scheme for 2026-27 to 2030-31, according to Business Today. Smartphones became India's largest export by value in calendar 2025, at about Rs 2.62 lakh crore. The first batch of seven projects under the electronics component scheme in October 2025 carried planned investment of Rs 5,532 crore. In turn, local adapter assembly near Chennai keeps South India the largest regional market, because contract makers there supply phone brands and accessory labels from the same plants.
GaN, magnetic wireless and local supply reshape the category
How is the shift toward GaN multi-port adapters changing ranges?
The shift toward GaN multi-port adapters is changing product ranges, because gallium nitride parts let brands pack more power into smaller and cooler housings. Portronics priced its three-port, 100-watt Adapto 100 at Rs 2,999 in February 2025, with two USB-C Power Delivery ports and one USB-A port. Ambrane sells the RAAP G65 adapter with GaNMAX technology for phones and laptops. Samsung India also offers USB PD 3.0 PPS adaptors rated at 25 watts for its newer handsets. As a result, GaN fast charging grows at 13.54% a year, which supports demand for gallium nitride power adapters across mass-market, premium and high-power price tiers.
Why is the rise of magnetic Qi2 charging significant?
The rise of magnetic Qi2 charging is significant, because certified pads align automatically and now reach 25 watts on both iPhone and Android models. Qi2 first launched in November 2023 at 15 watts, and more than 1.5 billion certified Qi2 devices, transmitters and receivers were in use within a year. Stuffcool launched its Nexi 3-in-1 foldable charger with Qi2.2-certified 25-watt output in India on Feb. 3, 2026. The company then announced the Nido magnetic power bank in June 2026 with 25-watt Qi2.2 output. In turn, Qi and Qi2 technology lifts demand for wireless charging pads and stands in Indian cities.
Can USB-C standardization open a universal replacement opening?
USB-C standardization opens a universal replacement opportunity, because one connector across phones, tablets and earbuds lets buyers keep a single adapter for many devices. The Bureau of Indian Standards notified quality standards for USB Type-C charging ports in December 2022, and the government said its plan should align with the European timeline for a common charger. Portronics launched the Adapto 100 on Feb. 6, 2025, with two USB-C Power Delivery ports that serve phones and laptops from one unit. Samsung India sells a 25-watt adaptor with a USB Type-C interface and PD 3.0 output for its newer phones. As a result, multi-device charging grows at 12.41% a year, as households replace older single-port bricks with USB Power Delivery adapters.
Is local component supply an opening for adapter makers?
Local component supply is an opening for adapter makers, because government incentives now reach the parts inside phones and their accessories. The first batch of electronics component scheme approvals in October 2025 covered seven projects with expected production of Rs 44,406 crore. Salcomp runs adapter assembly in a former Nokia facility in Chennai and employed about 12,000 people there in February 2023. India's real GDP grew 7.8% in 2025 and is projected to grow 7% in 2026, according to IMF data. In turn, makers that source more parts locally can price brand D2C ranges, which grow at 11.68% a year, more sharply.
Fakes, price pressure and imported parts weigh on sellers
How do counterfeit and uncertified adapters hurt brands?
Counterfeit and uncertified adapters hurt brands, because low-priced copies sold by street vendors look similar to genuine units but skip safety parts. As a result, buyers face overheating risks, and genuine brands lose sales at the bottom of the price range. Brands respond with registered safety marks, warranty checks and packaging codes. In turn, enforcement and buyer awareness decide how fast this gray segment shrinks.
Why does price competition squeeze accessory margins?
Price competition squeezes accessory margins, because dozens of labels sell similar 20-watt and 25-watt adapters on the same marketplace pages. As a result, sellers spend heavily on discounts and advertising to stay visible in search results. Larger brands respond by moving buyers toward GaN, multi-port and Qi2 products with higher prices. In turn, smaller labels without engineering depth struggle to keep margins above their cost of returns.
How does reliance on imported chips and parts create risk?
Reliance on imported chips and parts creates risk, because power controllers, GaN transistors and magnets often come from overseas suppliers. As a result, currency moves, freight delays and supplier shortages can raise costs or slow launches for Indian brands. Makers respond by qualifying more than one supplier and by shifting assembly to local plants. In turn, component incentive approvals can reduce this exposure over the next several years.
Why does uncertainty over in-box adapters complicate planning?
Uncertainty over in-box adapters complicates planning, because phone brands decide model by model whether to include a power supply. As a result, contract makers face swings in order volumes, while accessory brands cannot predict replacement demand with confidence. Suppliers respond by keeping flexible lines that switch between bundled and retail packs. In turn, firms with both brand and contract business balance these swings better than single-channel rivals.
South India leads as eastern states grow fastest
| Region | Value, 2025 (USD billion) | Share, 2025 | CAGR, 2026–2035 |
|---|---|---|---|
| South India | 0.49 | 32.2% | 9.18% |
| North India | 0.43 | 28.4% | 9.48% |
| West India | 0.35 | 23.1% | 9.08% |
| East and Northeast India | 0.25 | 16.3% | 10.18% |
Why does South India lead adapter spending and supply?
South India held a 32.2% share of 2025 value and grows at 9.18% a year, because Bengaluru, Chennai and Hyderabad combine high smartphone use with premium accessory demand. Salcomp assembles adapters in a former Nokia facility in Chennai, which links supply with nearby buyers. Andhra Pradesh, Karnataka and Tamil Nadu each counted more than 80 million mobile subscribers in August 2026. As a result, the region keeps the largest share of value.
How does the northern subscriber belt add volume?
North India held a 28.4% share of 2025 value and grows at 9.48% a year, because Uttar Pradesh, Delhi and nearby states form the country's largest subscriber belt. Uttar Pradesh East alone counted 112.12 million mobile subscribers in August 2026, the most of any service area. Quick-commerce delivery in Delhi NCR and Lucknow also speeds replacement purchases. In turn, the region generates high unit volumes in economy and mass-market tiers.
Why do western cities favor premium and fast adapters?
West India held a 23.1% share of 2025 value and grows at 9.08% a year, because Mumbai, Pune and Ahmedabad have many premium phone buyers and dense electronics retail. Maharashtra counted 104.99 million mobile subscribers in August 2026, and Mumbai added another 40.77 million. These buyers adopt GaN and Qi2 products early, which lifts average prices. As a result, the region supports a high share of premium adapter sales.
How are eastern and northeastern states adding demand?
East and Northeast India held a 16.3% share of 2025 value and grows fastest at 10.18% a year, because online delivery and dealer networks are reaching more towns. Bihar counted 109.27 million mobile subscribers in August 2026, while West Bengal counted 58.95 million. Many first-time smartphone owners in these states still buy adapters from local mobile shops. In turn, the region gains share from a smaller base.
Launches, standards and policy moves in 2025–2026
| Development | Status and market relevance |
|---|---|
| In February 2025, Portronics launched the Adapto 100, a three-port 100-watt GaN adapter priced at Rs 2,999. | Brings multi-port GaN to mass-premium buyers |
| In February 2025, Blinkit began delivering Apple products and accessories within 10 minutes in 11 Indian cities. | Extends quick commerce to branded accessories |
| In July 2025, the Wireless Power Consortium launched Qi2 25W, with 14 devices certified in the first week. | Sets a faster standard for magnetic wireless pads |
| In February 2026, Stuffcool launched the Nexi 3-in-1 foldable charger with Qi2.2-certified 25-watt output in India. | Brings certified Qi2.2 pads to Indian buyers |
| In July 2026, the Union Cabinet approved a Rs 62,500 crore mobile phone manufacturing scheme for 2026-27 to 2030-31. | Supports local phone and accessory output |
Power delivery, PPS, GaN and Qi2 lift charging speed
- USB Power Delivery negotiates voltage between adapter and phone over a USB-C link, which lets one adapter charge many brands safely.
- Programmable Power Supply adjusts voltage in small steps during charging, which reduces heat and supports fast charging on newer phones.
- Gallium nitride transistors switch power more efficiently than silicon parts, which lets brands build smaller adapters with several ports.
- Qi2 magnetic alignment holds the phone in the right position on a wireless pad, which cuts energy loss and supports 25-watt output.
Need a Custom Version of This Report?
Tailor the scope, geography, or segments to your exact requirements.
- Custom geography or segment scope
- Direct access to our analyst team
Contract makers, phone brands and accessory labels compete
Competition is shaped by contract makers that supply in-box adapters, phone brands that sell their own replacements and accessory labels that sell online and through dealers. Salcomp supplies adapters from its plant in Chennai for major phone brands. Samsung India sells its own 25-watt Power Delivery adaptors as replacements for Galaxy phones. Portronics, Ambrane and Stuffcool compete in GaN, multi-port and Qi2 products through marketplaces, their own websites and electronics stores. Xiaomi, boAt, Zebronics, pTron and Mivi are also tracked in the category. Rivals compete on charging speed, safety certification, size, warranty and price. Because buyers trust phone-brand adapters but compare prices online, firms with certified fast-charging ranges and strong marketplace ratings usually win the most replacement sales.
Which companies supply and sell phone power adapters in India?
| Company | Type | Role in the market |
|---|---|---|
| Salcomp Manufacturing India Pvt. Ltd. | Contract adapter maker | Assembles adapters in a former Nokia facility in Chennai |
| Samsung India Electronics Pvt. Ltd. | Phone brand | Sells a 25-watt USB PD 3.0 PPS travel adaptor in India |
| Portronics Digital Pvt. Ltd. | Accessory brand | Launched the 100-watt Adapto 100 GaN adapter in February 2025 |
| Ambrane India Pvt. Ltd. | Accessory brand | Sells the RAAP G65 adapter with GaNMAX technology |
| Stuffcool | Accessory brand | Launched the Qi2.2-certified Nexi foldable charger in February 2026 |
Credence Research view on Indian phone power adapters
Credence Research's view is that Indian phone power adapters will grow faster than handset volumes, because buyers are trading up to faster, smaller and wireless products. Bundled adapters remain the largest value pool, while wireless pads, GaN adapters and multi-device charging add the fastest growth. A huge subscriber base keeps replacement demand steady, and online channels carry branded products into smaller towns. Brands with certified fast-charging ranges and local assembly should gain the most, while counterfeits and price competition keep pressure on margins.
How the Indian phone power adapter estimate was built
The report uses 2025 as the base year on a calendar basis, and market values come from the Credence Research model. That model combines TRAI subscriber data, official mobile production and export figures, IMF growth data and company product and launch releases. Regional shares follow the client's zone definitions, while segment splits and growth rates are Credence Research estimates. Sources used are official statistics, government releases, standards body announcements, IMF data and company releases reported in trade media, and no interviews or surveys were used.
Faster, smaller and wireless adapters carry growth to 2035
The India mobile chargers market is expected to reach USD 3.64 billion by 2035, a 9.41% CAGR during 2026–2035, as buyers replace older adapters with faster and more flexible products. Growth should be strongest in wireless chargers, GaN fast charging, multi-device charging and East and Northeast India, because these areas gain most from new standards and wider online reach. Local manufacturing incentives will support supply, while counterfeits, imported parts and price competition could slow some sellers.
Frequently Asked Questions
How big is the India mobile chargers market?
Which product type leads Indian phone adapter spending?
Which region leads the Indian market?
How does Qi2 25W affect wireless charging in India?
Why are GaN adapters growing so fast?
Which sales channel leads replacement purchases?
Who are the leading companies in the Indian market?
What are the main challenges for adapter sellers in India?
Table of Content
Chapter 1 Market Segmentation
- 1.1 Segmentation Framework
- 1.1.1 Product and Service Classification
- 1.1.2 Application and End-Use Classification
- 1.1.3 Technology and Solution Classification
- 1.1.4 Customer and Distribution Channel Classification
- 1.1.5 Geographic Segmentation
- 1.1.6 Market Segment Definitions and Boundaries
- 1.2 By Product Type
- 1.2.1 Bundled/In-Box Chargers
- 1.2.2 Standalone Wall Chargers
- 1.2.3 Wireless Chargers
- 1.2.4 Car Chargers
- 1.3 By Technology
- 1.3.1 Conventional Silicon Charging
- 1.3.2 USB Power Delivery and PPS
- 1.3.3 GaN Fast Charging
- 1.3.4 Qi and Qi2 Wireless Charging
- 1.4 By Application
- 1.4.1 Smartphone Charging
- 1.4.2 Feature Phone Charging
- 1.4.3 Multi-Device Charging
- 1.4.4 In-Vehicle Charging
Chapter 2 Introduction
- 2.1 Report Objectives and Scope
- 2.2 Product Definition and Industry Terminology
- 2.3 Market Inclusions and Exclusions
- 2.4 Research Process
- 2.4.1 Primary Research and Expert Interviews
- 2.4.2 Secondary Research and Source Review
- 2.4.3 Top-Down and Bottom-Up Estimation
- 2.4.4 Data Triangulation and Verification
- 2.5 Market Size Measurement Basis
- 2.5.1 2025: USD 1.53 billion → 2035: USD 3.64 billion
- 2.6 Historical and Forecast Reference Periods
- 2.6.1 Historical Period: 2018-2025
- 2.6.2 Base Year: 2025
- 2.6.3 Forecast Period: 2025-2035
- 2.7 Research Assumptions and Limitations
Chapter 3 Executive Summary
- 3.1 Market Snapshot and Key Findings
- 3.2 Base-Year Market Size, 2025
- 3.3 Forecast Market Size, 2035
- 3.4 Revenue and Volume Growth Outlook
- 3.5 Key Demand and Supply Indicators
- 3.6 Leading Market Segments
- 3.7 Fastest-Growing Market Opportunities
- 3.8 Regional Performance Highlights
- 3.9 Technology and Industry Transformation
- 3.10 Competitive Landscape Summary
- 3.11 Analyst View and Strategic Implications
Chapter 4 India Mobile Chargers Market Trends and Developments
- 4.1 Historical Industry Development, 2018-2025
- 4.2 Recent Market Trends and Developments
- 4.3 Demand and Customer Behavior Trends
- 4.4 Technology and Product Innovation
- 4.5 Artificial Intelligence, Automation and Digitalization
- 4.6 Local Manufacturing and Supply Chain Realignment
- 4.7 Industry Partnerships, Mergers and Acquisitions
- 4.8 Sustainability and Circular Economy Developments
- 4.9 Government and Private Sector Investment Trends
- 4.10 Emerging Business Models and Commercialization
- 4.11 Industry Developments and Announcements
Chapter 5 India Mobile Chargers Market Production, Supply and Demand Analysis
- 5.1 Demand Trend and Consumption Analysis, 2018-2025
- 5.2 Demand Forecast, 2025-2035
- 5.3 Production and Output Trend, 2018-2025
- 5.4 Production and Output Forecast, 2025-2035
- 5.5 Installed Capacity and Capacity Utilization
- 5.6 Company-Wise Production Plants and Statistics
- 5.6.1 Installed Production Capacity
- 5.6.2 Actual Production
- 5.6.3 Planned Capacity and Expansion Targets
- 5.7 Supply Chain Structure and Procurement Trends
- 5.8 Supply-Demand Gap and Bottlenecks
- 5.9 Import Dependence and Sourcing Structure
- 5.10 Contract Manufacturing and Outsourcing
- 5.11 Regional Supply and Demand Concentration
Chapter 6 India Mobile Chargers Market Pricing Analysis
- 6.1 Pricing Structure and Measurement
- 6.2 Historical Pricing Trends, 2018-2025
- 6.3 Pricing Outlook, 2025-2035
- 6.4 Average Selling Price and Unit Economics
- 6.5 Pricing by Product and Market Segment
- 6.6 Geographic Pricing Differences
- 6.7 Key Input, Energy, Labor and Logistics Costs
- 6.8 Contract Pricing and Purchasing Models
- 6.9 Pricing Sensitivity and Competitive Positioning
- 6.10 Price, Margin and Profitability Implications
Chapter 7 India Mobile Chargers Market Dynamics
- 7.1 Market Growth Drivers
- 7.1.1 Demand-Side Drivers
- 7.1.2 Technology and Innovation Drivers
- 7.1.3 Infrastructure and Investment Drivers
- 7.1.4 Regulatory and Policy Drivers
- 7.2 Market Restraints
- 7.2.1 Cost and Affordability Constraints
- 7.2.2 Technology and Adoption Barriers
- 7.2.3 Supply Chain and Operational Constraints
- 7.3 Market Challenges
- 7.3.1 Competitive Pressure and Margin Erosion
- 7.3.2 Skills, Infrastructure and Implementation Gaps
- 7.4 Emerging Market Opportunities
- 7.5 Market Dynamics Impact and Time-Horizon Assessment
Chapter 8 India Mobile Chargers Value Chain Analysis
- 8.1 Industry Value Chain Overview
- 8.2 Upstream Suppliers and Critical Inputs
- 8.3 Technology and Component Providers
- 8.4 Manufacturing or Service Delivery
- 8.5 Distribution, Channel Partners and Integrators
- 8.6 Downstream Applications and End Users
- 8.7 Value Addition and Profit Pools
- 8.8 Vertical Integration and Outsourcing
- 8.9 Supplier Concentration and Risk
- 8.10 Supply Chain Localization and Resilience
Chapter 9 India Mobile Chargers Market Regulations and Policies
- 9.1 Relevant Laws, Standards and Compliance Frameworks
- 9.2 Product, Service, Safety and Quality Requirements
- 9.3 Government Policies, Incentives and Subsidies
- 9.4 Imports, Exports and Trade Barriers
- 9.5 Public Procurement and Local Content Requirements
- 9.6 Environmental and Sustainability Compliance
- 9.7 Upcoming Policy Changes and Market Implications
Chapter 10 India Mobile Chargers Market Hotspots and Opportunities
- 10.1 Market Opportunity Mapping and Growth Hotspots
- 10.2 High-Growth Applications and Customer Groups
- 10.3 Underserved Markets and White-Space Opportunities
- 10.4 Emerging Technology and Product Opportunities
- 10.5 New Capacity and Investment Hotspots
- 10.6 Market Entry and Expansion Opportunities
- 10.7 Distribution and Partnership Opportunities
- 10.8 Near-Term and Long-Term Commercial Potential
- 10.9 Opportunity Attractiveness and Execution Risks
Chapter 11 India Mobile Chargers Market Outlook, 2025-2035
- 11.1 Market Size and Analysis
- 11.1.1 Revenue (Market Measurement: 2025: USD 1.53 billion → 2035: USD 3.64 billion)
- 11.1.2 Market Volume and Quantity Sold
- 11.1.3 Historical Market Size, 2018-2025
- 11.1.4 Base-Year Market Size, 2025
- 11.2 Market Forecast, 2025-2035
- 11.2.1 Revenue Forecast to 2035
- 11.2.2 Volume Forecast to 2035
- 11.2.3 CAGR and Year-on-Year Growth
- 11.2.4 Incremental Revenue Opportunity
- 11.3 Forecast Assumptions and Scenario Analysis
- 11.3.1 Base-Case Forecast
- 11.3.2 Optimistic and Conservative Scenarios
- 11.3.3 Technology, Pricing and Policy Sensitivities
- 11.4 Market Attractiveness and Growth Outlook
Chapter 12 India Mobile Chargers Market Segmentation and Outlook
- 12.1 Segmentation Summary and Market Shares, 2025
- 12.2 Largest and Fastest-Growing Segments
- 12.3 By Product Type - Market Size and Forecast, 2025-2035
- 12.3.1 Segment Definition and Scope
- 12.3.2 Historical Market Size, 2018-2025
- 12.3.3 Revenue Forecast, 2025-2035
- 12.3.4 Volume Forecast, 2025-2035
- 12.3.5 Base-Year Market Share, 2025
- 12.3.6 Segment CAGR and Growth Drivers
- 12.3.7 Subsegment Market Size and Forecast
- 12.3.7.1 Bundled/In-Box Chargers
- 12.3.7.2 Standalone Wall Chargers
- 12.3.7.3 Wireless Chargers
- 12.3.7.4 Car Chargers
- 12.3.8 Subsegment Pricing and Adoption Trends
- 12.3.9 Leading Suppliers and Competition
- 12.3.10 Regional Demand and Opportunities
- 12.4 By Technology - Market Size and Forecast, 2025-2035
- 12.4.1 Segment Definition and Scope
- 12.4.2 Historical Market Size, 2018-2025
- 12.4.3 Revenue Forecast, 2025-2035
- 12.4.4 Volume Forecast, 2025-2035
- 12.4.5 Base-Year Market Share, 2025
- 12.4.6 Segment CAGR and Growth Drivers
- 12.4.7 Subsegment Market Size and Forecast
- 12.4.7.1 Conventional Silicon Charging
- 12.4.7.2 USB Power Delivery and PPS
- 12.4.7.3 GaN Fast Charging
- 12.4.7.4 Qi and Qi2 Wireless Charging
- 12.4.8 Subsegment Pricing and Adoption Trends
- 12.4.9 Leading Suppliers and Competition
- 12.4.10 Regional Demand and Opportunities
- 12.5 By Application - Market Size and Forecast, 2025-2035
- 12.5.1 Segment Definition and Scope
- 12.5.2 Historical Market Size, 2018-2025
- 12.5.3 Revenue Forecast, 2025-2035
- 12.5.4 Volume Forecast, 2025-2035
- 12.5.5 Base-Year Market Share, 2025
- 12.5.6 Segment CAGR and Growth Drivers
- 12.5.7 Subsegment Market Size and Forecast
- 12.5.7.1 Smartphone Charging
- 12.5.7.2 Feature Phone Charging
- 12.5.7.3 Multi-Device Charging
- 12.5.7.4 In-Vehicle Charging
- 12.5.8 Subsegment Pricing and Adoption Trends
- 12.5.9 Leading Suppliers and Competition
- 12.5.10 Regional Demand and Opportunities
- 12.6 Segment Growth Comparison
- 12.7 Segment Attractiveness and Priority Matrix
Chapter 13 India Mobile Chargers End-Use and Application Market Outlook
- 13.1 End-Use Industry and Customer Demand Structure
- 13.2 Leading Applications and Customer Groups
- 13.3 End-Use Market Size, Share and Forecast
- 13.4 Major End-Use Industry Deep Dives
- 13.4.1 Customer Requirements and Use Cases
- 13.4.2 Demand and Replacement Cycles
- 13.4.3 Technical and Regulatory Considerations
- 13.4.4 Purchasing and Procurement Models
- 13.4.5 Leading Vendors and Distribution Channels
- 13.4.6 Forecast and Commercial Opportunities
- 13.5 Emerging Applications and Cross-Segment Demand
- 13.6 End-Use Industry Investment Priorities
Chapter 14 India Mobile Chargers Geographic Market Outlook, 2025-2035
- 14.1 Domestic Market Distribution and Demand Clusters
- 14.2 State- or Province-Wise Market Size and Forecast, 2025-2035
- 14.3 City and Metropolitan Market Outlook
- 14.4 Industrial, Manufacturing and Commercial Clusters
- 14.5 Geographic Concentration of Key End Users
- 14.6 Local Pricing and Purchasing Differences
- 14.7 Domestic Production Facilities and Capacity Map
- 14.8 Local Infrastructure and Project Pipeline
- 14.9 State-Level Policy and Incentive Differences
- 14.10 Subnational Investment Hotspots and Opportunities
- 14.11 Distribution and Logistics Networks
- 14.12 Domestic Competitive Footprint
Chapter 15 India Mobile Chargers Technology, Innovation and Sustainability Outlook
- 15.1 Technology Landscape and Maturity
- 15.2 Product, Process and Service Innovation
- 15.3 AI, Automation and Digital Tools in the Industry
- 15.4 Technology Adoption and Performance Benchmarking
- 15.5 Innovation Pipeline and R&D Investment
- 15.6 Patent and Intellectual Property Trends
- 15.7 Energy Efficiency and Resource Management
- 15.8 Sustainability, Recycling and Circularity
- 15.9 Technology Roadmap, 2025-2035
- 15.10 Risks of Obsolescence and Technology Substitution
Chapter 16 India Mobile Chargers Market Key Strategic Imperatives
- 16.1 Growth and Market Entry Priorities
- 16.2 High-Return Products and Segments
- 16.3 Pricing, Profitability and Cost Optimization
- 16.4 Technology Investment and Product Differentiation
- 16.5 Supply Chain Localization and Resilience
- 16.6 Distribution and Customer Acquisition
- 16.7 Partnership, Acquisition and Capacity Strategy
- 16.8 Regional Expansion Priorities
- 16.9 Short-, Medium- and Long-Term Actions
Chapter 17 Competition Outlook
- 17.1 Industry Competition Characteristics
- 17.2 Market Structure and Concentration
- 17.3 Market Share and Competitive Positioning, 2025
- 17.4 Company-Wise Revenue and Product Benchmarking
- 17.5 Production and Service Capacity Benchmarking
- 17.6 Technology, Pricing and Differentiation
- 17.7 Regional Footprint and Distribution Strength
- 17.8 Mergers, Acquisitions and Strategic Alliances
- 17.9 New Entrants and Competitive Threats
- 17.10 Porter's Five Forces and Industry Attractiveness
- 17.11 Competitive Outlook, 2025-2035
Chapter 18 Company Profiles
- 18.1 Company Coverage and Selection Criteria
- 18.2 Salcomp Manufacturing India Pvt. Ltd.
- 18.2.1 Business Description
- 18.2.2 Company Ownership and Geographic Presence
- 18.2.3 Product and Service Portfolio
- 18.2.4 Manufacturing and Operating Footprint
- 18.2.5 Production Capacity and Expansion Plans
- 18.2.6 Financial Performance and Investment
- 18.2.7 Market Share and Competitive Position
- 18.2.8 Technology and Innovation Capabilities
- 18.2.9 Strategic Alliances or Partnerships
- 18.2.10 Recent Developments
- 18.2.11 Growth Strategy and Outlook
- 18.3 Samsung India Electronics Pvt. Ltd.
- 18.4 Xiaomi Technology India Pvt. Ltd.
- 18.5 Portronics Digital Pvt. Ltd.
- 18.6 Ambrane India Pvt. Ltd.
- 18.7 boAt / Imagine Marketing Ltd.
- 18.8 Zebronics India Pvt. Ltd.
- 18.9 pTron / Palred Electronics Pvt. Ltd.
- 18.10 Mivi / Seminole Electronics Pvt. Ltd.
- 18.11 Stuffcool
- 18.12 Other Relevant Market Participants
Note: Every listed company is profiled on the structure shown under the first company. The company list is preliminary and may change based on research findings, market developments, data availability and client requirements.
Chapter 19 Disclaimer
- 19.1 Research and Forecast Disclaimer
- 19.2 Data Source and Estimation Limitations
Note: The depth of individual sections depends on data availability for this market. Volume, capacity, trade and other unit-based metrics are included where applicable.

