
Pay equity rules and AI tools put workforce data to work
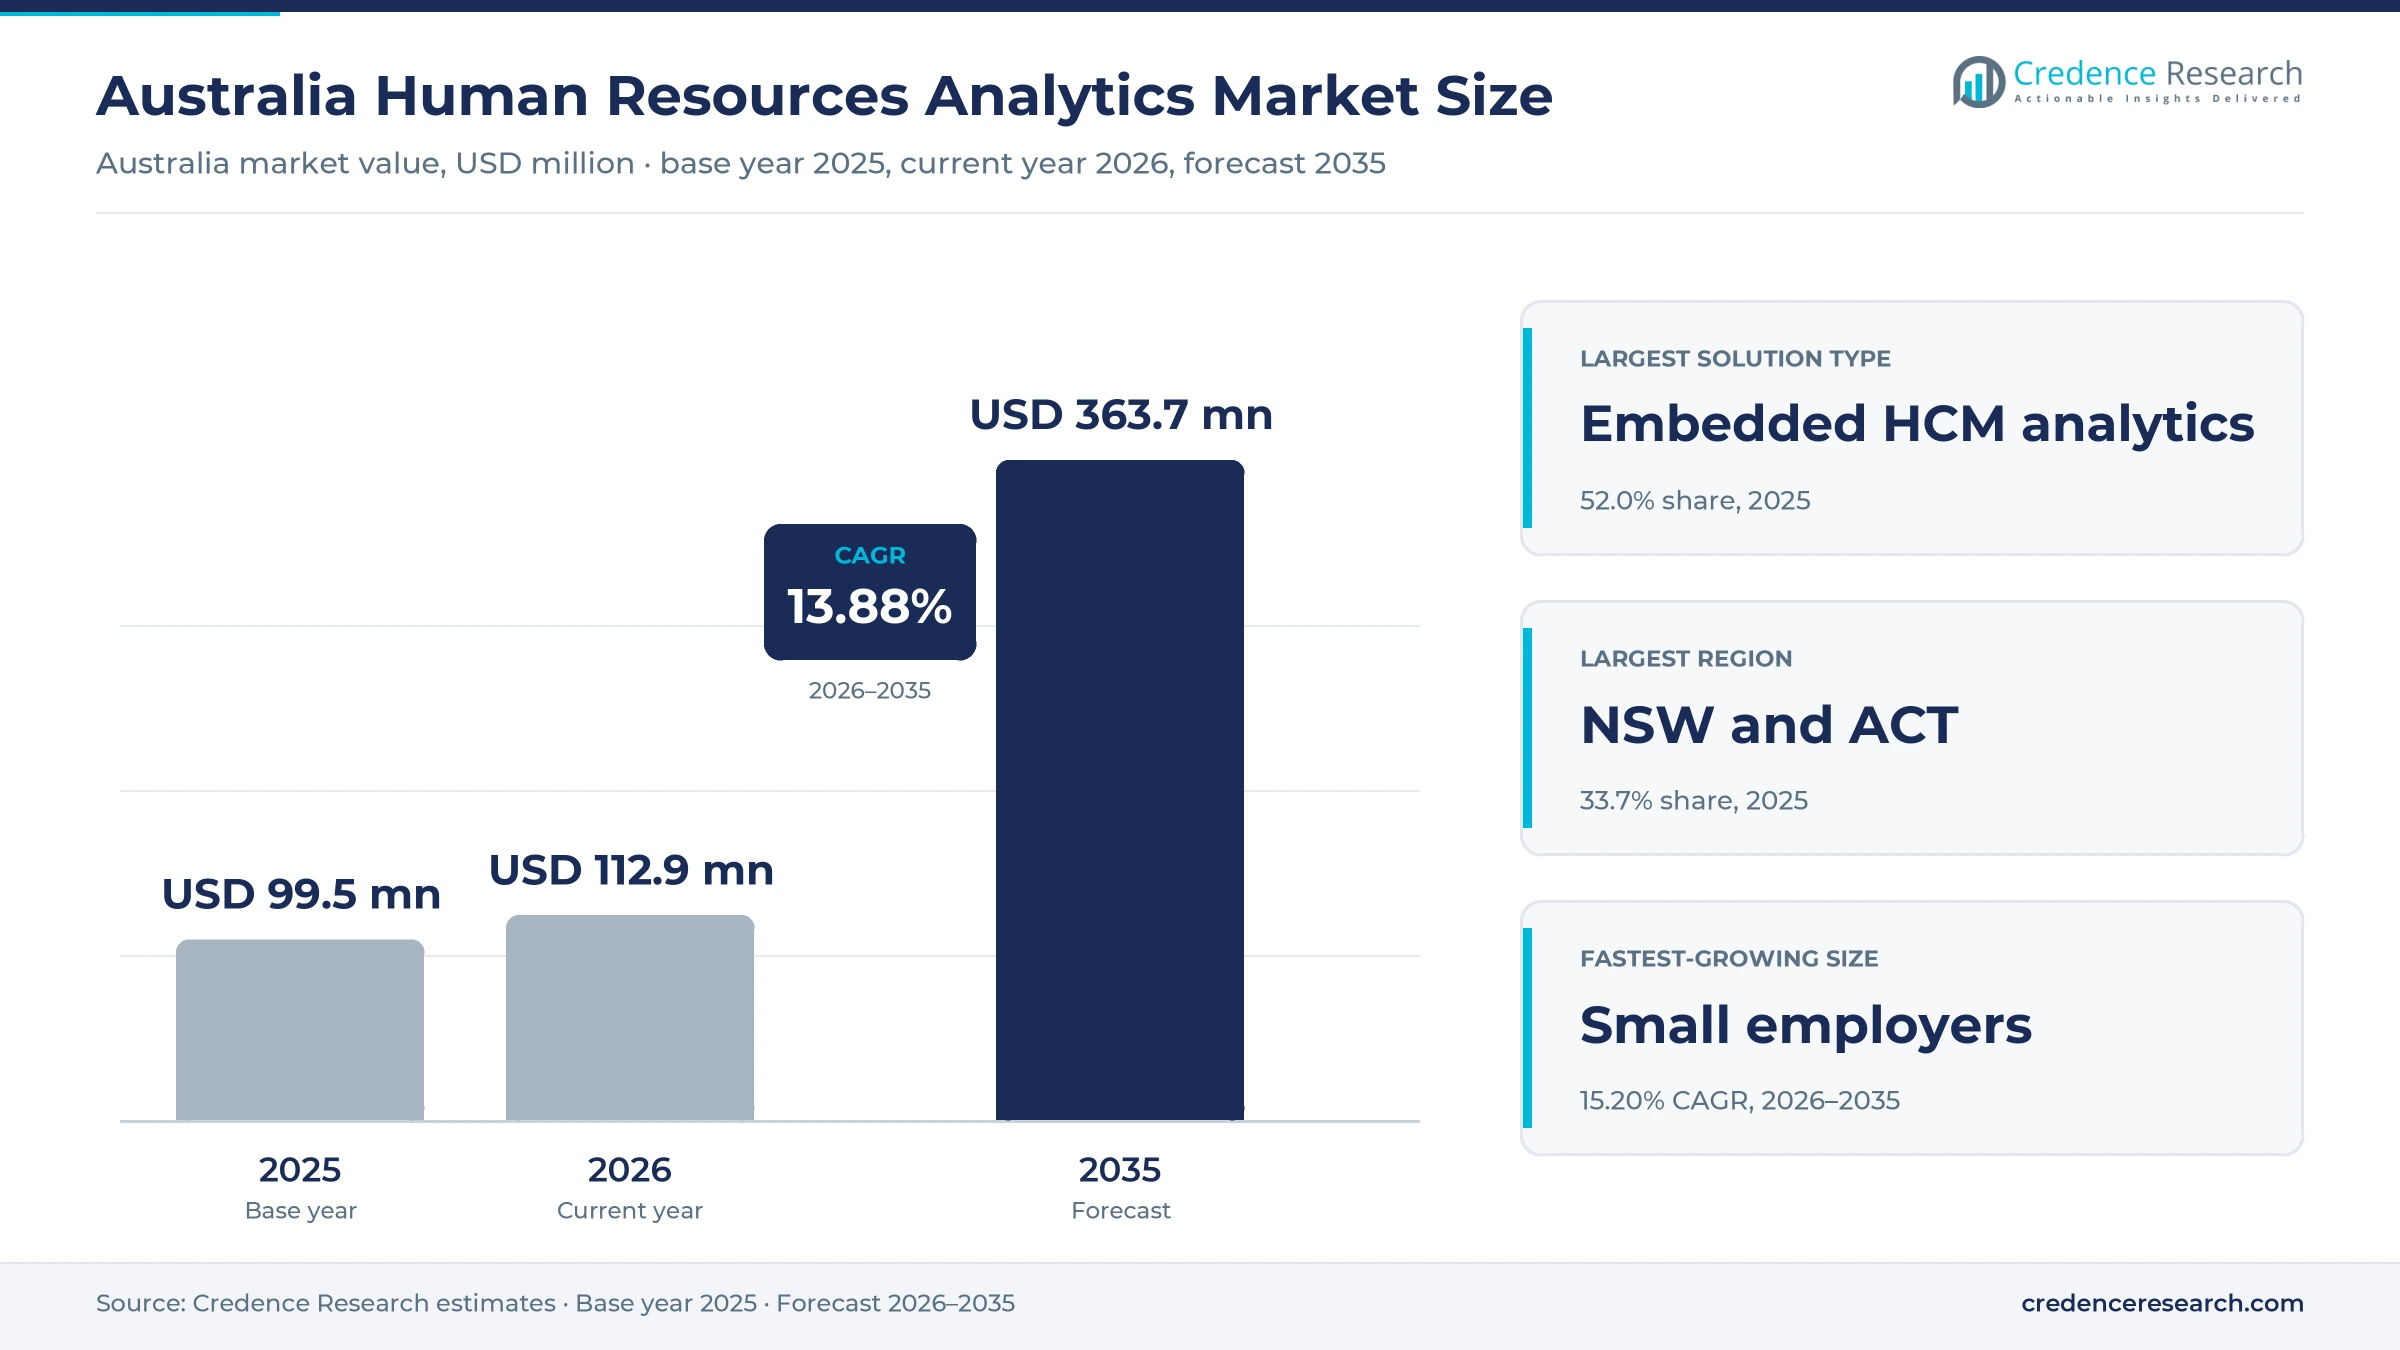
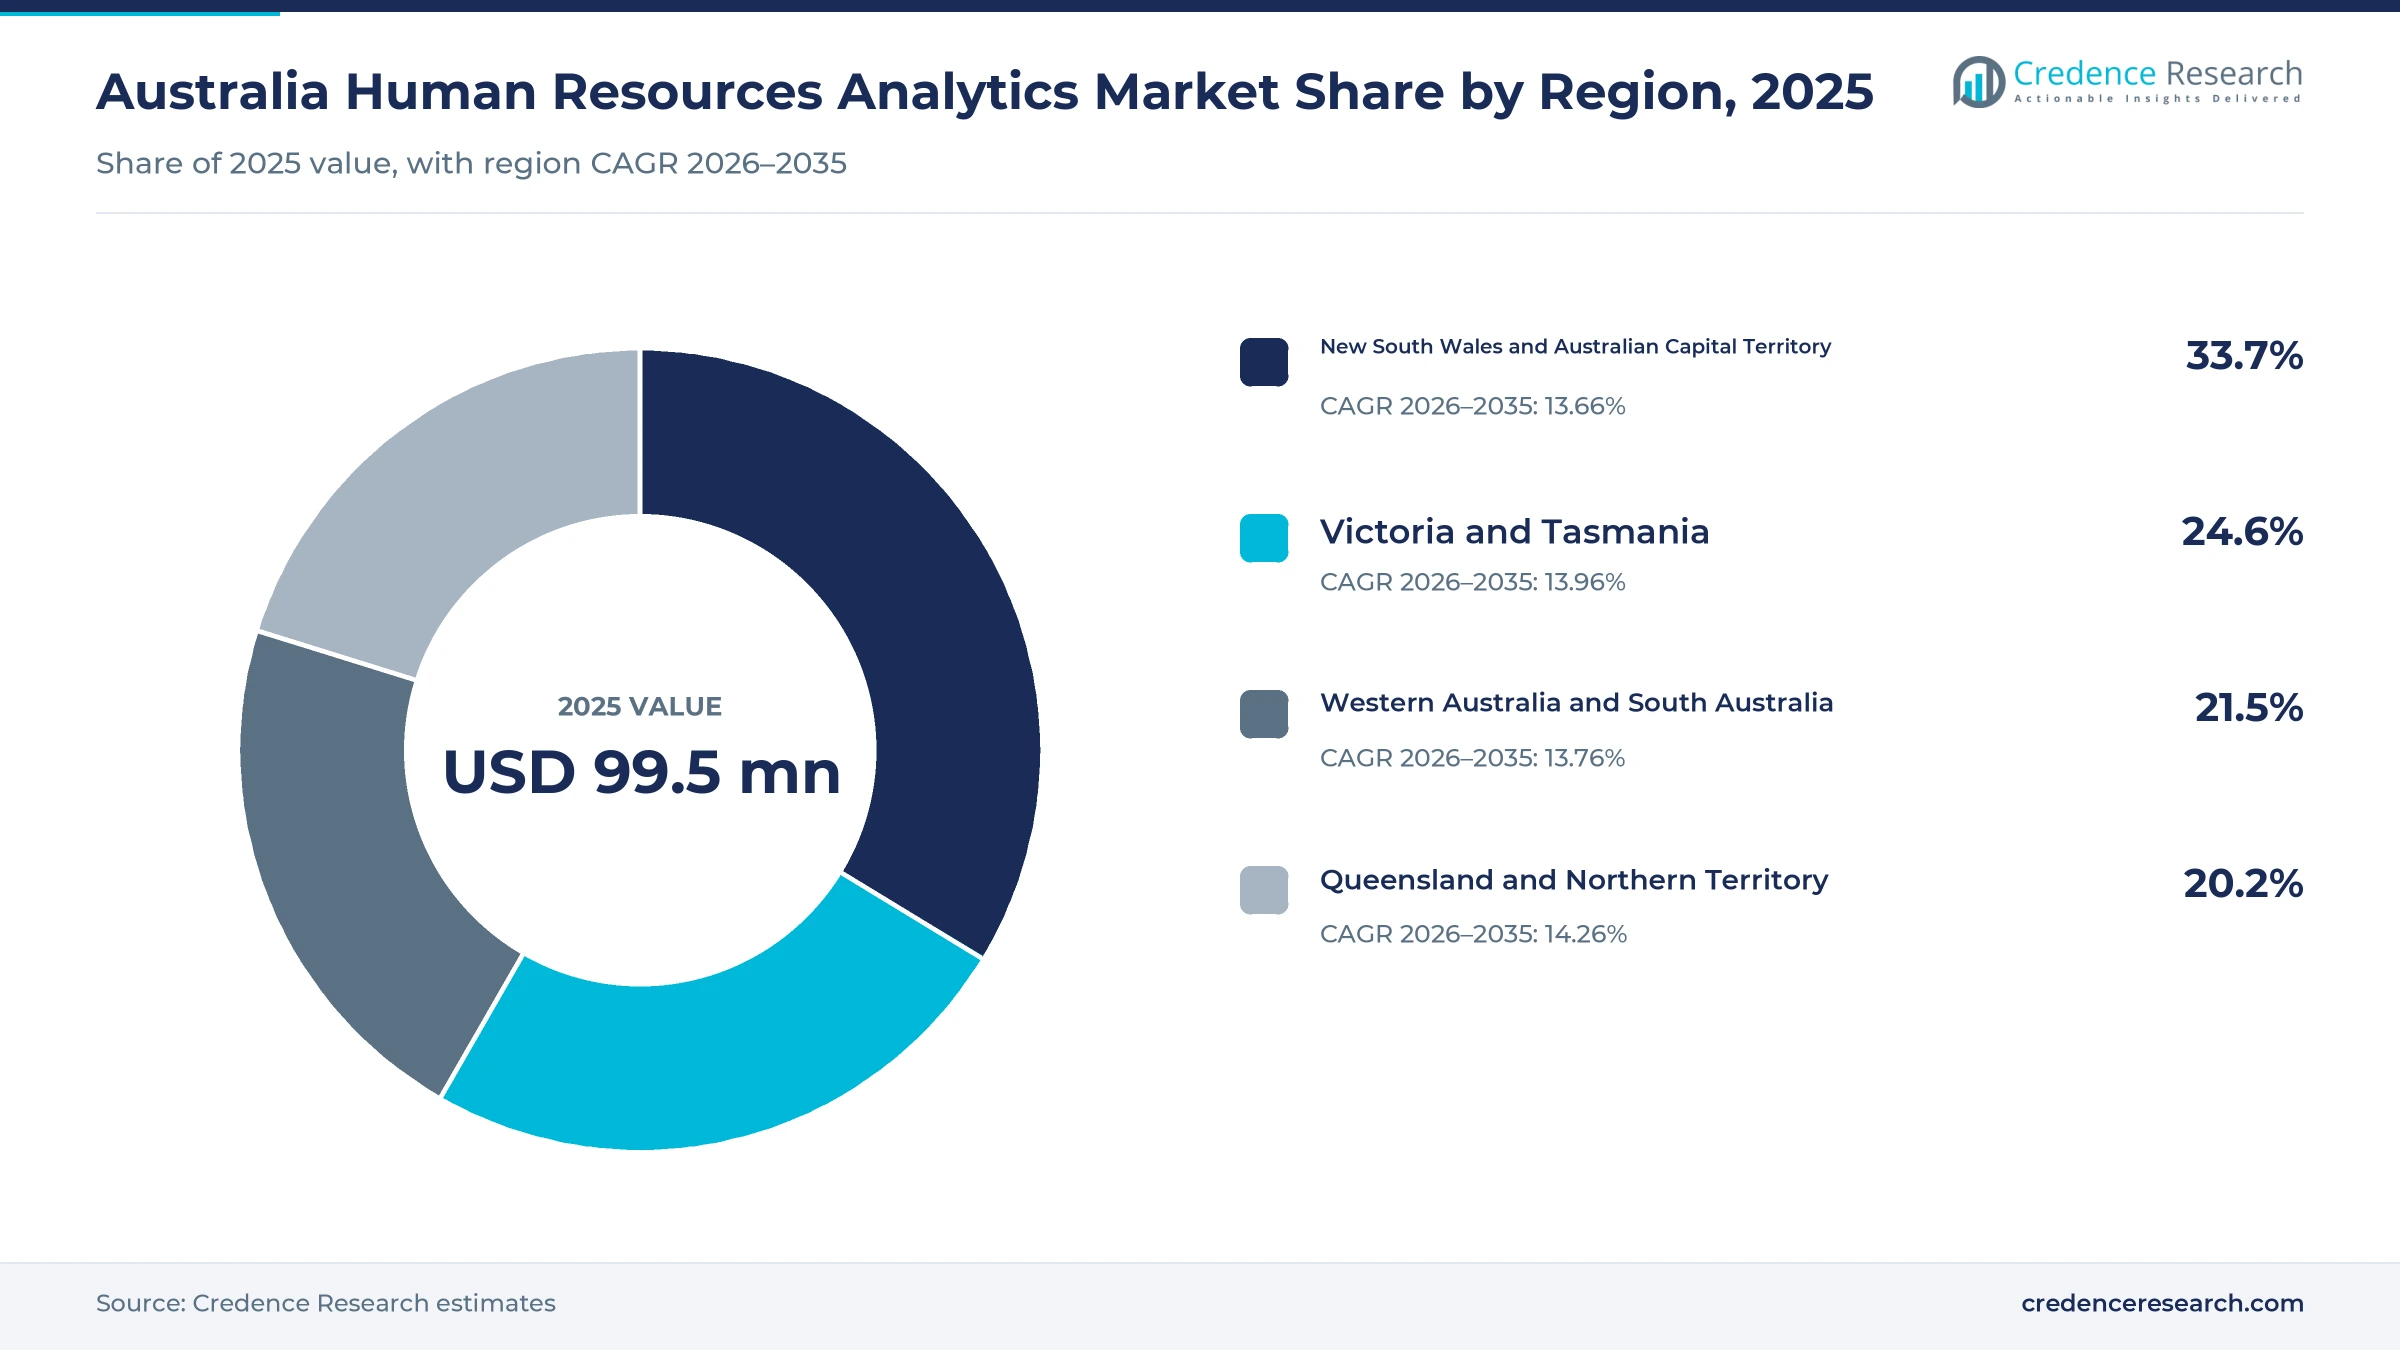
The Australia human resources analytics market was valued at USD 99.5 million in 2025 and is projected to increase from USD 112.9 million in 2026 to USD 363.6 million by 2035, registering a CAGR of 13.88% during 2026–2035. Demand comes from employers that must report workforce data to regulators, track pay equity, manage psychosocial risk and plan headcount with tighter budgets. New South Wales and Australian Capital Territory held the largest regional share, 33.7% in 2025, because Sydney and Canberra host most head offices, financial firms and federal agencies. Queensland and Northern Territory grows fastest at 14.26% a year, as health, mining and public service employers add reporting tools. Employers with 500 or more staff selected gender equality targets for the first time between April 1 and May 31, 2026. As a result, pay, promotion and headcount data now reach boards more often, and analytics modules inside core HR suites gain steady use.
Which workforce analytics spending is counted in Australia?
The estimate measures spending by employers in Australia on software and services that turn payroll, hiring, performance, learning and safety records into reports, dashboards and forecasts. It covers analytics modules embedded in human capital management suites, standalone people analytics platforms and the professional services that set up data models and reports. Values are stated in USD million at current prices and exclude taxes.
The estimate excludes core payroll processing fees, recruitment advertising and general business intelligence tools that are not used for workforce data. The value chain runs from payroll, rostering and HR systems through data integration and analytics layers to HR teams, line managers, boards and the regulators that receive workforce reports.
Australia Human Resources Analytics Market Insights
- The Australia human resources analytics market was valued at USD 99.5 million in 2025 and is projected to reach USD 363.6 million by 2035, registering a CAGR of 13.88% during 2026–2035.
- New South Wales and Australian Capital Territory held 33.7% of 2025 value, because Sydney and Canberra host most head offices and federal agencies.
- Embedded HCM analytics led with 52.0% of 2025 value, since most employers first use the reports built into the HR suites they already run.
- The national gender pay gap regulator published employer pay gaps for around 8,500 employers on March 3, 2026, raising scrutiny of workforce data.
- Small employers grow fastest at 15.20% a year during 2026–2035, as cloud payroll platforms switch on reporting modules for small teams.
Embedded suite analytics and planning tools lead spending
Why do embedded suite analytics lead spending?
Based on solution type, the market is categorized into embedded HCM analytics, standalone people analytics and analytics professional services. Embedded HCM analytics led with 52.0% of 2025 value, because most employers first use the reports built into the payroll and HR suites they already license. Standalone people analytics grows fastest at 14.69% a year, as larger employers combine data from several systems and ask questions in plain English. Human resources analytics demand from these buyers can widen as tools such as ELMO Insights, introduced in January 2026, spread.
Which workforce questions draw the most analytics spend?
Based on application, the market is categorized into workforce planning and retention analytics, talent acquisition analytics, performance and learning analytics and compliance and workforce risk analytics. Workforce planning and retention analytics led with 34.0% of 2025 value, because headcount cost and staff turnover are the first questions boards ask. Compliance and workforce risk analytics grows fastest at 14.77% a year, as pay equity, payroll timing and psychosocial safety rules require repeatable evidence.
How does employer size shape analytics adoption?
Based on enterprise size, the market is categorized into large employers, medium employers and small employers. Large employers led with 58.0% of 2025 value, because employers with 100 or more staff must report workforce data to the national gender equality regulator each year. Small employers grow fastest at 15.20% a year, as cloud payroll platforms add simple reporting modules that small teams can switch on without analysts.
| Segment Group | Leading Sub-segment | Share, 2025 | Fastest-growing Sub-segment | CAGR, 2026–2035 |
|---|---|---|---|---|
| By Solution Type | Embedded HCM analytics | 52.0% | Standalone people analytics | 14.69% |
| By Application | Workforce planning and retention analytics | 34.0% | Compliance and workforce risk analytics | 14.77% |
| By Enterprise Size | Large employers | 58.0% | Small employers | 15.20% |
Request a Free Sample
Fill in your details and we'll send you a free sample report.
- Sample data tables & charts
- Research methodology
Reporting duties, AI access and small firms lift demand
How does compliance-led workforce assurance lift demand?
Compliance-led workforce assurance lifts demand, because employers now need verified workforce data for regulators, boards and the public. The gender equality regulator published pay gaps for around 8,500 private and Commonwealth public sector employers on March 3, 2026, according to the Workplace Gender Equality Agency. The national mid-point gap in average total remuneration stood at 12.1%, and half of all employers had a larger gap. Employers with 500 or more staff also selected gender equality targets for the first time between April 1 and May 31, 2026. As a result, HR teams need repeatable pay, promotion and headcount reports rather than one-off spreadsheets. This need explains why compliance and workforce risk analytics grows fastest among applications at 14.77% a year.
Why does AI-assisted access widen use of workforce data?
AI-assisted analytical access widens the use of workforce data, because managers can now ask questions in plain English instead of waiting for analysts. About 43% of small and medium businesses reported some AI adoption between December 2025 and February 2026, according to national AI adoption data. Among adopters, 54% use or plan to use AI for data analytics, the joint most common use with content generation. In January 2026, ELMO Software introduced ELMO Insights, which turns plain-English questions about turnover or time to hire into visual answers. Workday followed in October 2026 with Autopilot agents that run routine HR, finance and IT tasks in the background. Consequently, standalone people analytics grows fastest among solution types at 14.69% a year.
How is SME module activation adding new buyers?
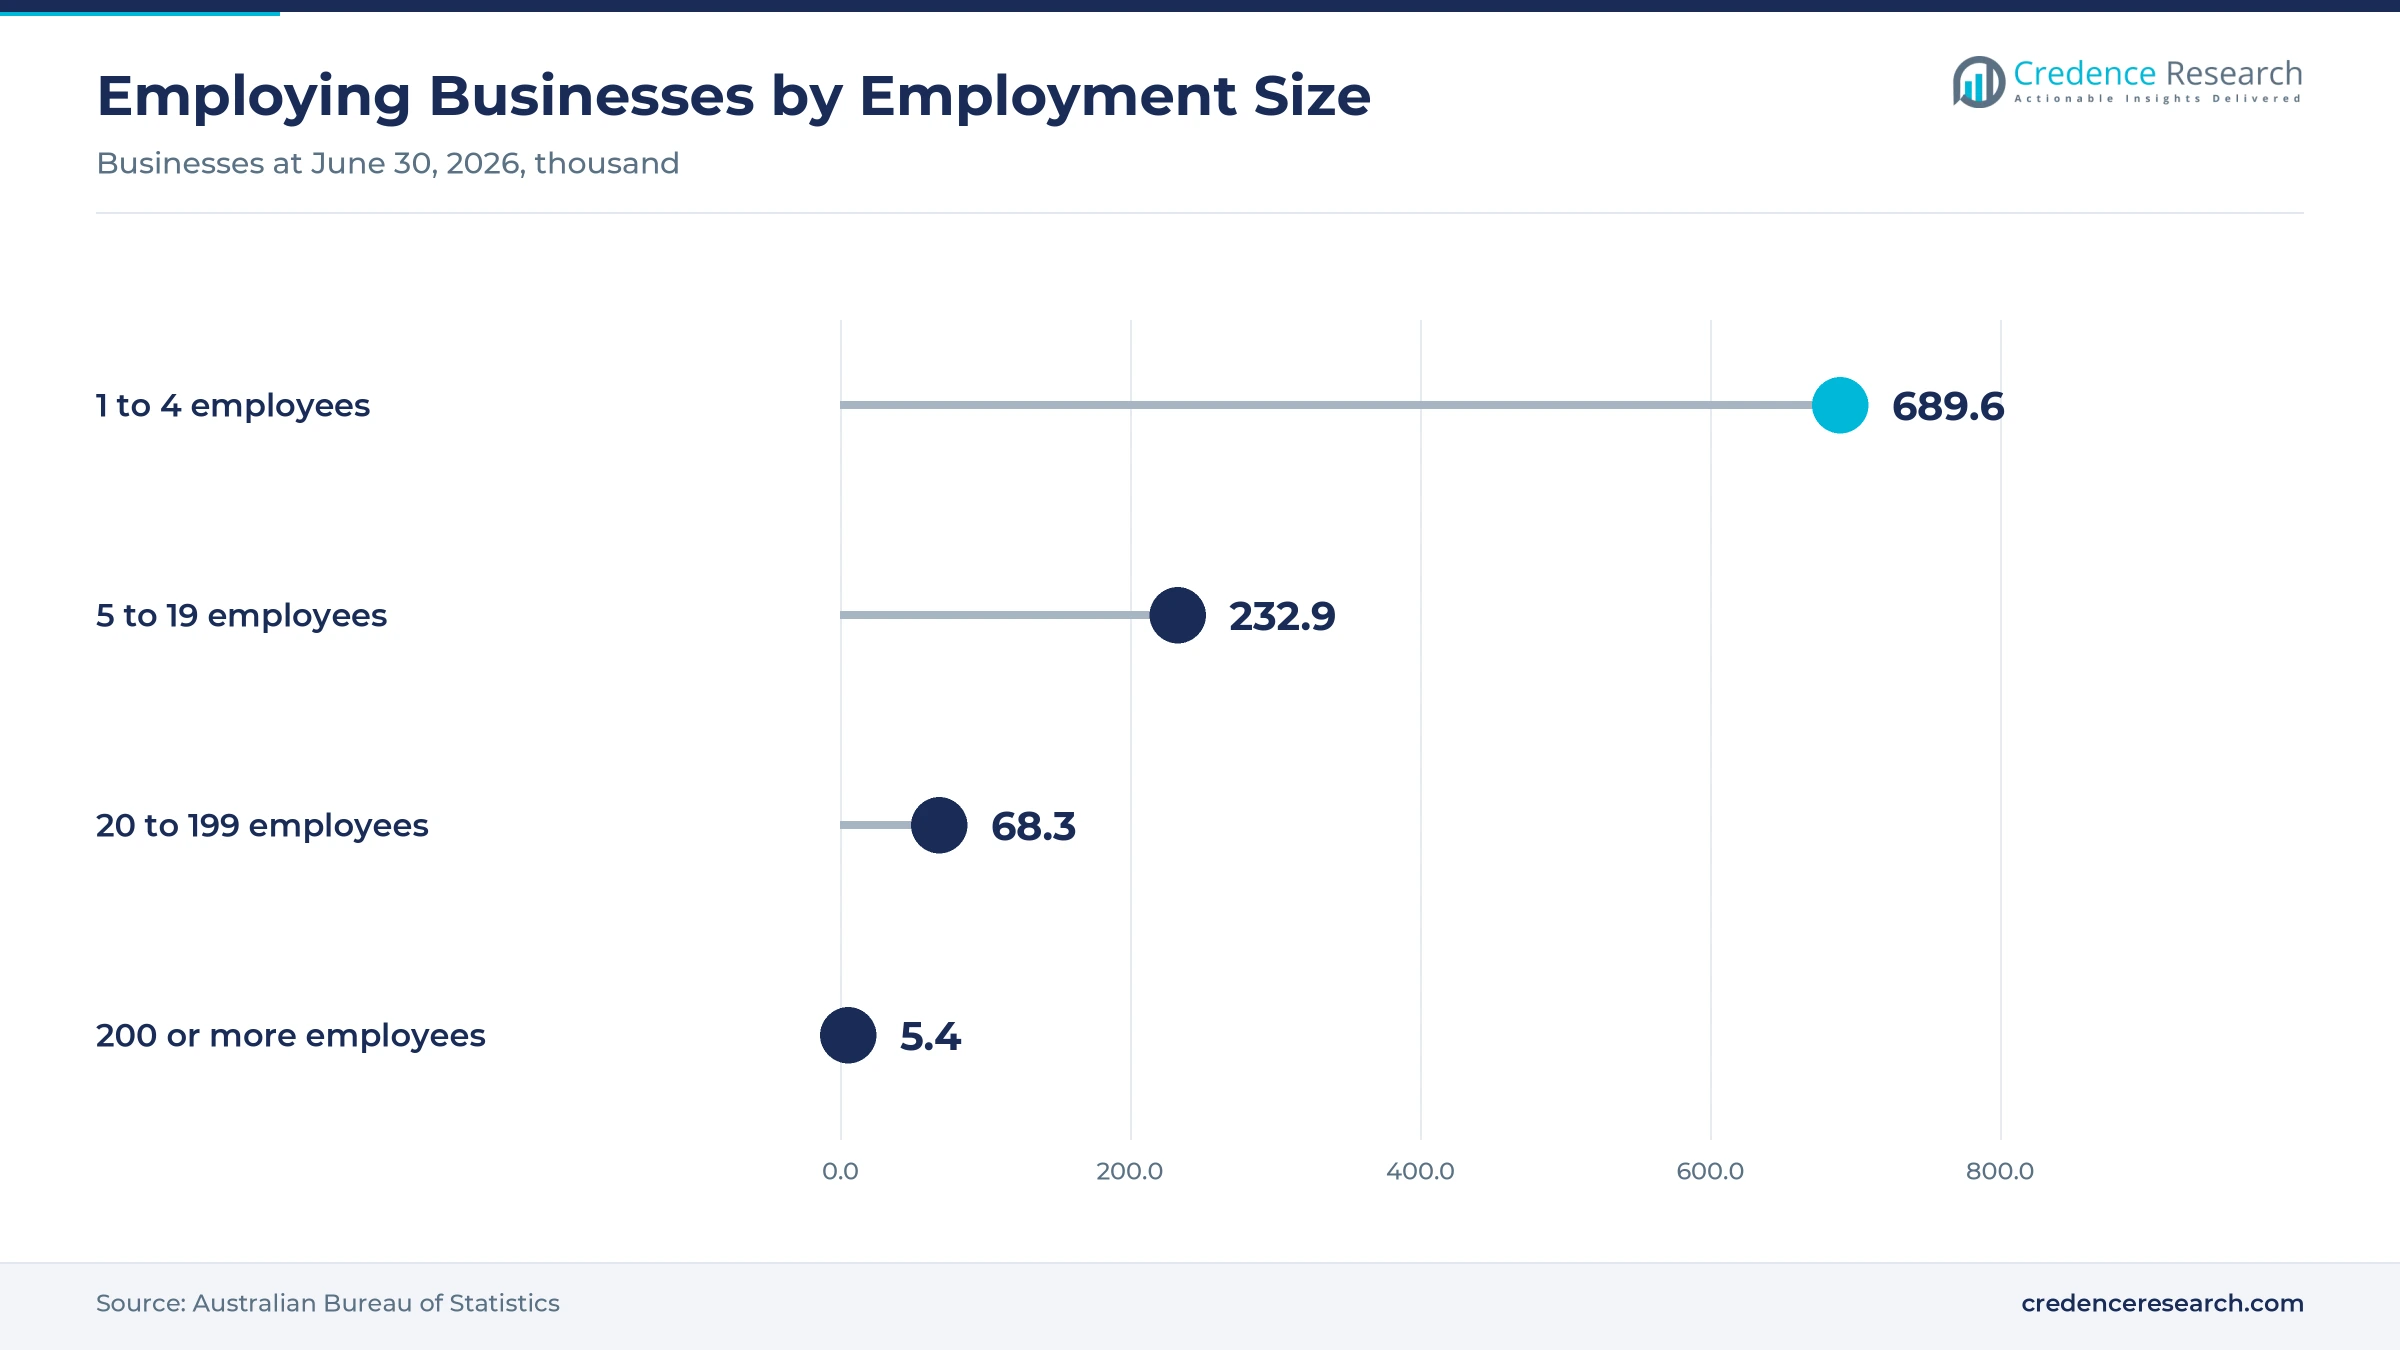
SME module activation adds new buyers, because small employers increasingly switch on reporting modules inside the payroll and HR tools they already use. Australia had 996,203 employing businesses at June 30, 2026, the first net increase since 2021–22, according to official business counts. Of these, 922,512 employed fewer than 20 people, which gives software vendors a very large base of potential module users. Employment Hero reported more than 350,000 businesses and about two million employees on its platform in February 2025. Humanforce said in April 2026 that it serves 1,800 customers and is heading toward one million employees under management. As a result, small employers grow fastest by size at 15.20% a year, although large employers still hold 58.0% of 2025 value.
Why do payroll and safety rules raise data needs?
Payroll and workplace safety rules raise data needs, because employers must prove timely payments and active control of psychosocial risk. From July 1, 2026, employers must pay superannuation so it reaches workers' funds within seven business days of payday, according to the Fair Work Ombudsman. Victoria's psychological health regulations took effect on Dec. 1, 2025, and require employers to identify and control hazards such as bullying and aggression. In the last financial year, only 42% of Victorian workers with a mental injury returned to work within six months, compared with 75% for physical injuries. Consequently, employers link payroll, leave and incident data to spot risk earlier, often through workforce management software that already holds rosters and hours.
AI governance and frontline platforms reshape buying
How is the rise of AI governance shaping vendor choice?
AI governance is rising as a buying factor, because employers want proof that HR tools treat personal data and automated decisions responsibly. In June 2026, ELMO Software said it planned to become the first HR platform headquartered in Australia and New Zealand with ISO/IEC 42001 AI governance certification. The company reported 1.2 million users across Australia, New Zealand and the United Kingdom at the same time. From Dec. 10, 2026, privacy policies must describe personal information used in automated decisions that significantly affect individuals, and the privacy regulator issued guidance on Sept. 30, 2026. As a result, vendors that document model use, data sources and human review gain an edge in tenders. This shift also supports analytics professional services, as employers seek help mapping automated hiring and promotion decisions.
Why is the shift toward frontline workforce platforms rising?
The shift toward frontline workforce platforms is rising, because shift-based employers want rosters, hiring and labor cost data in one place. Humanforce launched Humanforce Connect on April 13, 2026, combining compliant rostering, internal shift filling, private work marketplaces and agency management in one system. The company built this platform through acquisitions that include Emprevo, ShiftMatch and LiveHire, after buying IntelliHR in 2023. The national labor force reached about 15.13 million people in 2025, up from 14.91 million in 2024, according to World Bank data. In turn, health, aged care, retail and hospitality employers gain clearer views of fill rates and overtime. Workforce planning and retention analytics, the largest application with 34.0% of 2025 value, gains most from this change.
Can gender equality targets open advisory work?
Gender equality targets open a clear opening for advisory and analytics services, because many employers lack the internal skills to model pay and promotion gaps. The targets law applies to nearly 2,000 employers that together employ 3.9 million people, according to the gender equality regulator's March 2025 statement. Private sector employers selected their targets during the 2025–26 reporting window, which closed on May 31, 2026. Almost 80% of chief executives in Australia are men, which keeps leadership pipelines under close board scrutiny. Consequently, analytics professional services can sell pay equity reviews, promotion audits and target tracking to medium and large employers. Vendors of talent management software can add succession views that support these targets.
Is there room to grow in hiring analytics as jobs slow?
Talent acquisition analytics offers a second opening, because employers want better hiring decisions when job growth slows. Employment fell by 39,300 people to 14,782,700 in September 2026, and the unemployment rate rose to 4.7% in seasonally adjusted terms. Larger applicant pools mean recruiters must screen more candidates for each role, which raises demand for shortlist and source-of-hire reports. In October 2026, Workday launched a candidate profile that lets job seekers save their information once and reuse it across applications. Employment Hero also offers an AI recruitment agent that returns ranked shortlists from its pool of job seekers. Consequently, employers that run applicant tracking systems can add reports on time to hire, quality of hire and channel cost.
Privacy duties, breaches and skills gaps slow adoption
How do automated decision rules raise privacy duties?
Automated decision rules raise privacy duties, because analytics that rank candidates or flag staff can significantly affect individuals. From Dec. 10, 2026, privacy policies must describe the personal information used in such automated or semi-automated decisions. Employment is among the interests that guidance treats as significantly affected, so HR teams must map every model they use. As a result, smaller vendors face extra documentation costs, while employers may delay new predictive tools until legal reviews are complete.
Why do rising data breaches slow cloud adoption?
Rising data breaches slow cloud adoption, because workforce systems hold tax numbers, bank details and health records. The privacy regulator received 1,205 breach notifications in 2025, up 8% from 1,112 in 2024, and 716 came from malicious or criminal attacks. Consequently, employers ask vendors for stronger security proof before they move payroll and HR data into analytics platforms. Vendors that offer local hosting, encryption and clear access logs reduce this concern over time.
How do skills gaps limit use among smaller employers?
Skills gaps limit analytics use among smaller employers, because many owners lack time and staff to interpret workforce data. About 57% of small and medium businesses reported no AI adoption between December 2025 and February 2026, which shows how many firms remain at an early stage. In turn, vendors must design simple reports and plain-English answers that do not require analysts. This approach widens the buyer base, although adoption among very small firms will build slowly.
Why do reporting thresholds leave many employers out?
Reporting thresholds leave many employers outside formal workforce reporting, because only employers with 100 or more staff must report to the gender equality regulator each year. Australia had 922,512 employing businesses with fewer than 20 staff at June 30, 2026, and none face that annual duty. As a result, compliance demand stays concentrated among larger employers. Human resources analytics vendors therefore depend on payroll timing rules from July 1, 2026, and safety duties to reach these small employers.
Sydney and Canberra lead as Queensland adds users
| Region | Value, 2025 (USD million) | Share, 2025 | CAGR, 2026–2035 |
|---|---|---|---|
| New South Wales and Australian Capital Territory | 33.5 | 33.7% | 13.66% |
| Victoria and Tasmania | 24.5 | 24.6% | 13.96% |
| Western Australia and South Australia | 21.4 | 21.5% | 13.76% |
| Queensland and Northern Territory | 20.1 | 20.2% | 14.26% |
Why do Sydney and Canberra lead analytics spending?
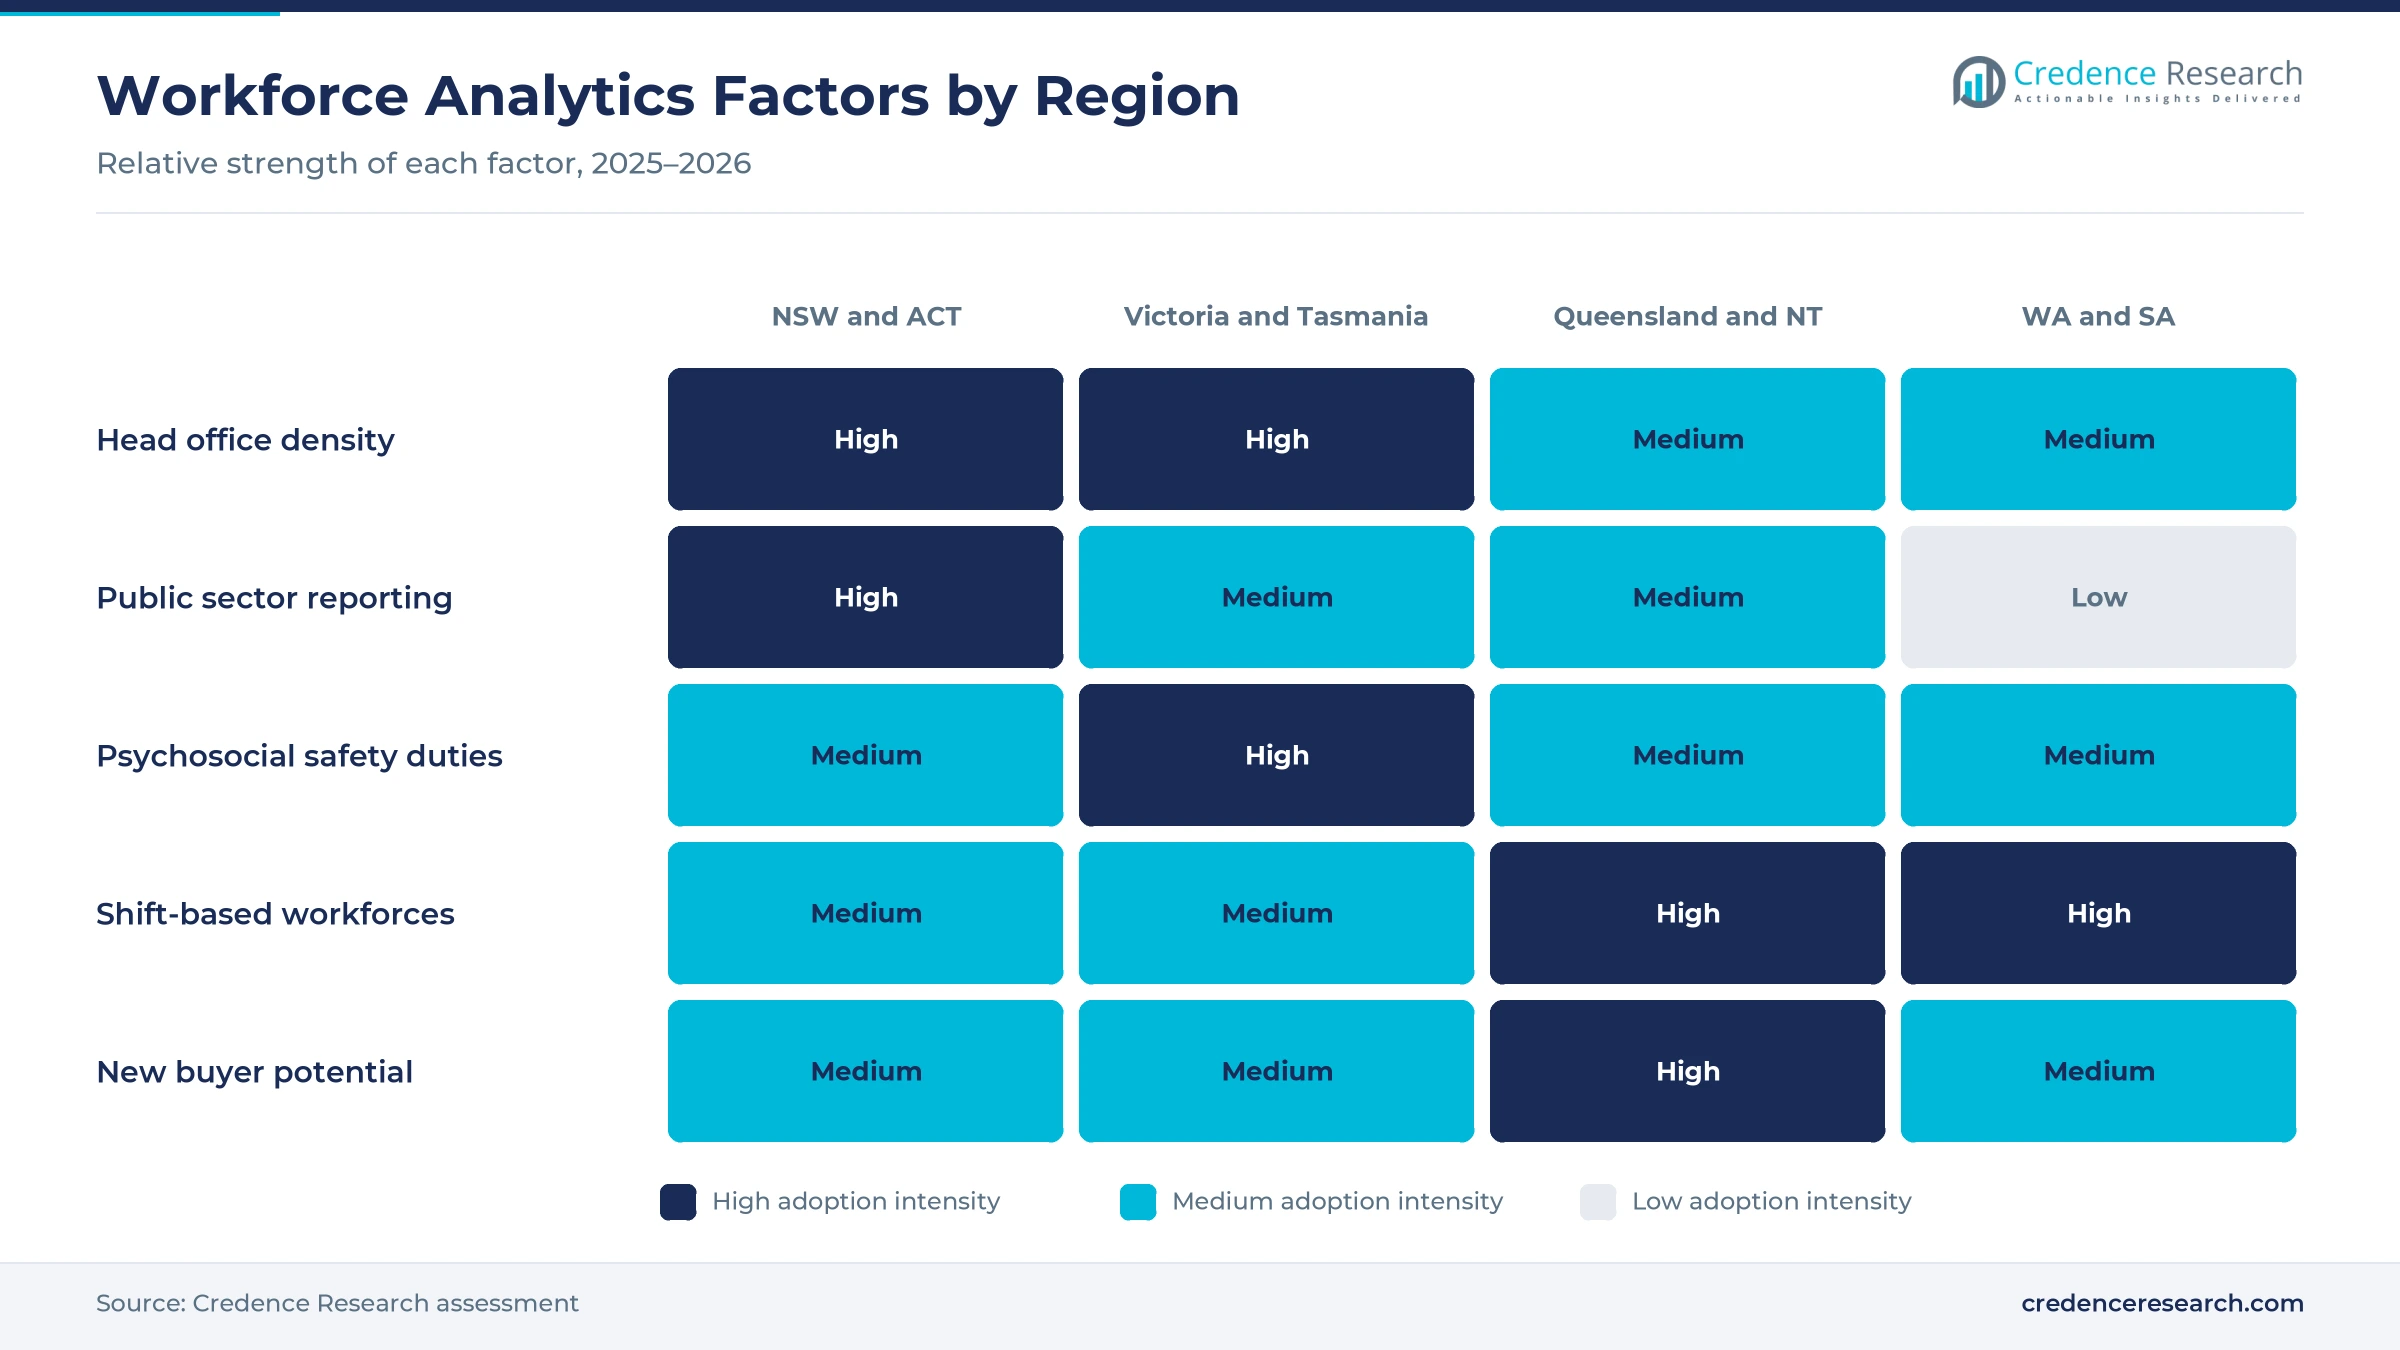
New South Wales and Australian Capital Territory held 33.7% of 2025 value and grow at 13.66% a year, because Sydney hosts many large employer head offices and Canberra hosts federal agencies. Commonwealth public sector employers submitted their gender equality targets between Sept. 1 and Oct. 31, 2026, which adds reporting work in Canberra. Human resources analytics demand here draws on the annual reporting cycle that around 8,500 employers face nationally. As a result, this region keeps the largest share, with demand led by large employers, banks, insurers and government departments.
How do safety rules shape demand in Victoria and Tasmania?
Victoria and Tasmania held 24.6% of 2025 value and grow at 13.96% a year, because Melbourne combines large employers with many HR software developers. Victoria's psychological health regulations took effect on Dec. 1, 2025, for all employers in the state. Human resources analytics demand in Victoria therefore gained a new compliance anchor from Dec. 1, 2025. Consequently, Victorian employers now track bullying, aggression and exposure to traumatic events alongside physical hazards. This duty lifts demand for risk and incident reports that draw on HR and rostering data.
Why do Queensland and Northern Territory grow fastest?
Queensland and Northern Territory held 20.2% of 2025 value and grow fastest at 14.26% a year, because health, mining and public service employers are expanding reporting tools. Human resources analytics demand in the Northern Territory comes from about 147,500 employed people in July 2026, spread across remote sites. In turn, employers across remote sites rely on cloud tools and recruitment software to manage hiring, rosters and turnover at distance.
How do resources and manufacturing shape the west and south?
Western Australia and South Australia held 21.5% of 2025 value and grow at 13.76% a year, because resources, defense and manufacturing employers run large shift-based workforces. These employers track fatigue, overtime and contractor use closely, which draws on rostering and payroll data. Human resources analytics demand in the two states also rests on employers that report each year once they reach 100 staff. However, many medium employers in Perth and Adelaide still rely on reports built into their HR suites, so growth here stays close to the national rate.
Laws, launches and agent tools from 2025 to 2026
| Development | Status and market relevance |
|---|---|
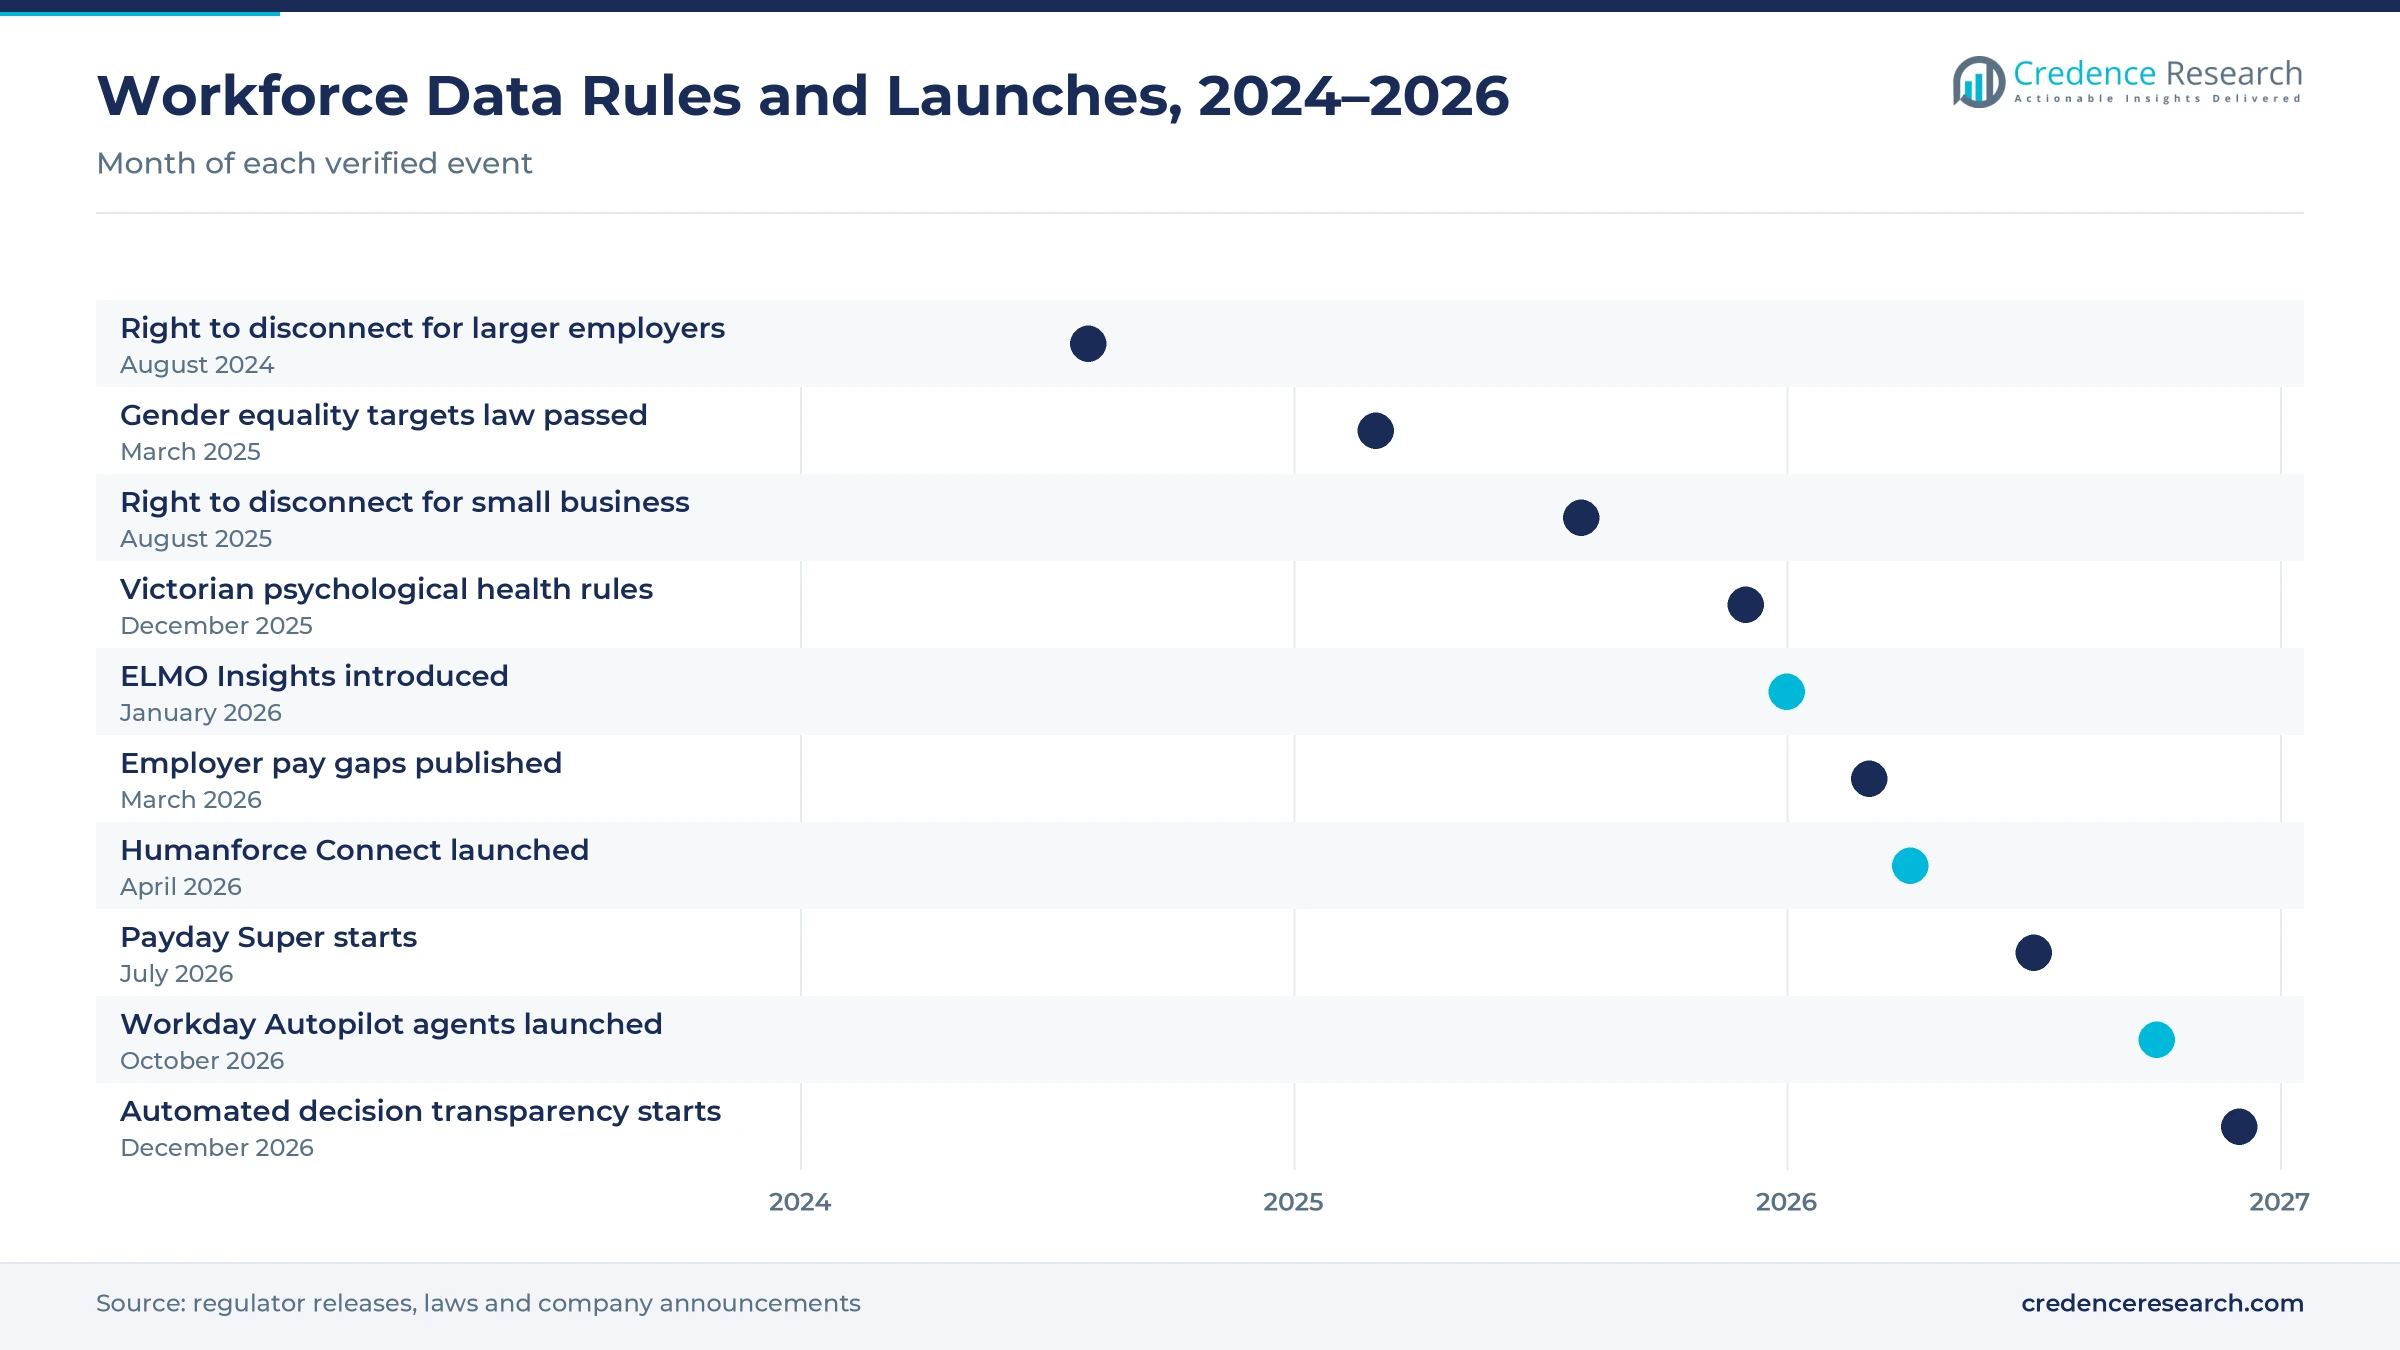
| In March 2025, the law requiring employers with 500 or more staff to set gender equality targets was passed. | Covers nearly 2,000 employers and 3.9 million employees |
| In January 2026, ELMO Software introduced ELMO Insights for plain-English questions on workforce data. | Widens analytics use among managers without data skills |
| In March 2026, the gender equality regulator published pay gaps for around 8,500 employers for 2024–25. | Raises board and public scrutiny of pay data |
| In April 2026, Humanforce launched Humanforce Connect, a frontline and flexible workforce operating system. | Joins rostering, shift filling and agency data in one platform |
| In October 2026, Workday launched Autopilot agents that complete routine HR, finance and IT work. | Moves workforce analytics toward agents that act on data |
Plain-English queries and agents change HR reporting
- Natural language queries let managers ask about turnover or time to hire in plain English, which removes the need for report-writing skills.
- AI agents that act on HR records can complete routine tasks and flag anomalies, which turns analysis into direct action.
- Integrated rostering and payroll data gives shift-based employers one view of hours, overtime and labor cost across sites.
- AI governance frameworks such as ISO/IEC 42001 give employers a way to check how vendors manage models, data and human review.
Need a Custom Version of This Report?
Tailor the scope, geography, or segments to your exact requirements.
- Custom geography or segment scope
- Direct access to our analyst team
Global suites and local HR platforms compete for data
Competition combines global human capital management suites with local HR and workforce platforms that serve small and medium employers. Workday serves Australian employers such as aged care and disability provider Valmar, and launched Autopilot agents for HR, finance and IT work in October 2026. ELMO Software reported 1.2 million users across Australia, New Zealand and the United Kingdom and launched ELMO Insights in January 2026. Employment Hero reported more than 350,000 businesses on its platform in February 2025, many of them small employers. Humanforce serves 1,800 customers and expanded through acquisitions of IntelliHR, LiveHire, Emprevo and ShiftMatch. Human resources analytics vendors compete for about 8,500 employers that report pay gaps each year, where trust matters more than price. Companies compete on payroll accuracy, built-in reports, plain-English query tools, AI governance, local data hosting and the depth of integration with rostering and hiring systems.
Companies profiled and their roles in this market
| Company | Type | Role in the market |
|---|---|---|
| Workday | Global HCM suite | Australian customers including Valmar; Autopilot agents launched in October 2026 |
| ELMO Software | Local HR platform | 1.2 million users; ELMO Insights plain-English analytics from January 2026 |
| Employment Hero | Small business HR and payroll platform | More than 350,000 businesses on the platform in February 2025 |
| Humanforce | Frontline workforce platform | 1,800 customers; Humanforce Connect launched in April 2026 |
Credence Research view on workforce data demand
Credence Research's view is that Australian workforce analytics spending will grow strongly through 2035, as pay equity, payroll timing and psychosocial safety rules make workforce data a board-level concern. Embedded suite analytics should keep the largest share, while standalone platforms and compliance reports gain most. Plain-English queries and AI agents will bring managers without data skills into regular use. However, privacy duties on automated decisions and rising data breaches will favor vendors that can prove strong governance and security. Human resources analytics spending of USD 112.9 million in 2026 should grow steadily as these rules take hold.
How the workforce analytics estimate was built
The report uses 2025 as the base year, with values in USD million at current prices. Market values come from the Credence Research model, which combines employer counts by size, HR software adoption, subscription and service pricing and reporting duties. Regional shares follow the client groupings, and splits by solution type, application and enterprise size are Credence Research estimates. Sources used are World Bank data, official statistics, regulator releases, company statements and news reports, and no interviews or surveys were used.
Pay equity, safety and AI set the path to 2035
The market is expected to reach USD 363.6 million by 2035, a 13.88% CAGR during 2026–2035, as employers treat workforce data as evidence for regulators, boards and staff. Growth should be strongest in compliance and workforce risk analytics and among small employers, while New South Wales and Australian Capital Territory keep the largest share. Plain-English tools, AI agents and payroll-linked reporting will widen use each year. In contrast, privacy duties and data breaches could slow the adoption of predictive hiring tools. Human resources analytics demand from the 922,512 employing businesses with fewer than 20 staff should still build through 2035.
Frequently Asked Questions
How big is the Australia human resources analytics market?
Which region leads workforce analytics spending?
Which region grows fastest?
Which solution type holds the largest share?
Which application grows fastest?
How does Payday Super affect workforce data?
Who are the leading companies in this market?
What are the main risks to growth?
Table of Content
Chapter 1 Market Segmentation
- 1.1 Segmentation Framework
- 1.1.1 Product and Service Classification
- 1.1.2 Application and End-Use Classification
- 1.1.3 Technology and Solution Classification
- 1.1.4 Customer and Distribution Channel Classification
- 1.1.5 Geographic Segmentation
- 1.1.6 Market Segment Definitions and Boundaries
- 1.2 By Solution Type
- 1.2.1 Embedded HCM analytics
- 1.2.2 Standalone people analytics
- 1.2.3 Analytics professional services
- 1.3 By Application
- 1.3.1 Workforce planning and retention analytics
- 1.3.2 Talent acquisition analytics
- 1.3.3 Performance and learning analytics
- 1.3.4 Compliance and workforce risk analytics
- 1.4 By Enterprise Size
- 1.4.1 Large employers
- 1.4.2 Medium employers
- 1.4.3 Small employers
Chapter 2 Introduction
- 2.1 Report Objectives and Scope
- 2.2 Product Definition and Industry Terminology
- 2.3 Market Inclusions and Exclusions
- 2.4 Research Process
- 2.4.1 Primary Research and Expert Interviews
- 2.4.2 Secondary Research and Source Review
- 2.4.3 Top-Down and Bottom-Up Estimation
- 2.4.4 Data Triangulation and Verification
- 2.5 Market Size Measurement Basis
- 2.5.1 2025: USD 99.5 million → 2035: USD 363.6 million
- 2.6 Historical and Forecast Reference Periods
- 2.6.1 Historical Period: 2018-2025
- 2.6.2 Base Year: 2025
- 2.6.3 Forecast Period: 2025-2035
- 2.7 Research Assumptions and Limitations
Chapter 3 Executive Summary
- 3.1 Market Snapshot and Key Findings
- 3.2 Base-Year Market Size, 2025
- 3.3 Forecast Market Size, 2035
- 3.4 Revenue and Volume Growth Outlook
- 3.5 Key Demand and Supply Indicators
- 3.6 Leading Market Segments
- 3.7 Fastest-Growing Market Opportunities
- 3.8 Regional Performance Highlights
- 3.9 Technology and Industry Transformation
- 3.10 Competitive Landscape Summary
- 3.11 Analyst View and Strategic Implications
Chapter 4 Australia Human Resources Analytics Market Trends and Developments
- 4.1 Historical Industry Development, 2018-2025
- 4.2 Recent Market Trends and Developments
- 4.3 Demand and Customer Behavior Trends
- 4.4 Technology and Product Innovation
- 4.5 Artificial Intelligence, Automation and Digitalization
- 4.6 Local Manufacturing and Supply Chain Realignment
- 4.7 Industry Partnerships, Mergers and Acquisitions
- 4.8 Sustainability and Circular Economy Developments
- 4.9 Government and Private Sector Investment Trends
- 4.10 Emerging Business Models and Commercialization
- 4.11 Industry Developments and Announcements
Chapter 5 Australia Human Resources Analytics Market Supply and Demand Analysis
- 5.1 Demand Trend and Consumption Analysis, 2018-2025
- 5.2 Demand Forecast, 2025-2035
- 5.3 Supply Chain Structure and Procurement Trends
- 5.4 Supply-Demand Gap and Bottlenecks
- 5.5 Import Dependence and Sourcing Structure
- 5.6 Regional Supply and Demand Concentration
Chapter 6 Australia Human Resources Analytics Market Pricing Analysis
- 6.1 Pricing Structure and Measurement
- 6.2 Historical Pricing Trends, 2018-2025
- 6.3 Pricing Outlook, 2025-2035
- 6.4 Pricing by Product and Market Segment
- 6.5 Geographic Pricing Differences
- 6.6 Key Input, Energy, Labor and Logistics Costs
- 6.7 Contract Pricing and Purchasing Models
- 6.8 Pricing Sensitivity and Competitive Positioning
- 6.9 Price, Margin and Profitability Implications
Chapter 7 Australia Human Resources Analytics Market Dynamics
- 7.1 Market Growth Drivers
- 7.1.1 Demand-Side Drivers
- 7.1.2 Technology and Innovation Drivers
- 7.1.3 Infrastructure and Investment Drivers
- 7.1.4 Regulatory and Policy Drivers
- 7.2 Market Restraints
- 7.2.1 Cost and Affordability Constraints
- 7.2.2 Technology and Adoption Barriers
- 7.2.3 Supply Chain and Operational Constraints
- 7.3 Market Challenges
- 7.3.1 Competitive Pressure and Margin Erosion
- 7.3.2 Skills, Infrastructure and Implementation Gaps
- 7.4 Emerging Market Opportunities
- 7.5 Market Dynamics Impact and Time-Horizon Assessment
Chapter 8 Australia Human Resources Analytics Value Chain Analysis
- 8.1 Industry Value Chain Overview
- 8.2 Upstream Suppliers and Critical Inputs
- 8.3 Technology and Component Providers
- 8.4 Manufacturing or Service Delivery
- 8.5 Distribution, Channel Partners and Integrators
- 8.6 Downstream Applications and End Users
- 8.7 Value Addition and Profit Pools
- 8.8 Vertical Integration and Outsourcing
- 8.9 Supplier Concentration and Risk
- 8.10 Supply Chain Localization and Resilience
Chapter 9 Australia Human Resources Analytics Market Regulations and Policies
- 9.1 Relevant Laws, Standards and Compliance Frameworks
- 9.2 Product, Service, Safety and Quality Requirements
- 9.3 Government Policies, Incentives and Subsidies
- 9.4 Imports, Exports and Trade Barriers
- 9.5 Public Procurement and Local Content Requirements
- 9.6 Data Protection, AI and Cybersecurity Compliance
- 9.7 Upcoming Policy Changes and Market Implications
Chapter 10 Australia Human Resources Analytics Market Hotspots and Opportunities
- 10.1 Market Opportunity Mapping and Growth Hotspots
- 10.2 High-Growth Applications and Customer Groups
- 10.3 Underserved Markets and White-Space Opportunities
- 10.4 Emerging Technology and Product Opportunities
- 10.5 New Capacity and Investment Hotspots
- 10.6 Market Entry and Expansion Opportunities
- 10.7 Distribution and Partnership Opportunities
- 10.8 Near-Term and Long-Term Commercial Potential
- 10.9 Opportunity Attractiveness and Execution Risks
Chapter 11 Australia Human Resources Analytics Market Outlook, 2025-2035
- 11.1 Market Size and Analysis
- 11.1.1 Revenue (Market Measurement: 2025: USD 99.5 million → 2035: USD 363.6 million)
- 11.1.2 Historical Market Size, 2018-2025
- 11.1.3 Base-Year Market Size, 2025
- 11.2 Market Forecast, 2025-2035
- 11.2.1 Revenue Forecast to 2035
- 11.2.2 CAGR and Year-on-Year Growth
- 11.2.3 Incremental Revenue Opportunity
- 11.3 Forecast Assumptions and Scenario Analysis
- 11.3.1 Base-Case Forecast
- 11.3.2 Optimistic and Conservative Scenarios
- 11.3.3 Technology, Pricing and Policy Sensitivities
- 11.4 Market Attractiveness and Growth Outlook
Chapter 12 Australia Human Resources Analytics Market Segmentation and Outlook
- 12.1 Segmentation Summary and Market Shares, 2025
- 12.2 Largest and Fastest-Growing Segments
- 12.3 By Solution Type - Market Size and Forecast, 2025-2035
- 12.3.1 Segment Definition and Scope
- 12.3.2 Historical Market Size, 2018-2025
- 12.3.3 Revenue Forecast, 2025-2035
- 12.3.4 Base-Year Market Share, 2025
- 12.3.5 Segment CAGR and Growth Drivers
- 12.3.6 Subsegment Market Size and Forecast
- 12.3.6.1 Embedded HCM analytics
- 12.3.6.2 Standalone people analytics
- 12.3.6.3 Analytics professional services
- 12.3.7 Subsegment Pricing and Adoption Trends
- 12.3.8 Leading Suppliers and Competition
- 12.3.9 Regional Demand and Opportunities
- 12.4 By Application - Market Size and Forecast, 2025-2035
- 12.4.1 Segment Definition and Scope
- 12.4.2 Historical Market Size, 2018-2025
- 12.4.3 Revenue Forecast, 2025-2035
- 12.4.4 Base-Year Market Share, 2025
- 12.4.5 Segment CAGR and Growth Drivers
- 12.4.6 Subsegment Market Size and Forecast
- 12.4.6.1 Workforce planning and retention analytics
- 12.4.6.2 Talent acquisition analytics
- 12.4.6.3 Performance and learning analytics
- 12.4.6.4 Compliance and workforce risk analytics
- 12.4.7 Subsegment Pricing and Adoption Trends
- 12.4.8 Leading Suppliers and Competition
- 12.4.9 Regional Demand and Opportunities
- 12.5 By Enterprise Size - Market Size and Forecast, 2025-2035
- 12.5.1 Segment Definition and Scope
- 12.5.2 Historical Market Size, 2018-2025
- 12.5.3 Revenue Forecast, 2025-2035
- 12.5.4 Base-Year Market Share, 2025
- 12.5.5 Segment CAGR and Growth Drivers
- 12.5.6 Subsegment Market Size and Forecast
- 12.5.6.1 Large employers
- 12.5.6.2 Medium employers
- 12.5.6.3 Small employers
- 12.5.7 Subsegment Pricing and Adoption Trends
- 12.5.8 Leading Suppliers and Competition
- 12.5.9 Regional Demand and Opportunities
- 12.6 Segment Growth Comparison
- 12.7 Segment Attractiveness and Priority Matrix
Chapter 13 Australia Human Resources Analytics End-Use and Application Market Outlook
- 13.1 End-Use Industry and Customer Demand Structure
- 13.2 Leading Applications and Customer Groups
- 13.3 End-Use Market Size, Share and Forecast
- 13.4 Major End-Use Industry Deep Dives
- 13.4.1 Customer Requirements and Use Cases
- 13.4.2 Demand and Replacement Cycles
- 13.4.3 Technical and Regulatory Considerations
- 13.4.4 Purchasing and Procurement Models
- 13.4.5 Leading Vendors and Distribution Channels
- 13.4.6 Forecast and Commercial Opportunities
- 13.5 Emerging Applications and Cross-Segment Demand
- 13.6 End-Use Industry Investment Priorities
Chapter 14 Australia Human Resources Analytics Geographic Market Outlook, 2025-2035
- 14.1 Domestic Market Distribution and Demand Clusters
- 14.2 State- or Province-Wise Market Size and Forecast, 2025-2035
- 14.3 City and Metropolitan Market Outlook
- 14.4 Industrial, Manufacturing and Commercial Clusters
- 14.5 Geographic Concentration of Key End Users
- 14.6 Local Pricing and Purchasing Differences
- 14.7 Domestic Production Facilities and Capacity Map
- 14.8 Local Infrastructure and Project Pipeline
- 14.9 State-Level Policy and Incentive Differences
- 14.10 Subnational Investment Hotspots and Opportunities
- 14.11 Distribution and Logistics Networks
- 14.12 Domestic Competitive Footprint
Chapter 15 Australia Human Resources Analytics Technology, Innovation and Sustainability Outlook
- 15.1 Technology Landscape and Maturity
- 15.2 Product, Process and Service Innovation
- 15.3 AI, Automation and Digital Tools in the Industry
- 15.4 Technology Adoption and Performance Benchmarking
- 15.5 Innovation Pipeline and R&D Investment
- 15.6 Patent and Intellectual Property Trends
- 15.7 Energy Efficiency and Resource Management
- 15.8 Sustainability, Recycling and Circularity
- 15.9 Technology Roadmap, 2025-2035
- 15.10 Risks of Obsolescence and Technology Substitution
Chapter 16 Australia Human Resources Analytics Market Key Strategic Imperatives
- 16.1 Growth and Market Entry Priorities
- 16.2 High-Return Products and Segments
- 16.3 Pricing, Profitability and Cost Optimization
- 16.4 Technology Investment and Product Differentiation
- 16.5 Supply Chain Localization and Resilience
- 16.6 Distribution and Customer Acquisition
- 16.7 Partnership, Acquisition and Capacity Strategy
- 16.8 Regional Expansion Priorities
- 16.9 Short-, Medium- and Long-Term Actions
Chapter 17 Competition Outlook
- 17.1 Industry Competition Characteristics
- 17.2 Market Structure and Concentration
- 17.3 Market Share and Competitive Positioning, 2025
- 17.4 Company-Wise Revenue and Product Benchmarking
- 17.5 Production and Service Capacity Benchmarking
- 17.6 Technology, Pricing and Differentiation
- 17.7 Regional Footprint and Distribution Strength
- 17.8 Mergers, Acquisitions and Strategic Alliances
- 17.9 New Entrants and Competitive Threats
- 17.10 Porter's Five Forces and Industry Attractiveness
- 17.11 Competitive Outlook, 2025-2035
Chapter 18 Company Profiles
- 18.1 Company Coverage and Selection Criteria
- 18.2 Workday
- 18.2.1 Business Description
- 18.2.2 Company Ownership and Geographic Presence
- 18.2.3 Product and Service Portfolio
- 18.2.4 Manufacturing and Operating Footprint
- 18.2.5 Financial Performance and Investment
- 18.2.6 Market Share and Competitive Position
- 18.2.7 Technology and Innovation Capabilities
- 18.2.8 Strategic Alliances or Partnerships
- 18.2.9 Recent Developments
- 18.2.10 Growth Strategy and Outlook
- 18.3 ADP
- 18.4 SAP
- 18.5 Oracle
- 18.6 Humanforce
- 18.7 ELMO Software
- 18.8 Employment Hero
- 18.9 PageUp
- 18.10 Visier
- 18.11 Agile HR Analytics
- 18.12 Other Relevant Market Participants
Note: Every listed company is profiled on the structure shown under the first company. The company list is preliminary and may change based on research findings, market developments, data availability and client requirements.
Chapter 19 Disclaimer
- 19.1 Research and Forecast Disclaimer
- 19.2 Data Source and Estimation Limitations
Note: The depth of individual sections depends on data availability for this market. Volume, capacity, trade and other unit-based metrics are included where applicable.

