
Compliance data and site risk push Australian AI monitoring
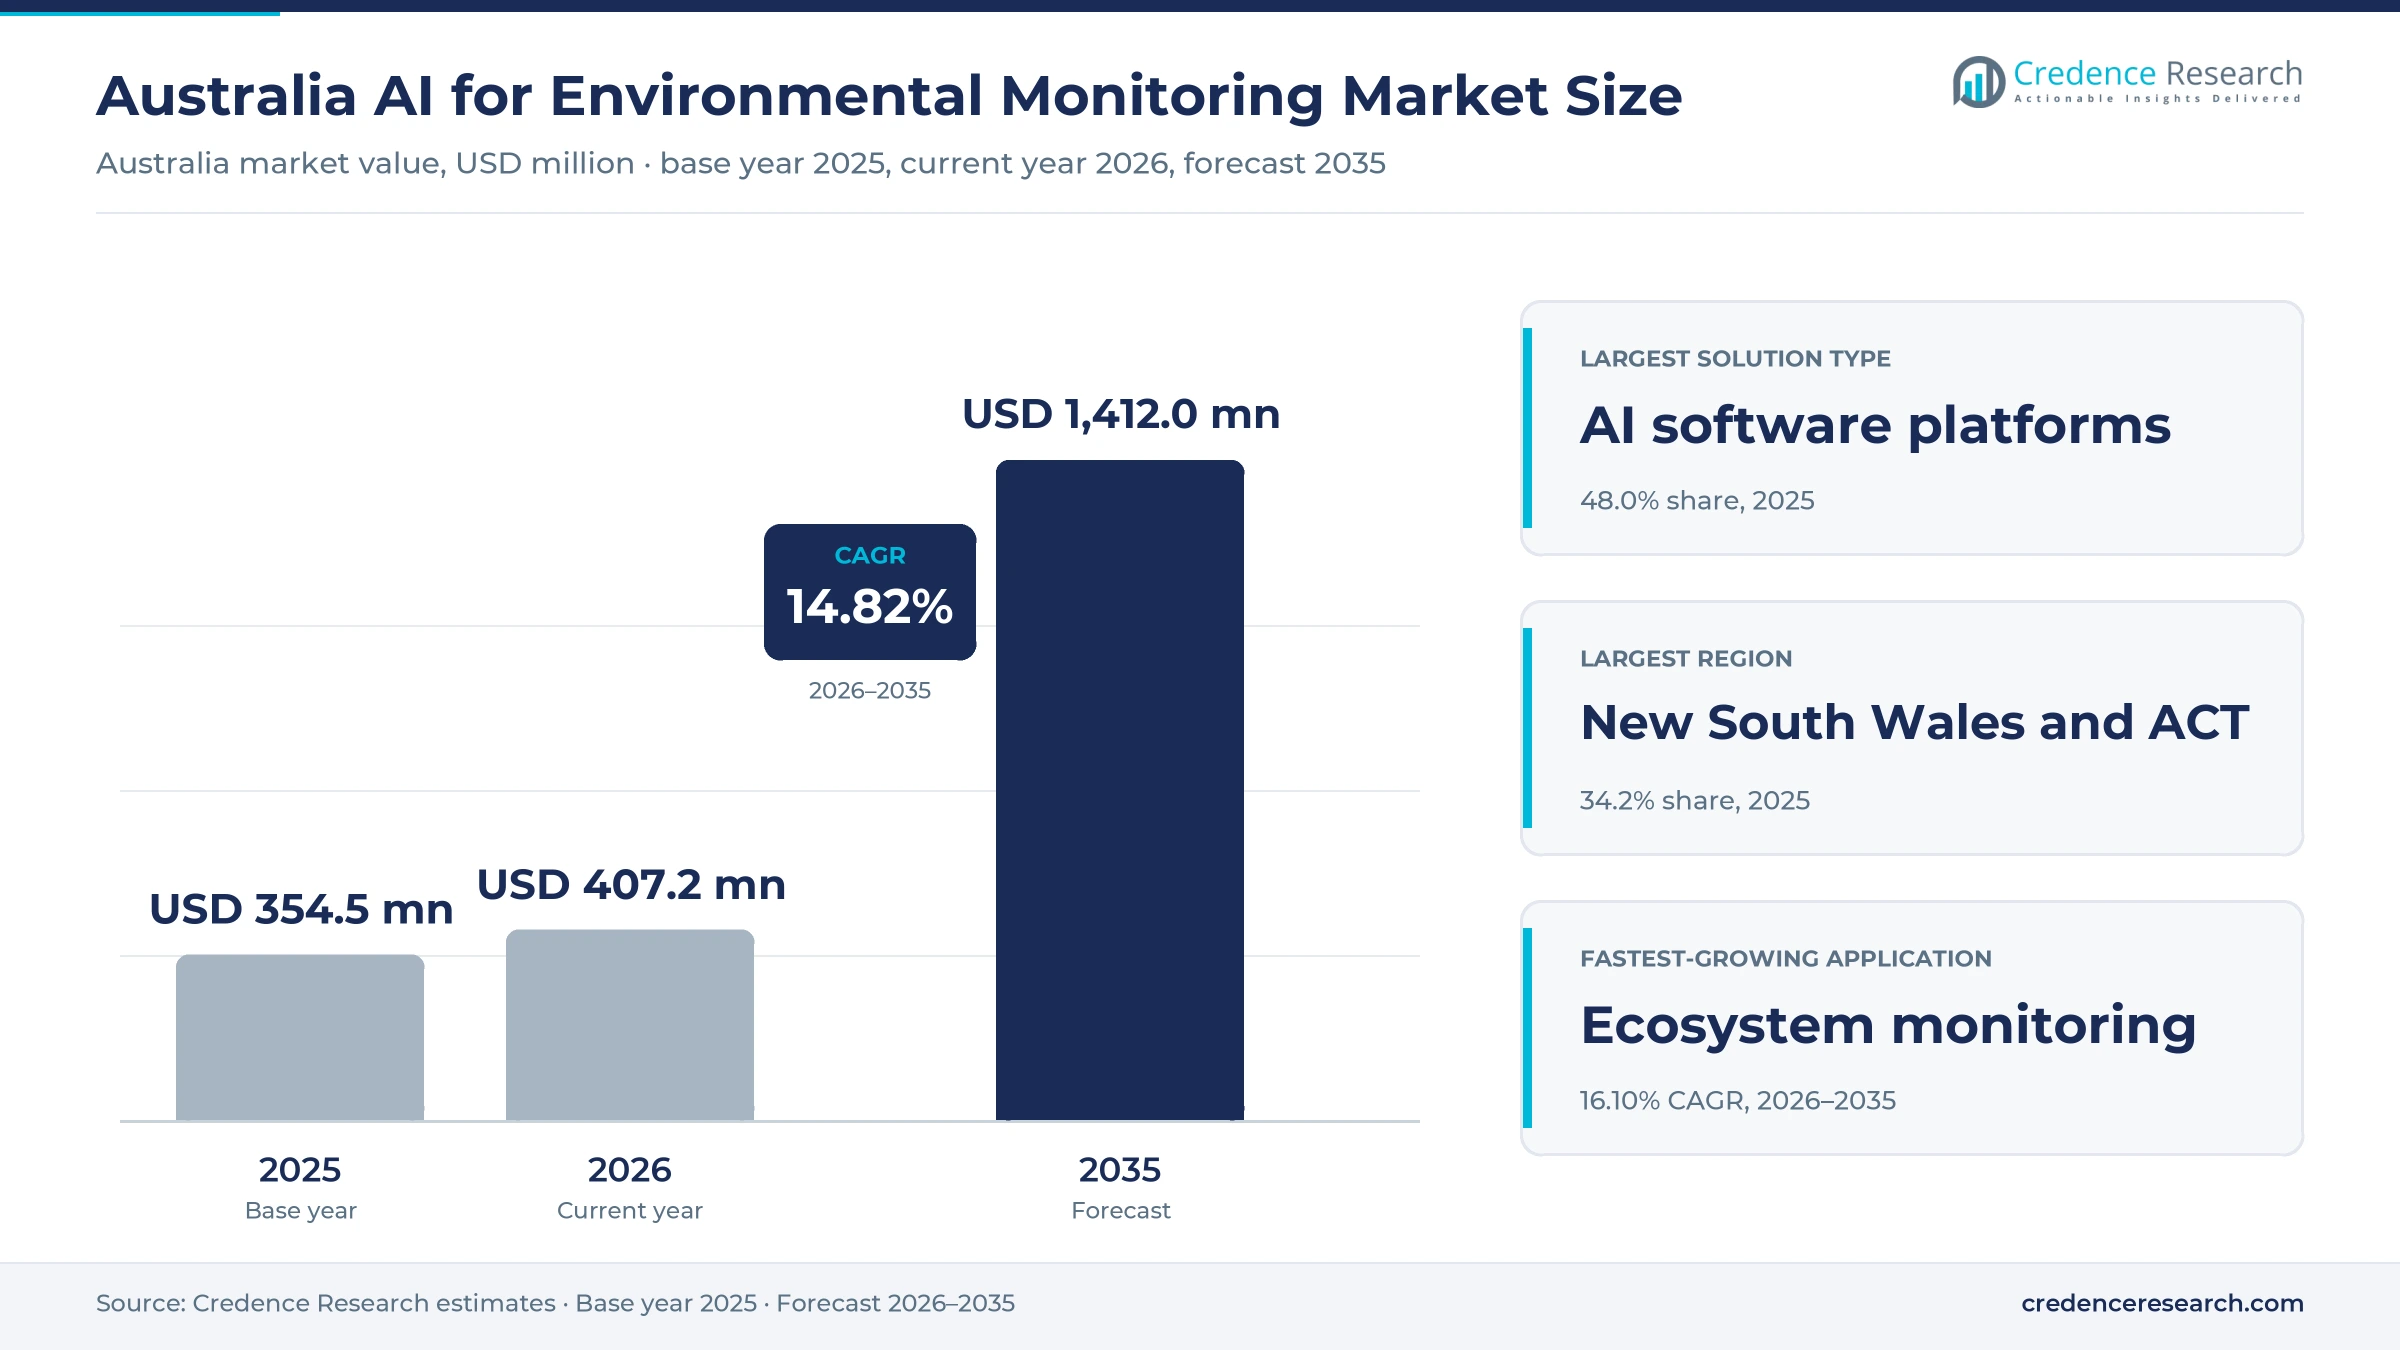
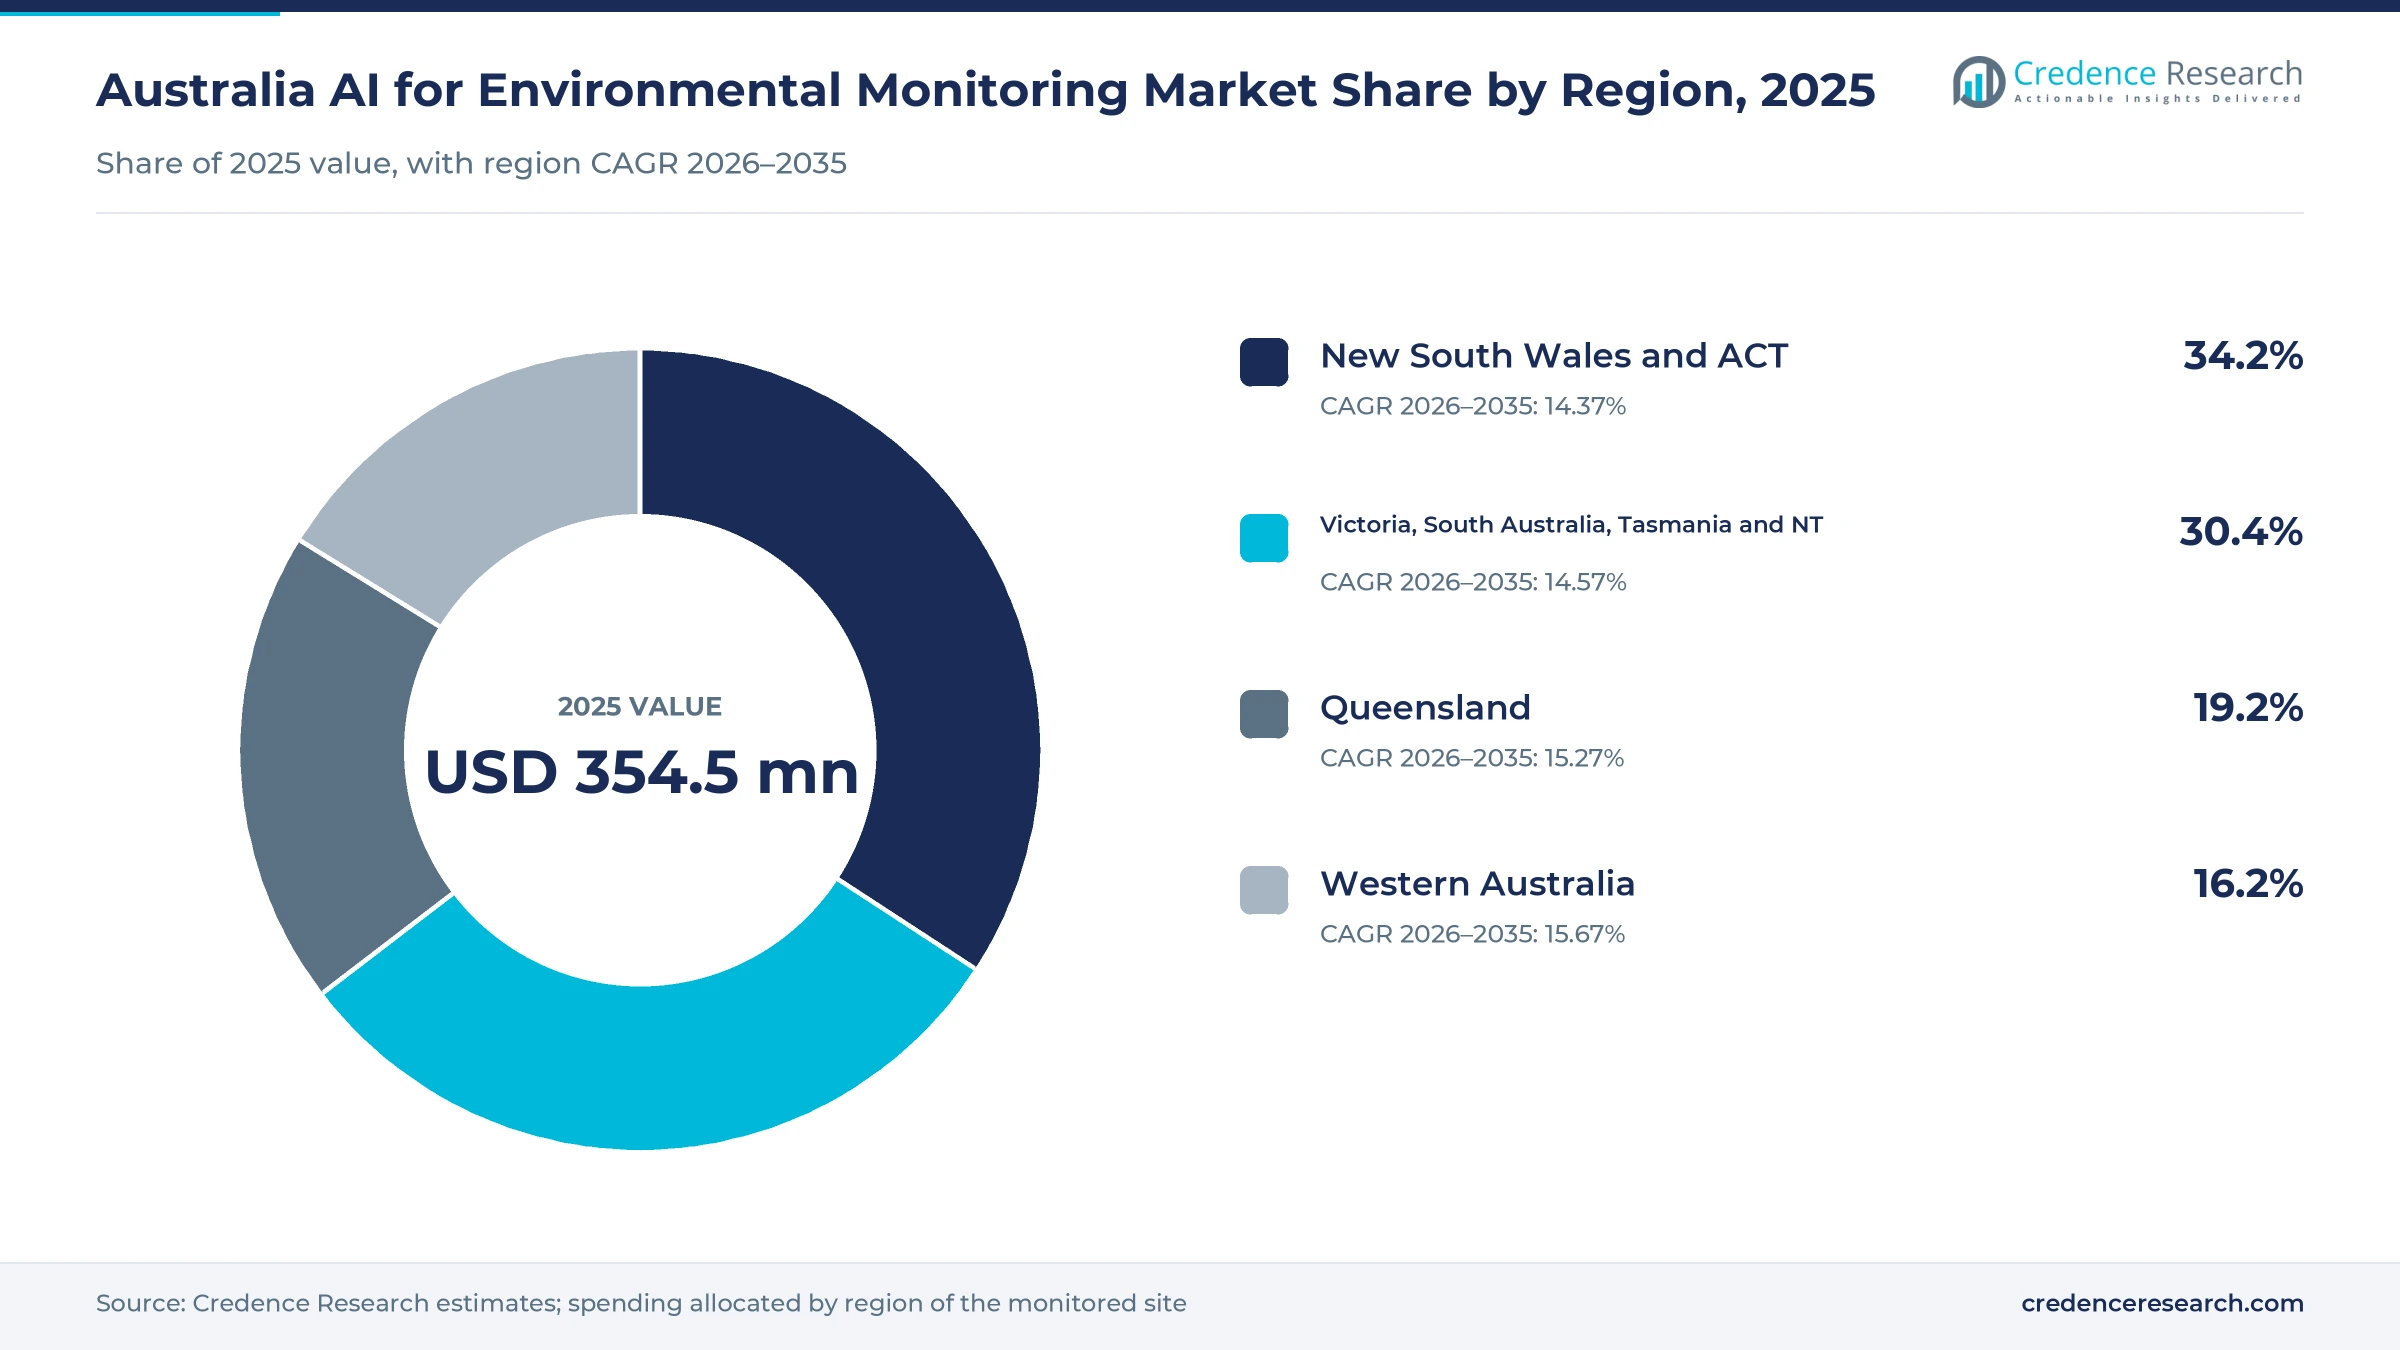
The Australia AI for environmental monitoring market was valued at USD 354.5 million in 2025 and is projected to increase from USD 407.2 million in 2026 to USD 1.41 billion by 2035, registering a CAGR of 14.82% during 2026–2035. Demand comes from mining companies, water utilities, government agencies, research bodies, farmers and builders that use machine learning to read sensor, imagery and weather data on air, water, land and emissions. New South Wales and the Australian Capital Territory held the largest regional share, 34.2% in 2025, because large utilities, agencies and infrastructure projects there buy forecasting and site monitoring tools. Western Australia is the fastest-growing zone at 15.67% a year, as resource operators expand site impact and rehabilitation tracking. Regulation also changed in November 2025, when Parliament passed national environment law reforms that create a National Environmental Protection Agency from July 2026.
Which AI monitoring tools and services does the estimate cover?
The estimate measures spending in Australia on software platforms, sensor hardware with built-in machine learning and analytics services that detect, forecast or classify conditions in air, water, land and ecosystems. It covers air quality, water quality, terrestrial ecosystem, emissions and site impact applications. Values include subscriptions, equipment sales, project fees and usage-based charges paid by the end user.
The estimate excludes conventional sensors sold without analytics, general cloud computing capacity and consulting work that does not use machine learning tools. The value chain runs from sensor makers, satellite and drone imagery providers and cloud platforms through software vendors and integrators to mining companies, utilities, agencies, farmers and construction firms that act on the alerts and forecasts.
Australia AI for Environmental Monitoring Market Insights
- The Australia AI for environmental monitoring market was valued at USD 354.5 million in 2025 and is projected to reach USD 1.41 billion by 2035, registering a CAGR of 14.82% during 2026–2035.
- New South Wales and the Australian Capital Territory held a 34.2% share of 2025 value, because large utilities, agencies and infrastructure projects there buy monitoring tools.
- AI software platforms led with a 48.0% share of 2025 value, because buyers pay recurring subscriptions to combine sensor, imagery and weather data in one view.
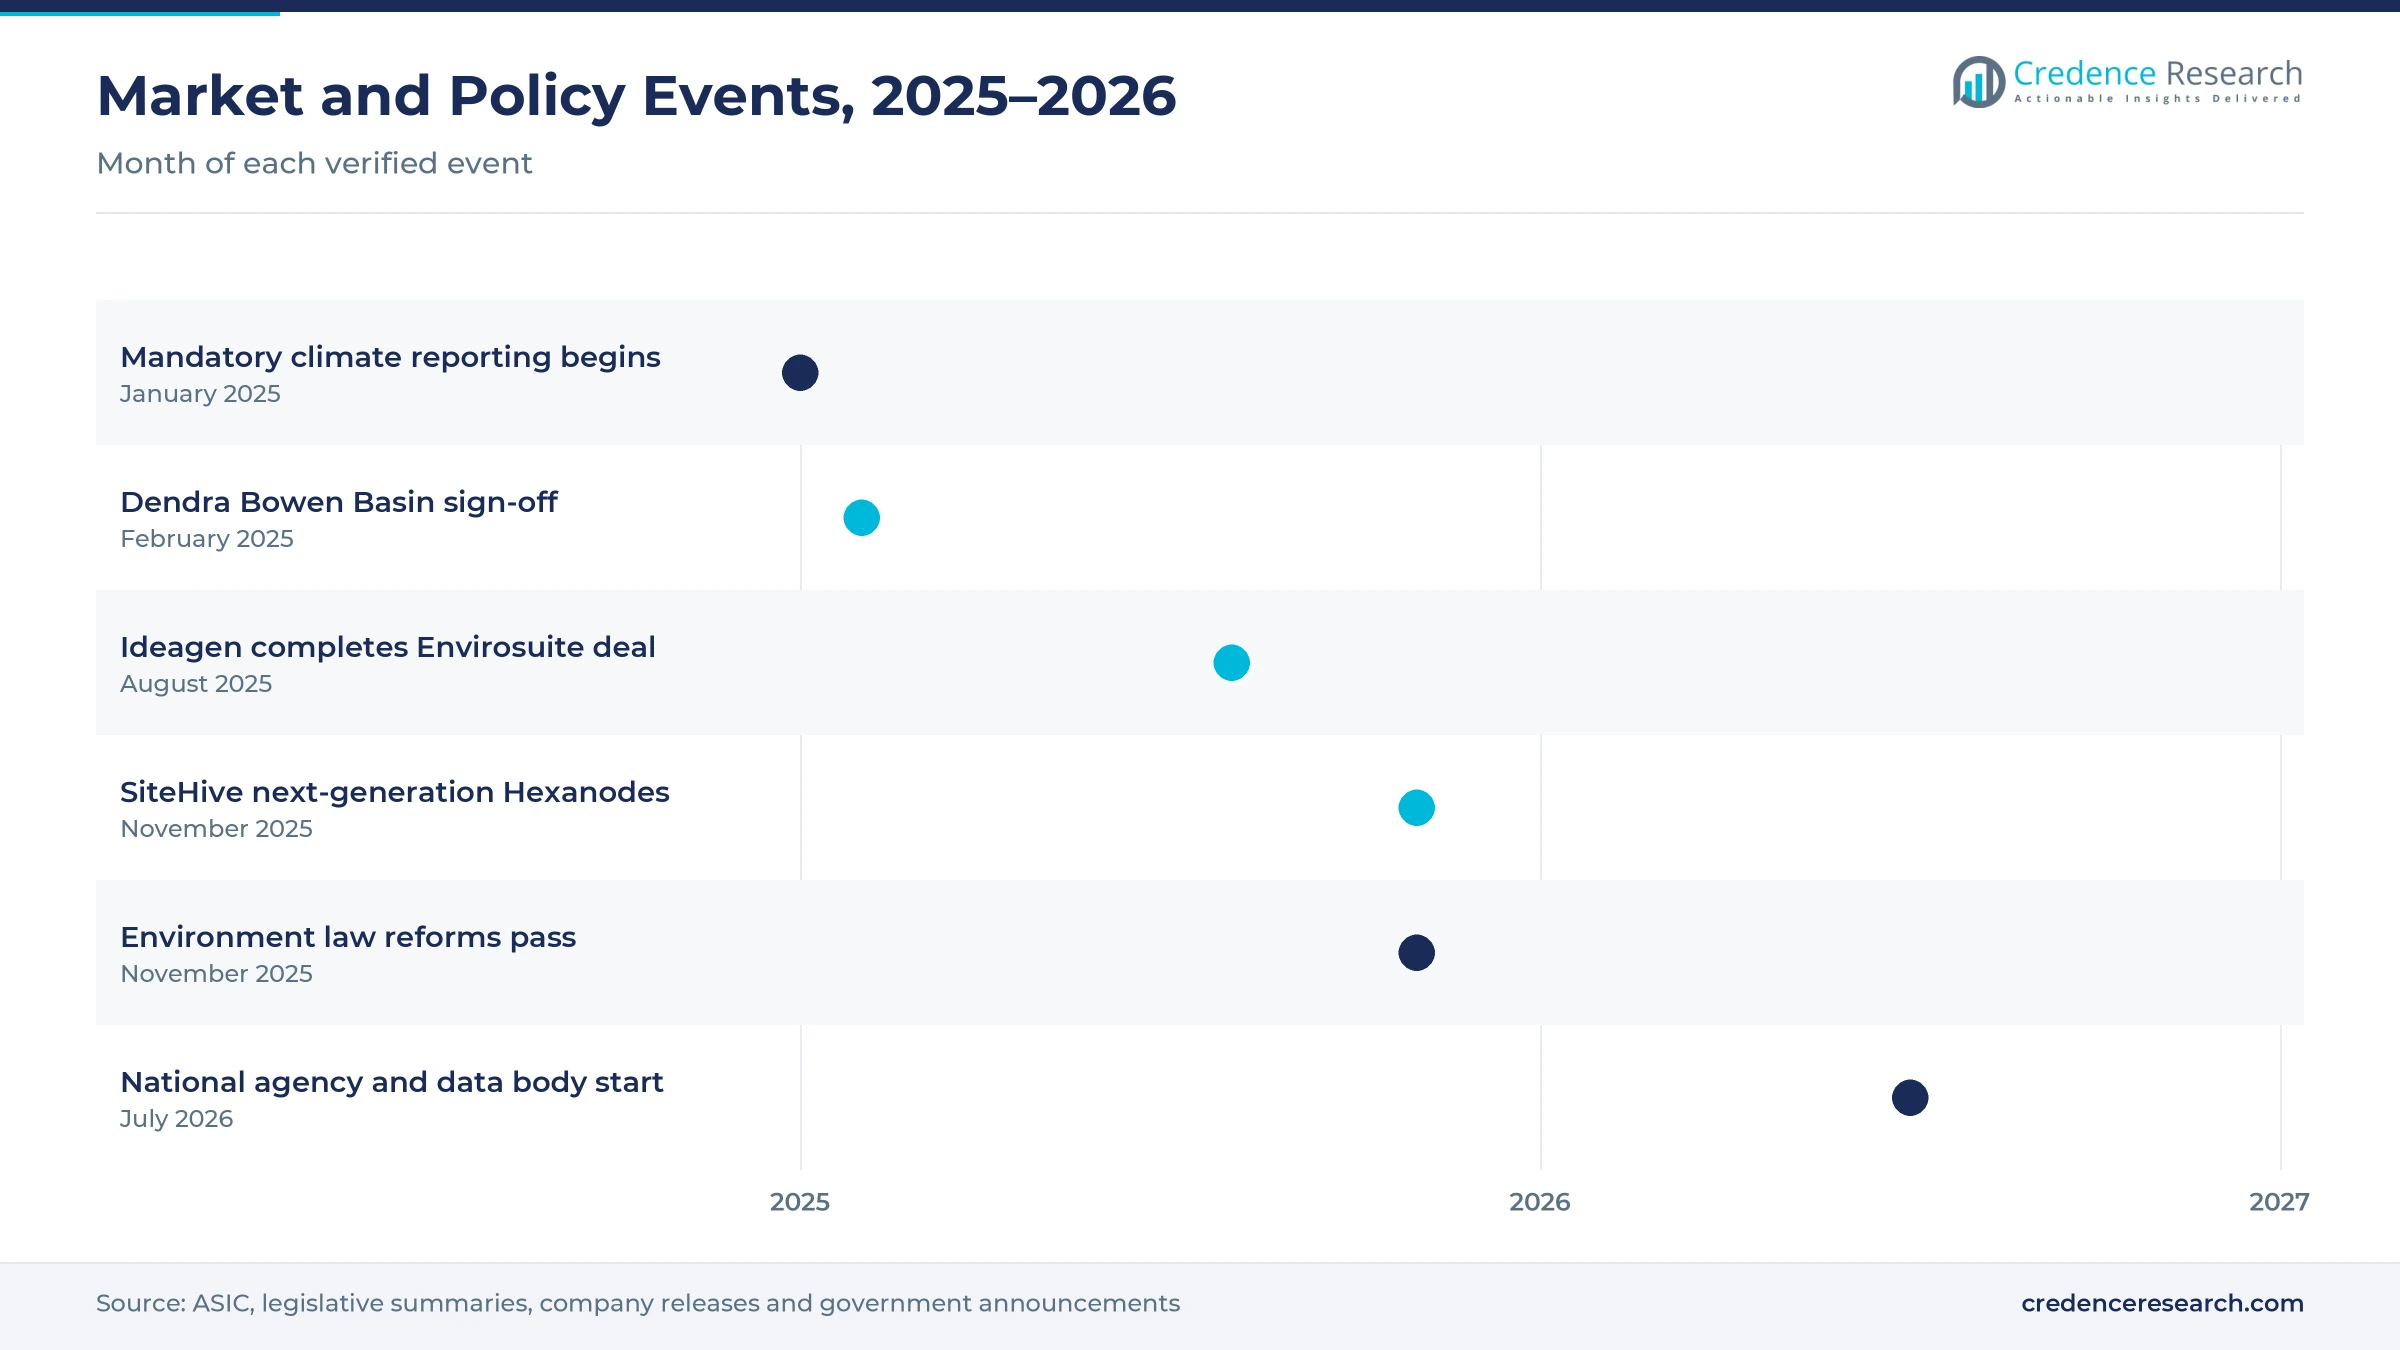
- Parliament passed national environment law reforms in November 2025, and the new National Environmental Protection Agency starts on July 1, 2026.
- Ideagen completed its acquisition of Envirosuite in August 2025, which placed an Australian environmental intelligence platform inside a larger compliance software group.
Software leads while ecosystem tracking grows fastest
Why do AI software platforms lead spending?
Based on solution type, the market is categorized into AI software platforms, AI-integrated monitoring hardware and AI analytics services. AI Software Platforms led with a 48.0% share of 2025 value, because buyers pay recurring subscriptions to combine sensor, imagery and weather data in one view. AI Software Platforms grow fastest at 15.53% a year, as compliance teams move reporting into cloud tools.
How does mining lead end-use demand?
Based on end-use industry, the market is categorized into mining and resources, public administration and research, water utilities and agriculture and built environment. Mining and Resources led with a 34.0% share of 2025 value, because mines track dust, noise, water and rehabilitation under strict approval conditions. Water Utilities grow fastest at 15.69% a year, as forecasting tools guide treatment plants.
Why does air quality monitoring hold the largest share?
Based on application, the market is categorized into air quality monitoring, water quality monitoring, terrestrial ecosystem monitoring and emissions and site impact monitoring. Air Quality Monitoring led with a 30.0% share of 2025 value, because mines, airports and construction sites manage dust and odor near communities. Terrestrial Ecosystem Monitoring grows fastest at 16.10% a year, as nature law reforms raise evidence needs.
How do large enterprises dominate buying?
Based on enterprise size, the market is categorized into large enterprises, medium enterprises and small enterprises. Large Enterprises led with a 62.0% share of 2025 value, because big miners, utilities and emitters carry the heaviest reporting duties. Medium Enterprises grow fastest at 15.74% a year, as mandatory climate reporting extends to smaller companies in 2026 and 2027.
| Segment Group | Leading Sub-segment | Share, 2025 | Fastest-growing Sub-segment | CAGR, 2026–2035 |
|---|---|---|---|---|
| By Solution Type | AI Software Platforms | 48.0% | AI Software Platforms | 15.53% |
| By End-Use Industry | Mining and Resources | 34.0% | Water Utilities | 15.69% |
| By Application | Air Quality Monitoring | 30.0% | Terrestrial Ecosystem Monitoring | 16.10% |
| By Enterprise Size | Large Enterprises | 62.0% | Medium Enterprises | 15.74% |
Request a Free Sample
Fill in your details and we'll send you a free sample report.
- Sample data tables & charts
- Research methodology
Climate rules, water forecasting and nature law lift demand
How does compliance digitization lift AI monitoring demand?
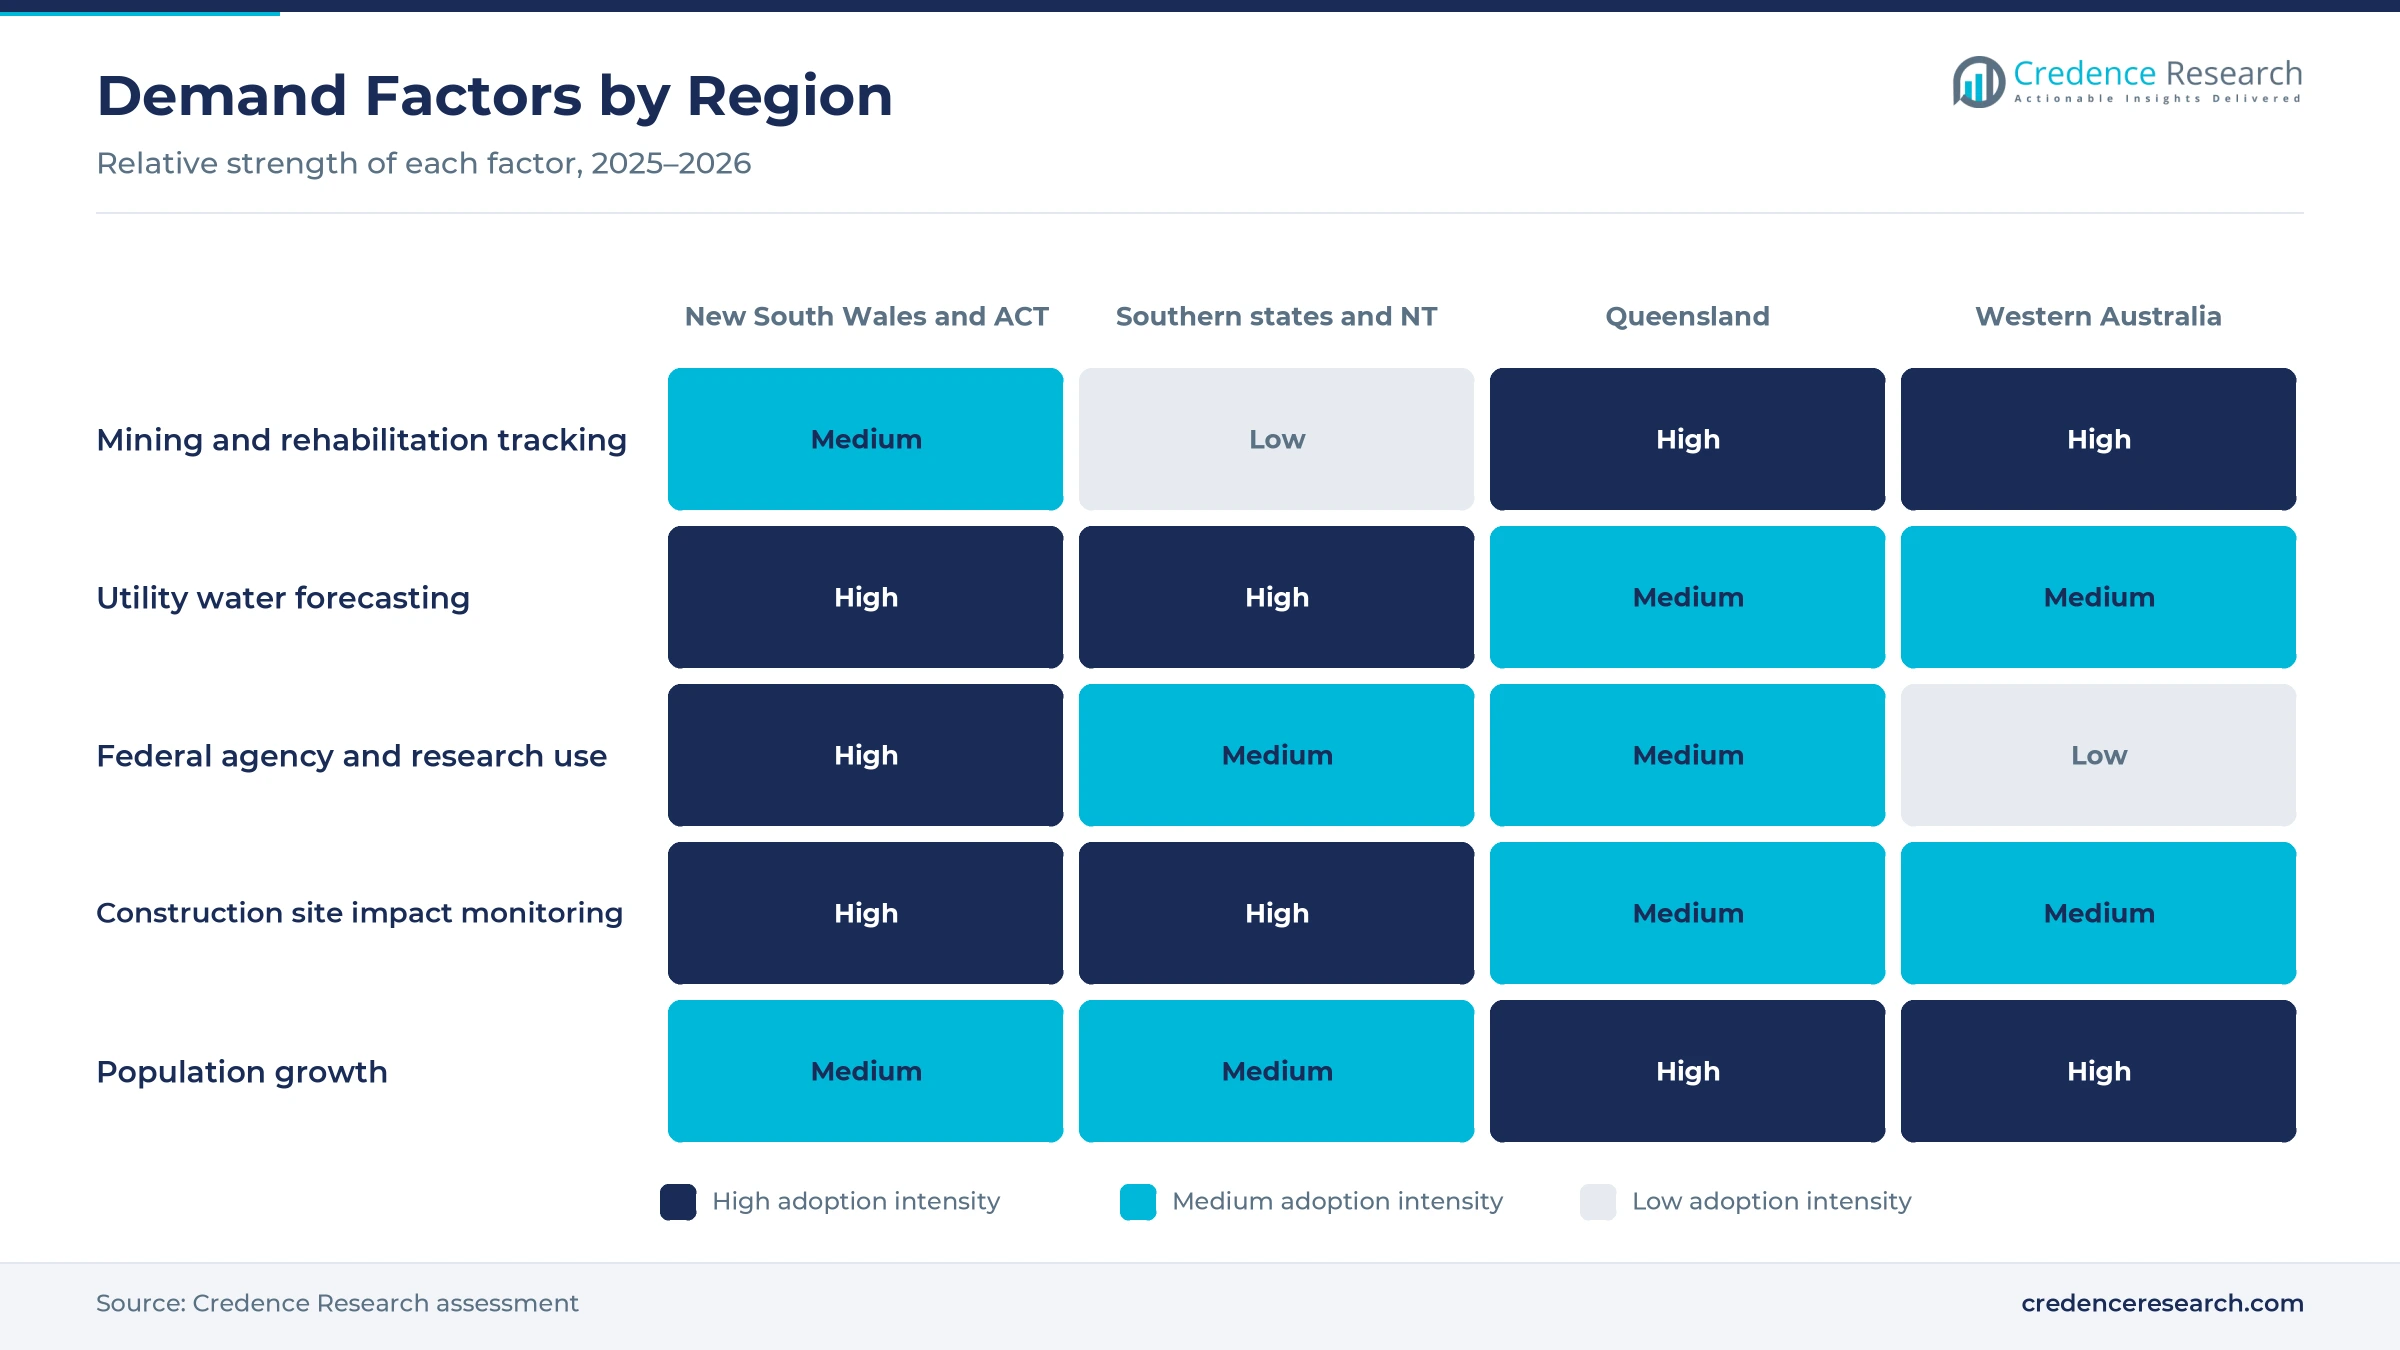
Environmental compliance digitization lifts demand, because companies must now report emissions and climate risks with data that auditors can test. Mandatory climate reporting applied to the largest entities for financial years from Jan. 1, 2025, and it extends to a second group from July 1, 2026, according to ASIC. A third group with 100 or more employees follows from July 1, 2027. The Safeguard Mechanism also covered 208 facilities with 132.8 million metric tons of carbon dioxide equivalent in 2024-25, according to the Clean Energy Regulator. As a result, mining and resources hold a 34.0% share of 2025 value, as covered sites automate emissions and impact records.
Why does utility monitoring integration expand water use cases?
Utility monitoring integration expands water use cases, because treatment plants can adjust dosing earlier when they know how raw water will change. Machine learning tools built with Sydney Water, WaterNSW, Melbourne Water and TRILITY predict turbidity, color and organic matter from one day to one month ahead, according to the University of Technology Sydney. The forecasts reach accuracy of about 90%, and they cover supply for around 4 million residents in Sydney and Melbourne. Treatment plants use them for chemical dosing, filtration rates and reservoir management, which cuts operating costs. In turn, water utilities grow at 15.69% a year, the fastest end-use rate, as more catchments connect live sensor feeds to forecasting models.
How do ecological monitoring requirements raise evidence needs?
Ecological monitoring requirements raise evidence needs, because project approvals and mine closures depend on proof that vegetation, soils and habitats are recovering. Parliament passed the Environment Protection Reform Act 2025 on Nov. 28, 2025, adding net gain tests and a new definition of unacceptable impacts. Decisions must also be consistent with national environmental standards rather than merely not inconsistent with them. Dendra used aerial imagery and machine learning to support rehabilitation sign-off for more than 1,500 hectares at two Bowen Basin coal mines, according to the company, which sped up approval by over two years. As a result, terrestrial ecosystem monitoring grows at 16.10% a year, the fastest application rate.
Why does national AI policy support public sector adoption?
National AI policy supports public sector adoption, because agencies and research bodies gain clearer rules and shared tools for using machine learning on public data. The government released its National AI Plan on Dec. 2, 2025, with $29.9 million to set up an AI Safety Institute in 2026. The plan also directs agencies to adopt AI through the secure GovAI platform and aims to speed investment in data centers. Australian research and development spending stood at about 1.86% of GDP in 2021, according to World Bank data, which sustains scientific monitoring programs. In turn, AI software platforms grow at 15.53% a year, as agencies buy artificial intelligence platforms that link sensor networks.
Platform consolidation and smart site sensors reshape supply
How is the shift to broad compliance platforms changing supply?
The shift toward broad compliance platforms is changing supply, because buyers prefer one vendor for environmental data, safety records and audit trails. Ideagen proposed to buy Envirosuite on Feb. 25, 2025, and revised its cash offer in April 2025 before completing the deal on Aug. 22, 2025. Envirosuite serves more than 450 customers in aviation, mining, industrial, waste and water treatment, with named users including BHP, Vale, Holcim and Veolia. Its platform covers noise management, air quality monitoring, odor detection and carbon emissions tracking. As a result, AI software platforms keep a 48.0% share of 2025 value, as larger compliance groups bundle environmental analytics with other reporting tools.
Why is the rise of smart site sensors moving analysis to the edge?
The rise of smart site sensors is moving analysis to the edge, because construction and quarry operators need alerts before dust or noise breaches a permit limit. SiteHive launched its next-generation Hexanode monitors on Nov. 13, 2025, with built-in artificial intelligence that classifies audio. The new dust sensor offers five times the airflow of the earlier design, and the units capture images and audio when events trigger. The monitors also carry NATA certification with in-field calibration and connect to a cloud platform over 4G and WiFi. In turn, air quality monitoring keeps a 30.0% share of 2025 value, as sites replace stand-alone air quality sensors with networked units.
Can wider climate reporting open the midsize company market?
Wider climate reporting opens the midsize company market, because companies outside the largest emitters now need auditable environmental data. The second reporting group starts from July 1, 2026, and it includes entities with 250 or more employees and all other national greenhouse reporters. The third group with 100 or more employees follows from July 1, 2027, which brings many regional manufacturers and builders into scope. The Safeguard Mechanism also issued 6.7 million credit units to 54 facilities in 2024-25, which rewards accurate measurement below baselines. As a result, medium enterprises grow at 15.74% a year, the fastest enterprise size rate, as subscription tools lower entry costs.
Is there room to grow through national environmental data systems?
National environmental data systems leave room to grow, because new agencies will need consistent data from projects, utilities and researchers. Environment Information Australia starts on July 1, 2026, alongside the National Environmental Protection Agency. A national standard on data and environmental information was also expected to follow the first draft standards released for consultation. Melbourne Water joined the machine learning forecasting work to model two catchments that supply about 80% of Melbourne residents, which shows how pilots scale across utilities. In turn, public administration and research buyers will fund platforms that link field data with precision agriculture and land records.
Calibration, draft standards and vendor scale test adoption
How do calibration and data quality limit trust in AI results?
Calibration and data quality limit trust in AI results, because regulators accept alerts only when sensor readings are traceable and accurate. Field monitors drift with dust, heat and humidity, so models trained on poor data give false alarms. As a result, buyers demand certified devices and audit trails before they rely on automated findings. Vendors respond with NATA-certified monitors, in-field calibration and human review of flagged events.
Why do draft standards slow some buying decisions?
Draft standards slow some buying decisions, because companies wait to see exactly what evidence the new rules will require. Submissions on the first draft national environmental standards closed on Jan. 30, 2026, while other standards were still expected. In turn, some project owners delay large platform contracts until the final rules are clear. Vendors respond by offering modular subscriptions that can add new reporting fields as standards settle.
How does limited vendor scale affect specialist suppliers?
Limited vendor scale affects specialist suppliers, because local analytics firms must fund product work with a small customer base. Envirosuite shares closed at A$0.045 on Feb. 21, 2025, before a takeover proposal valued them at double that price. As a result, several specialists may seek larger owners to reach global customers. Buyers respond by checking vendor continuity, data export rights and support terms before they sign multi-year contracts.
Why does remote connectivity complicate site monitoring?
Remote connectivity complicates site monitoring, because many mines, farms and catchments sit far from reliable mobile coverage. Sensors that cannot send data in real time lose much of the value of automated alerts. In turn, operators must add satellite links, local storage or edge processing to keep records complete. Vendors respond with devices that hold data during outages and send summaries once a connection returns.
Sydney utilities lead while western mine sites grow fastest
| Region | Value, 2025 (USD million) | Share, 2025 | CAGR, 2026–2035 |
|---|---|---|---|
| New South Wales and ACT | 121.2 | 34.2% | 14.37% |
| Victoria, South Australia, Tasmania and NT | 107.8 | 30.4% | 14.57% |
| Queensland | 68.1 | 19.2% | 15.27% |
| Western Australia | 57.4 | 16.2% | 15.67% |
Why does new South Wales and the ACT hold the largest share?
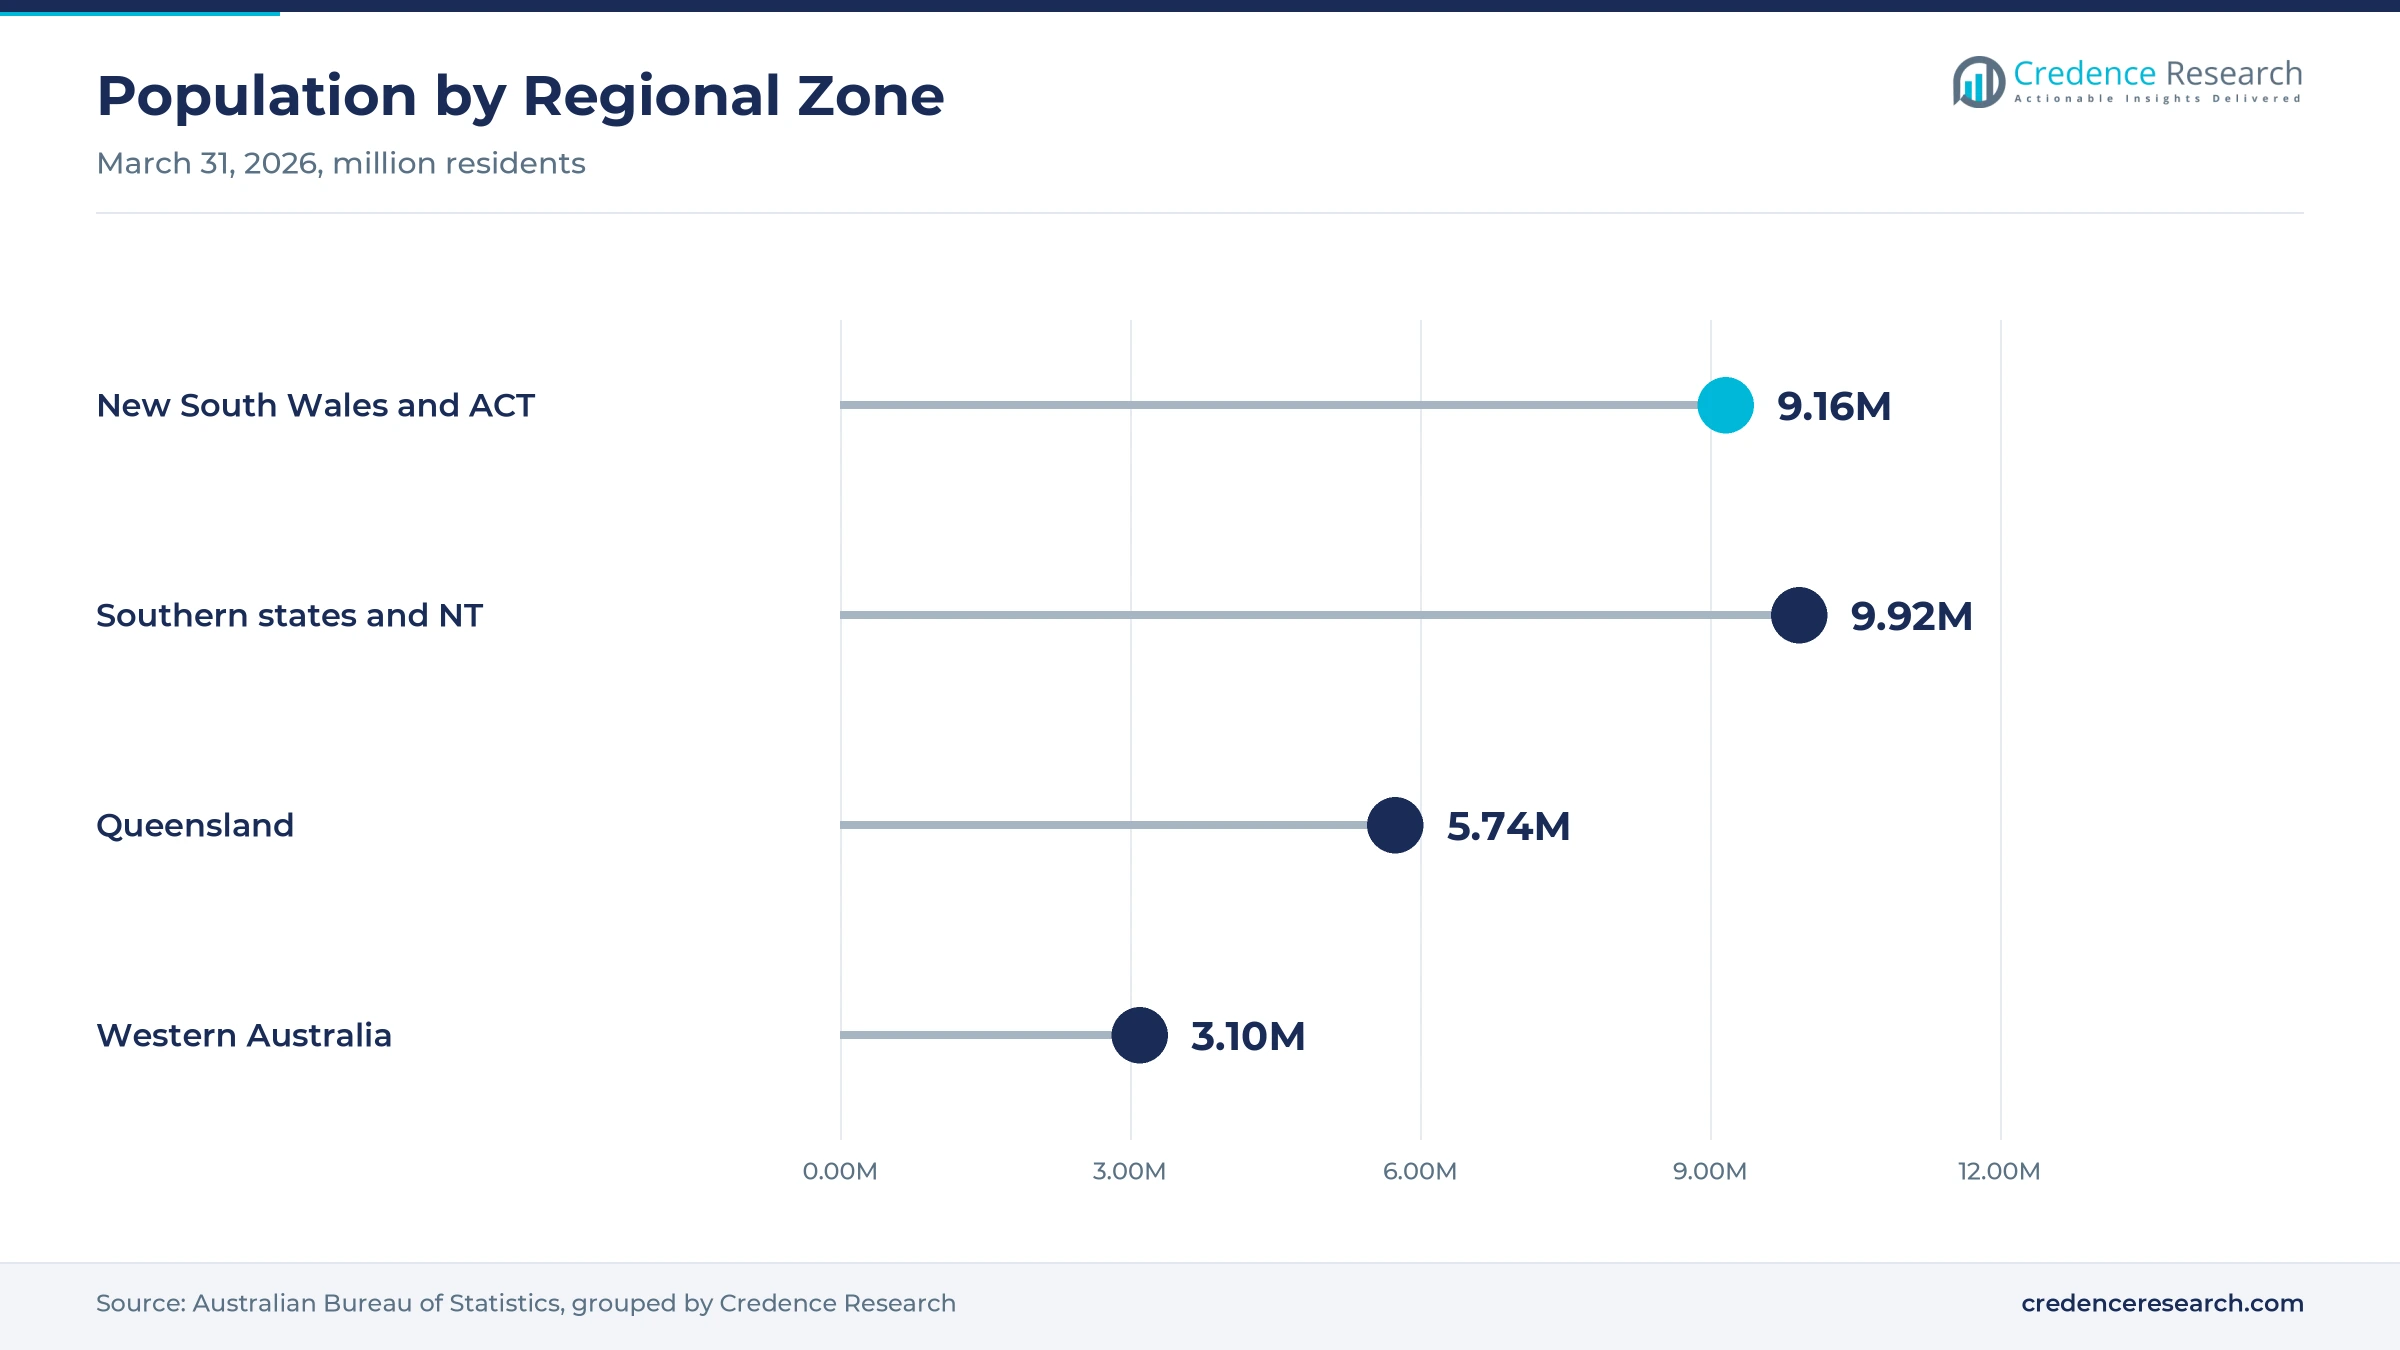
New South Wales and the Australian Capital Territory held a 34.2% share of 2025 value and grow at 14.37% a year, because large utilities, federal agencies and infrastructure projects buy monitoring tools. Sydney Water was the first utility partner in the machine learning water quality forecasting work. The two jurisdictions also had about 9.16 million residents at March 31, 2026. However, growth is slower than in the west because mining activity is smaller.
How do the southern states and NT build demand?
Victoria, South Australia, Tasmania and the Northern Territory held a 30.4% share of 2025 value and grow at 14.57% a year, because utilities and research bodies apply forecasting to catchments and coasts. Melbourne Water modeled two catchments that supply about 80% of Melbourne residents. The zone also had about 9.92 million residents in March 2026, which supports urban air and water programs.
Why is Queensland a hub for rehabilitation monitoring?
Queensland held a 19.2% share of 2025 value and grows at 15.27% a year, because coal and metal mines must prove rehabilitation progress under state closure plans. Dendra supported sign-off for more than 1,500 hectares at the Jellinbah and Oaky Creek mines near Emerald. The state also added about 90,100 residents in the year to March 2026, which lifts construction site monitoring. As a result, both mining and urban buyers support steady growth.
What makes Western Australia the fastest-growing zone?
Western Australia held 16.2% of 2025 value and grows fastest at 15.67% a year, because resource operators expand dust, water and rehabilitation tracking across large remote sites. The state had the fastest population growth at 2.1% in the year to March 2026. Private new capital expenditure in the state also rose 4.0% in the June 2026 quarter, which keeps new projects and their monitoring needs coming.
Deals, sensor launches and reforms marked 2025 to 2026
| Development | Status and market relevance |
|---|---|
| In February 2025, Dendra reported AI-supported rehabilitation sign-off for more than 1,500 hectares at two Bowen Basin coal mines. | Sped up rehabilitation approval by over two years |
| In August 2025, Ideagen completed its acquisition of Envirosuite. | Placed an Australian environmental platform inside a larger compliance group |
| In November 2025, SiteHive launched next-generation Hexanode monitors with built-in audio classification. | Added AI event detection to dust, noise and vibration monitoring |
| In November 2025, Parliament passed national environment law reforms. | Created a National Environmental Protection Agency from July 2026 |
| In December 2025, the government released the National AI Plan. | Funded an AI Safety Institute and agency use of GovAI |
Machine learning, edge sensors and imagery shape the market
- Machine learning forecasting predicts raw water quality and air conditions days or weeks ahead, which lets operators adjust treatment and work plans early.
- Edge audio and image classification identifies noise and dust sources on the device, which cuts false alarms and data transfer.
- High-resolution aerial imagery from drones maps vegetation, weeds and erosion across large sites, which supports rehabilitation evidence.
- Cloud compliance platforms combine sensor feeds, weather data and records in one place, which speeds reporting to regulators and communities.
Need a Custom Version of This Report?
Tailor the scope, geography, or segments to your exact requirements.
- Custom geography or segment scope
- Direct access to our analyst team
Specialist analytics firms and industrial groups compete
Competition combines Australian specialist analytics firms with global industrial and technology groups. Envirosuite offers noise, air quality, odor and emissions analytics to more than 450 customers and became part of Ideagen in August 2025. SiteHive sells AI-enabled Hexanode monitors and a cloud platform for construction and heavy operations. Dendra uses aerial imagery and machine learning for mine rehabilitation and biodiversity work, including two Bowen Basin coal mines. Xylem promotes artificial intelligence for water utilities, while Siemens, Schneider Electric, IBM, Esri Australia, Acoem and HydroTerra supply related platforms, instruments and mapping tools, although their AI monitoring work in Australia could not be verified for this report. Rivals compete on model accuracy, sensor certification, regulatory reporting features, integration with existing networks and support across remote sites.
Companies profiled and their roles in this market
| Company | Type | Role in the market |
|---|---|---|
| Envirosuite | Software platform | Noise, air, odor and emissions analytics, part of Ideagen |
| SiteHive | Sensor and platform | AI-enabled dust, noise and vibration monitors |
| Dendra Systems | Imagery analytics | AI rehabilitation and biodiversity monitoring for mines |
Credence Research view on Australian AI monitoring
Credence Research's view is that Australian spending on AI-based environmental monitoring will grow quickly because climate reporting, nature law reform and utility forecasting all need more data than manual sampling can supply. Software platforms remain the core of spending, while ecosystem tracking and water utilities grow fastest. National agencies starting in July 2026 add new demand for consistent data. However, calibration, draft standards and vendor scale will slow some contracts. Suppliers with certified sensors and audit-ready platforms should gain share fastest.
Regulator data and project reports anchor the AI model
The report uses 2025 as the base year on a calendar basis, and market values come from the Credence Research model. That model combines regulator releases on climate reporting and the Safeguard Mechanism, legislative summaries, university project reports, company announcements, population statistics and World Bank research data. Segment splits and regional growth rates are Credence Research estimates, while regional shares follow the client-defined split. Sources used are public reports, official statistics, trade press, government releases and company releases, and no interviews or surveys were used.
Regulation and utility use carry AI monitoring to 2035
Spending is expected to reach USD 1.41 billion by 2035, a 14.82% CAGR during 2026–2035, as compliance, utility and ecological programs adopt machine learning. Growth should accelerate from 2027 as the third climate reporting group starts and the new national agencies settle their data rules. After that, ecosystem monitoring and medium enterprise buyers will carry more growth as large miners mature. Slower standards work would lower this outlook, while faster utility adoption would raise it.
Frequently Asked Questions
How big is the Australia AI for environmental monitoring market?
Which solution type leads AI-based monitoring spending in Australia?
Which region leads the Australia AI for environmental monitoring market?
Why is mining the largest end-use industry?
How do climate reporting rules affect demand?
Which application grows fastest?
Who are the leading suppliers in this market?
What are the main challenges for AI monitoring suppliers?
Table of Content
Chapter 1 Market Segmentation
- 1.1 Segmentation Framework
- 1.1.1 Product and Service Classification
- 1.1.2 Application and End-Use Classification
- 1.1.3 Technology and Solution Classification
- 1.1.4 Customer and Distribution Channel Classification
- 1.1.5 Geographic Segmentation
- 1.1.6 Market Segment Definitions and Boundaries
- 1.2 By Solution Type
- 1.2.1 AI Software Platforms
- 1.2.2 AI-Integrated Monitoring Hardware
- 1.2.3 AI Analytics Services
- 1.3 By End-Use Industry
- 1.3.1 Mining and Resources
- 1.3.2 Public Administration and Research
- 1.3.3 Water Utilities
- 1.3.4 Agriculture and Built Environment
- 1.4 By Application
- 1.4.1 Air Quality Monitoring
- 1.4.2 Water Quality Monitoring
- 1.4.3 Terrestrial Ecosystem Monitoring
- 1.4.4 Emissions and Site Impact Monitoring
- 1.5 By Enterprise Size
- 1.5.1 Large Enterprises
- 1.5.2 Medium Enterprises
- 1.5.3 Small Enterprises
Chapter 2 Introduction
- 2.1 Report Objectives and Scope
- 2.2 Product Definition and Industry Terminology
- 2.3 Market Inclusions and Exclusions
- 2.4 Research Process
- 2.4.1 Primary Research and Expert Interviews
- 2.4.2 Secondary Research and Source Review
- 2.4.3 Top-Down and Bottom-Up Estimation
- 2.4.4 Data Triangulation and Verification
- 2.5 Market Size Measurement Basis
- 2.5.1 2025: USD 354.5 million → 2035: USD 1.41 billion
- 2.6 Historical and Forecast Reference Periods
- 2.6.1 Historical Period: 2018-2025
- 2.6.2 Base Year: 2025
- 2.6.3 Forecast Period: 2025-2035
- 2.7 Research Assumptions and Limitations
Chapter 3 Executive Summary
- 3.1 Market Snapshot and Key Findings
- 3.2 Base-Year Market Size, 2025
- 3.3 Forecast Market Size, 2035
- 3.4 Revenue and Volume Growth Outlook
- 3.5 Key Demand and Supply Indicators
- 3.6 Leading Market Segments
- 3.7 Fastest-Growing Market Opportunities
- 3.8 Regional Performance Highlights
- 3.9 Technology and Industry Transformation
- 3.10 Competitive Landscape Summary
- 3.11 Analyst View and Strategic Implications
Chapter 4 Australia AI for Environmental Monitoring Market Trends and Developments
- 4.1 Historical Industry Development, 2018-2025
- 4.2 Recent Market Trends and Developments
- 4.3 Demand and Customer Behavior Trends
- 4.4 Technology and Product Innovation
- 4.5 Artificial Intelligence, Automation and Digitalization
- 4.6 Local Manufacturing and Supply Chain Realignment
- 4.7 Industry Partnerships, Mergers and Acquisitions
- 4.8 Sustainability and Circular Economy Developments
- 4.9 Government and Private Sector Investment Trends
- 4.10 Emerging Business Models and Commercialization
- 4.11 Industry Developments and Announcements
Chapter 5 Australia AI for Environmental Monitoring Market Supply and Demand Analysis
- 5.1 Demand Trend and Consumption Analysis, 2018-2025
- 5.2 Demand Forecast, 2025-2035
- 5.3 Supply Chain Structure and Procurement Trends
- 5.4 Supply-Demand Gap and Bottlenecks
- 5.5 Import Dependence and Sourcing Structure
- 5.6 Regional Supply and Demand Concentration
Chapter 6 Australia AI for Environmental Monitoring Market Pricing Analysis
- 6.1 Pricing Structure and Measurement
- 6.2 Historical Pricing Trends, 2018-2025
- 6.3 Pricing Outlook, 2025-2035
- 6.4 Pricing by Product and Market Segment
- 6.5 Geographic Pricing Differences
- 6.6 Key Input, Energy, Labor and Logistics Costs
- 6.7 Contract Pricing and Purchasing Models
- 6.8 Pricing Sensitivity and Competitive Positioning
- 6.9 Price, Margin and Profitability Implications
Chapter 7 Australia AI for Environmental Monitoring Market Dynamics
- 7.1 Market Growth Drivers
- 7.1.1 Demand-Side Drivers
- 7.1.2 Technology and Innovation Drivers
- 7.1.3 Infrastructure and Investment Drivers
- 7.1.4 Regulatory and Policy Drivers
- 7.2 Market Restraints
- 7.2.1 Cost and Affordability Constraints
- 7.2.2 Technology and Adoption Barriers
- 7.2.3 Supply Chain and Operational Constraints
- 7.3 Market Challenges
- 7.3.1 Competitive Pressure and Margin Erosion
- 7.3.2 Skills, Infrastructure and Implementation Gaps
- 7.4 Emerging Market Opportunities
- 7.5 Market Dynamics Impact and Time-Horizon Assessment
Chapter 8 Australia AI for Environmental Monitoring Value Chain Analysis
- 8.1 Industry Value Chain Overview
- 8.2 Upstream Suppliers and Critical Inputs
- 8.3 Technology and Component Providers
- 8.4 Manufacturing or Service Delivery
- 8.5 Distribution, Channel Partners and Integrators
- 8.6 Downstream Applications and End Users
- 8.7 Value Addition and Profit Pools
- 8.8 Vertical Integration and Outsourcing
- 8.9 Supplier Concentration and Risk
- 8.10 Supply Chain Localization and Resilience
Chapter 9 Australia AI for Environmental Monitoring Market Regulations and Policies
- 9.1 Relevant Laws, Standards and Compliance Frameworks
- 9.2 Product, Service, Safety and Quality Requirements
- 9.3 Government Policies, Incentives and Subsidies
- 9.4 Imports, Exports and Trade Barriers
- 9.5 Public Procurement and Local Content Requirements
- 9.6 Data Protection, AI and Cybersecurity Compliance
- 9.7 Upcoming Policy Changes and Market Implications
Chapter 10 Australia AI for Environmental Monitoring Market Hotspots and Opportunities
- 10.1 Market Opportunity Mapping and Growth Hotspots
- 10.2 High-Growth Applications and Customer Groups
- 10.3 Underserved Markets and White-Space Opportunities
- 10.4 Emerging Technology and Product Opportunities
- 10.5 New Capacity and Investment Hotspots
- 10.6 Market Entry and Expansion Opportunities
- 10.7 Distribution and Partnership Opportunities
- 10.8 Near-Term and Long-Term Commercial Potential
- 10.9 Opportunity Attractiveness and Execution Risks
Chapter 11 Australia AI for Environmental Monitoring Market Outlook, 2025-2035
- 11.1 Market Size and Analysis
- 11.1.1 Revenue (Market Measurement: 2025: USD 354.5 million → 2035: USD 1.41 billion)
- 11.1.2 Historical Market Size, 2018-2025
- 11.1.3 Base-Year Market Size, 2025
- 11.2 Market Forecast, 2025-2035
- 11.2.1 Revenue Forecast to 2035
- 11.2.2 CAGR and Year-on-Year Growth
- 11.2.3 Incremental Revenue Opportunity
- 11.3 Forecast Assumptions and Scenario Analysis
- 11.3.1 Base-Case Forecast
- 11.3.2 Optimistic and Conservative Scenarios
- 11.3.3 Technology, Pricing and Policy Sensitivities
- 11.4 Market Attractiveness and Growth Outlook
Chapter 12 Australia AI for Environmental Monitoring Market Segmentation and Outlook
- 12.1 Segmentation Summary and Market Shares, 2025
- 12.2 Largest and Fastest-Growing Segments
- 12.3 By Solution Type - Market Size and Forecast, 2025-2035
- 12.3.1 Segment Definition and Scope
- 12.3.2 Historical Market Size, 2018-2025
- 12.3.3 Revenue Forecast, 2025-2035
- 12.3.4 Base-Year Market Share, 2025
- 12.3.5 Segment CAGR and Growth Drivers
- 12.3.6 Subsegment Market Size and Forecast
- 12.3.6.1 AI Software Platforms
- 12.3.6.2 AI-Integrated Monitoring Hardware
- 12.3.6.3 AI Analytics Services
- 12.3.7 Subsegment Pricing and Adoption Trends
- 12.3.8 Leading Suppliers and Competition
- 12.3.9 Regional Demand and Opportunities
- 12.4 By End-Use Industry - Market Size and Forecast, 2025-2035
- 12.4.1 Segment Definition and Scope
- 12.4.2 Historical Market Size, 2018-2025
- 12.4.3 Revenue Forecast, 2025-2035
- 12.4.4 Base-Year Market Share, 2025
- 12.4.5 Segment CAGR and Growth Drivers
- 12.4.6 Subsegment Market Size and Forecast
- 12.4.6.1 Mining and Resources
- 12.4.6.2 Public Administration and Research
- 12.4.6.3 Water Utilities
- 12.4.6.4 Agriculture and Built Environment
- 12.4.7 Subsegment Pricing and Adoption Trends
- 12.4.8 Leading Suppliers and Competition
- 12.4.9 Regional Demand and Opportunities
- 12.5 By Application - Market Size and Forecast, 2025-2035
- 12.5.1 Segment Definition and Scope
- 12.5.2 Historical Market Size, 2018-2025
- 12.5.3 Revenue Forecast, 2025-2035
- 12.5.4 Base-Year Market Share, 2025
- 12.5.5 Segment CAGR and Growth Drivers
- 12.5.6 Subsegment Market Size and Forecast
- 12.5.6.1 Air Quality Monitoring
- 12.5.6.2 Water Quality Monitoring
- 12.5.6.3 Terrestrial Ecosystem Monitoring
- 12.5.6.4 Emissions and Site Impact Monitoring
- 12.5.7 Subsegment Pricing and Adoption Trends
- 12.5.8 Leading Suppliers and Competition
- 12.5.9 Regional Demand and Opportunities
- 12.6 By Enterprise Size - Market Size and Forecast, 2025-2035
- 12.6.1 Segment Definition and Scope
- 12.6.2 Historical Market Size, 2018-2025
- 12.6.3 Revenue Forecast, 2025-2035
- 12.6.4 Base-Year Market Share, 2025
- 12.6.5 Segment CAGR and Growth Drivers
- 12.6.6 Subsegment Market Size and Forecast
- 12.6.6.1 Large Enterprises
- 12.6.6.2 Medium Enterprises
- 12.6.6.3 Small Enterprises
- 12.6.7 Subsegment Pricing and Adoption Trends
- 12.6.8 Leading Suppliers and Competition
- 12.6.9 Regional Demand and Opportunities
- 12.7 Segment Growth Comparison
- 12.8 Segment Attractiveness and Priority Matrix
Chapter 13 Australia AI for Environmental Monitoring End-Use and Application Market Outlook
- 13.1 End-Use Industry and Customer Demand Structure
- 13.2 Leading Applications and Customer Groups
- 13.3 End-Use Market Size, Share and Forecast
- 13.4 Major End-Use Industry Deep Dives
- 13.4.1 Customer Requirements and Use Cases
- 13.4.2 Demand and Replacement Cycles
- 13.4.3 Technical and Regulatory Considerations
- 13.4.4 Purchasing and Procurement Models
- 13.4.5 Leading Vendors and Distribution Channels
- 13.4.6 Forecast and Commercial Opportunities
- 13.5 Emerging Applications and Cross-Segment Demand
- 13.6 End-Use Industry Investment Priorities
Chapter 14 Australia AI for Environmental Monitoring Geographic Market Outlook, 2025-2035
- 14.1 Domestic Market Distribution and Demand Clusters
- 14.2 State- or Province-Wise Market Size and Forecast, 2025-2035
- 14.3 City and Metropolitan Market Outlook
- 14.4 Industrial, Manufacturing and Commercial Clusters
- 14.5 Geographic Concentration of Key End Users
- 14.6 Local Pricing and Purchasing Differences
- 14.7 Domestic Production Facilities and Capacity Map
- 14.8 Local Infrastructure and Project Pipeline
- 14.9 State-Level Policy and Incentive Differences
- 14.10 Subnational Investment Hotspots and Opportunities
- 14.11 Distribution and Logistics Networks
- 14.12 Domestic Competitive Footprint
Chapter 15 Australia AI for Environmental Monitoring Technology, Innovation and Sustainability Outlook
- 15.1 Technology Landscape and Maturity
- 15.2 Product, Process and Service Innovation
- 15.3 AI, Automation and Digital Tools in the Industry
- 15.4 Technology Adoption and Performance Benchmarking
- 15.5 Innovation Pipeline and R&D Investment
- 15.6 Patent and Intellectual Property Trends
- 15.7 Energy Efficiency and Resource Management
- 15.8 Sustainability, Recycling and Circularity
- 15.9 Technology Roadmap, 2025-2035
- 15.10 Risks of Obsolescence and Technology Substitution
Chapter 16 Australia AI for Environmental Monitoring Market Key Strategic Imperatives
- 16.1 Growth and Market Entry Priorities
- 16.2 High-Return Products and Segments
- 16.3 Pricing, Profitability and Cost Optimization
- 16.4 Technology Investment and Product Differentiation
- 16.5 Supply Chain Localization and Resilience
- 16.6 Distribution and Customer Acquisition
- 16.7 Partnership, Acquisition and Capacity Strategy
- 16.8 Regional Expansion Priorities
- 16.9 Short-, Medium- and Long-Term Actions
Chapter 17 Competition Outlook
- 17.1 Industry Competition Characteristics
- 17.2 Market Structure and Concentration
- 17.3 Market Share and Competitive Positioning, 2025
- 17.4 Company-Wise Revenue and Product Benchmarking
- 17.5 Production and Service Capacity Benchmarking
- 17.6 Technology, Pricing and Differentiation
- 17.7 Regional Footprint and Distribution Strength
- 17.8 Mergers, Acquisitions and Strategic Alliances
- 17.9 New Entrants and Competitive Threats
- 17.10 Porter's Five Forces and Industry Attractiveness
- 17.11 Competitive Outlook, 2025-2035
Chapter 18 Company Profiles
- 18.1 Company Coverage and Selection Criteria
- 18.2 Envirosuite
- 18.2.1 Business Description
- 18.2.2 Company Ownership and Geographic Presence
- 18.2.3 Product and Service Portfolio
- 18.2.4 Manufacturing and Operating Footprint
- 18.2.5 Financial Performance and Investment
- 18.2.6 Market Share and Competitive Position
- 18.2.7 Technology and Innovation Capabilities
- 18.2.8 Strategic Alliances or Partnerships
- 18.2.9 Recent Developments
- 18.2.10 Growth Strategy and Outlook
- 18.3 Siemens
- 18.4 Schneider Electric
- 18.5 Xylem
- 18.6 IBM
- 18.7 Esri Australia
- 18.8 Acoem
- 18.9 SiteHive
- 18.10 Dendra Systems
- 18.11 HydroTerra
- 18.12 Other Relevant Market Participants
Note: Every listed company is profiled on the structure shown under the first company. The company list is preliminary and may change based on research findings, market developments, data availability and client requirements.
Chapter 19 Disclaimer
- 19.1 Research and Forecast Disclaimer
- 19.2 Data Source and Estimation Limitations
Note: The depth of individual sections depends on data availability for this market. Volume, capacity, trade and other unit-based metrics are included where applicable.

