
Baijiu scale meets Indian premium whisky growth
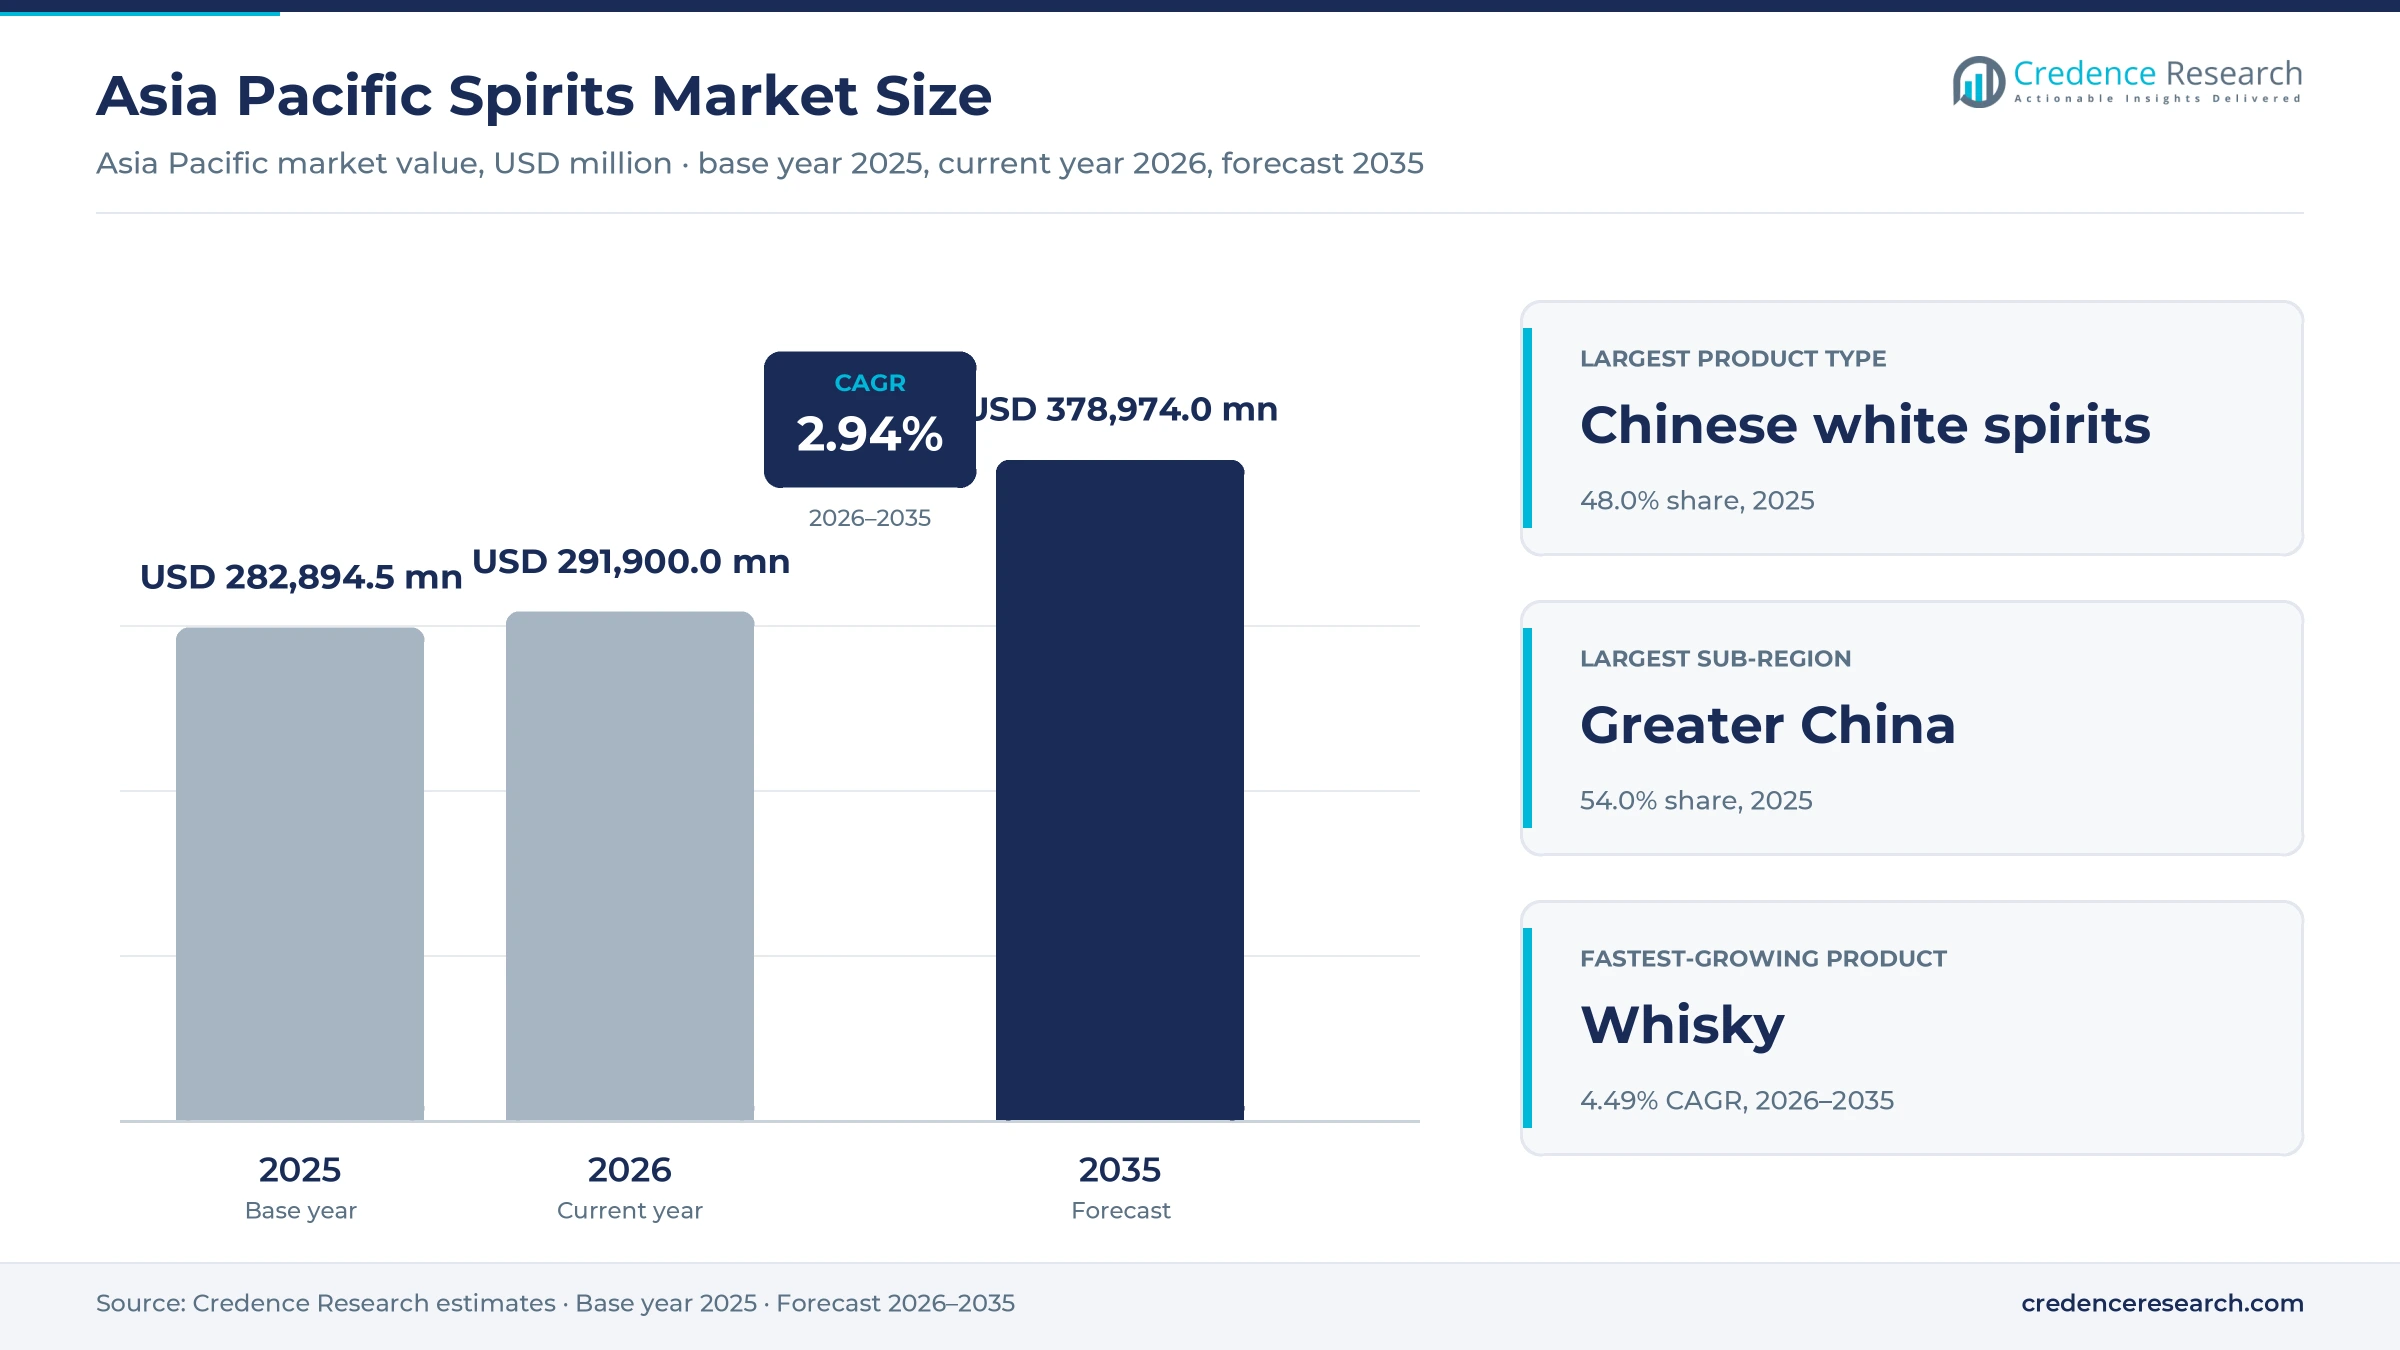
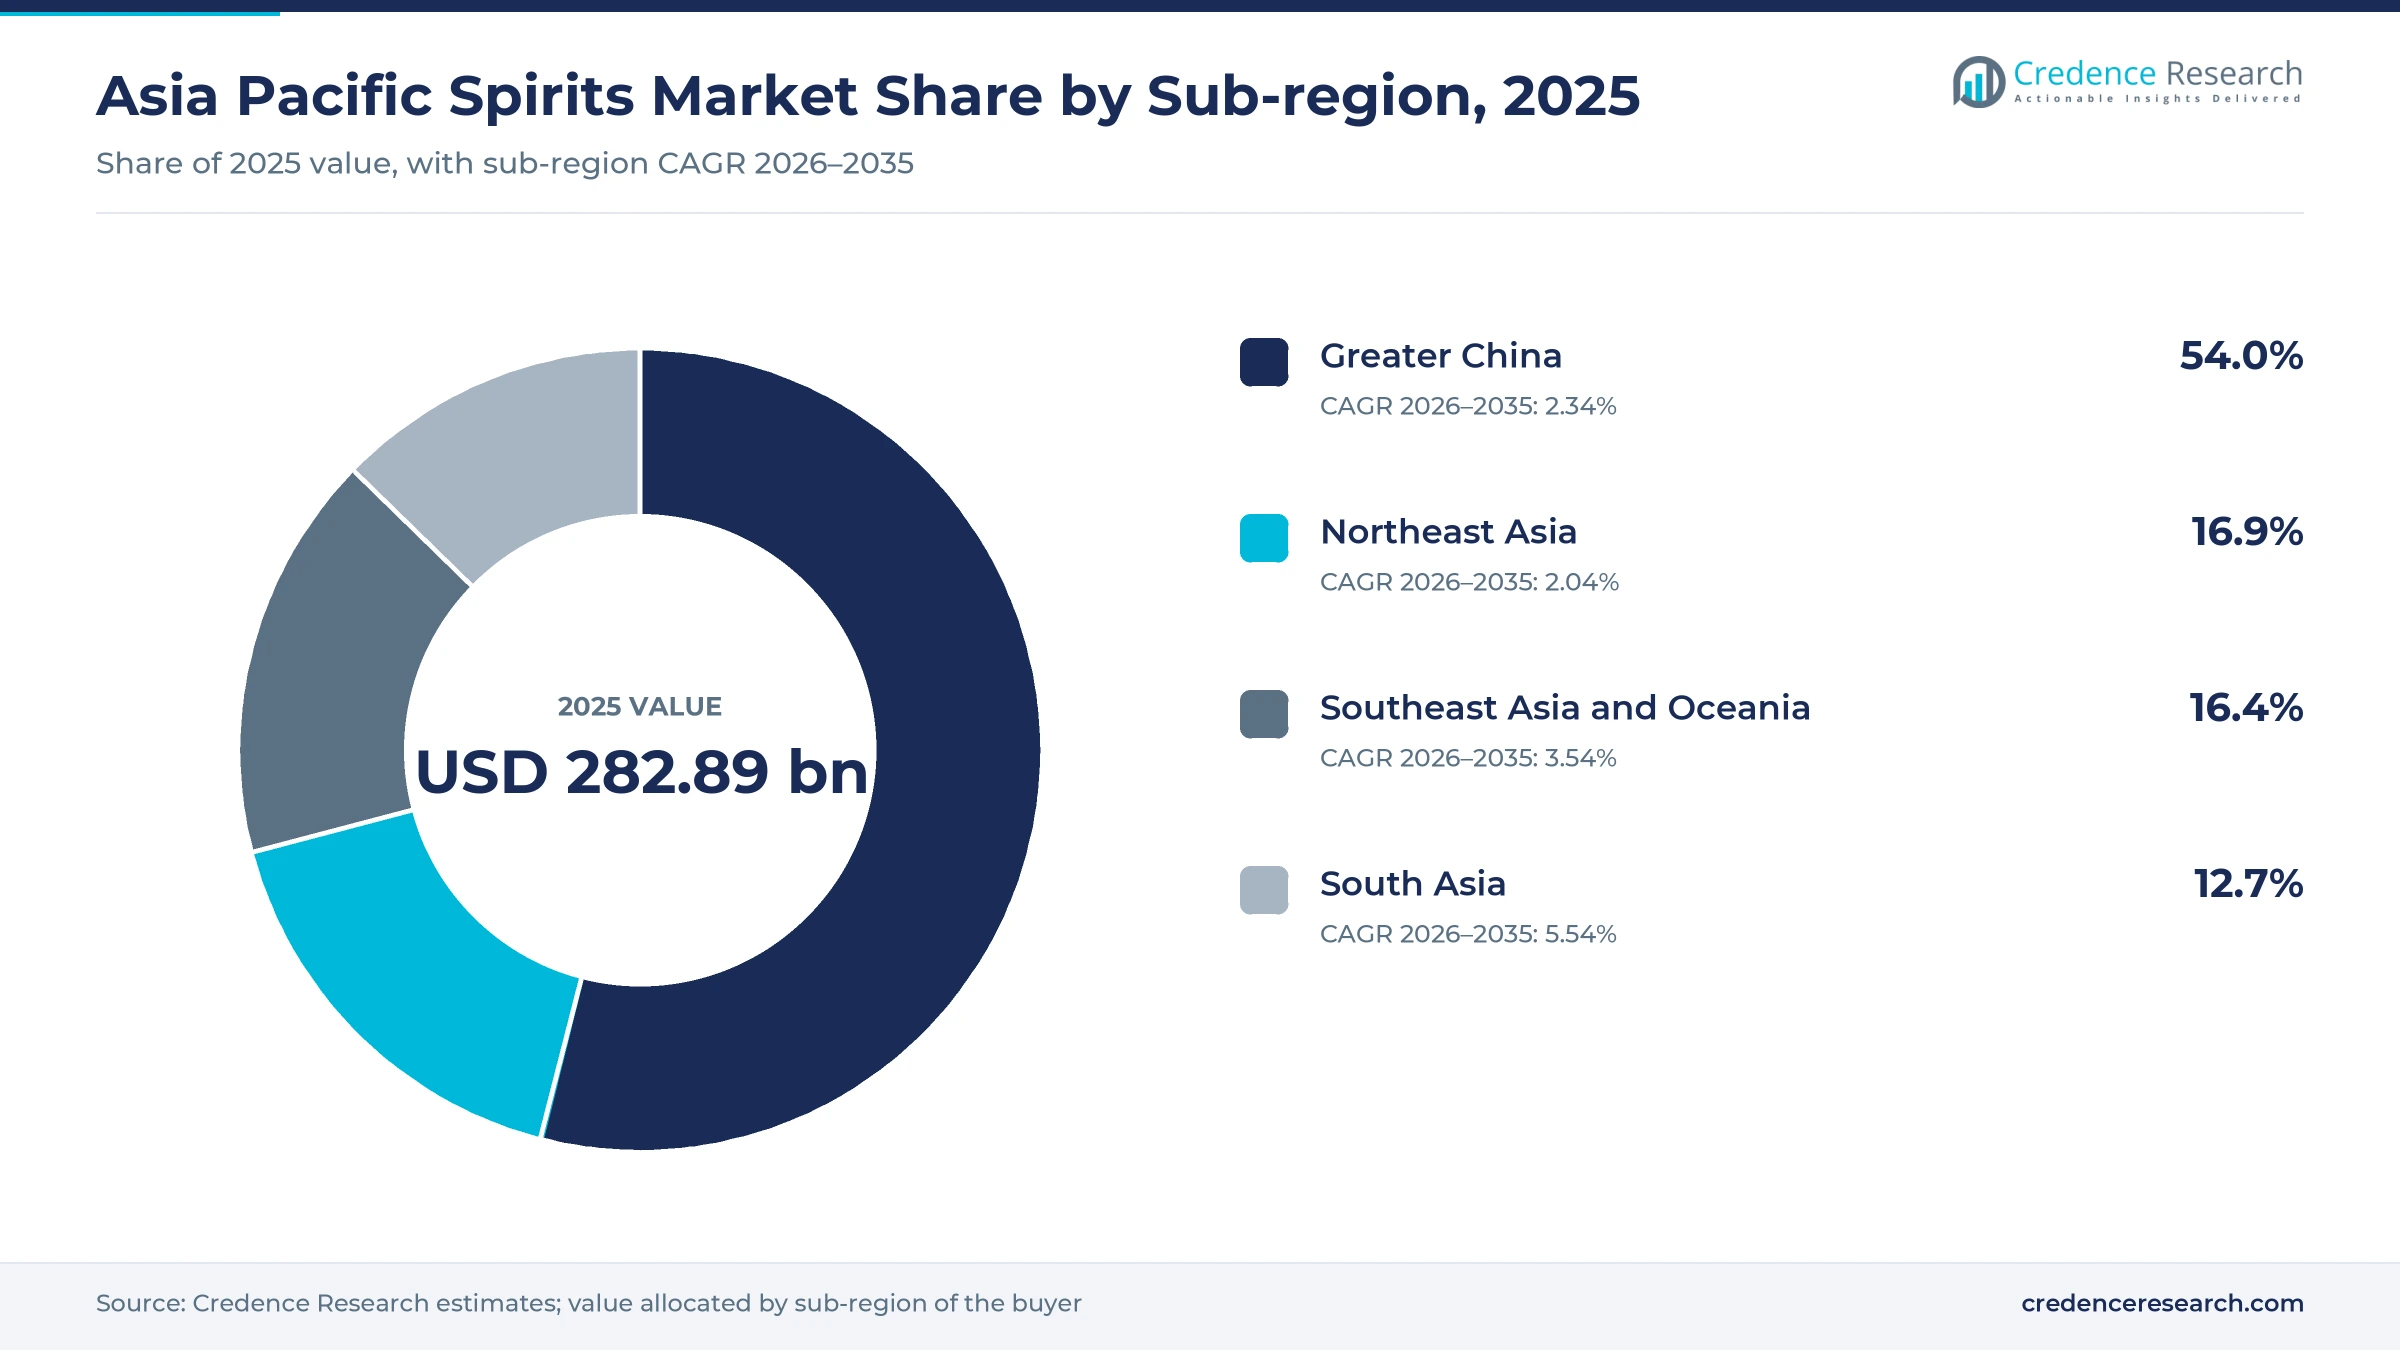
The Asia Pacific spirits market was valued at USD 282.89 billion in 2025 and is projected to increase from USD 291.90 billion in 2026 to USD 378.97 billion by 2035, registering a CAGR of 2.94% during 2026–2035. Demand comes from baijiu drinkers and gift buyers in China, whisky drinkers who trade up in India, and shochu, soju and brandy consumers across Northeast and Southeast Asia. Greater China held the largest sub-regional share, 54.0% in 2025, because baijiu remains the main drink at business dinners, weddings and festivals. South Asia is the fastest-growing sub-region at 5.54% a year, as Indian buyers move from popular brands to premium whisky and local single malts. Southeast Asia and Oceania add steady demand from Thai, Philippine and Australian drinkers. Trade rules are also changing, because the U.K.-India trade agreement took effect on July 15, 2026, and starts to lower India's 150% duty on imported whisky.
Which distilled drinks does the regional estimate cover?
The estimate measures retail spending on distilled alcoholic drinks across the Asia Pacific region, including baijiu and other Chinese white spirits, shochu and soju, whisky, brandy, vodka, rum, gin and other distilled liquors. It covers sales to residents who drink at home or buy gifts, and to visitors who buy during trips. Values are measured at the price paid in shops, bars, restaurants and online stores, including duties.
The estimate excludes beer, wine, cider, sake and ready-to-drink canned cocktails, along with bulk spirit sold between distillers for blending. The value chain runs from grain, malt and grape suppliers through distilleries, bottlers and importers to distributors, retailers, restaurants and e-commerce platforms that sell to drinkers in Greater China, Northeast Asia, South Asia, Southeast Asia and Oceania.
Asia Pacific Spirits Market Insights
- The Asia Pacific spirits market was valued at USD 282.89 billion in 2025 and is projected to reach USD 378.97 billion by 2035, registering a CAGR of 2.94% during 2026–2035.
- Greater China held a 54.0% share of 2025 value, even though Chinese baijiu output fell 12.1% in 2025 to 3.55 million kiloliters.
- Chinese white spirits led product demand with a 48.0% share of 2025 value, because baijiu anchors banquets and gifts in China.
- The U.K.-India trade agreement took effect on July 15, 2026, and cuts India's whisky tariff from 150% to 40% over time.
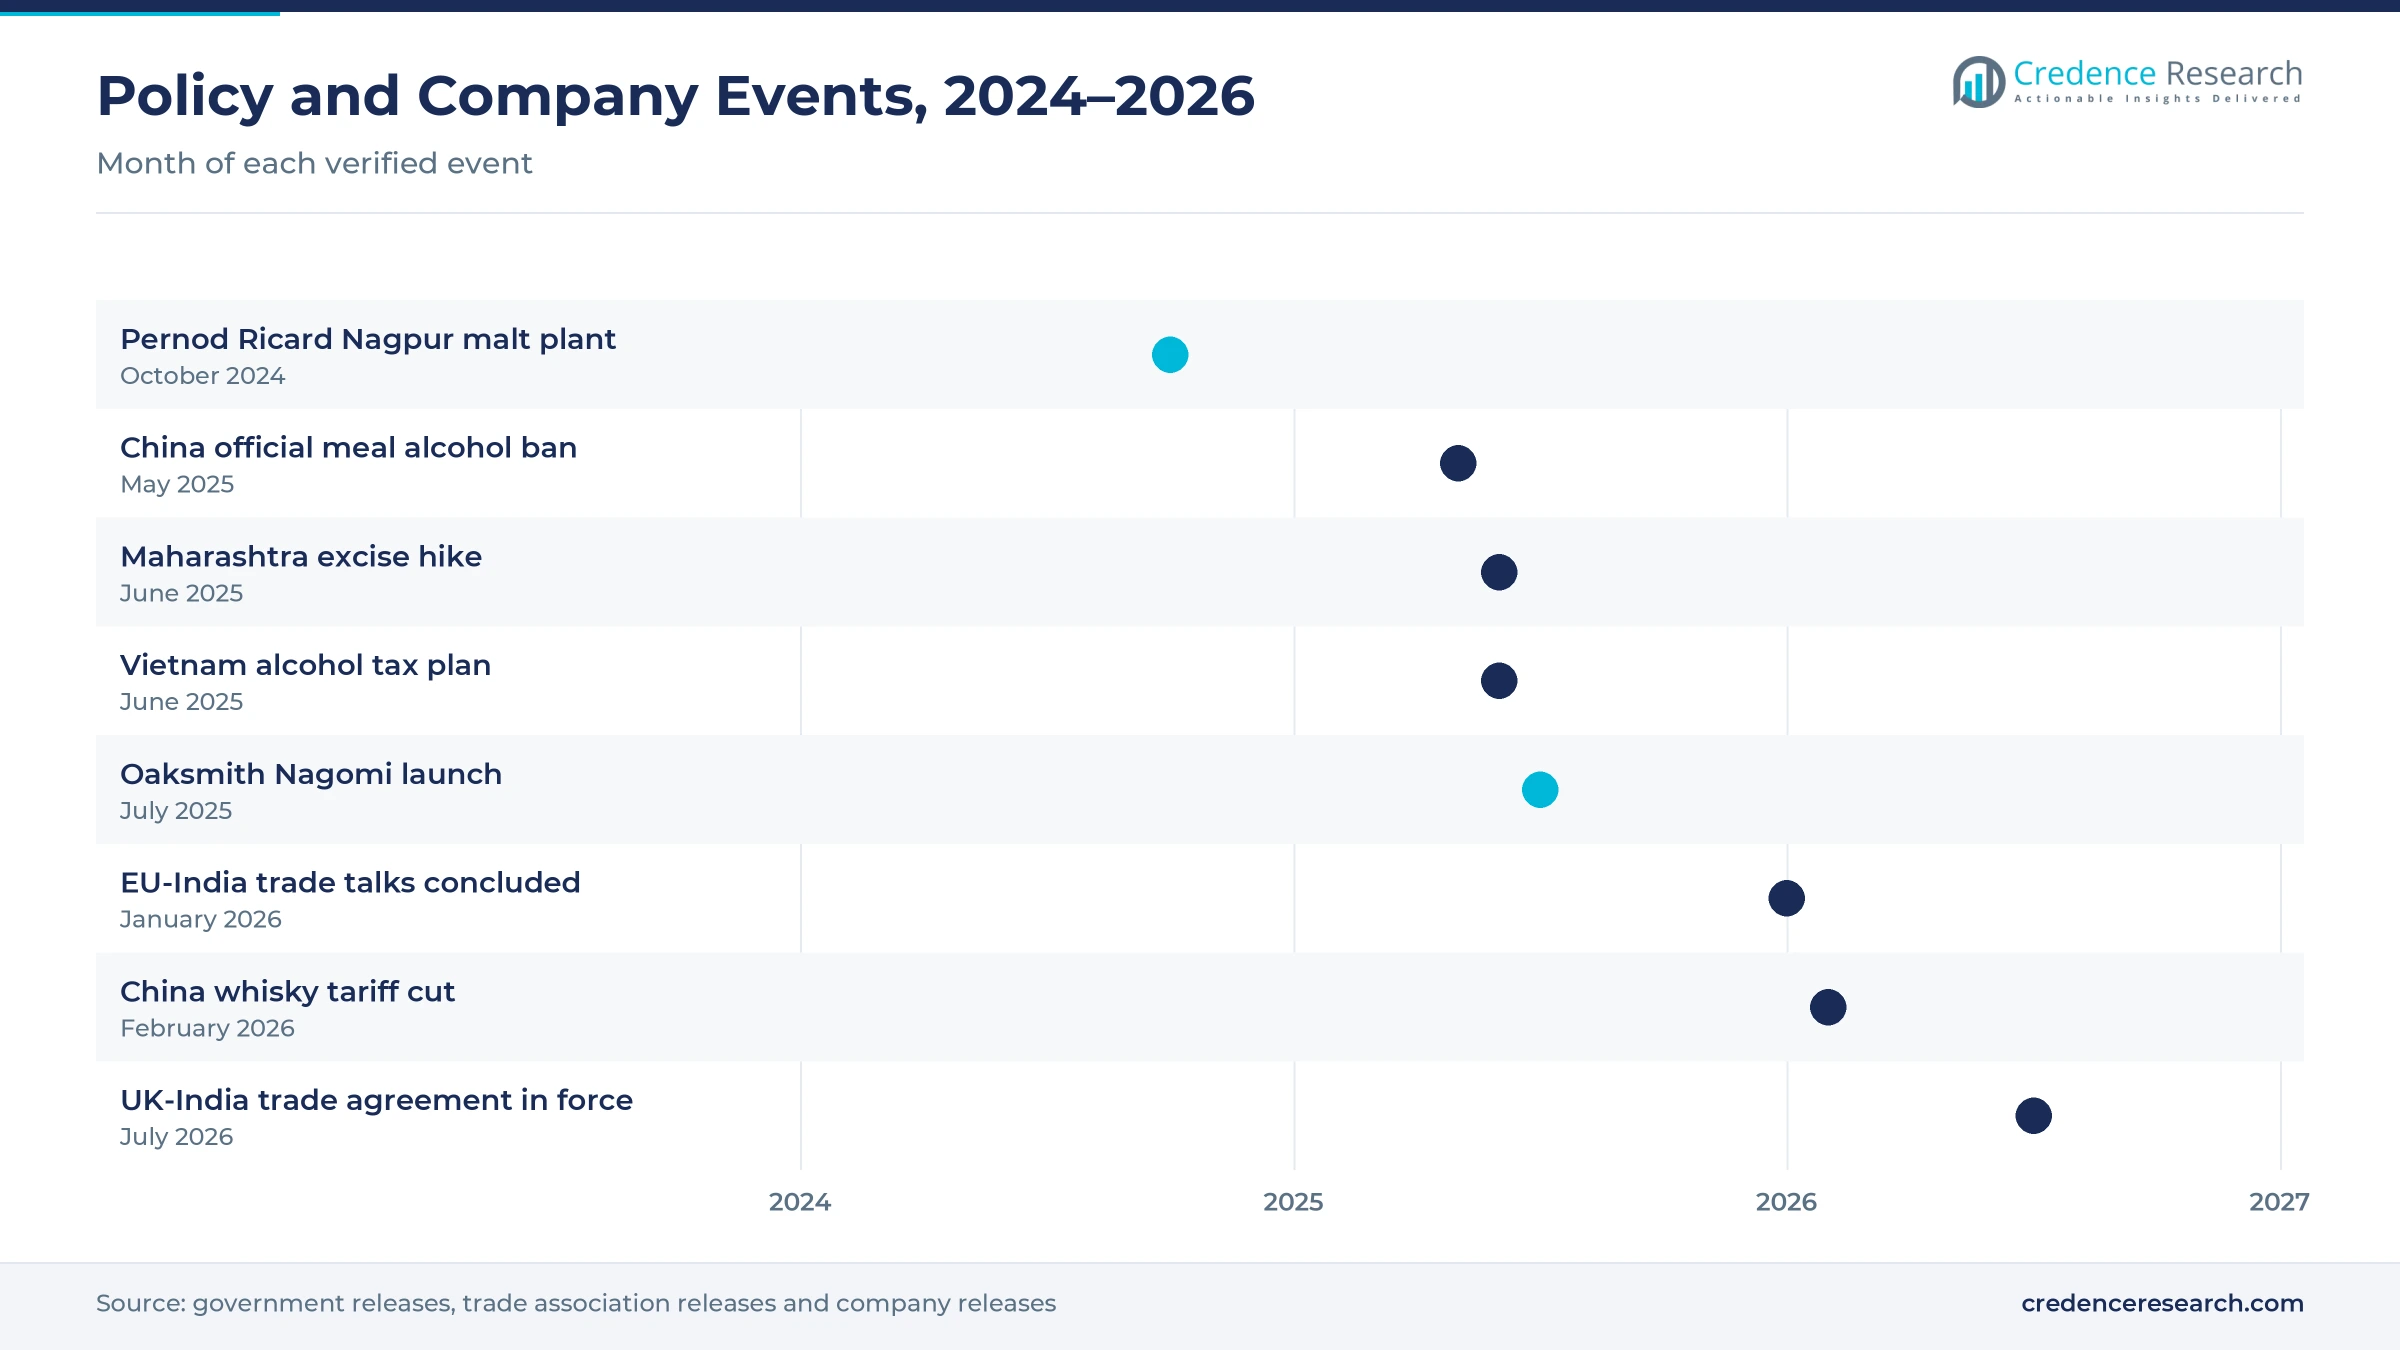
- Pernod Ricard India broke ground on Oct. 7, 2024, on a Nagpur malt plant with capacity for 13 million pure alcohol liters a year.
Chinese white spirits lead while whisky grows fastest
Why do Chinese white spirits dominate product demand?
Based on product type, the market is categorized into Chinese white spirits, shochu and soju, whisky and brandy and other distilled spirits. Chinese White Spirits led with a 48.0% share of 2025 value, because baijiu remains the main drink at Chinese banquets and the most common liquor gift. Whisky grows fastest at 4.49% a year, as Indian buyers trade up and tariff cuts lower the cost of imported Scotch.
How do standard and premium bottles shape price tiers?
Based on price tier, the market is categorized into economy, standard, premium and luxury. Economy led with a 30.0% share of 2025 value, because low-priced baijiu, soju and Indian popular whisky sell in very large volumes. Premium grows fastest at 4.02% a year, as Indian drinkers move to prestige brands and local single malts, while luxury baijiu adjusts to lower wholesale prices.
Why does physical off-trade lead distribution?
Based on distribution channel, the market is categorized into physical off-trade, on-trade and e-commerce. Physical Off-Trade led with a 62.0% share of 2025 value, because state-licensed liquor stores in India and specialty baijiu shops in China handle most bottle sales. E-Commerce grows fastest at 5.12% a year, as distillers sell through their own apps and quick-delivery stores on social commerce platforms.
How does routine drinking lead purchase occasions?
Based on purchase occasion, the market is categorized into routine consumption, dining and celebration, and gifting and collecting. Routine Consumption led with a 44.0% share of 2025 value, because everyday soju, shochu and Indian whisky drinking happens far more often than banquets. Routine Consumption also grows fastest at 3.31% a year, while official banquet curbs in China weigh on gifting demand.
| Segment Group | Leading Sub-segment | Share, 2025 | Fastest-growing Sub-segment | CAGR, 2026–2035 |
|---|---|---|---|---|
| By Product Type | Chinese White Spirits | 48.0% | Whisky | 4.49% |
| By Price Tier | Economy | 30.0% | Premium | 4.02% |
| By Distribution Channel | Physical Off-Trade | 62.0% | E-Commerce | 5.12% |
| By Purchase Occasion | Routine Consumption | 44.0% | Routine Consumption | 3.31% |
Request a Free Sample
Fill in your details and we'll send you a free sample report.
- Sample data tables & charts
- Research methodology
Premium mix, tariff cuts and local distilling drive demand
How does Indian premiumization lift the portfolio mix?
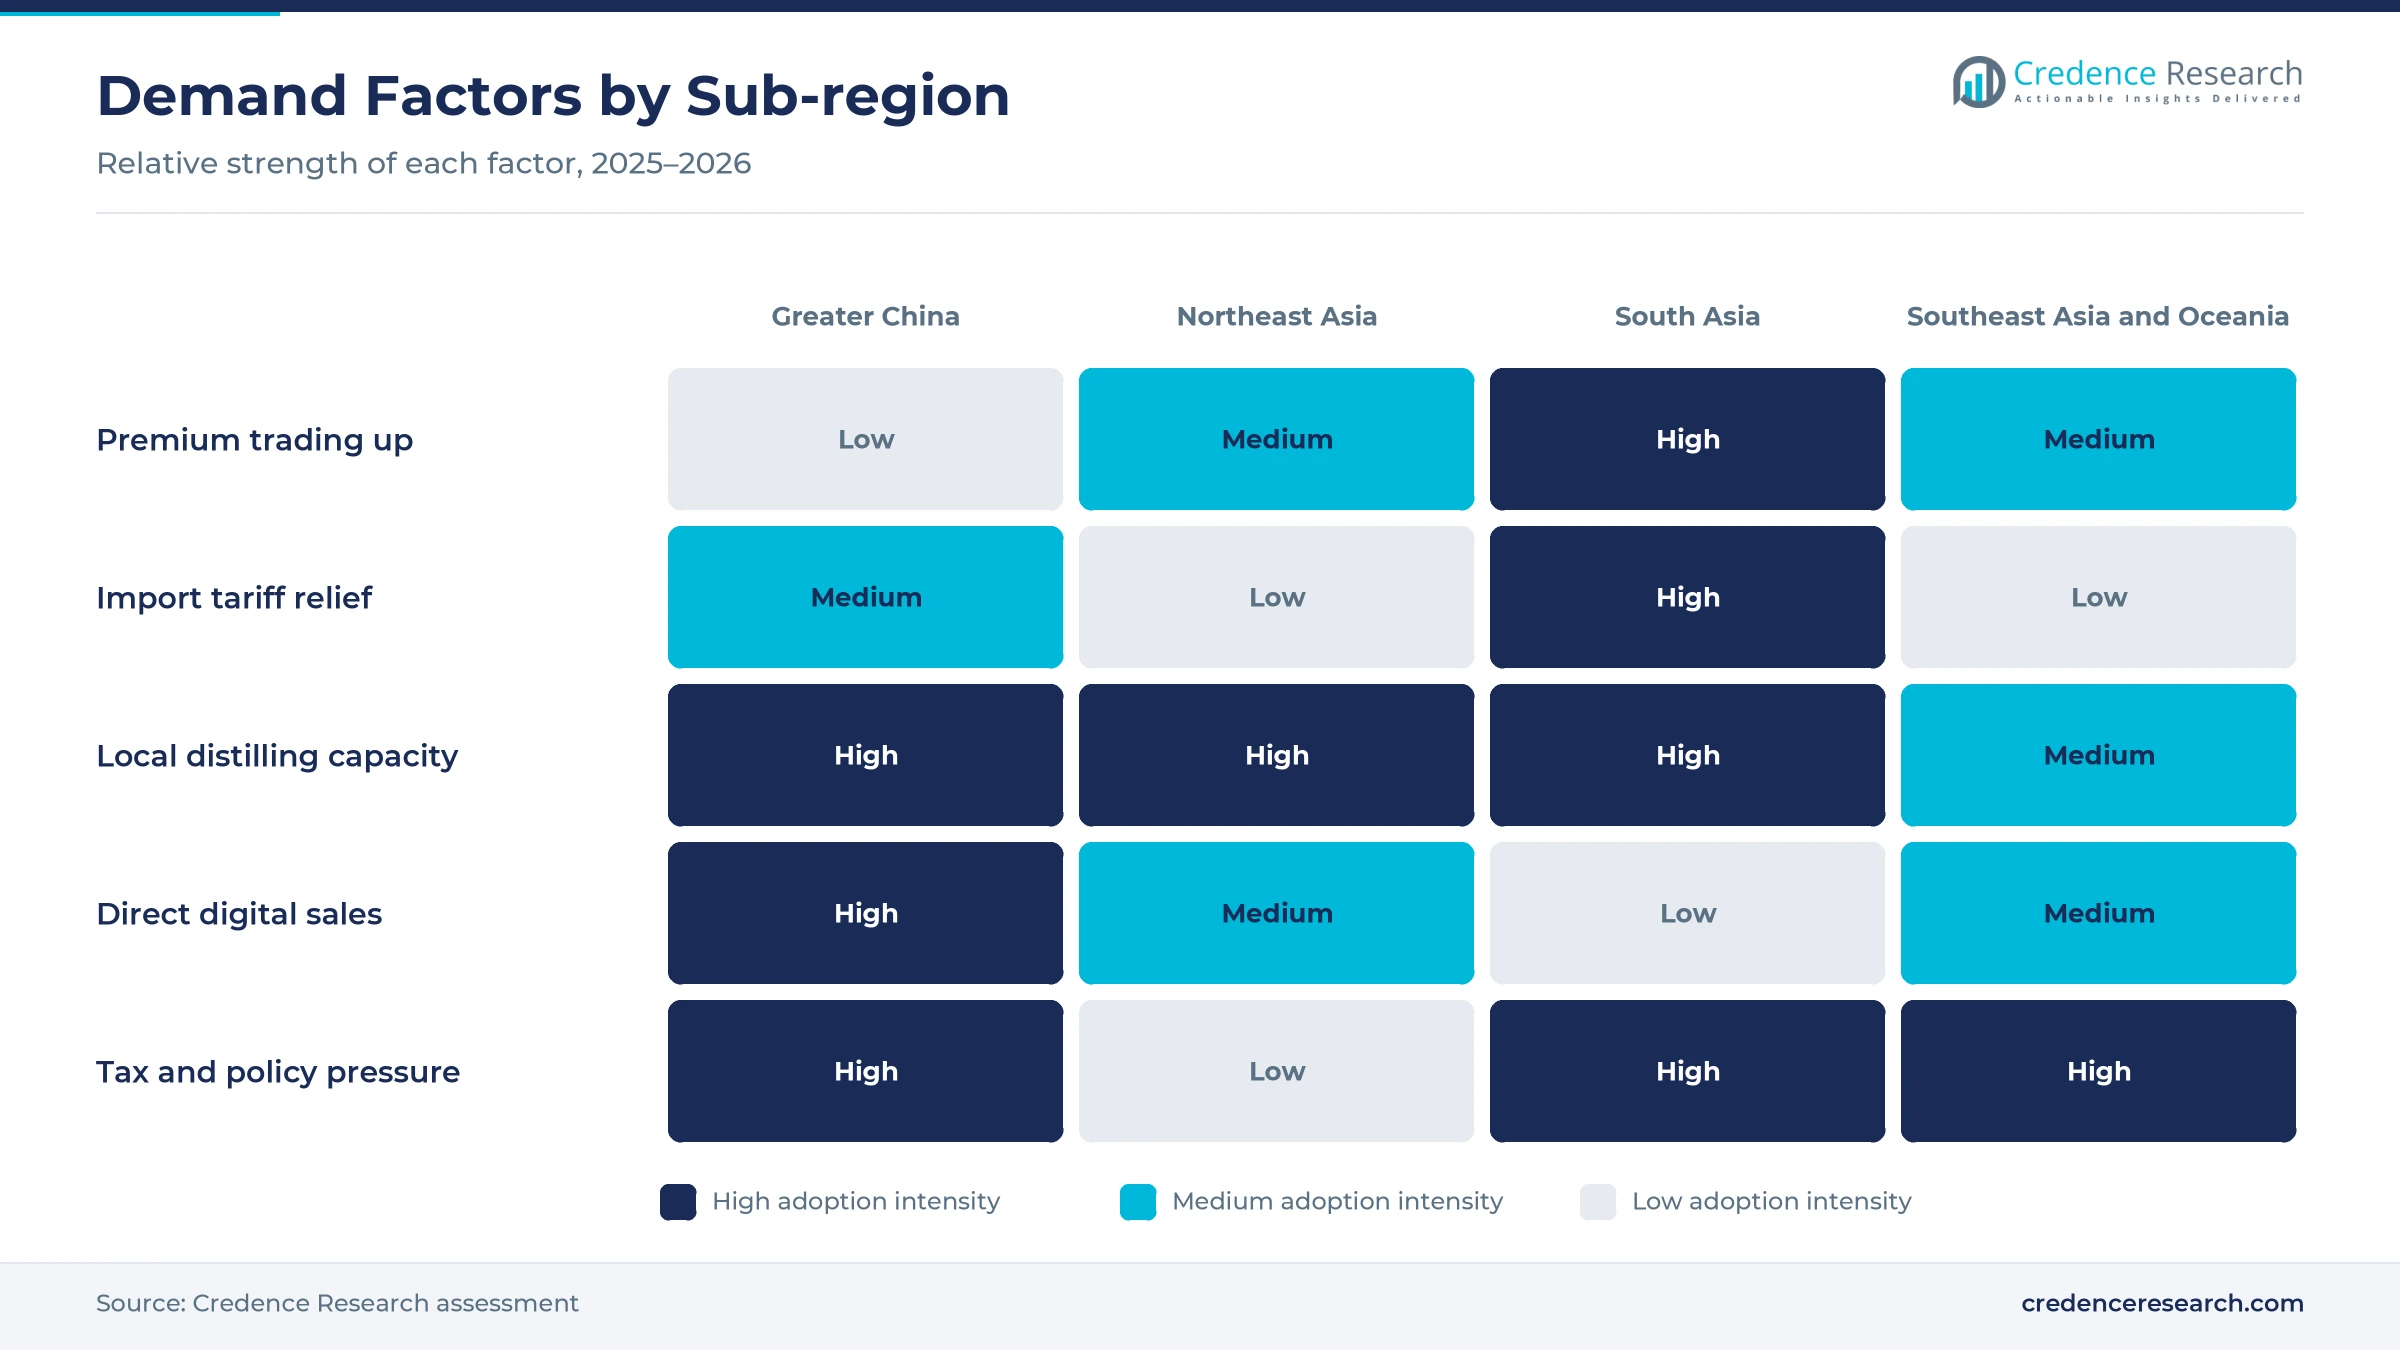
Indian drinkers are moving from popular brands to higher-priced whisky, which raises the value of each case sold. Diageo India said on July 22, 2026, that its prestige-and-above brands grew in the June quarter while its popular brands declined, a pattern it partly tied to Maharashtra policy. Suntory Global Spirits launched Oaksmith Nagomi in Goa on July 15, 2025, as its most premium Indian whisky for drinkers who want to upgrade from regular brands. Piccadily Distilleries also said in April 2024 that its Indri single malt had passed 100,000 cases within two years of launch. As a result, premium bottles grow at 4.02% a year, faster than any other price tier in the region.
Why do trade deals widen access to imported whisky?
Several Asian markets are cutting tariffs on imported whisky, which lowers shelf prices for Scotch and other foreign brands. The U.K.-India trade agreement took effect on July 15, 2026, and cuts India's whisky tariff from 150% to 40% over time, according to the U.K. government. The Week reported that the rate fell to 75% immediately, and that the U.K. supplies nearly 75% of India's imported spirits. China also cut its whisky import tariff from 10% to a provisional 5% from Feb. 2, 2026, according to its Customs Tariff Commission notice. In turn, whisky grows fastest among product types at 4.49% a year, as importers price more bottles within reach of urban buyers.
How do domestic brands extend manufacturing reach?
Large local distillers and global groups are adding capacity inside the region, which keeps supply close to the fastest-growing drinkers. Pernod Ricard India broke ground on Oct. 7, 2024, on a Nagpur plant with capacity for up to 13 million pure alcohol liters a year, according to the company. The plan covers up to INR 1,785 crore of investment over 10 years under an agreement with the Maharashtra government. Indian single malts also outsold imported malt whiskey in India in 2023, with about 345,000 cases, according to estimates from the Confederation of Indian Alcoholic Beverage Companies. Kweichow Moutai still raised its own-brand liquor volume 0.73% to 58,500 tons in 2025, Yicai reported, which shows that top distillers keep expanding output.
Why do direct digital sales reset baijiu pricing?
Baijiu makers now sell more bottles directly to drinkers through their own apps, which gives them better control of shelf prices. Kweichow Moutai began regular sales of Feitian Moutai on its i Moutai app at fixed prices in January 2026, and the launch added 14 million users in the first quarter, Caixin reported. Direct channels, including i Moutai, also brought in more than half of the company's sales in 2025 and passed wholesale agencies for the first time, according to 36Kr. Luzhou Laojiao also added one-hour delivery through its own Douyin store. As a result, e-commerce grows fastest among channels at 5.12% a year, while physical stores keep the larger share.
Lower-proof drinks, exports and price resets reshape demand
How is the shift to lower-proof drinks changing demand?
Younger and health-conscious drinkers choose lighter drinks, which pushes distillers toward lower-proof products and smaller serves. Japan's taxable liquor volume in fiscal 2024 was about 80% of its fiscal 1999 peak, according to the National Tax Agency, which links the decline to aging and a falling population. Luzhou Laojiao is promoting lower-proof baijiu and cocktail-style drinks, while Shanxi Fenjiu and Jiangsu Yanghe are redesigning products and branding for younger drinkers, Caixin reported in April 2026. Thai Beverage also reported that its spirits volume fell 3.2% to 617 million liters in the year to September 2025. In turn, shochu and soju grow at a slower pace than the regional total, while routine drinking stays the largest occasion.
Why do record exports lift Japanese and Korean brands?
Japanese and Korean producers are selling more abroad as home consumption slows, which supports brand value and premium pricing. Japan-made liquor exports reached a record 149.5 billion yen in 2025, up 11.8% from 2024, according to the same National Tax Agency report. HiteJinro said its Jinro soju sold 96.8 million nine-liter cases worldwide in 2024 and was ranked the world's best-selling spirit for the 24th year, The Korea Times reported. The company exports to 80 countries, and soju makes up 85% of its exports. As a result, Northeast Asia holds a 16.9% share of 2025 value, even though local volumes in Japan keep falling.
Can a price reset widen the collector base?
Falling wholesale prices for top baijiu brands bring famous bottles within reach of more middle-class buyers and collectors. The wholesale price of Feitian Moutai fell from about 2,100 yuan at the start of 2025 to 1,495 yuan in December, according to Jinri Jiujia data reported by Caixin. Moutai then raised the Feitian retail price to 1,539 yuan, its first increase in eight years, which set a clearer price floor. Caixin also reported that Moutai and Wuliangye did better than second-tier brands during the slowdown. In turn, luxury baijiu can reach new buyers at stable prices, while luxury bottles across the region grow at a moderate pace.
Is there room for premium imports in India's large volume base?
India already drinks very large volumes of spirits, so lower tariffs open room for imported premium brands to win a larger share. India is the second-largest spirits market by volume after China, and EU spirits exports to India rose sixfold over the past decade, according to spiritsEUROPE. The EU and India concluded their trade talks on Jan. 27, 2026, and the duty on EU spirits will be halved at entry into force, then lowered to 40%. The Scotch Whisky Association also said India was the largest Scotch market by volume in 2025. As a result, imported premium bottles can win shelf space, and South Asia gains share across the forecast.
Banquet curbs, excise hikes and customs disputes slow growth
How do banquet curbs in China weigh on baijiu?
China's revised rules on thrift in Party and government bodies bar alcohol from official meals, which cuts a key source of high-end baijiu demand. China Daily reported this change to the rules on May 22, 2025. Baijiu output fell 12.1% in 2025 to 3.55 million kiloliters, according to National Bureau of Statistics data. As a result, distributors hold more stock, and gift sales slow. Producers respond by cutting prices, selling directly through apps and targeting younger drinkers with lighter products.
Why do state excise hikes raise prices in India?
Indian states set their own liquor taxes, so a sudden rise in one large state can cut sales quickly. Maharashtra raised the excise duty on Indian-made foreign liquor in June 2025 from three times to 4.5 times the manufacturing cost, All India Radio News reported. The state also raised the duty on country liquor and created a new Maharashtra Made Liquor category. In turn, shelf prices rose sharply, and Diageo India linked weaker popular-brand sales to the policy. Companies respond by shifting their mix toward premium brands and other states.
How will Vietnam's tax plan weigh on volumes?
Several Southeast Asian governments are raising alcohol taxes for health reasons, which lifts prices and slows volume growth. Vietnam's National Assembly approved a plan in June 2025 to raise the special consumption tax on strong liquor from 65% to 70% in 2027 and to 90% by 2031, VnExpress reported. As a result, Vietnamese drinkers may buy fewer bottles or switch to cheaper brands. Producers respond with smaller packs, lower-priced lines and more sales in less-taxed markets.
Why do customs disputes add risk for importers?
Customs rules on valuation and tariff scope can raise costs for importers even after a trade deal takes effect. Diageo and Pernod Ricard said bulk Scotch imports were left out of India's lower tariff, The Week reported in October 2026. Indian authorities also searched both companies' offices, and Pernod already faces a $314 million back-tax demand over import values. In turn, local blends that use bulk Scotch may not gain the full tariff benefit. Importers respond by working with trade groups and both governments on clear customs rules.
Greater China leads while South Asia grows fastest
| Sub-region | Value, 2025 (USD billion) | Share, 2025 | CAGR, 2026–2035 |
|---|---|---|---|
| Greater China | 152.76 | 54.0% | 2.34% |
| Northeast Asia | 47.81 | 16.9% | 2.04% |
| Southeast Asia and Oceania | 46.39 | 16.4% | 3.54% |
| South Asia | 35.93 | 12.7% | 5.54% |
Why do banquets and gifts keep Greater China on top?
Greater China held a 54.0% share of 2025 value and grows at 2.34% a year, because baijiu remains the main drink for banquets and gifts. Chinese baijiu output fell 12.1% in 2025, and the wholesale price of Feitian Moutai dropped to 1,495 yuan by December. Taiwan adds demand for kaoliang liquor, while lower whisky tariffs support imports in mainland China.
How does Northeast Asia balance home decline and exports?
Northeast Asia held a 16.9% share of 2025 value and grows at 2.04% a year, because Japan and South Korea have mature, aging drinker bases. Japan's taxable liquor volume in fiscal 2024 was about 80% of its peak, while its liquor exports reached a record in 2025. Visitor buyers also add sales through duty-free liquor counters at airports in both countries.
Why is South Asia the fastest-growing sub-region?
South Asia held a 12.7% share of 2025 value and grows fastest at 5.54% a year, because India has a young, large drinker base that is moving to premium whisky. Lower whisky tariffs under the U.K.-India trade agreement also widen the range of imported bottles that Indian buyers can afford. Pernod Ricard is also building a large malt plant in Nagpur, which adds local supply for Indian alcoholic beverage brands.
Which forces shape Thai, Vietnamese and Australian drinking?
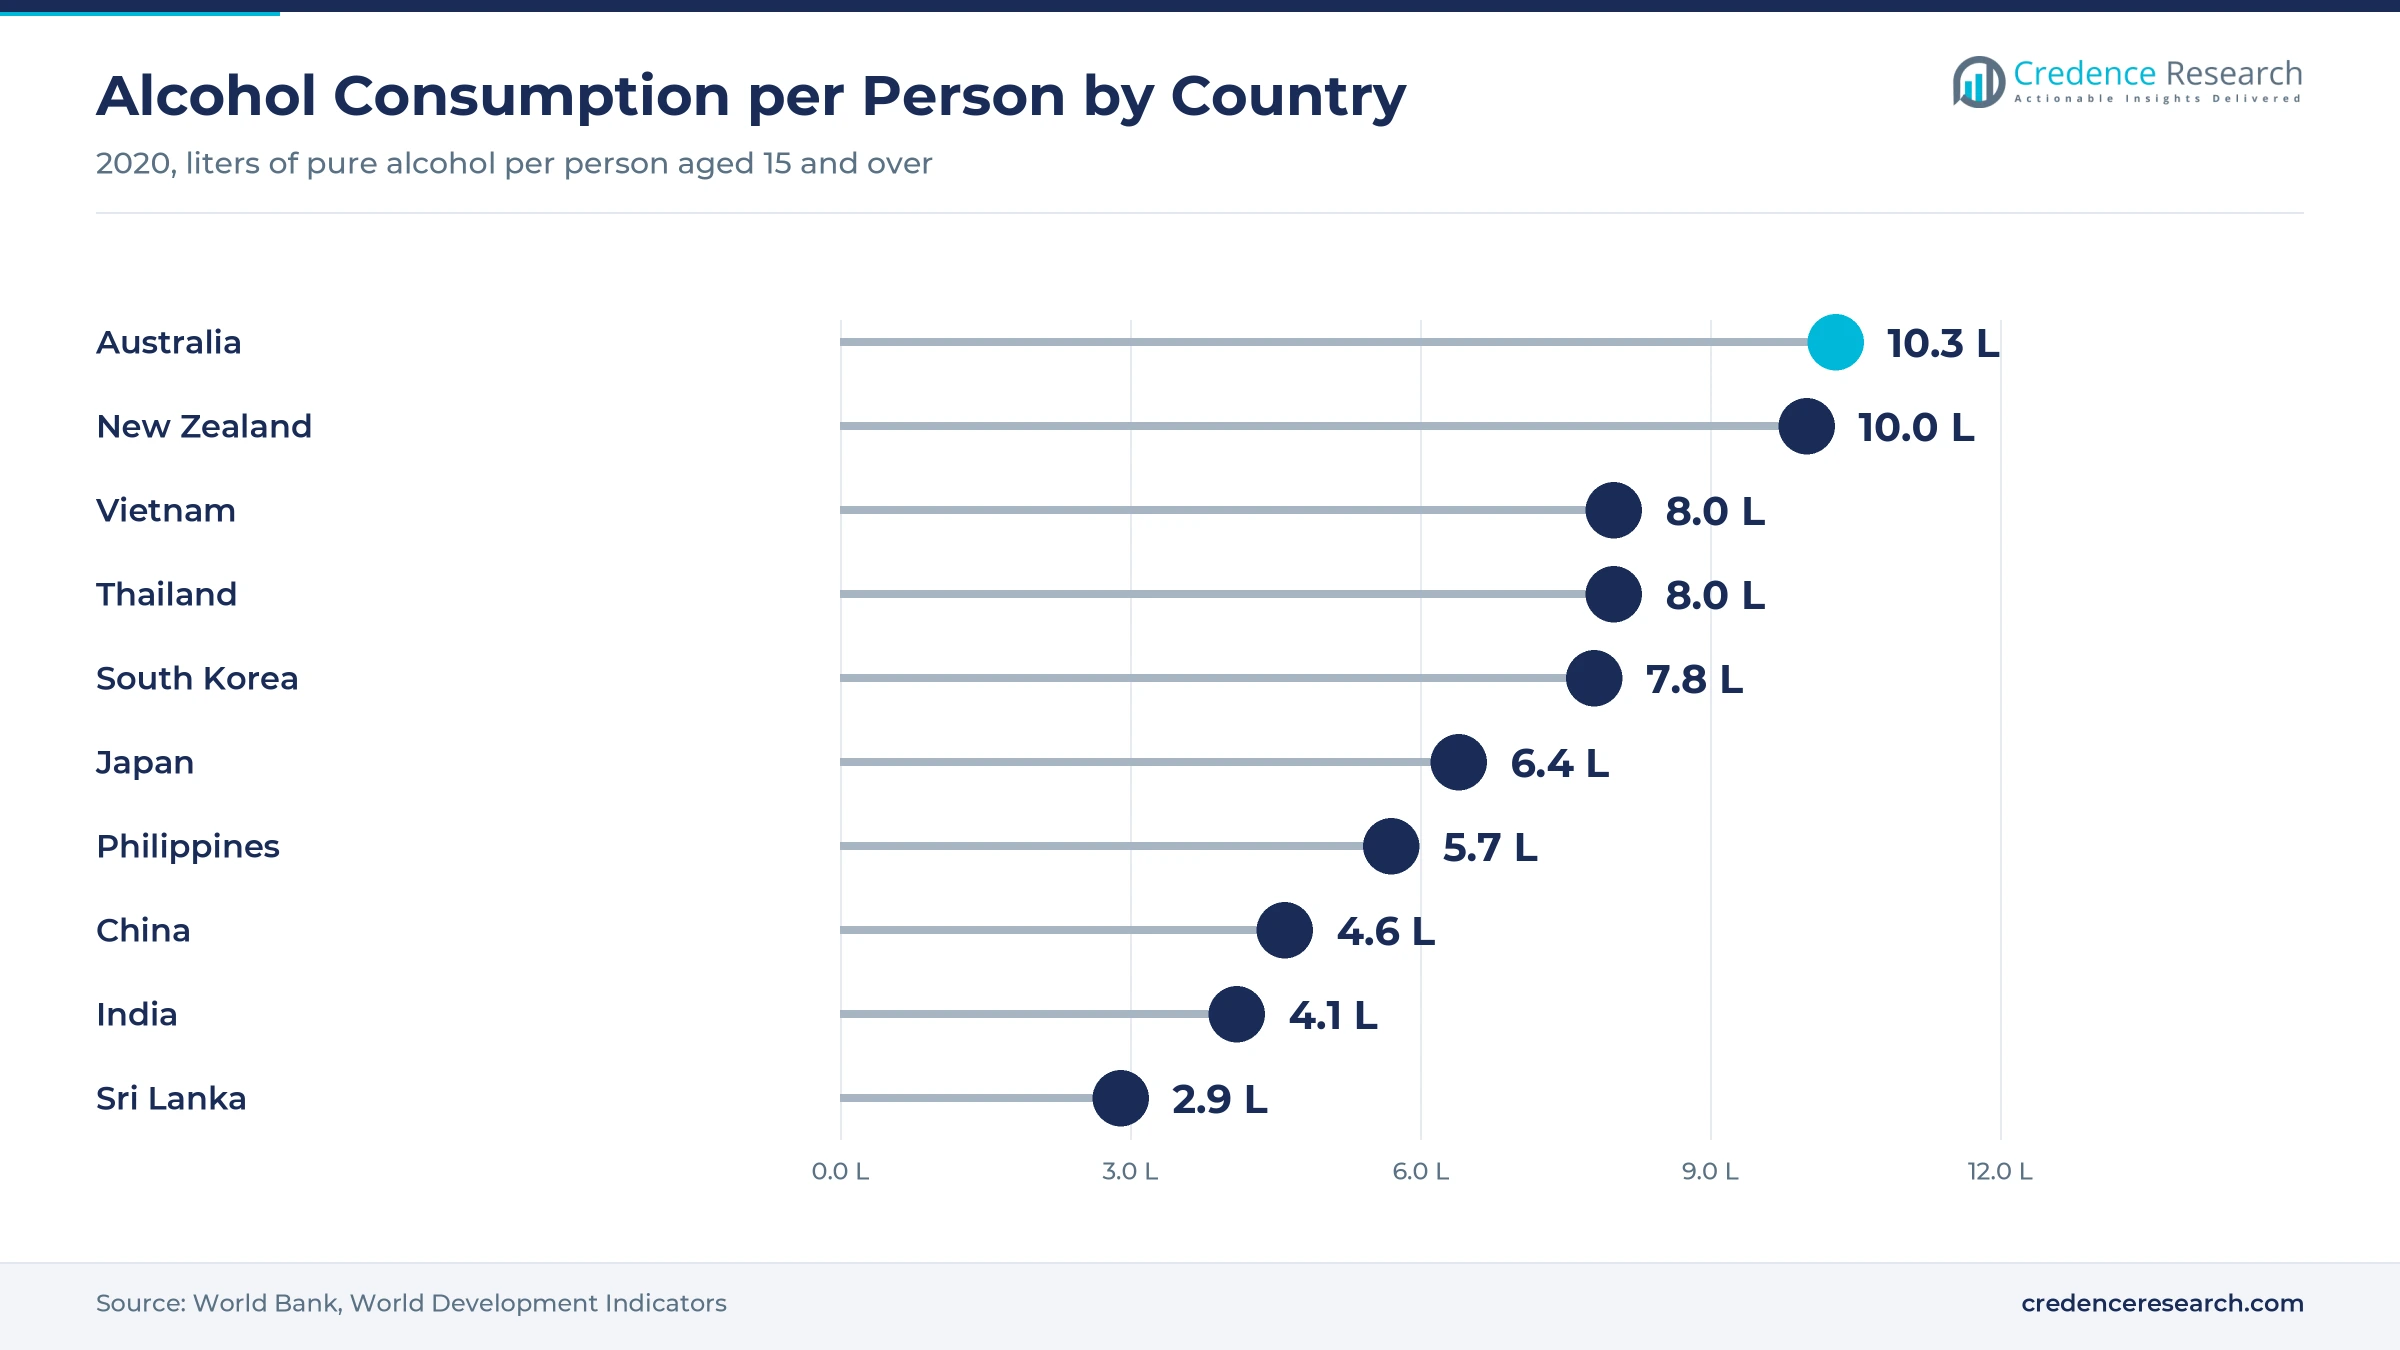
Southeast Asia and Oceania held a 16.4% share of 2025 value and grows at 3.54% a year, because Thai, Vietnamese, Philippine and Australian drinkers buy steady volumes. Australia recorded 10.3 liters of pure alcohol per person aged 15 and over in 2020, and Vietnam recorded 8.0 liters, according to World Bank data. However, Vietnam's planned tax rises and lower Thai spirits volume slow growth.
Tariff deals, price moves and plant builds, 2024 to 2026
| Development | Status and market relevance |
|---|---|
| In October 2024, Pernod Ricard India broke ground on a Nagpur malt plant with capacity for 13 million pure alcohol liters a year. | Adds local malt supply for Indian whisky |
| In May 2025, China revised its thrift rules for Party and government bodies to bar alcohol from official meals. | Cuts high-end banquet demand for baijiu |
| In June 2025, Maharashtra raised excise duty on Indian-made foreign liquor and created a Maharashtra Made Liquor category. | Raises shelf prices in a large Indian state |
| In January 2026, Kweichow Moutai began regular sales of Feitian Moutai on its i Moutai app at fixed prices. | Shifts high-end sales toward direct channels |
| In July 2026, the U.K.-India trade agreement took effect and cut India's Scotch whisky tariff from 150% to 75%. | Starts a path to a 40% tariff |
Direct apps, malt capacity and quick delivery shape supply
- Direct-to-consumer apps let baijiu makers sell bottles at fixed prices, which reduces the role of resellers and steadies shelf prices.
- Local malt distilling gives whisky makers in India their own aged spirit, which cuts their need for imported bulk malt.
- Quick-delivery stores on social commerce platforms bring bottles to homes within an hour, which suits younger buyers in large cities.
- Lower-proof formulations reduce alcohol strength in baijiu and blends, which helps producers reach drinkers who want lighter serves.
Need a Custom Version of This Report?
Tailor the scope, geography, or segments to your exact requirements.
- Custom geography or segment scope
- Direct access to our analyst team
Baijiu houses and global distillers vie on brand and reach
Competition combines large Chinese baijiu houses, Japanese and Korean brand owners, Southeast Asian brewers and distillers, and global whisky groups that sell across the region. Kweichow Moutai and Wuliangye lead the top end of baijiu and held up better than second-tier brands during the 2025 slowdown, Caixin reported. Luzhou Laojiao, Shanxi Fenjiu and Jiangsu Yanghe compete with lower-proof products and new branding for younger drinkers. In India, Diageo, Pernod Ricard and Suntory compete on prestige whisky, local blends and new malt capacity. HiteJinro leads soju and exports to 80 countries, while Thai Beverage leads Thai spirits. Companies compete on brand heritage, price control, direct digital sales and local production. Trade deals in India and China also favor importers with strong distribution networks.
Companies profiled and their roles in this market
| Company | Type | Role in the market |
|---|---|---|
| Kweichow Moutai Co., Ltd. | Baijiu producer | Sells Feitian Moutai through its i Moutai app at fixed prices |
| Wuliangye Yibin Co., Ltd. | Baijiu producer | Holds up better than second-tier brands in the 2025 slowdown |
| Luzhou Laojiao Co., Ltd. | Baijiu producer | Promotes lower-proof baijiu and one-hour Douyin delivery |
| Shanxi Xinghuacun Fen Wine Factory Co., Ltd. | Baijiu producer | Redesigns Fenjiu products and branding for younger drinkers |
| Jiangsu Yanghe Brewery Joint-Stock Co., Ltd. | Baijiu producer | Focuses on product redesign for younger drinkers |
| Diageo plc | Global spirits group | Grows prestige brands in India through Diageo India |
| Pernod Ricard SA | Global spirits group | Builds a 13 million pure alcohol liter malt plant in Nagpur |
| Suntory Holdings Limited | Global spirits group | Sells Oaksmith Indian whisky, including the premium Nagomi |
| HiteJinro Co., Ltd. | Soju producer | Sold 96.8 million cases of Jinro soju worldwide in 2024 |
| Thai Beverage Public Company Limited | Spirits and beer group | Sold 617 million liters of spirits in fiscal 2025 |
Credence Research view on regional distilled drink demand
Credence Research's view is that spirits demand in the Asia Pacific region will grow at a moderate pace, because strong gains in Indian premium whisky offset a reset in Chinese baijiu. Chinese white spirits keep the largest product share, but whisky grows fastest as tariffs fall in India and China. Greater China stays the largest sub-region, while South Asia grows fastest. However, banquet curbs, state excise hikes and rising taxes in Southeast Asia will hold back volumes. Producers that combine local capacity, premium brands and direct digital sales should gain share fastest.
How the regional distilled drink estimate was built
The report uses 2025 as the base year on a calendar basis, and market values come from the Credence Research model. That model combines production and consumption statistics, tax and tariff rules, trade agreement texts and company information on volumes, prices, channels and capacity. Segment splits and sub-regional growth rates are Credence Research estimates, while sub-regional shares follow the client-defined split. Sources used are official statistics, government releases, trade association releases, company releases and news reports, and no interviews or surveys were used.
Indian whisky and digital sales carry growth to 2035
Asia Pacific spirits value is expected to reach USD 378.97 billion by 2035, a 2.94% CAGR during 2026–2035, as Indian premium whisky and direct digital sales carry growth. Growth should be slower through 2027 while baijiu prices and stocks settle in China. After that, lower whisky tariffs in India and new local malt capacity should add more value each year. Faster tariff cuts would raise this outlook, while new excise hikes in Indian states or Southeast Asia would lower it.
Frequently Asked Questions
How big is the Asia Pacific spirits market?
Which product type leads regional demand?
Which sub-region leads the regional market?
How do trade deals affect imported whisky?
Why is baijiu demand under pressure?
Which channel grows fastest?
Who are the leading companies in the region?
What are the main challenges for producers?
Table of Content
Chapter 1 Market Segmentation
- 1.1 Segmentation Framework
- 1.1.1 Product and Service Classification
- 1.1.2 Application and End-Use Classification
- 1.1.3 Technology and Solution Classification
- 1.1.4 Customer and Distribution Channel Classification
- 1.1.5 Geographic Segmentation
- 1.1.6 Market Segment Definitions and Boundaries
- 1.2 By Product Type
- 1.2.1 Chinese White Spirits
- 1.2.2 Shochu and Soju
- 1.2.3 Whisky
- 1.2.4 Brandy and Other Distilled Spirits
- 1.3 By Price Tier
- 1.3.1 Economy
- 1.3.2 Standard
- 1.3.3 Premium
- 1.3.4 Luxury
- 1.4 By Purchase Occasion
- 1.4.1 Routine Consumption
- 1.4.2 Dining and Celebration
- 1.4.3 Gifting and Collecting
- 1.5 By Sub-region
- 1.5.1 Greater China
- 1.5.2 Northeast Asia
- 1.5.3 South Asia
- 1.5.4 Southeast Asia and Oceania
Chapter 2 Introduction
- 2.1 Report Objectives and Scope
- 2.2 Product Definition and Industry Terminology
- 2.3 Market Inclusions and Exclusions
- 2.4 Research Process
- 2.4.1 Primary Research and Expert Interviews
- 2.4.2 Secondary Research and Source Review
- 2.4.3 Top-Down and Bottom-Up Estimation
- 2.4.4 Data Triangulation and Verification
- 2.5 Market Size Measurement Basis
- 2.5.1 2025: USD 282.89 billion → 2035: USD 378.97 billion
- 2.6 Historical and Forecast Reference Periods
- 2.6.1 Historical Period: 2018-2025
- 2.6.2 Base Year: 2025
- 2.6.3 Forecast Period: 2025-2035
- 2.7 Research Assumptions and Limitations
Chapter 3 Executive Summary
- 3.1 Market Snapshot and Key Findings
- 3.2 Base-Year Market Size, 2025
- 3.3 Forecast Market Size, 2035
- 3.4 Revenue and Volume Growth Outlook
- 3.5 Key Demand and Supply Indicators
- 3.6 Leading Market Segments
- 3.7 Fastest-Growing Market Opportunities
- 3.8 Regional Performance Highlights
- 3.9 Technology and Industry Transformation
- 3.10 Competitive Landscape Summary
- 3.11 Analyst View and Strategic Implications
Chapter 4 Asia Pacific Spirits Market Trends and Developments
- 4.1 Historical Industry Development, 2018-2025
- 4.2 Recent Market Trends and Developments
- 4.3 Demand and Customer Behavior Trends
- 4.4 Technology and Product Innovation
- 4.5 Artificial Intelligence, Automation and Digitalization
- 4.6 Local Manufacturing and Supply Chain Realignment
- 4.7 Industry Partnerships, Mergers and Acquisitions
- 4.8 Sustainability and Circular Economy Developments
- 4.9 Government and Private Sector Investment Trends
- 4.10 Emerging Business Models and Commercialization
- 4.11 Industry Developments and Announcements
Chapter 5 Asia Pacific Spirits Market Production, Supply and Demand Analysis
- 5.1 Demand Trend and Consumption Analysis, 2018-2025
- 5.2 Demand Forecast, 2025-2035
- 5.3 Production and Output Trend, 2018-2025
- 5.4 Production and Output Forecast, 2025-2035
- 5.5 Installed Capacity and Capacity Utilization
- 5.6 Company-Wise Production Plants and Statistics
- 5.6.1 Installed Production Capacity
- 5.6.2 Actual Production
- 5.6.3 Planned Capacity and Expansion Targets
- 5.7 Supply Chain Structure and Procurement Trends
- 5.8 Supply-Demand Gap and Bottlenecks
- 5.9 Import Dependence and Sourcing Structure
- 5.10 Contract Manufacturing and Outsourcing
- 5.11 Regional Supply and Demand Concentration
Chapter 6 Asia Pacific Spirits Market Pricing Analysis
- 6.1 Pricing Structure and Measurement
- 6.2 Historical Pricing Trends, 2018-2025
- 6.3 Pricing Outlook, 2025-2035
- 6.4 Average Selling Price and Unit Economics
- 6.5 Pricing by Product and Market Segment
- 6.6 Geographic Pricing Differences
- 6.7 Key Input, Energy, Labor and Logistics Costs
- 6.8 Contract Pricing and Purchasing Models
- 6.9 Pricing Sensitivity and Competitive Positioning
- 6.10 Price, Margin and Profitability Implications
Chapter 7 Asia Pacific Spirits Market Dynamics
- 7.1 Market Growth Drivers
- 7.1.1 Demand-Side Drivers
- 7.1.2 Technology and Innovation Drivers
- 7.1.3 Infrastructure and Investment Drivers
- 7.1.4 Regulatory and Policy Drivers
- 7.2 Market Restraints
- 7.2.1 Cost and Affordability Constraints
- 7.2.2 Technology and Adoption Barriers
- 7.2.3 Supply Chain and Operational Constraints
- 7.3 Market Challenges
- 7.3.1 Competitive Pressure and Margin Erosion
- 7.3.2 Skills, Infrastructure and Implementation Gaps
- 7.4 Emerging Market Opportunities
- 7.5 Market Dynamics Impact and Time-Horizon Assessment
Chapter 8 Asia Pacific Spirits Value Chain Analysis
- 8.1 Industry Value Chain Overview
- 8.2 Upstream Suppliers and Critical Inputs
- 8.3 Technology and Component Providers
- 8.4 Manufacturing or Service Delivery
- 8.5 Distribution, Channel Partners and Integrators
- 8.6 Downstream Applications and End Users
- 8.7 Value Addition and Profit Pools
- 8.8 Vertical Integration and Outsourcing
- 8.9 Supplier Concentration and Risk
- 8.10 Supply Chain Localization and Resilience
Chapter 9 Asia Pacific Spirits Market Regulations and Policies
- 9.1 Relevant Laws, Standards and Compliance Frameworks
- 9.2 Product, Service, Safety and Quality Requirements
- 9.3 Government Policies, Incentives and Subsidies
- 9.4 Imports, Exports and Trade Barriers
- 9.5 Public Procurement and Local Content Requirements
- 9.6 Environmental and Sustainability Compliance
- 9.7 Upcoming Policy Changes and Market Implications
Chapter 10 Asia Pacific Spirits Market Hotspots and Opportunities
- 10.1 Market Opportunity Mapping and Growth Hotspots
- 10.2 High-Growth Applications and Customer Groups
- 10.3 Underserved Markets and White-Space Opportunities
- 10.4 Emerging Technology and Product Opportunities
- 10.5 New Capacity and Investment Hotspots
- 10.6 Market Entry and Expansion Opportunities
- 10.7 Distribution and Partnership Opportunities
- 10.8 Near-Term and Long-Term Commercial Potential
- 10.9 Opportunity Attractiveness and Execution Risks
Chapter 11 Asia Pacific Spirits Market Outlook, 2025-2035
- 11.1 Market Size and Analysis
- 11.1.1 Revenue (Market Measurement: 2025: USD 282.89 billion → 2035: USD 378.97 billion)
- 11.1.2 Market Volume and Quantity Sold
- 11.1.3 Historical Market Size, 2018-2025
- 11.1.4 Base-Year Market Size, 2025
- 11.2 Market Forecast, 2025-2035
- 11.2.1 Revenue Forecast to 2035
- 11.2.2 Volume Forecast to 2035
- 11.2.3 CAGR and Year-on-Year Growth
- 11.2.4 Incremental Revenue Opportunity
- 11.3 Forecast Assumptions and Scenario Analysis
- 11.3.1 Base-Case Forecast
- 11.3.2 Optimistic and Conservative Scenarios
- 11.3.3 Technology, Pricing and Policy Sensitivities
- 11.4 Market Attractiveness and Growth Outlook
Chapter 12 Asia Pacific Spirits Market Segmentation and Outlook
- 12.1 Segmentation Summary and Market Shares, 2025
- 12.2 Largest and Fastest-Growing Segments
- 12.3 By Product Type - Market Size and Forecast, 2025-2035
- 12.3.1 Segment Definition and Scope
- 12.3.2 Historical Market Size, 2018-2025
- 12.3.3 Revenue Forecast, 2025-2035
- 12.3.4 Volume Forecast, 2025-2035
- 12.3.5 Base-Year Market Share, 2025
- 12.3.6 Segment CAGR and Growth Drivers
- 12.3.7 Subsegment Market Size and Forecast
- 12.3.7.1 Chinese White Spirits
- 12.3.7.2 Shochu and Soju
- 12.3.7.3 Whisky
- 12.3.7.4 Brandy and Other Distilled Spirits
- 12.3.8 Subsegment Pricing and Adoption Trends
- 12.3.9 Leading Suppliers and Competition
- 12.3.10 Regional Demand and Opportunities
- 12.4 By Price Tier - Market Size and Forecast, 2025-2035
- 12.4.1 Segment Definition and Scope
- 12.4.2 Historical Market Size, 2018-2025
- 12.4.3 Revenue Forecast, 2025-2035
- 12.4.4 Volume Forecast, 2025-2035
- 12.4.5 Base-Year Market Share, 2025
- 12.4.6 Segment CAGR and Growth Drivers
- 12.4.7 Subsegment Market Size and Forecast
- 12.4.7.1 Economy
- 12.4.7.2 Standard
- 12.4.7.3 Premium
- 12.4.7.4 Luxury
- 12.4.8 Subsegment Pricing and Adoption Trends
- 12.4.9 Leading Suppliers and Competition
- 12.4.10 Regional Demand and Opportunities
- 12.5 By Purchase Occasion - Market Size and Forecast, 2025-2035
- 12.5.1 Segment Definition and Scope
- 12.5.2 Historical Market Size, 2018-2025
- 12.5.3 Revenue Forecast, 2025-2035
- 12.5.4 Volume Forecast, 2025-2035
- 12.5.5 Base-Year Market Share, 2025
- 12.5.6 Segment CAGR and Growth Drivers
- 12.5.7 Subsegment Market Size and Forecast
- 12.5.7.1 Routine Consumption
- 12.5.7.2 Dining and Celebration
- 12.5.7.3 Gifting and Collecting
- 12.5.8 Subsegment Pricing and Adoption Trends
- 12.5.9 Leading Suppliers and Competition
- 12.5.10 Regional Demand and Opportunities
- 12.6 By Sub-region - Market Size and Forecast, 2025-2035
- 12.6.1 Segment Definition and Scope
- 12.6.2 Historical Market Size, 2018-2025
- 12.6.3 Revenue Forecast, 2025-2035
- 12.6.4 Volume Forecast, 2025-2035
- 12.6.5 Base-Year Market Share, 2025
- 12.6.6 Segment CAGR and Growth Drivers
- 12.6.7 Subsegment Market Size and Forecast
- 12.6.7.1 Greater China
- 12.6.7.2 Northeast Asia
- 12.6.7.3 South Asia
- 12.6.7.4 Southeast Asia and Oceania
- 12.6.8 Subsegment Pricing and Adoption Trends
- 12.6.9 Leading Suppliers and Competition
- 12.6.10 Regional Demand and Opportunities
- 12.7 Segment Growth Comparison
- 12.8 Segment Attractiveness and Priority Matrix
Chapter 13 Asia Pacific Spirits Geographic Market Outlook, 2025-2035
- 13.1 Regional Market Size and Country-Level Shares, 2025
- 13.2 Country Market Size Comparison, 2025
- 13.3 Country Market Forecasts, 2025-2035
- 13.4 Subregional Industrial and Demand Clusters
- 13.5 Intra-Regional Pricing and Cost Differences
- 13.6 Cross-Border Trade and Supply Networks
- 13.7 Regional Supply and Demand Balances
- 13.8 Country Opportunity Comparison and Prioritization
Note: Every listed country is covered on the structure shown under the first country.
Chapter 14 Asia Pacific Spirits Technology, Innovation and Sustainability Outlook
- 14.1 Technology Landscape and Maturity
- 14.2 Product, Process and Service Innovation
- 14.3 AI, Automation and Digital Tools in the Industry
- 14.4 Technology Adoption and Performance Benchmarking
- 14.5 Innovation Pipeline and R&D Investment
- 14.6 Patent and Intellectual Property Trends
- 14.7 Energy Efficiency and Resource Management
- 14.8 Sustainability, Recycling and Circularity
- 14.9 Technology Roadmap, 2025-2035
- 14.10 Risks of Obsolescence and Technology Substitution
Chapter 15 Asia Pacific Spirits Market Key Strategic Imperatives
- 15.1 Growth and Market Entry Priorities
- 15.2 High-Return Products and Segments
- 15.3 Pricing, Profitability and Cost Optimization
- 15.4 Technology Investment and Product Differentiation
- 15.5 Supply Chain Localization and Resilience
- 15.6 Distribution and Customer Acquisition
- 15.7 Partnership, Acquisition and Capacity Strategy
- 15.8 Regional Expansion Priorities
- 15.9 Short-, Medium- and Long-Term Actions
Chapter 16 Competition Outlook
- 16.1 Industry Competition Characteristics
- 16.2 Market Structure and Concentration
- 16.3 Market Share and Competitive Positioning, 2025
- 16.4 Company-Wise Revenue and Product Benchmarking
- 16.5 Production and Service Capacity Benchmarking
- 16.6 Technology, Pricing and Differentiation
- 16.7 Regional Footprint and Distribution Strength
- 16.8 Mergers, Acquisitions and Strategic Alliances
- 16.9 New Entrants and Competitive Threats
- 16.10 Porter's Five Forces and Industry Attractiveness
- 16.11 Competitive Outlook, 2025-2035
Chapter 17 Company Profiles
- 17.1 Company Coverage and Selection Criteria
- 17.2 Kweichow Moutai Co., Ltd.
- 17.2.1 Business Description
- 17.2.2 Company Ownership and Geographic Presence
- 17.2.3 Product and Service Portfolio
- 17.2.4 Manufacturing and Operating Footprint
- 17.2.5 Production Capacity and Expansion Plans
- 17.2.6 Financial Performance and Investment
- 17.2.7 Market Share and Competitive Position
- 17.2.8 Technology and Innovation Capabilities
- 17.2.9 Strategic Alliances or Partnerships
- 17.2.10 Recent Developments
- 17.2.11 Growth Strategy and Outlook
- 17.3 Wuliangye Yibin Co., Ltd.
- 17.4 Shanxi Xinghuacun Fen Wine Factory Co., Ltd.
- 17.5 Luzhou Laojiao Co., Ltd.
- 17.6 Jiangsu Yanghe Brewery Joint-Stock Co., Ltd.
- 17.7 Suntory Holdings Limited
- 17.8 Pernod Ricard SA
- 17.9 Diageo plc
- 17.10 Thai Beverage Public Company Limited
- 17.11 HiteJinro Co., Ltd.
- 17.12 Other Relevant Market Participants
Note: Every listed company is profiled on the structure shown under the first company. The company list is preliminary and may change based on research findings, market developments, data availability and client requirements.
Chapter 18 Disclaimer
- 18.1 Research and Forecast Disclaimer
- 18.2 Data Source and Estimation Limitations
Note: The depth of individual sections depends on data availability for this market. Volume, capacity, trade and other unit-based metrics are included where applicable.

