
Starch supply and convenience foods anchor texture demand
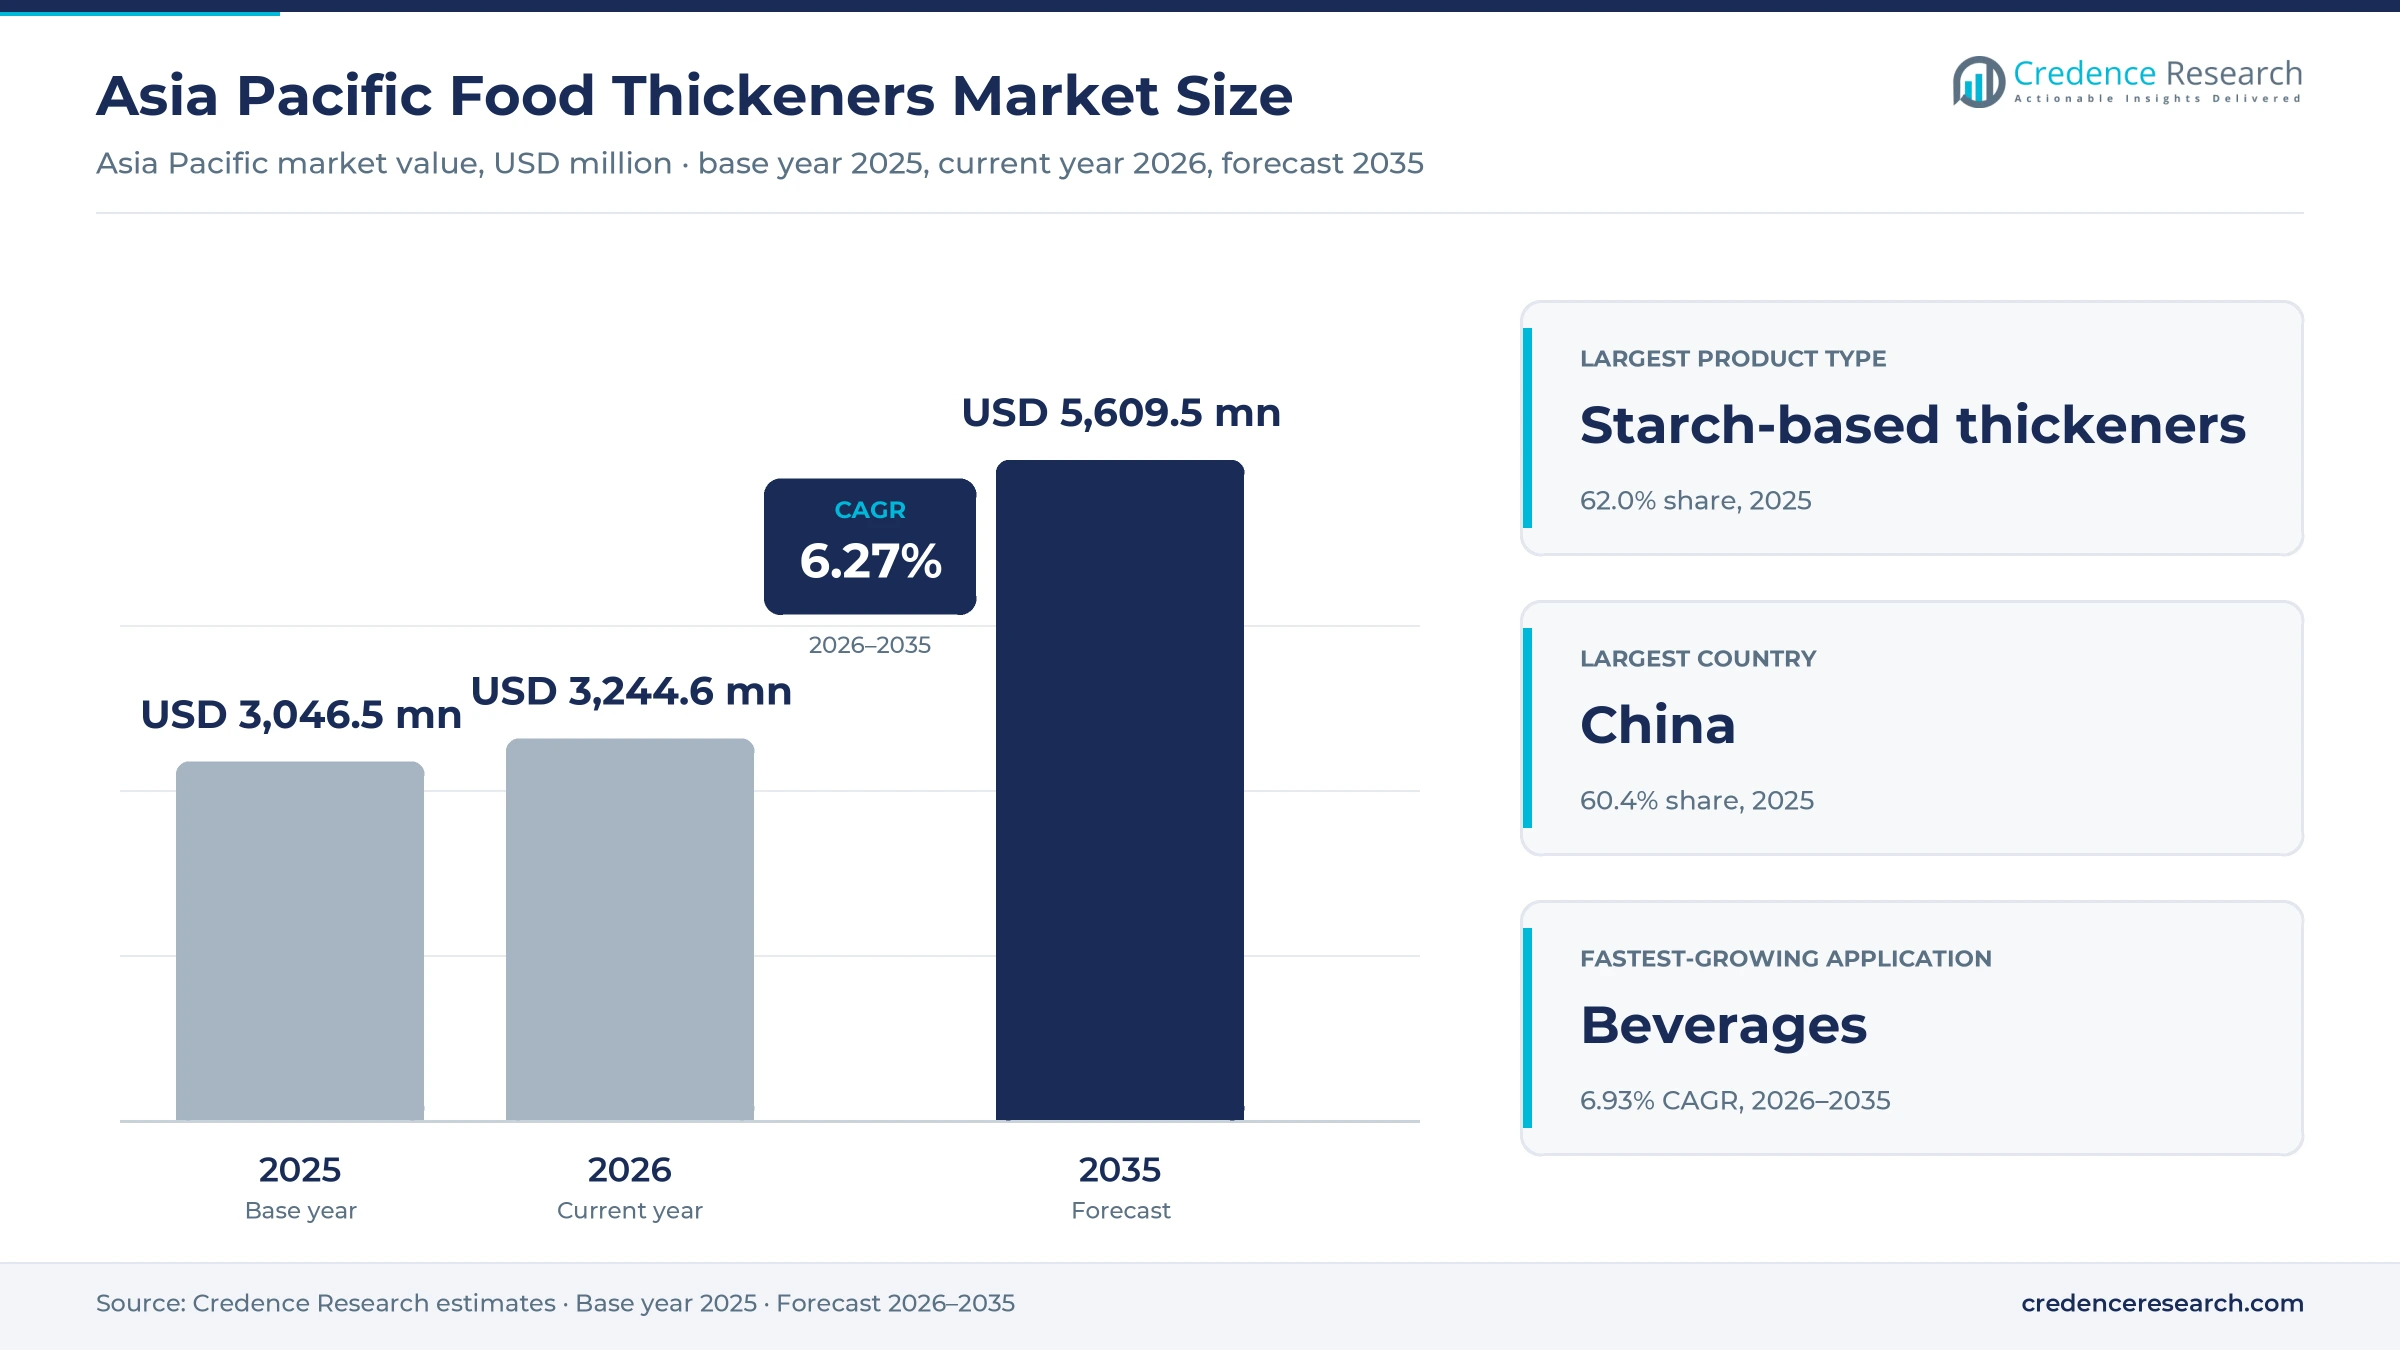
The Asia Pacific food thickeners market was valued at USD 3.05 billion in 2025 and is projected to increase from USD 3.24 billion in 2026 to USD 5.61 billion by 2035, registering a CAGR of 6.27% during 2026–2035. Demand comes from food makers that use starches, gums and proteins to set the body of sauces, noodles, yogurts, bakery fillings and drinks. China held the largest share, 60.4% in 2025, because its processors run the region's biggest sauce, dairy and prepared-dish lines and draw on large domestic and Thai starch supply. South and Southeast Asia is the fastest-growing sub-region at 7.68% a year, as Indian and Indonesian packaged food output widens. Rules are also changing, because China's revised food additive standard took effect in February 2025 and reset how thickeners may be used in each food category. As a result, suppliers are pairing local application work with regulatory support for each market.
Which ingredients and buyers does the estimate count?
The estimate measures the value of starch-based, hydrocolloid-based and protein-based thickeners sold to food and beverage makers in Asia Pacific for dairy, desserts, bakery, confectionery, sauces, savory foods and drinks. Values are stated at the prices that branded food makers, contract manufacturers and ingredient system formulators pay through direct supplier contracts, specialist distributors and digital procurement platforms.
The estimate excludes starch used for paper, textiles, adhesives and fermentation feedstock, and it excludes thickeners sold for pharmaceutical, cosmetic and oilfield use. The value chain runs from corn, cassava, seaweed, citrus peel and fermentation inputs through extraction, modification and blending, and then to food factories that sell finished products through retail and food service.
Asia Pacific Food Thickeners Market Insights
- The Asia Pacific food thickeners market was valued at USD 3.05 billion in 2025 and is projected to reach USD 5.61 billion by 2035, registering a CAGR of 6.27% during 2026–2035.
- China held a 60.4% share of 2025 value, because its sauce, dairy and prepared-dish makers run the largest food processing base in the region.
- Starch-based thickeners led with 62.0% of 2025 value, because corn and tapioca starches are the lowest-cost way to build body in mass foods.
- Japan produced 1,574,172 metric tons of frozen food in 2025, up 2.4% from the prior year, which keeps demand high for freeze-stable thickening systems.
- Tate & Lyle completed its USD 1.8 billion combination with CP Kelco on Nov. 15, 2024, adding pectin and specialty gums to its starch-based texture range.
Starch leads while hydrocolloids and beverages gain share
Why do starch-based thickeners keep the largest share?
Based on product type, the market is categorized into starch-based thickeners, hydrocolloid-based thickeners and protein-based thickeners. Starch-based thickeners led with 62.0% of 2025 value, because corn and tapioca starches from China and Thailand cost less per kilogram than gums and suit noodles, sauces and fillings. Hydrocolloid-based thickeners grow fastest at 6.77% a year, as dairy and drink makers need clear gels, suspension and stability at low dosage.
Which food categories use the most thickening capacity?
Based on application, the market is categorized into dairy and desserts, bakery and confectionery, sauces and savory foods, and beverages. Sauces and savory foods led with 32.0% of 2025 value, because soy-based sauces, soups, dumpling fillings and prepared dishes use starch in large volumes across Chinese and Japanese kitchens. Beverages grow fastest at 6.93% a year, as reduced-sugar drinks and plant milks need body and suspension.
Which buyers place the largest thickener orders?
Based on customer type, the market is categorized into branded food manufacturers, contract food manufacturers and ingredient system formulators. Branded food manufacturers led with 58.0% of 2025 value, because large dairy, noodle and sauce brands buy starches and gums directly under annual contracts. Contract food manufacturers grow fastest at 6.84% a year, as retailers and new brands outsource ready meals and drinks to co-packers.
How do price tiers split thickener spending?
Based on price tier, the market is categorized into products below USD 1,000 per tonne, products from USD 1,000 to below USD 4,000 per tonne, and products at USD 4,000 per tonne and above. The Below USD 1,000 per tonne tier led with 55.0% of 2025 value, because native and simple modified starches sell at commodity prices. The USD 4,000 per tonne and above tier grows fastest at 7.03% a year, as pectins, specialty gums and blended systems gain use.
| Segment Group | Leading Sub-segment | Share, 2025 | Fastest-growing Sub-segment | CAGR, 2026–2035 |
|---|---|---|---|---|
| By Product Type | Starch-based thickeners | 62.0% | Hydrocolloid-based thickeners | 6.77% |
| By Application | Sauces and savory foods | 32.0% | Beverages | 6.93% |
| By Customer Type | Branded food manufacturers | 58.0% | Contract food manufacturers | 6.84% |
| By Price Tier | Below USD 1,000 per tonne | 55.0% | USD 4,000 per tonne and above | 7.03% |
Request a Free Sample
Fill in your details and we'll send you a free sample report.
- Sample data tables & charts
- Research methodology
Ready meals, texture research and aging lift demand
How does convenience-food production lift thickener use?
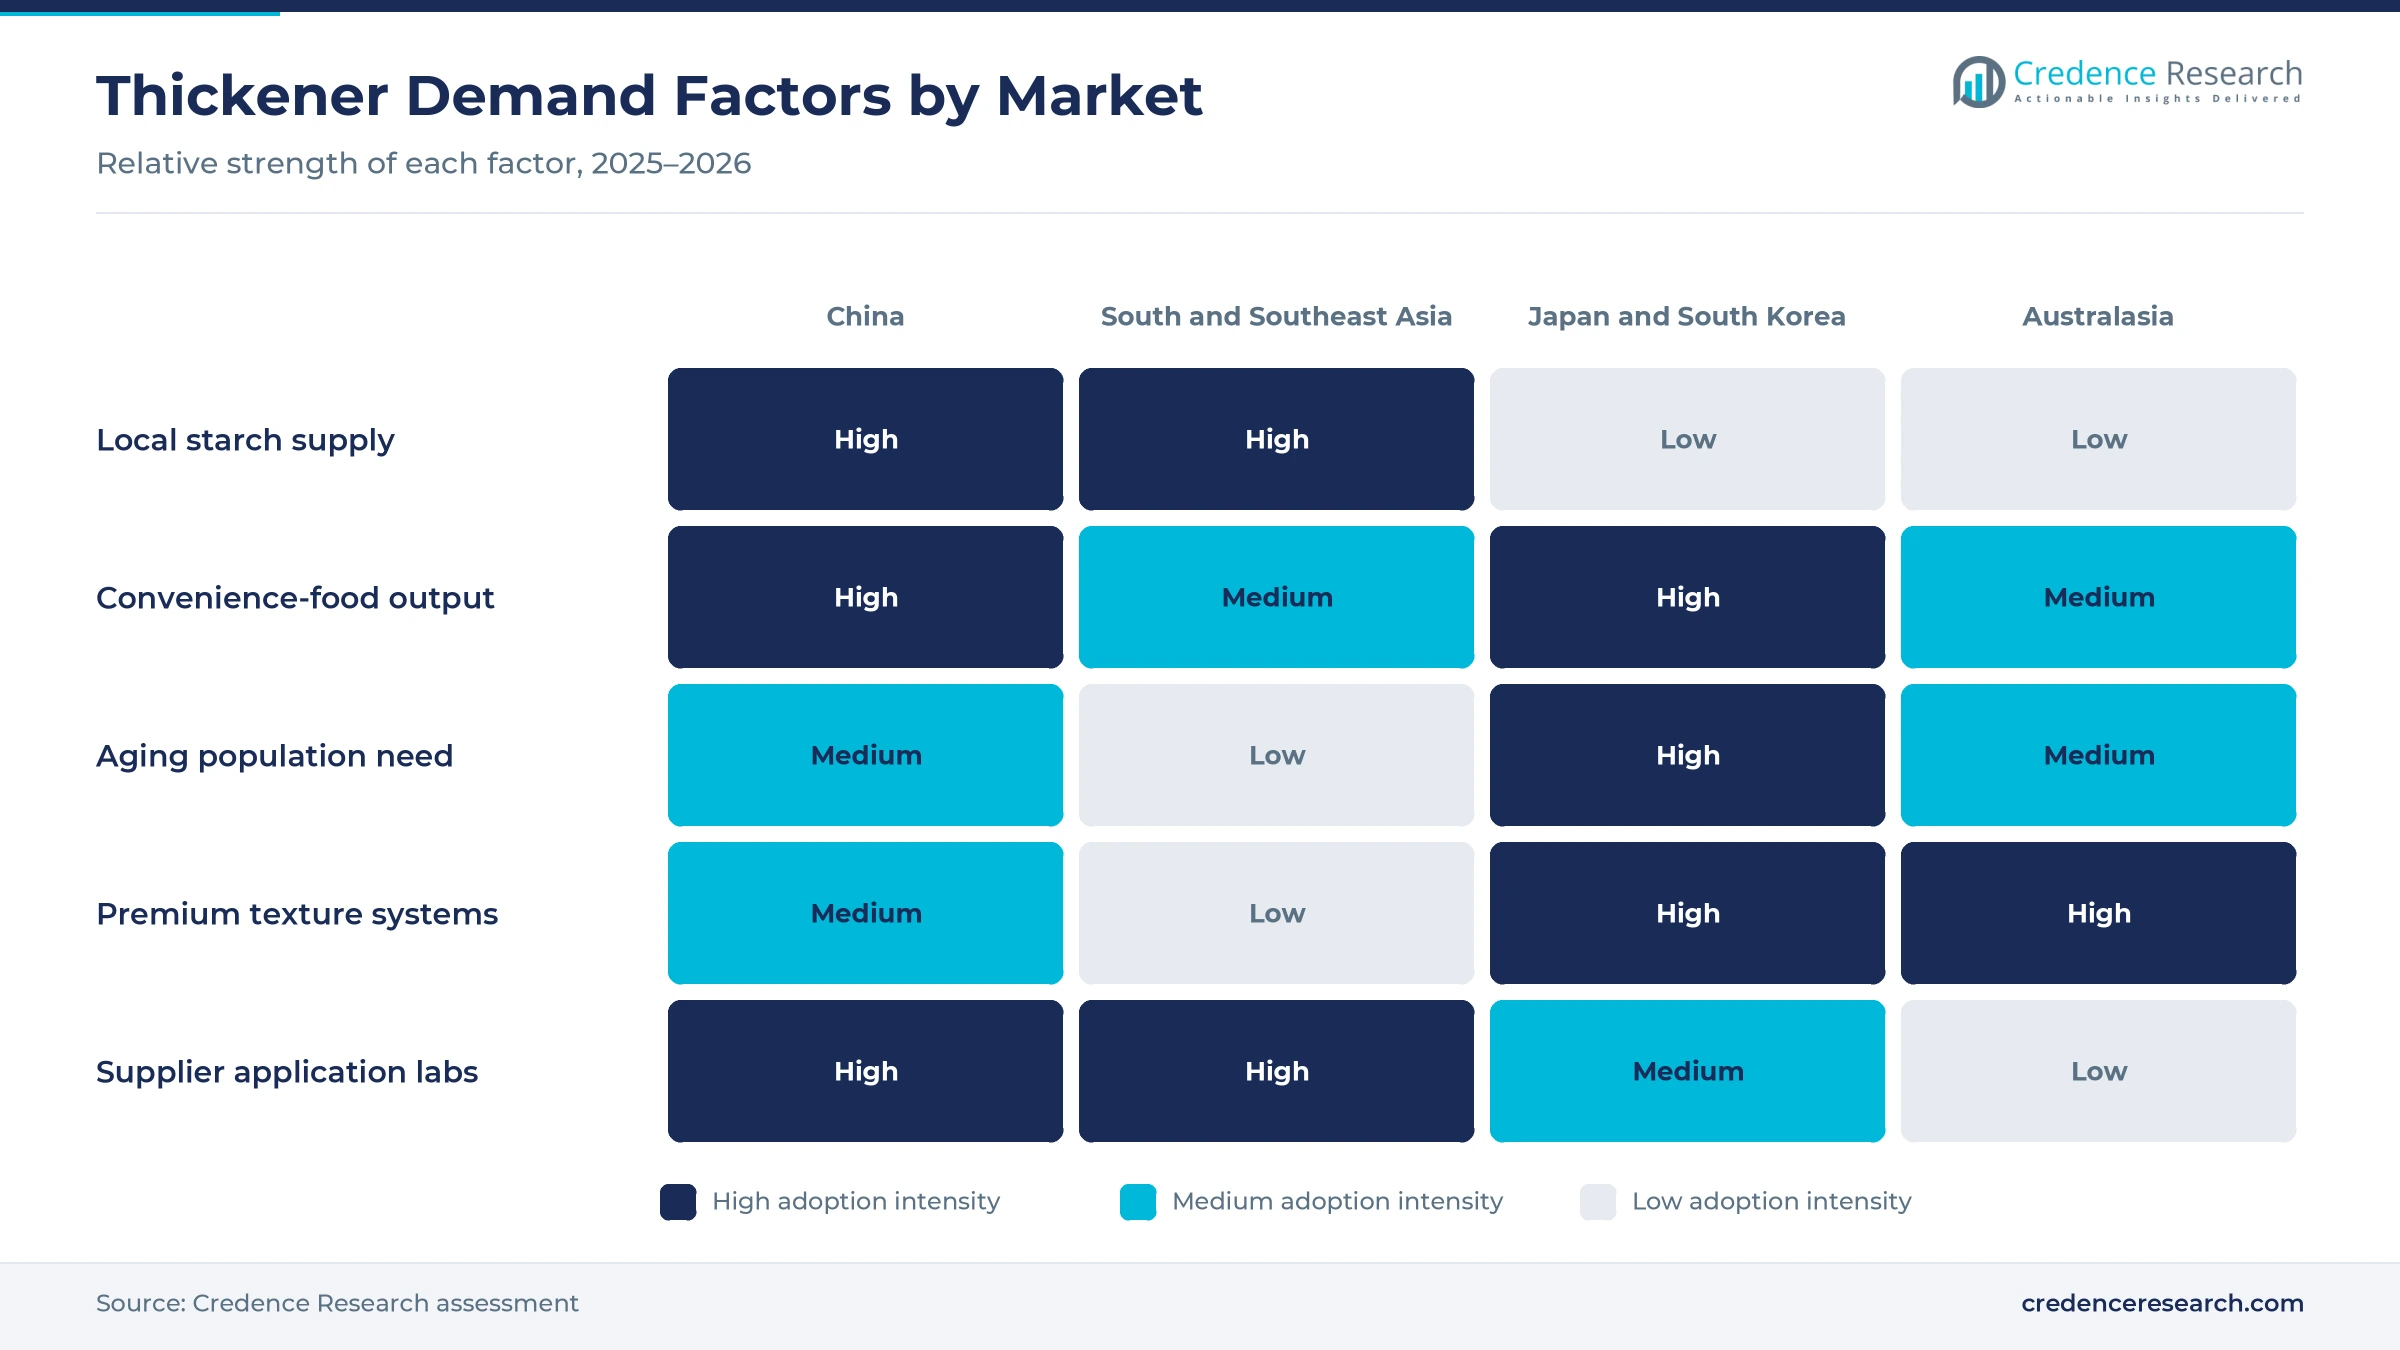
Frozen, chilled and shelf-stable meals are the largest source of new thickener demand, because these products need sauces and fillings that hold texture through freezing, reheating and long storage. Japan produced 1,574,172 metric tons of frozen food in 2025, up 2.4%, and domestic consumption passed 3 million metric tons for the first time, according to the Japan Frozen Food Association. China's National Health Commission released a draft national standard for pre-made dishes in February 2026 that bans preservatives and suggests a 12-month shelf-life ceiling, Caixin reported. India's food processing incentive scheme had paid about INR 2,000 crore to approved firms by early 2026, All India Radio News reported. In turn, makers of ready meals buy more freeze-stable starches and gums.
Why is texture-led reformulation reshaping product design?
Asian consumers judge food quality by mouthfeel, so food makers now redesign many products around chewy, creamy and crisp effects. Ingredion research published by Food Ingredients First in September 2026 found that 60% of Asia Pacific consumers prefer multi-textured products, rising to close to 80% in Southeast Asian markets such as Indonesia. Ingredion also told the same publisher in September 2025 that texture drives about 70% of the liking of food and that the Japanese language has more than 200 terms for texture. Tate & Lyle launched its Sensation mouthfeel tool for Asia Pacific in September 2025, starting with yogurt and drawing on research in China. As a result, hydrocolloid-based thickeners grow fastest by product type at 6.77% a year.
How does localized technical support win formulation briefs?
Food makers in the region award many supply contracts to ingredient partners with nearby laboratories that can test recipes on local equipment, raw materials and regulations. Tate & Lyle opened an automated mouthfeel laboratory in Singapore on Oct. 24, 2024, which runs characterization tests about 10 times faster, according to the Singapore Economic Development Board. Cargill opened a blending facility in Pandaan, East Java, in August 2024 to combine modified starches, pectin and carrageenan for confectionery textures, Confectionery Production reported. Ingredion's Shandong plant, opened in 2022, doubled its starch capacity in China and already exports to Japan and Australia, the company said. In turn, contract food manufacturers grow fastest by customer type at 6.84% a year, as co-packers rely on supplier laboratories for new recipes.
Why do aging populations raise demand for soft foods?
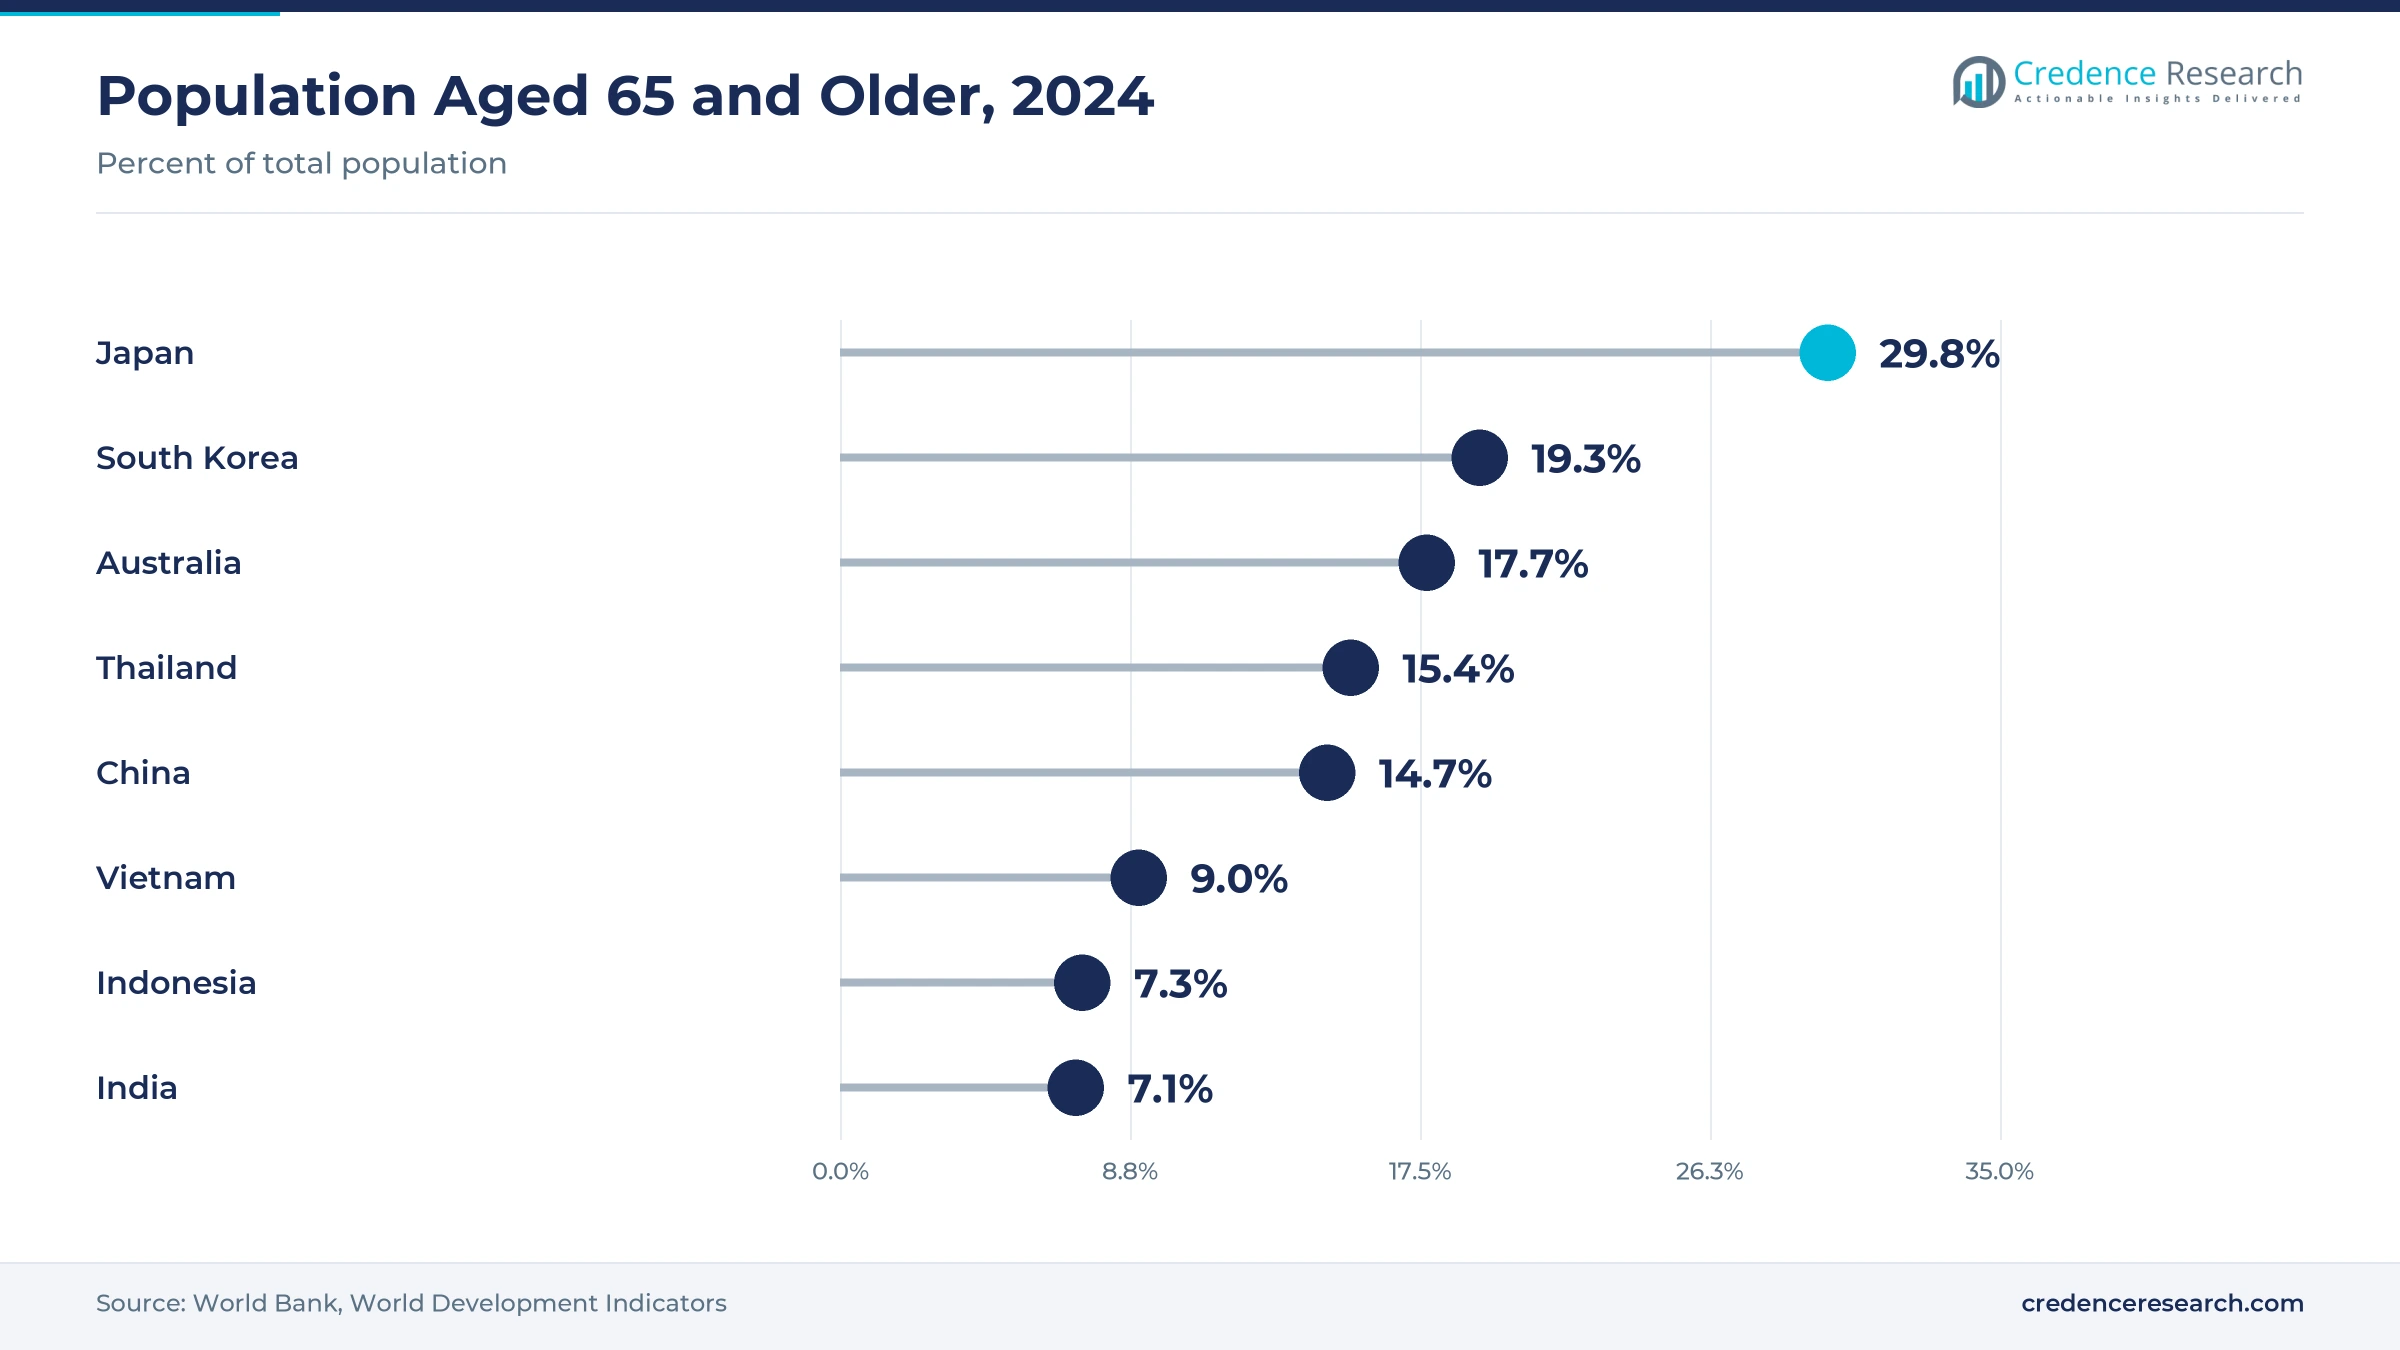
Older consumers need more easy-to-swallow meals and drinks, and these products rely on thickeners to control viscosity in drinks, purees and care meals. People aged 65 and older made up a record 29.4% of Japan's population in September 2025, or about 36.19 million people, according to an estimate by Japan's internal affairs ministry, as reported by Tuoi Tre. South Korea's interior ministry said on Dec. 24, 2024, that residents aged 65 and older passed 20% of the population. The same age group made up 14.7% of China's population in 2024, according to World Bank data. As a result, Japan and South Korea hold 20.1% of 2025 value, the second-largest share.
Cheaper tapioca, blended systems and sugar cuts shape demand
How is cheaper tapioca starch shifting supply costs?
Thai export prices for cassava-based starch fell sharply in 2025, which is shifting cost advantage toward Southeast Asian supply and lowering the base price of many thickening systems. Thailand exported 2.49 million metric tons of native tapioca starch in January to October 2025, worth 33,003 million baht, against 49,613 million baht a year earlier, according to the Thai Tapioca Trade Association. Modified starch exports held steady at 889,331 metric tons against 886,485 metric tons. China took 1.44 million metric tons of native starch and Japan took 241,002 metric tons of modified starch in the same period. As a result, buyers of modified starch gain room to reformulate, and the lowest price tier keeps 55.0% of value.
Why are blended texture systems on the rise?
Ingredient groups now sell more ready-made blends instead of single ingredients, and these combine starches, gums, fibers and proteins in one specification for each food. Tate & Lyle completed its USD 1.8 billion combination with CP Kelco on Nov. 15, 2024, Food Manufacture reported, and the company says its portfolio now spans starches, fibers, gums, pectins, sweeteners and proteins. Cargill's Pandaan facility blends modified starches with pectin and carrageenan for hard candies, chewy gummies and fizzy sweets. Kerry opened a 50,000 square meter site at Karawang, Indonesia, in June 2023 with a pilot plant for bakery, snacks and drinks. In turn, demand for hydrocolloids rises as more of them are sold inside ready-to-use blends.
Can reduced-sugar products open room for bulking thickeners?
Cutting sugar from drinks and dairy creates a clear opening for suppliers, because removing sugar strips body and mouthfeel that fibers, starches and gums must restore. Ingredion's 2025 research across India, Indonesia, Malaysia, the Philippines, Thailand and Vietnam found that 85% of respondents would pay more for reduced-sugar claims, Food Ingredients First reported. The same research found that about 87% of Indonesian consumers would pay up to 30% more for packaged products with reduced-sugar claims. Food makers therefore need fibers and gums that restore body at low dosage and low cost per serving. As a result, beverages grow fastest by application at 6.93% a year.
Is China's revised additive standard an opening for suppliers?
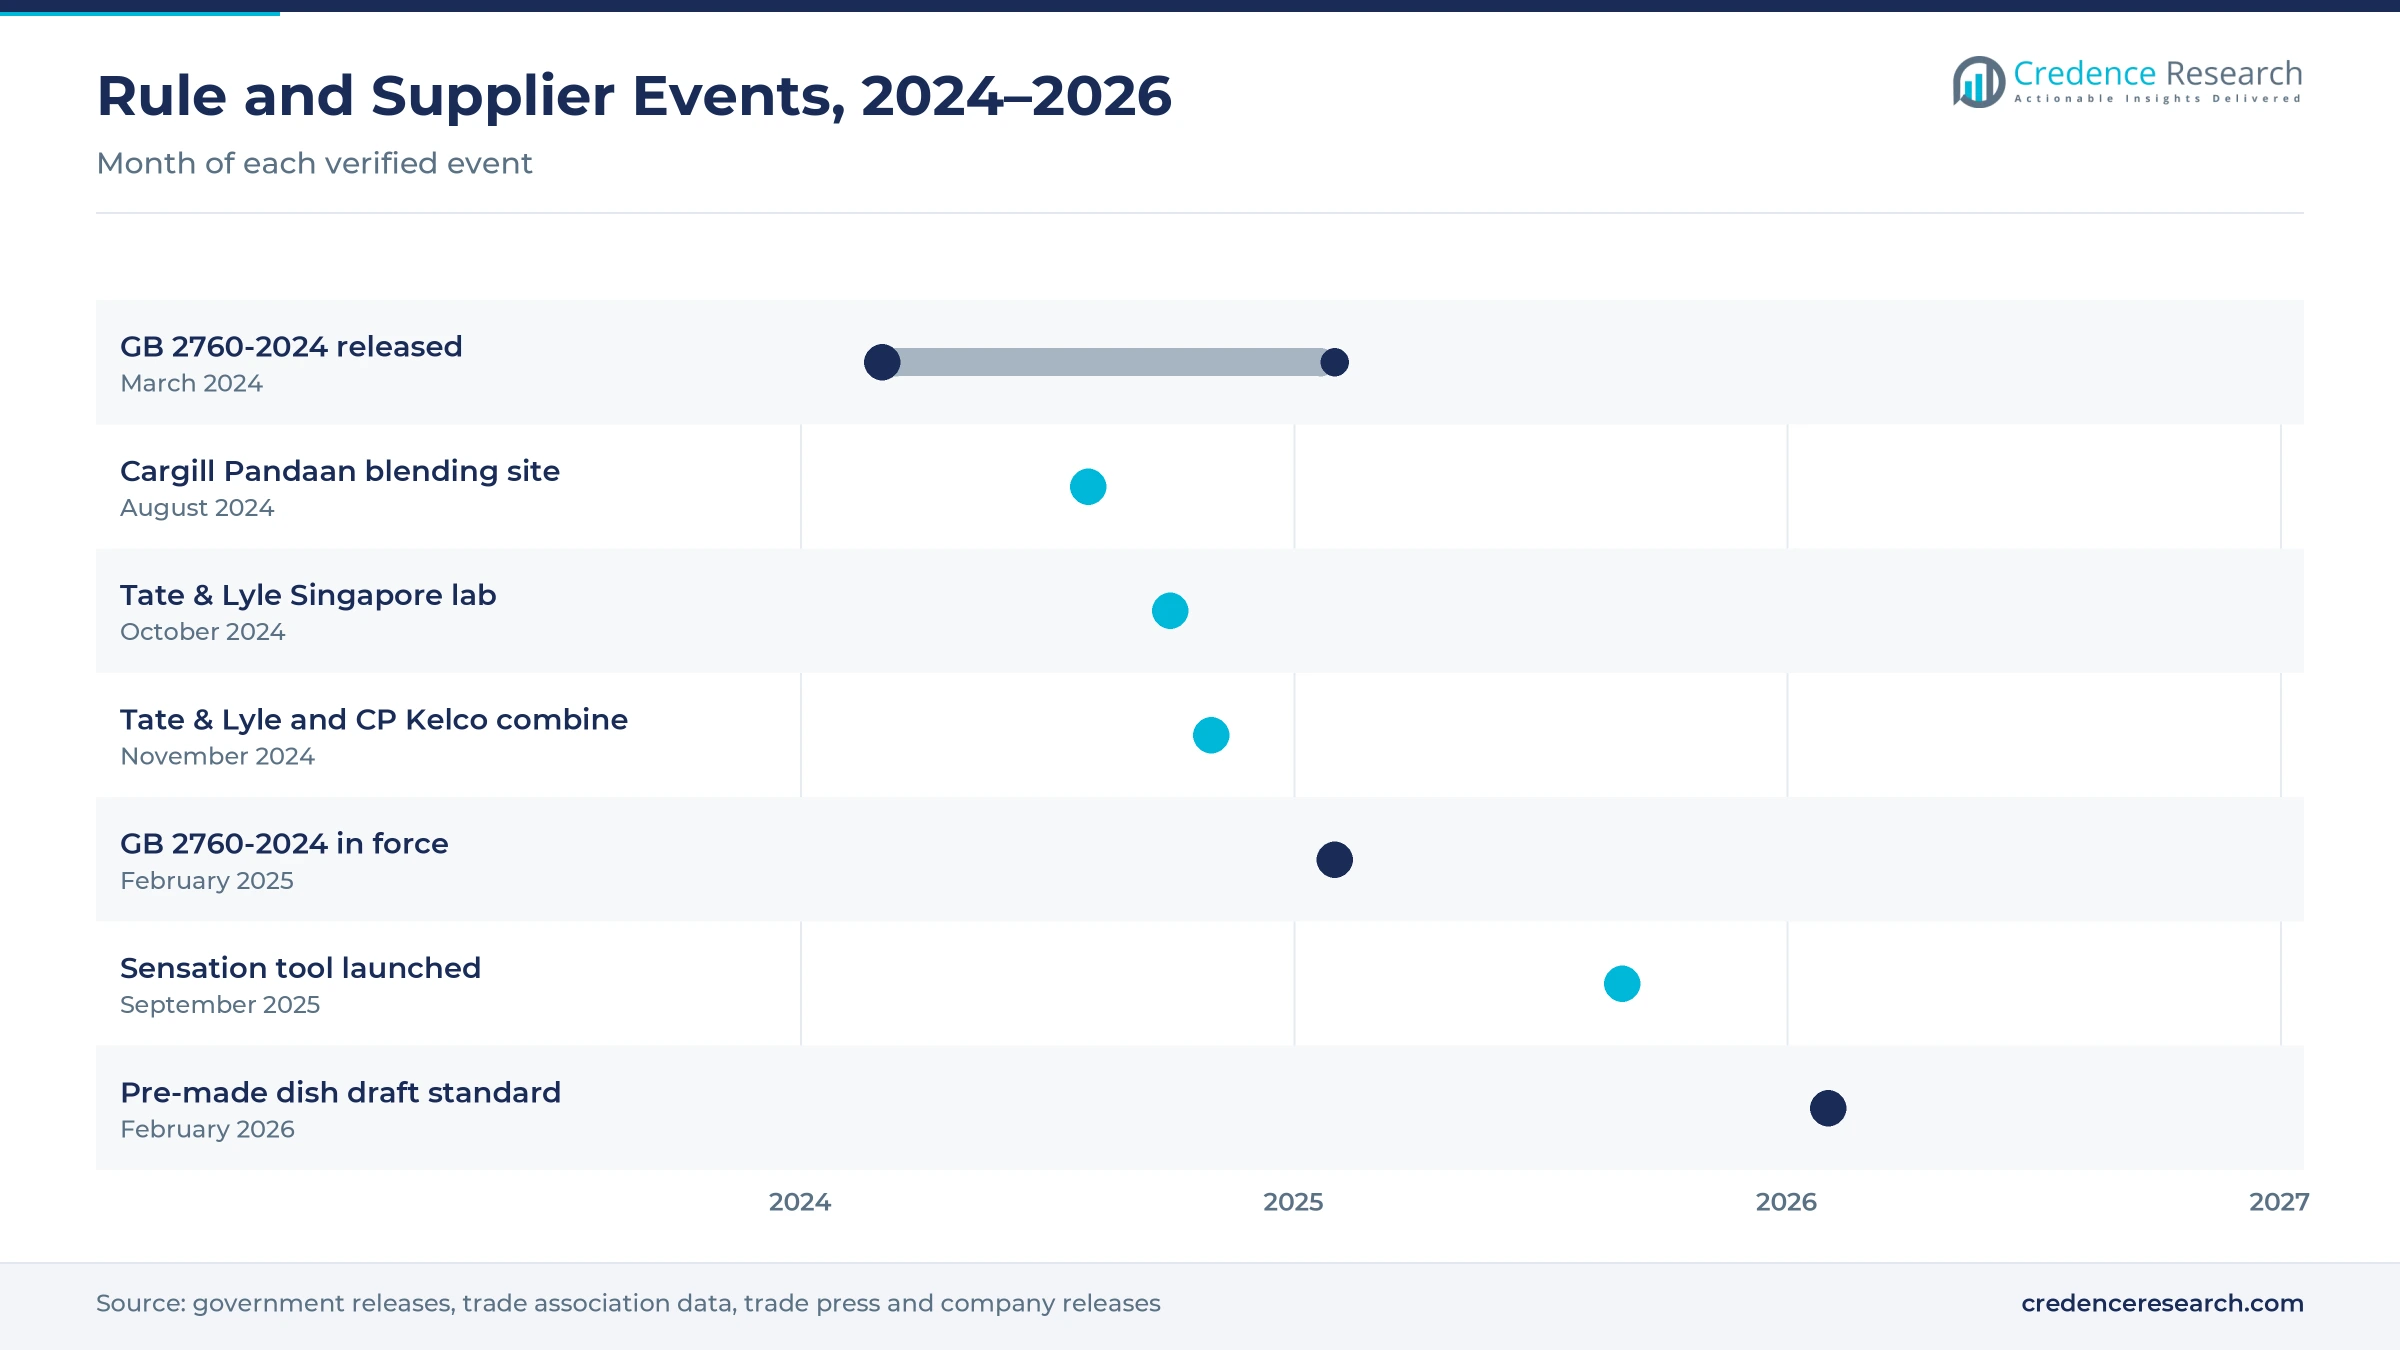
Processors in China must requalify many recipes under new national rules, which gives specialist suppliers a clear commercial opening. China released GB 2760-2024 on March 12, 2024, and it entered into force on Feb. 8, 2025, replacing the 2014 version, according to the U.S. Department of Agriculture. The draft pre-made dish standard of February 2026 adds limits on additives and a ban on preservatives for that category. Food makers therefore need thickeners that keep sauces and fillings stable without preservatives. In turn, suppliers with regulatory teams in China are best placed to win requalification work in the region's largest market.
Crop swings, label rules and price pressure test suppliers
How do crop swings unsettle starch costs?
Cassava and corn harvests vary with weather and disease, so starch prices can swing widely within a single year. Thai native starch export value fell by about a third in January to October 2025 while volume fell only slightly, which shows how fast prices move. As a result, buyers that lock in annual contracts can pay above spot prices for months. Larger processors respond by spreading supply across Thai, Vietnamese and Chinese mills.
Why do uneven additive rules slow regional launches?
Each country in Asia Pacific keeps its own list of permitted additives, maximum use levels and labeling rules for thickeners. China's GB 2760-2024, for example, reset permitted thickener uses by food category in February 2025, so recipes approved elsewhere need new checks before sale in China. In turn, multinational food makers spend more time and money on regulatory files for each launch. Suppliers with regional regulatory teams reduce this burden, but small brands often stay in one market.
How does price pressure limit premium texture systems?
Many packaged food buyers in Asia Pacific are highly price sensitive, which limits how fast premium gums and blended systems can replace starch. Over 40% of consumers in the region cite price as a top concern when buying packaged food, according to Ingredion research. As a result, food makers often accept simpler textures to protect shelf prices. Suppliers respond with blends that cut dosage, because the tier below USD 1,000 per tonne still drives most regional demand.
Why do clean-label demands complicate modified starches?
Shoppers and retailers increasingly question ingredient lists with chemical-sounding names, which puts pressure on chemically modified starches. Food makers then ask suppliers for physically modified starches, flours or fibers that match the same freeze and heat stability. However, these alternatives often cost more and may perform less well in retorted sauces and frozen meals. In turn, suppliers must invest in new processes before they can win reformulation briefs.
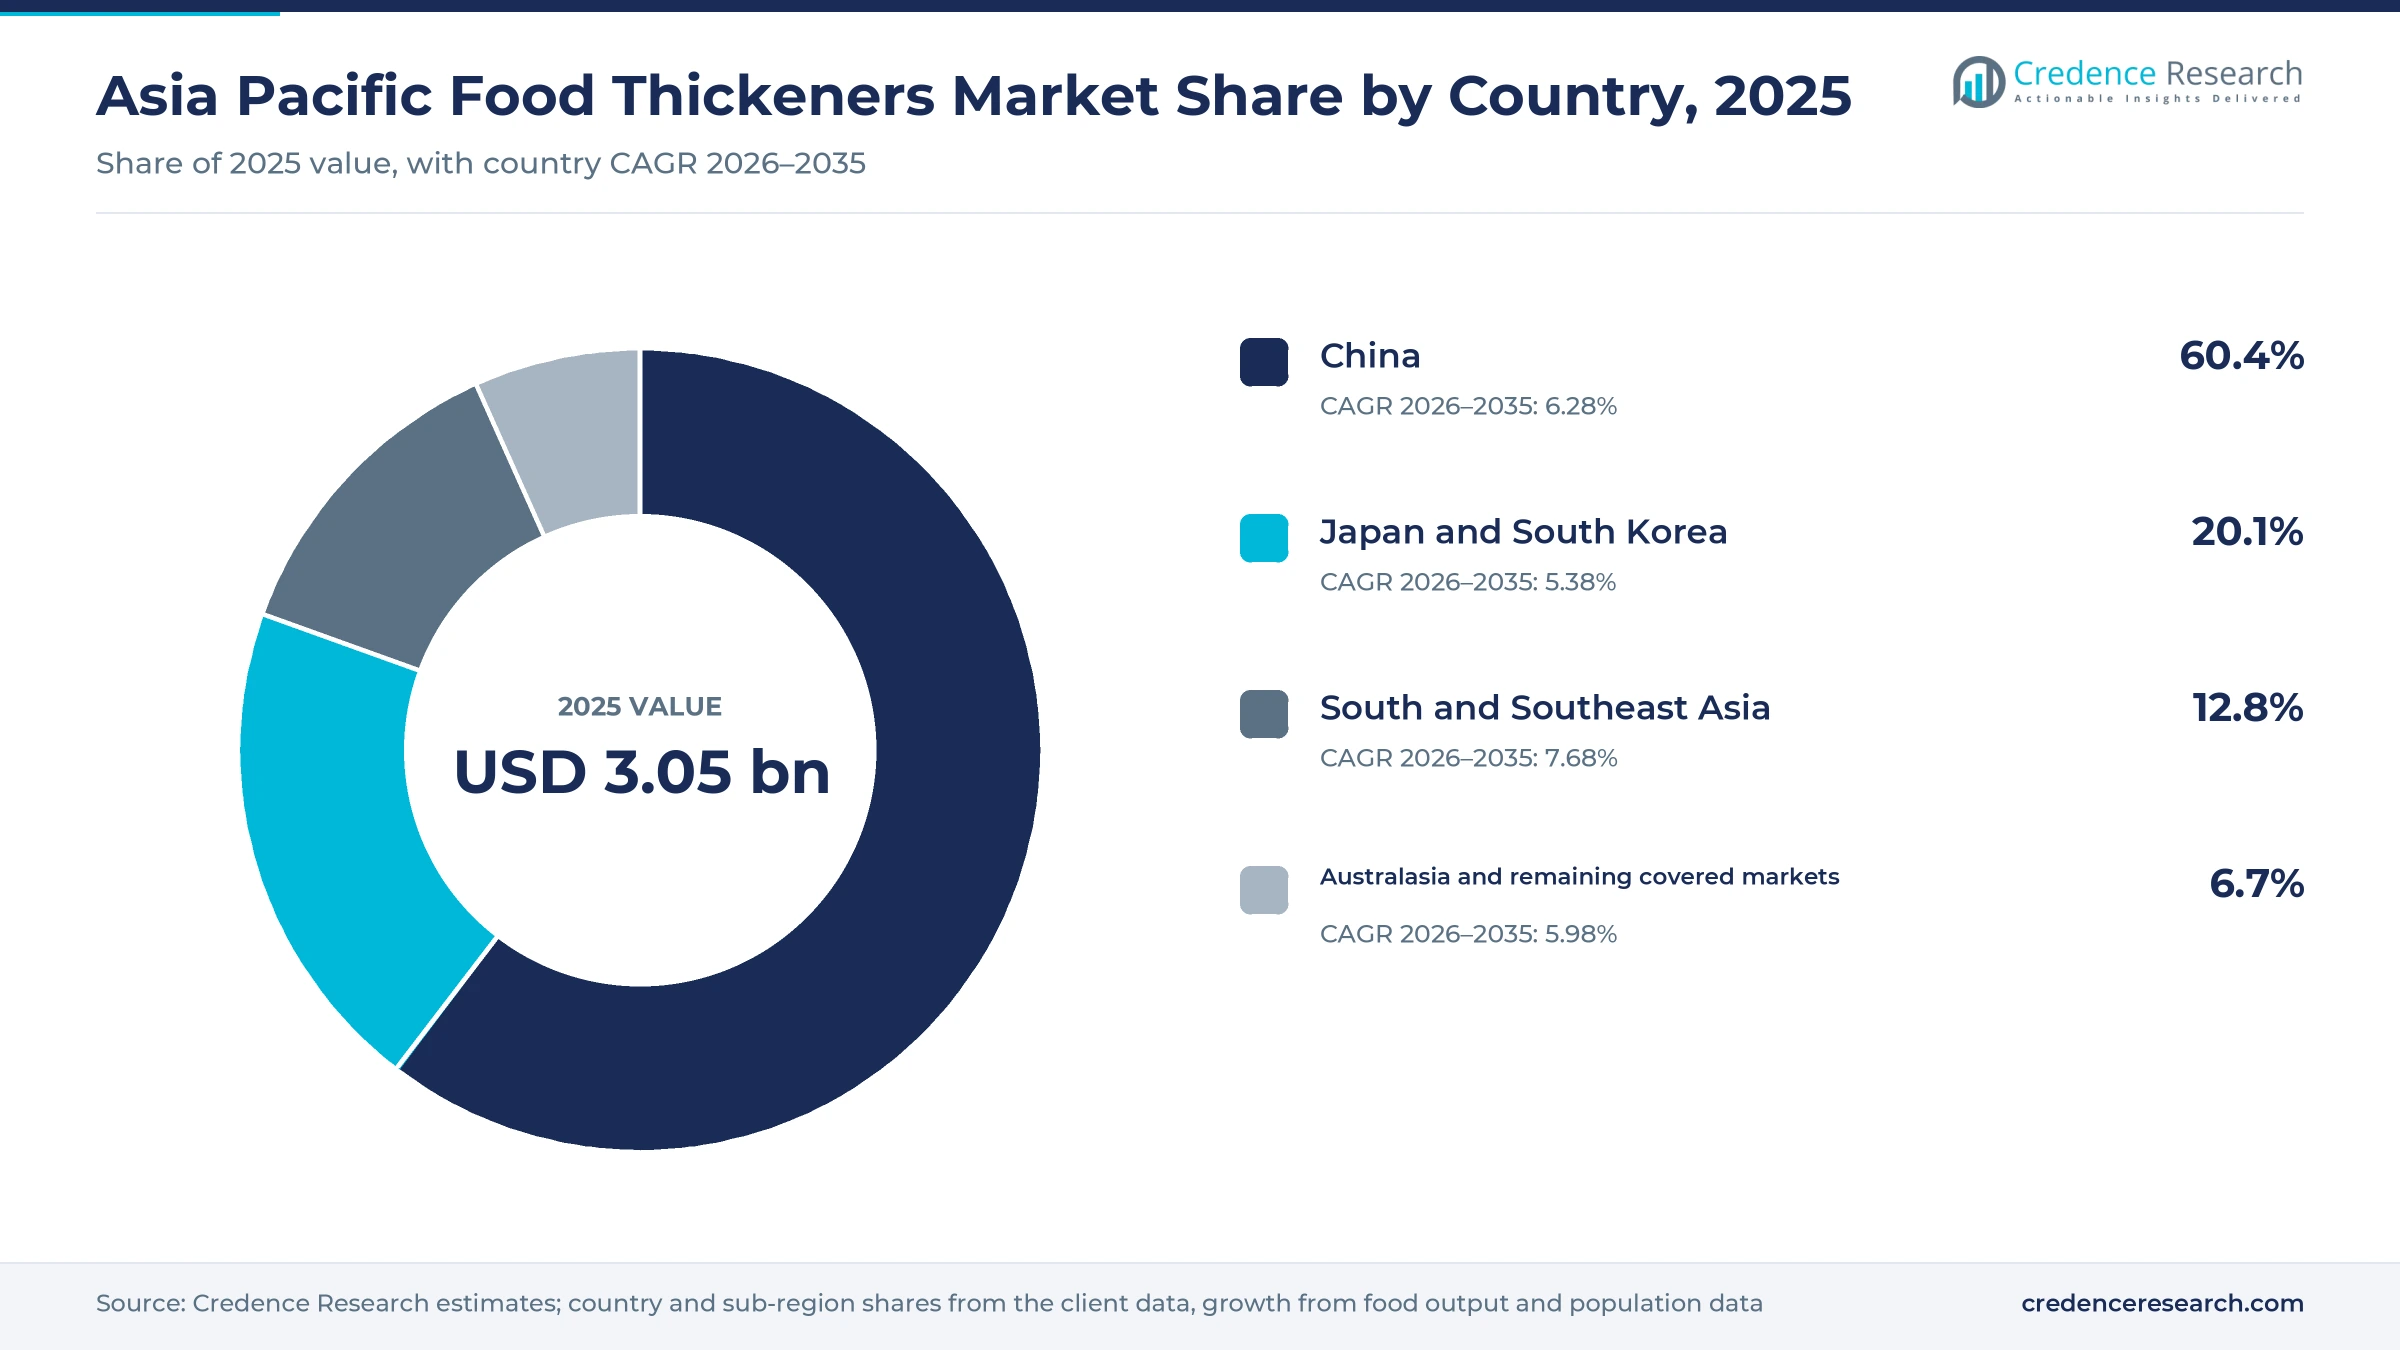
China leads while South and Southeast Asia grows fastest
| Country | Value, 2025 (USD billion) | Share, 2025 | CAGR, 2026–2035 |
|---|---|---|---|
| China | 1.84 | 60.4% | 6.28% |
| Japan and South Korea | 0.61 | 20.1% | 5.38% |
| South and Southeast Asia | 0.39 | 12.8% | 7.68% |
| Australasia and remaining covered markets | 0.20 | 6.7% | 5.98% |
Why does China keep the largest share of thickener demand?
China held 60.4% of 2025 value and grows at 6.28% a year, because its sauce, dairy, noodle and prepared-dish makers form the largest food processing base in the region. China imported 1.44 million metric tons of Thai native tapioca starch in January to October 2025, alongside its own corn starch output. Ingredion's Shandong plant doubled the company's starch capacity in the country. As a result, China sets price and specification trends for starches and gums across the region.
Why do older diners favor premium textures in Japan and Korea?
Japan and South Korea held 20.1% of 2025 value and grow at 5.38% a year, because high incomes and older populations support premium textures and care foods. Japan bought 241,002 metric tons of Thai modified starch in January to October 2025, the largest volume of any destination. Japanese frozen food consumption reached 24.6 kilograms per person in 2025. However, slow population growth keeps volume gains modest, so value growth comes mostly from higher-priced systems.
Why are Indian and Indonesian food plants adding volume fastest?
South and Southeast Asia held 12.8% of 2025 value and grows fastest at 7.68% a year, because India, Indonesia, Thailand and Vietnam are expanding packaged food output. India's food processing incentive scheme approved 165 applications across 274 project locations by February 2026. Kerry, Cargill and Tate & Lyle all run application or blending sites in Indonesia. In turn, local makers of noodles, sauces and dairy drinks are moving from home-style recipes to standardized texture systems.
How do mature dairy and aged care sectors shape demand in Australia?
Australasia and remaining covered markets held 6.7% of 2025 value and grow at 5.98% a year, because Australia and New Zealand run mature dairy, bakery and meal sectors. People aged 65 and older made up 17.7% of Australia's population in 2024, according to World Bank data, which supports texture-modified foods for aged care. Aged care homes in Australia also buy thickened drinks and texture-modified meals for residents with swallowing difficulties. As a result, growth comes from premium dairy and care foods.
Rule changes and supplier moves marked 2024 to 2026
| Development | Status and market relevance |
|---|---|
| In August 2024, Cargill opened a blending facility in Pandaan, East Java, for confectionery texture systems. | Combines modified starches, pectin and carrageenan for Asian candy makers |
| In October 2024, Tate & Lyle opened an automated mouthfeel laboratory in Singapore. | Makes Singapore its Asia Pacific hub for mouthfeel research |
| In November 2024, Tate & Lyle completed its combination with CP Kelco. | Adds pectin and specialty gums to its starch-based range |
| In September 2025, Tate & Lyle launched its Sensation mouthfeel formulation tool in Asia Pacific. | Starts with yogurt, using consumer research in China |
| In February 2026, China's National Health Commission released a draft standard for pre-made dishes. | Bans preservatives and sets rules for additives in prepared meals |
Source and process decide each thickener use
- Starch processing wet-mills corn and cassava into native starch and then modifies it, which gives freeze, heat and acid stability for sauces and fillings.
- Extraction and purification recovers pectin, carrageenan, agar and guar from fruit peel, seaweed and seeds, which suits gels, dairy desserts and confectionery.
- Microbial fermentation grows gums such as xanthan gum and gellan from sugars, which gives strong suspension in drinks and dressings at low dosage.
- Protein texturization uses dairy, soy, pea and gelatin proteins to add body and binding, which suits yogurts, plant-based foods and meat products.
Need a Custom Version of This Report?
Tailor the scope, geography, or segments to your exact requirements.
- Custom geography or segment scope
- Direct access to our analyst team
Global ingredient groups compete on local application labs
Competition centers on application support, regulatory knowledge, supply security and the breadth of texture portfolios, and global ingredient groups lead it. Ingredion runs a starch plant in Shandong that doubled its Chinese capacity and promotes multi-texture and sugar-reduction solutions across the region. Tate & Lyle uses its Singapore mouthfeel hub and Jakarta innovation center, and its combination with CP Kelco added pectin and specialty gums. Cargill blends modified starches, pectin and carrageenan at Pandaan in Indonesia. Kerry serves bakery, snack and drink makers from its Karawang site, while ADM supports plant-based texture work from its Biopolis laboratory in Singapore. Local starch and gum mills in China and Thailand compete on price in the lowest tier. Starch-based thickeners held 62.0% of 2025 value, so cost per kilogram still decides most volume orders.
Companies profiled and their roles in this market
| Company | Type | Role in the market |
|---|---|---|
| Cargill | Integrated agribusiness and ingredient group | Pandaan, East Java blending facility opened 2024 |
| Tate & Lyle | Specialty food ingredient group | Singapore mouthfeel lab and Jakarta innovation center |
| Ingredion | Starch and texture ingredient group | Shandong starch plant serving China, Japan and Australia |
| ADM | Integrated agribusiness and ingredient group | Biopolis plant-based innovation lab in Singapore |
| Kerry Group | Taste and nutrition group | Karawang, Indonesia manufacturing and pilot plant site |
Texture systems will grow faster than commodity starch
Credence Research's view is that Asia Pacific thickener spending will shift steadily from commodity starch toward blended texture systems, even though starch keeps the largest volume. Cheaper tapioca supply in 2025 lowers costs and gives food makers room to reformulate. Reduced-sugar drinks, convenience meals and soft foods for older consumers should lift hydrocolloids and premium tiers. South and Southeast Asia should grow fastest as packaged food output widens, while China keeps the largest base. Suppliers with local labs and regulatory teams should gain the most share.
Trade data, food output and policy anchor the estimate
The report uses 2025 as the base year on a calendar basis, and market values come from the Credence Research model. That model combines starch trade data, food production statistics, population data, food additive rules and company facility information. Segment splits and growth rates are Credence Research estimates, while country and sub-region shares follow the client data. Sources used are government releases, official statistics, trade association data, trade press and company information, and no interviews or surveys were used.
Convenience foods and older diners carry growth to 2035
Sales of food thickeners in Asia Pacific are expected to reach USD 5.61 billion by 2035, a 6.27% CAGR during 2026–2035, as convenience meals, reduced-sugar products and soft foods widen their use. Growth should stay steady in China as processors adapt to the revised additive standard and new pre-made dish rules. South and Southeast Asia should add volume fastest as Indian and Indonesian food plants scale up. Lower starch prices would favor reformulation, while weak consumer spending would slow premium systems. Hydrocolloid-based thickeners are expected to gain the most product share through 2035.
Frequently Asked Questions
How big is the Asia Pacific food thickeners market?
Which product type leads the regional market?
Which country leads Asia Pacific demand?
Which application uses the most thickeners?
How does convenience food affect thickener demand?
How did China change its food additive rules?
Who are the leading suppliers in Asia Pacific?
What are the main challenges for thickener suppliers?
Table of Content
Chapter 1 Market Segmentation
- 1.1 Segmentation Framework
- 1.1.1 Product and Service Classification
- 1.1.2 Application and End-Use Classification
- 1.1.3 Technology and Solution Classification
- 1.1.4 Customer and Distribution Channel Classification
- 1.1.5 Geographic Segmentation
- 1.1.6 Market Segment Definitions and Boundaries
- 1.2 By Product Type
- 1.2.1 Starch-based thickeners
- 1.2.2 Hydrocolloid-based thickeners
- 1.2.3 Protein-based thickeners
- 1.3 By Application
- 1.3.1 Dairy and desserts
- 1.3.2 Bakery and confectionery
- 1.3.3 Sauces and savory foods
- 1.3.4 Beverages
- 1.4 By Customer Type
- 1.4.1 Branded food manufacturers
- 1.4.2 Contract food manufacturers
- 1.4.3 Ingredient system formulators
- 1.5 By Price Tier
- 1.5.1 Below USD 1,000 per tonne
- 1.5.2 USD 1,000 to below USD 4,000 per tonne
- 1.5.3 USD 4,000 per tonne and above
- 1.6 By Country
- 1.6.1 China
- 1.6.2 South and Southeast Asia
- 1.6.3 Japan and South Korea
- 1.6.4 Australasia and remaining covered markets
Chapter 2 Introduction
- 2.1 Report Objectives and Scope
- 2.2 Product Definition and Industry Terminology
- 2.3 Market Inclusions and Exclusions
- 2.4 Research Process
- 2.4.1 Primary Research and Expert Interviews
- 2.4.2 Secondary Research and Source Review
- 2.4.3 Top-Down and Bottom-Up Estimation
- 2.4.4 Data Triangulation and Verification
- 2.5 Market Size Measurement Basis
- 2.5.1 2025: USD 3.05 billion → 2035: USD 5.61 billion
- 2.6 Historical and Forecast Reference Periods
- 2.6.1 Historical Period: 2018-2025
- 2.6.2 Base Year: 2025
- 2.6.3 Forecast Period: 2025-2035
- 2.7 Research Assumptions and Limitations
Chapter 3 Executive Summary
- 3.1 Market Snapshot and Key Findings
- 3.2 Base-Year Market Size, 2025
- 3.3 Forecast Market Size, 2035
- 3.4 Revenue and Volume Growth Outlook
- 3.5 Key Demand and Supply Indicators
- 3.6 Leading Market Segments
- 3.7 Fastest-Growing Market Opportunities
- 3.8 Regional Performance Highlights
- 3.9 Technology and Industry Transformation
- 3.10 Competitive Landscape Summary
- 3.11 Analyst View and Strategic Implications
Chapter 4 Asia Pacific Food Thickeners Market Trends and Developments
- 4.1 Historical Industry Development, 2018-2025
- 4.2 Recent Market Trends and Developments
- 4.3 Demand and Customer Behavior Trends
- 4.4 Technology and Product Innovation
- 4.5 Artificial Intelligence, Automation and Digitalization
- 4.6 Local Manufacturing and Supply Chain Realignment
- 4.7 Industry Partnerships, Mergers and Acquisitions
- 4.8 Sustainability and Circular Economy Developments
- 4.9 Government and Private Sector Investment Trends
- 4.10 Emerging Business Models and Commercialization
- 4.11 Industry Developments and Announcements
Chapter 5 Asia Pacific Food Thickeners Market Production, Supply and Demand Analysis
- 5.1 Demand Trend and Consumption Analysis, 2018-2025
- 5.2 Demand Forecast, 2025-2035
- 5.3 Production and Output Trend, 2018-2025
- 5.4 Production and Output Forecast, 2025-2035
- 5.5 Installed Capacity and Capacity Utilization
- 5.6 Company-Wise Production Plants and Statistics
- 5.6.1 Installed Production Capacity
- 5.6.2 Actual Production
- 5.6.3 Planned Capacity and Expansion Targets
- 5.7 Supply Chain Structure and Procurement Trends
- 5.8 Supply-Demand Gap and Bottlenecks
- 5.9 Import Dependence and Sourcing Structure
- 5.10 Contract Manufacturing and Outsourcing
- 5.11 Regional Supply and Demand Concentration
Chapter 6 Asia Pacific Food Thickeners Market Pricing Analysis
- 6.1 Pricing Structure and Measurement
- 6.2 Historical Pricing Trends, 2018-2025
- 6.3 Pricing Outlook, 2025-2035
- 6.4 Average Selling Price and Unit Economics
- 6.5 Pricing by Product and Market Segment
- 6.6 Geographic Pricing Differences
- 6.7 Key Input, Energy, Labor and Logistics Costs
- 6.8 Contract Pricing and Purchasing Models
- 6.9 Pricing Sensitivity and Competitive Positioning
- 6.10 Price, Margin and Profitability Implications
Chapter 7 Asia Pacific Food Thickeners Market Dynamics
- 7.1 Market Growth Drivers
- 7.1.1 Demand-Side Drivers
- 7.1.2 Technology and Innovation Drivers
- 7.1.3 Infrastructure and Investment Drivers
- 7.1.4 Regulatory and Policy Drivers
- 7.2 Market Restraints
- 7.2.1 Cost and Affordability Constraints
- 7.2.2 Technology and Adoption Barriers
- 7.2.3 Supply Chain and Operational Constraints
- 7.3 Market Challenges
- 7.3.1 Competitive Pressure and Margin Erosion
- 7.3.2 Skills, Infrastructure and Implementation Gaps
- 7.4 Emerging Market Opportunities
- 7.5 Market Dynamics Impact and Time-Horizon Assessment
Chapter 8 Asia Pacific Food Thickeners Value Chain Analysis
- 8.1 Industry Value Chain Overview
- 8.2 Upstream Suppliers and Critical Inputs
- 8.3 Technology and Component Providers
- 8.4 Manufacturing or Service Delivery
- 8.5 Distribution, Channel Partners and Integrators
- 8.6 Downstream Applications and End Users
- 8.7 Value Addition and Profit Pools
- 8.8 Vertical Integration and Outsourcing
- 8.9 Supplier Concentration and Risk
- 8.10 Supply Chain Localization and Resilience
Chapter 9 Asia Pacific Food Thickeners Market Regulations and Policies
- 9.1 Relevant Laws, Standards and Compliance Frameworks
- 9.2 Product, Service, Safety and Quality Requirements
- 9.3 Government Policies, Incentives and Subsidies
- 9.4 Imports, Exports and Trade Barriers
- 9.5 Public Procurement and Local Content Requirements
- 9.6 Environmental and Sustainability Compliance
- 9.7 Upcoming Policy Changes and Market Implications
Chapter 10 Asia Pacific Food Thickeners Market Hotspots and Opportunities
- 10.1 Market Opportunity Mapping and Growth Hotspots
- 10.2 High-Growth Applications and Customer Groups
- 10.3 Underserved Markets and White-Space Opportunities
- 10.4 Emerging Technology and Product Opportunities
- 10.5 New Capacity and Investment Hotspots
- 10.6 Market Entry and Expansion Opportunities
- 10.7 Distribution and Partnership Opportunities
- 10.8 Near-Term and Long-Term Commercial Potential
- 10.9 Opportunity Attractiveness and Execution Risks
Chapter 11 Asia Pacific Food Thickeners Market Outlook, 2025-2035
- 11.1 Market Size and Analysis
- 11.1.1 Revenue (Market Measurement: 2025: USD 3.05 billion → 2035: USD 5.61 billion)
- 11.1.2 Market Volume and Quantity Sold
- 11.1.3 Historical Market Size, 2018-2025
- 11.1.4 Base-Year Market Size, 2025
- 11.2 Market Forecast, 2025-2035
- 11.2.1 Revenue Forecast to 2035
- 11.2.2 Volume Forecast to 2035
- 11.2.3 CAGR and Year-on-Year Growth
- 11.2.4 Incremental Revenue Opportunity
- 11.3 Forecast Assumptions and Scenario Analysis
- 11.3.1 Base-Case Forecast
- 11.3.2 Optimistic and Conservative Scenarios
- 11.3.3 Technology, Pricing and Policy Sensitivities
- 11.4 Market Attractiveness and Growth Outlook
Chapter 12 Asia Pacific Food Thickeners Market Segmentation and Outlook
- 12.1 Segmentation Summary and Market Shares, 2025
- 12.2 Largest and Fastest-Growing Segments
- 12.3 By Product Type - Market Size and Forecast, 2025-2035
- 12.3.1 Segment Definition and Scope
- 12.3.2 Historical Market Size, 2018-2025
- 12.3.3 Revenue Forecast, 2025-2035
- 12.3.4 Volume Forecast, 2025-2035
- 12.3.5 Base-Year Market Share, 2025
- 12.3.6 Segment CAGR and Growth Drivers
- 12.3.7 Subsegment Market Size and Forecast
- 12.3.7.1 Starch-based thickeners
- 12.3.7.2 Hydrocolloid-based thickeners
- 12.3.7.3 Protein-based thickeners
- 12.3.8 Subsegment Pricing and Adoption Trends
- 12.3.9 Leading Suppliers and Competition
- 12.3.10 Regional Demand and Opportunities
- 12.4 By Application - Market Size and Forecast, 2025-2035
- 12.4.1 Segment Definition and Scope
- 12.4.2 Historical Market Size, 2018-2025
- 12.4.3 Revenue Forecast, 2025-2035
- 12.4.4 Volume Forecast, 2025-2035
- 12.4.5 Base-Year Market Share, 2025
- 12.4.6 Segment CAGR and Growth Drivers
- 12.4.7 Subsegment Market Size and Forecast
- 12.4.7.1 Dairy and desserts
- 12.4.7.2 Bakery and confectionery
- 12.4.7.3 Sauces and savory foods
- 12.4.7.4 Beverages
- 12.4.8 Subsegment Pricing and Adoption Trends
- 12.4.9 Leading Suppliers and Competition
- 12.4.10 Regional Demand and Opportunities
- 12.5 By Customer Type - Market Size and Forecast, 2025-2035
- 12.5.1 Segment Definition and Scope
- 12.5.2 Historical Market Size, 2018-2025
- 12.5.3 Revenue Forecast, 2025-2035
- 12.5.4 Volume Forecast, 2025-2035
- 12.5.5 Base-Year Market Share, 2025
- 12.5.6 Segment CAGR and Growth Drivers
- 12.5.7 Subsegment Market Size and Forecast
- 12.5.7.1 Branded food manufacturers
- 12.5.7.2 Contract food manufacturers
- 12.5.7.3 Ingredient system formulators
- 12.5.8 Subsegment Pricing and Adoption Trends
- 12.5.9 Leading Suppliers and Competition
- 12.5.10 Regional Demand and Opportunities
- 12.6 By Price Tier - Market Size and Forecast, 2025-2035
- 12.6.1 Segment Definition and Scope
- 12.6.2 Historical Market Size, 2018-2025
- 12.6.3 Revenue Forecast, 2025-2035
- 12.6.4 Volume Forecast, 2025-2035
- 12.6.5 Base-Year Market Share, 2025
- 12.6.6 Segment CAGR and Growth Drivers
- 12.6.7 Subsegment Market Size and Forecast
- 12.6.7.1 Below USD 1,000 per tonne
- 12.6.7.2 USD 1,000 to below USD 4,000 per tonne
- 12.6.7.3 USD 4,000 per tonne and above
- 12.6.8 Subsegment Pricing and Adoption Trends
- 12.6.9 Leading Suppliers and Competition
- 12.6.10 Regional Demand and Opportunities
- 12.7 By Country - Market Size and Forecast, 2025-2035
- 12.7.1 Segment Definition and Scope
- 12.7.2 Historical Market Size, 2018-2025
- 12.7.3 Revenue Forecast, 2025-2035
- 12.7.4 Volume Forecast, 2025-2035
- 12.7.5 Base-Year Market Share, 2025
- 12.7.6 Segment CAGR and Growth Drivers
- 12.7.7 Subsegment Market Size and Forecast
- 12.7.7.1 China
- 12.7.7.2 South and Southeast Asia
- 12.7.7.3 Japan and South Korea
- 12.7.7.4 Australasia and remaining covered markets
- 12.7.8 Subsegment Pricing and Adoption Trends
- 12.7.9 Leading Suppliers and Competition
- 12.7.10 Regional Demand and Opportunities
- 12.8 Segment Growth Comparison
- 12.9 Segment Attractiveness and Priority Matrix
Chapter 13 Asia Pacific Food Thickeners End-Use and Application Market Outlook
- 13.1 End-Use Industry and Customer Demand Structure
- 13.2 Leading Applications and Customer Groups
- 13.3 End-Use Market Size, Share and Forecast
- 13.4 Major End-Use Industry Deep Dives
- 13.4.1 Customer Requirements and Use Cases
- 13.4.2 Demand and Replacement Cycles
- 13.4.3 Technical and Regulatory Considerations
- 13.4.4 Purchasing and Procurement Models
- 13.4.5 Leading Vendors and Distribution Channels
- 13.4.6 Forecast and Commercial Opportunities
- 13.5 Emerging Applications and Cross-Segment Demand
- 13.6 End-Use Industry Investment Priorities
Chapter 14 Asia Pacific Food Thickeners Geographic Market Outlook, 2025-2035
- 14.1 Regional Market Size and Country-Level Shares, 2025
- 14.2 Country Market Size Comparison, 2025
- 14.3 Country Market Forecasts, 2025-2035
- 14.4 Subregional Industrial and Demand Clusters
- 14.5 Intra-Regional Pricing and Cost Differences
- 14.6 Cross-Border Trade and Supply Networks
- 14.7 Regional Supply and Demand Balances
- 14.8 Country Opportunity Comparison and Prioritization
Note: Every listed country is covered on the structure shown under the first country.
Chapter 15 Asia Pacific Food Thickeners Technology, Innovation and Sustainability Outlook
- 15.1 Technology Landscape and Maturity
- 15.2 Product, Process and Service Innovation
- 15.3 AI, Automation and Digital Tools in the Industry
- 15.4 Technology Adoption and Performance Benchmarking
- 15.5 Innovation Pipeline and R&D Investment
- 15.6 Patent and Intellectual Property Trends
- 15.7 Energy Efficiency and Resource Management
- 15.8 Sustainability, Recycling and Circularity
- 15.9 Technology Roadmap, 2025-2035
- 15.10 Risks of Obsolescence and Technology Substitution
Chapter 16 Asia Pacific Food Thickeners Market Key Strategic Imperatives
- 16.1 Growth and Market Entry Priorities
- 16.2 High-Return Products and Segments
- 16.3 Pricing, Profitability and Cost Optimization
- 16.4 Technology Investment and Product Differentiation
- 16.5 Supply Chain Localization and Resilience
- 16.6 Distribution and Customer Acquisition
- 16.7 Partnership, Acquisition and Capacity Strategy
- 16.8 Regional Expansion Priorities
- 16.9 Short-, Medium- and Long-Term Actions
Chapter 17 Competition Outlook
- 17.1 Industry Competition Characteristics
- 17.2 Market Structure and Concentration
- 17.3 Market Share and Competitive Positioning, 2025
- 17.4 Company-Wise Revenue and Product Benchmarking
- 17.5 Production and Service Capacity Benchmarking
- 17.6 Technology, Pricing and Differentiation
- 17.7 Regional Footprint and Distribution Strength
- 17.8 Mergers, Acquisitions and Strategic Alliances
- 17.9 New Entrants and Competitive Threats
- 17.10 Porter's Five Forces and Industry Attractiveness
- 17.11 Competitive Outlook, 2025-2035
Chapter 18 Company Profiles
- 18.1 Company Coverage and Selection Criteria
- 18.2 Cargill
- 18.2.1 Business Description
- 18.2.2 Company Ownership and Geographic Presence
- 18.2.3 Product and Service Portfolio
- 18.2.4 Manufacturing and Operating Footprint
- 18.2.5 Production Capacity and Expansion Plans
- 18.2.6 Financial Performance and Investment
- 18.2.7 Market Share and Competitive Position
- 18.2.8 Technology and Innovation Capabilities
- 18.2.9 Strategic Alliances or Partnerships
- 18.2.10 Recent Developments
- 18.2.11 Growth Strategy and Outlook
- 18.3 Tate & Lyle
- 18.4 Ingredion
- 18.5 ADM
- 18.6 Kerry Group
- 18.7 Other Relevant Market Participants
Note: Every listed company is profiled on the structure shown under the first company. The company list is preliminary and may change based on research findings, market developments, data availability and client requirements.
Chapter 19 Disclaimer
- 19.1 Research and Forecast Disclaimer
- 19.2 Data Source and Estimation Limitations
Note: The depth of individual sections depends on data availability for this market. Volume, capacity, trade and other unit-based metrics are included where applicable.

