
Zero-sugar colas move from niche cans to mass shelves
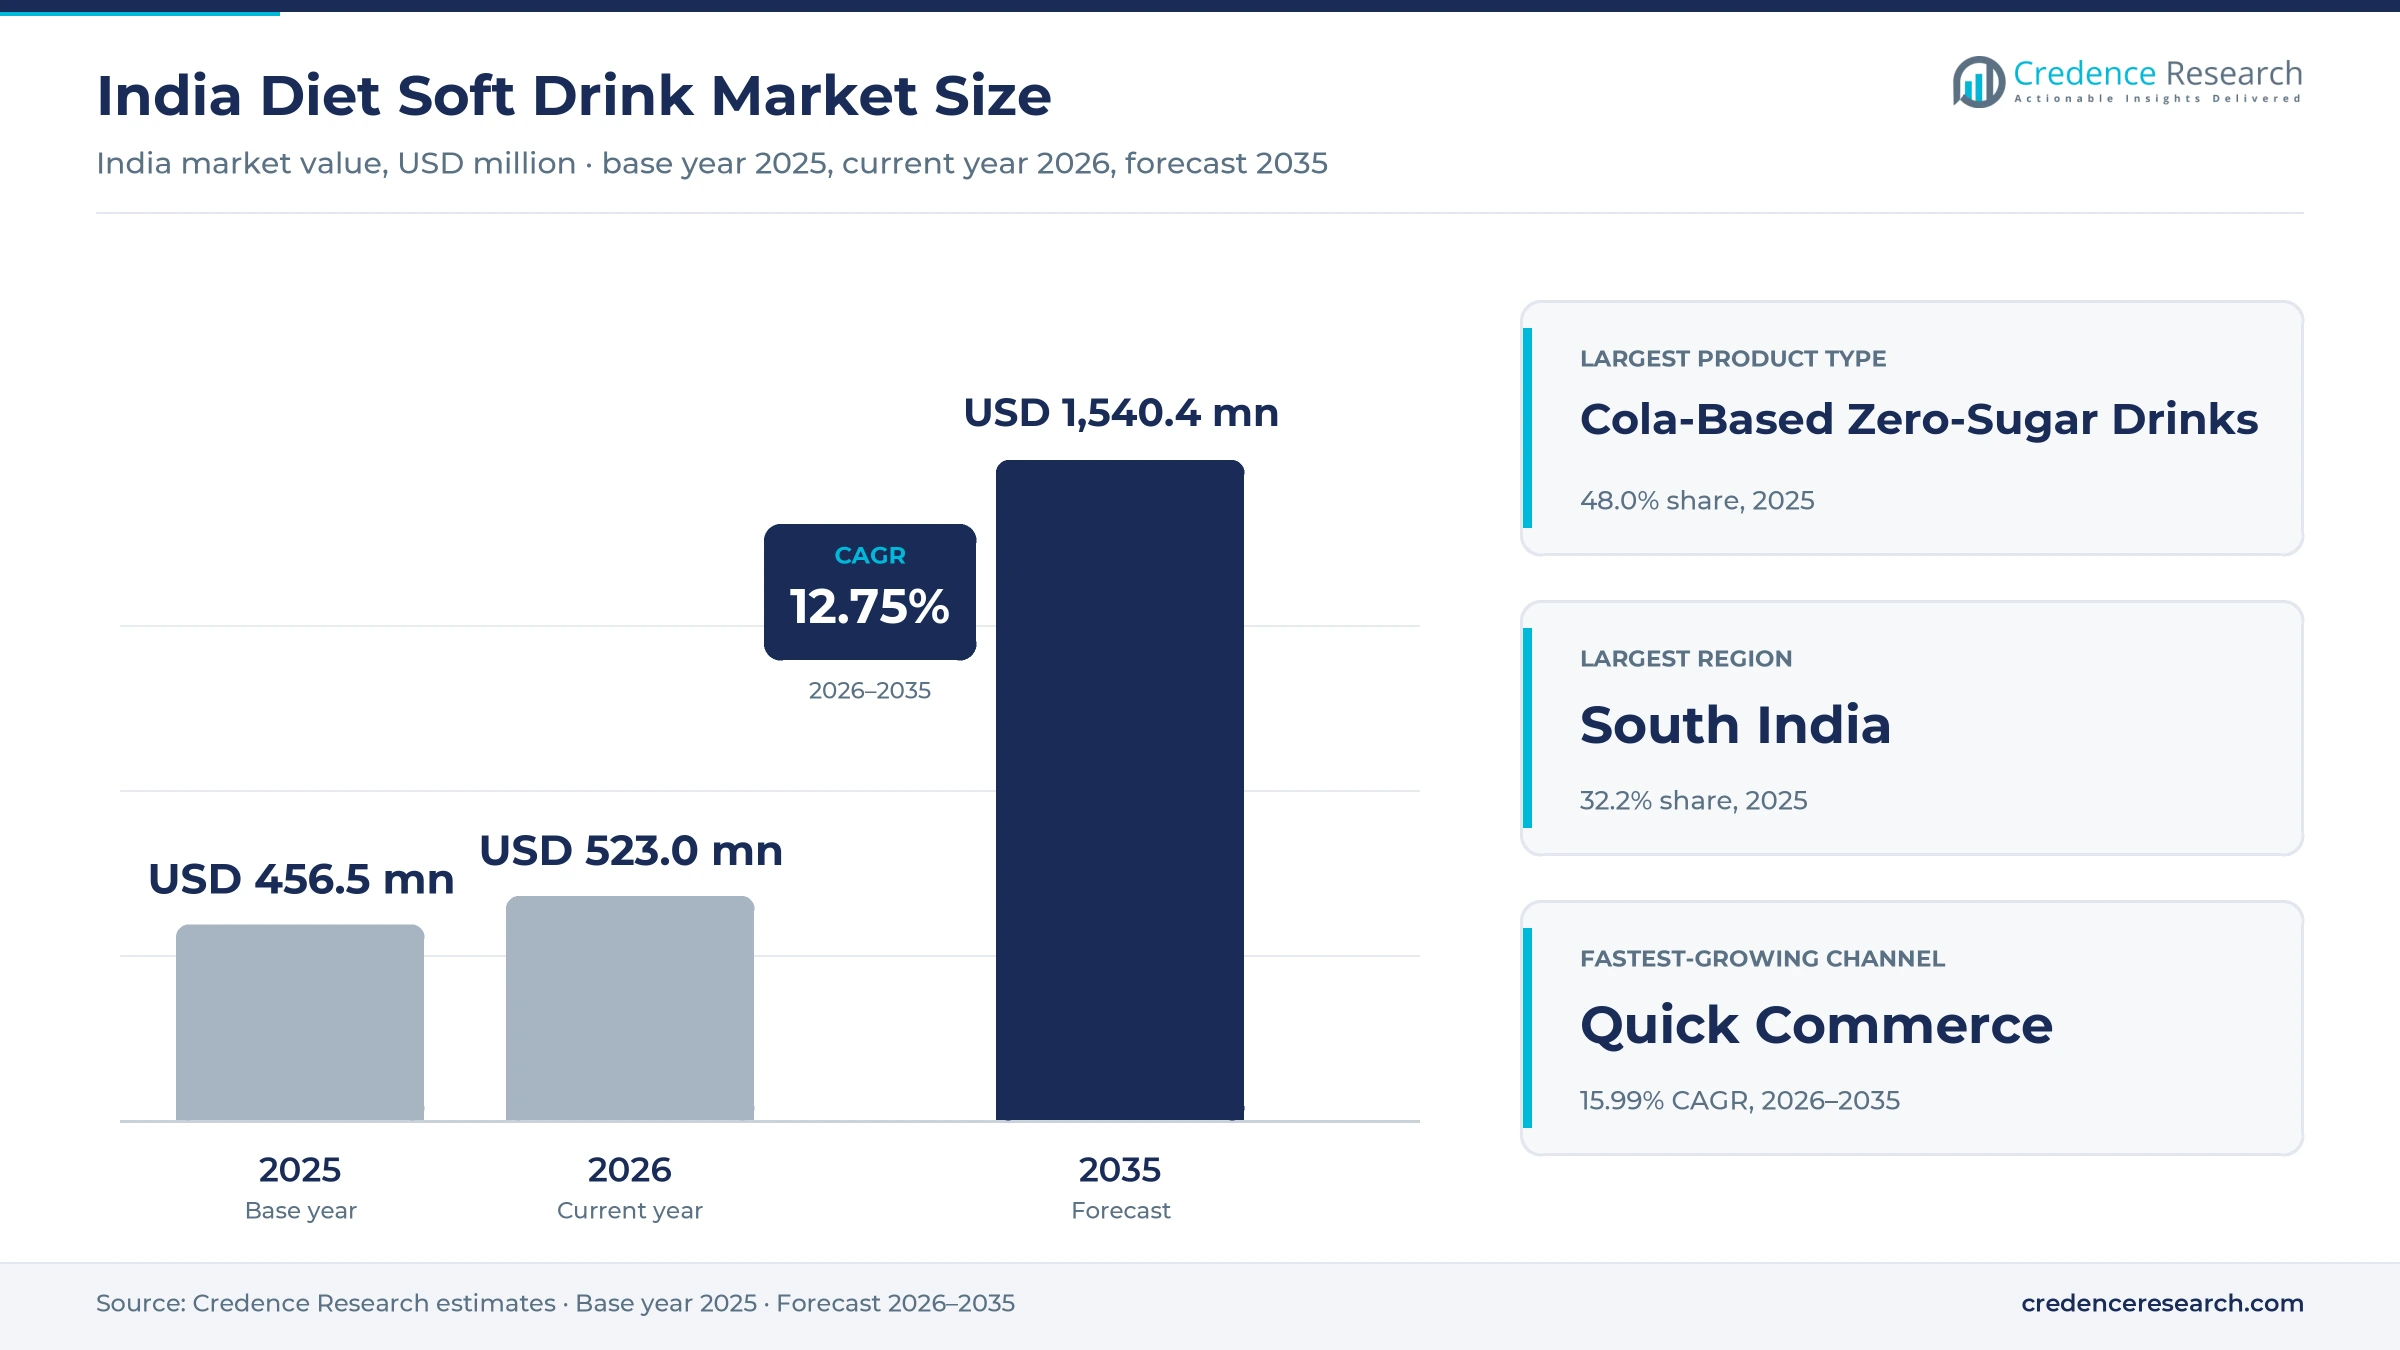
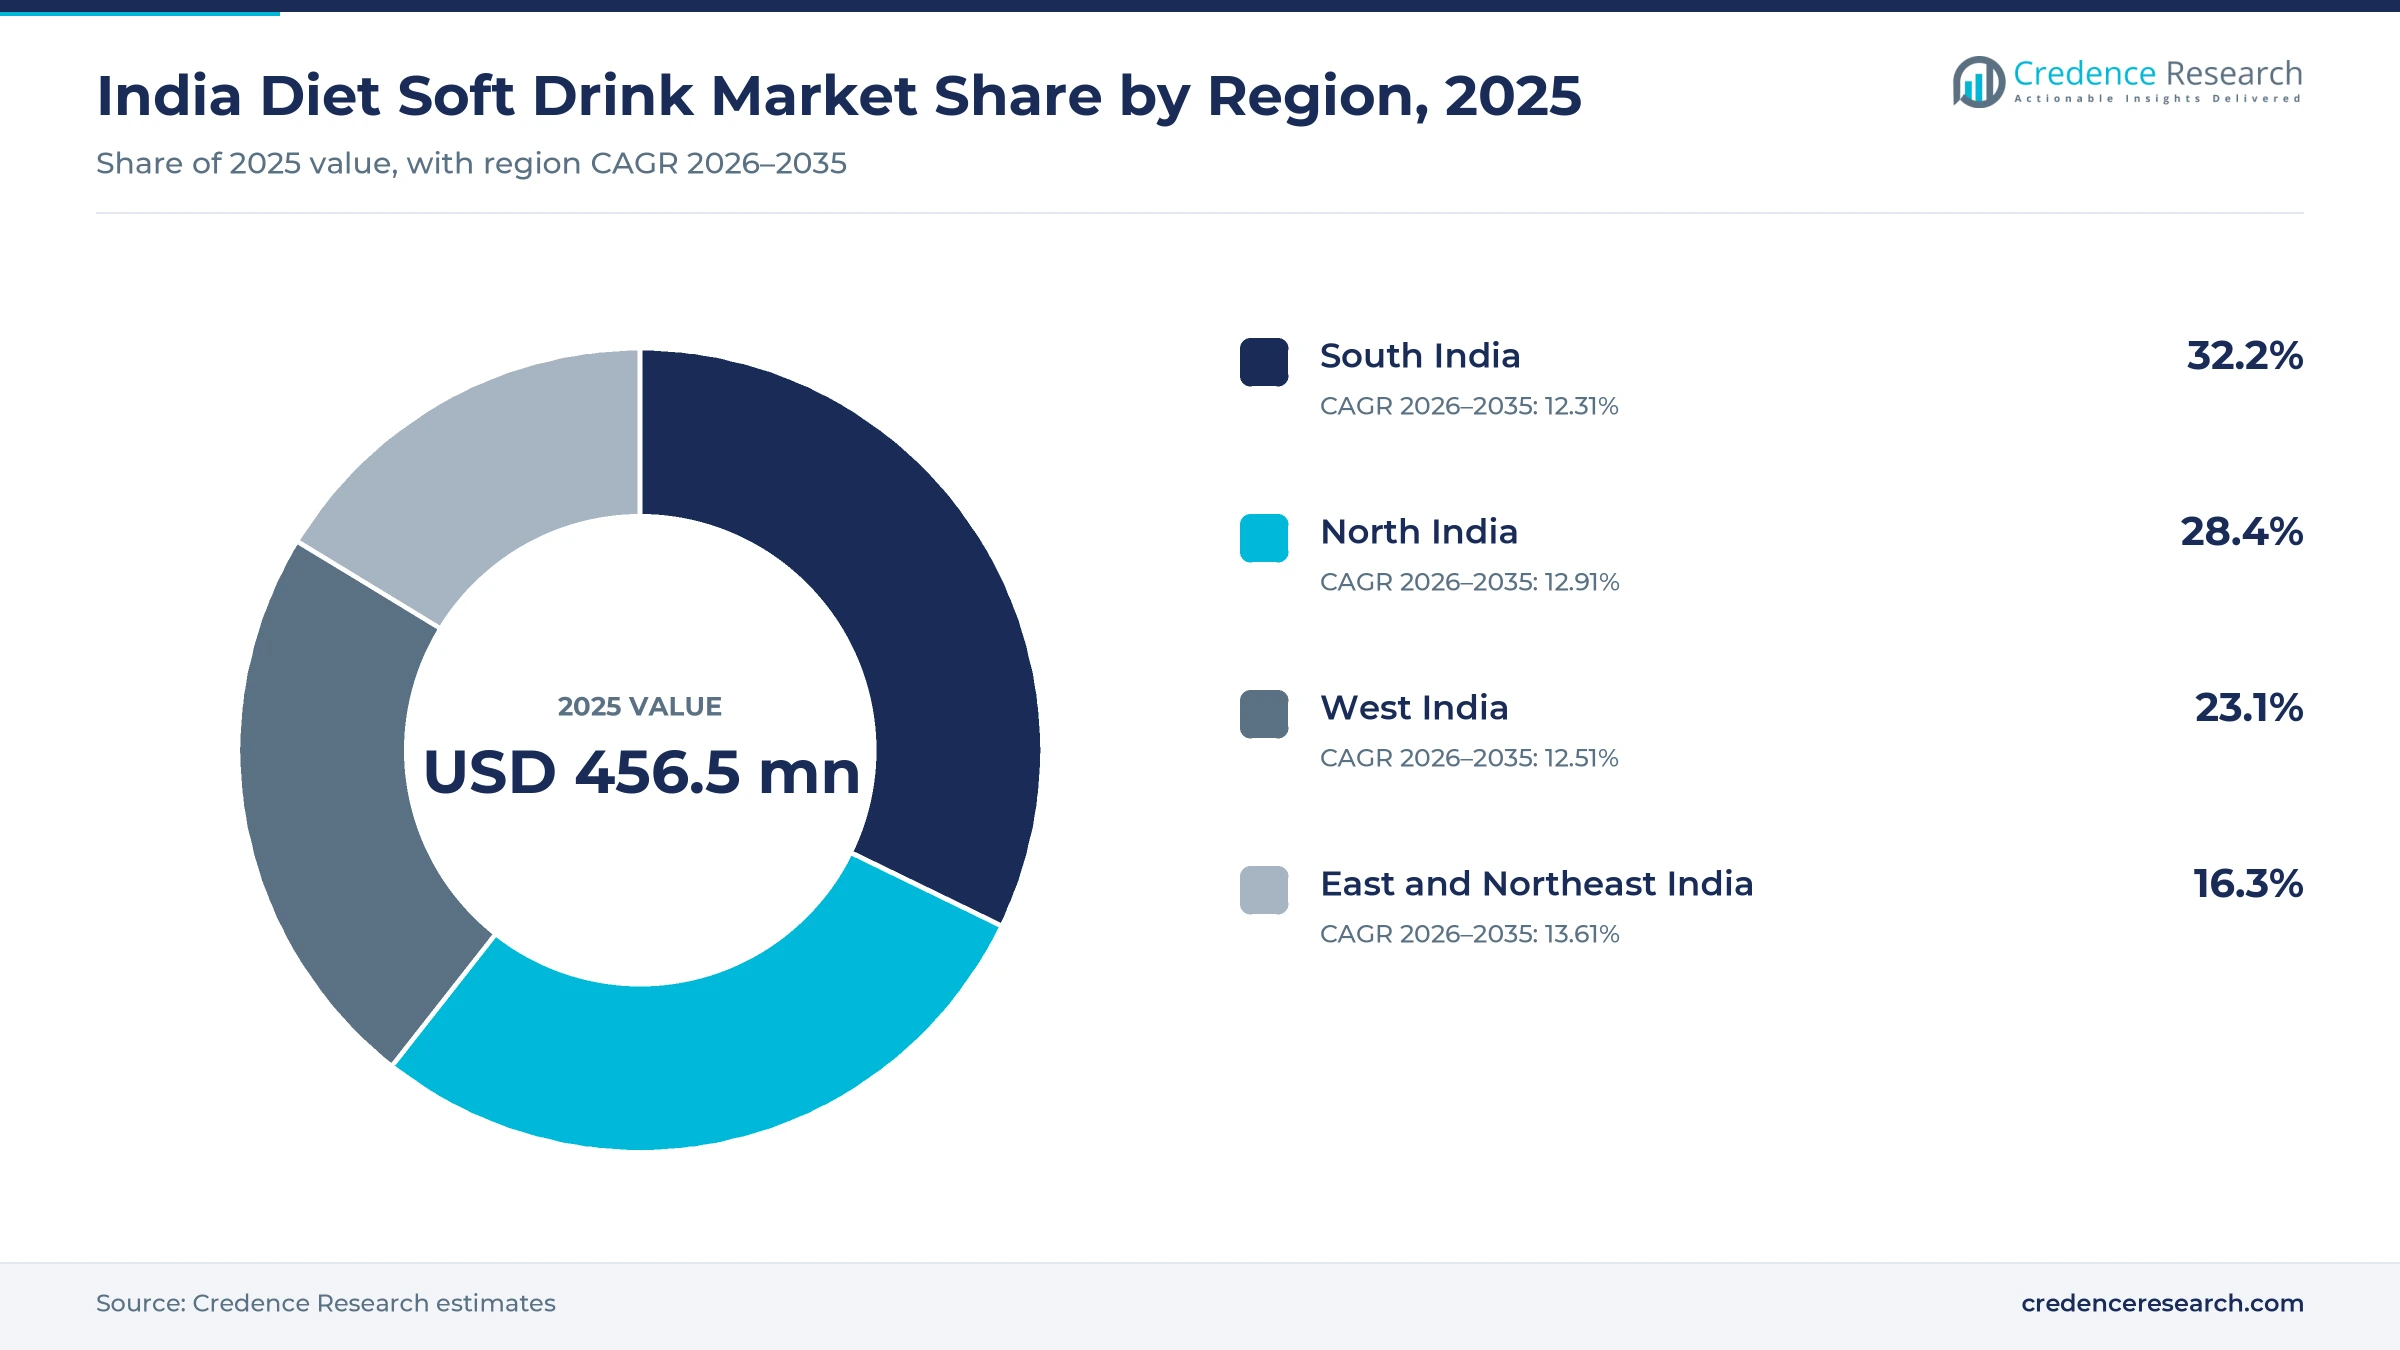
The India diet soft drink market was valued at USD 456.5 million in 2025 and is projected to increase from USD 523.0 million in 2026 to USD 1.54 billion by 2035, registering a CAGR of 12.75% during 2026–2035. Demand comes from urban adults, fitness-oriented buyers and diabetes-aware households that want the taste of cola, lemon-lime and fruit sodas without sugar, and from bars and restaurants that need low-calorie tonic and mixers. South India held the largest regional share, 32.2% in 2025, because Andhra Pradesh and Telangana are among the heaviest aerated drink markets in the country. East and Northeast India is the fastest-growing region at 13.61% a year, as new bottling plants and wider cold-chain reach bring zero-sugar packs to more towns. Pricing has also shifted, because Coca-Cola and PepsiCo priced zero-sugar bottles at Rs 10 in March 2025, which moved the category from premium cans toward mass neighborhood stores.
Which zero-sugar sodas and sales routes does the estimate cover?
The estimate measures the retail value of carbonated soft drinks sold in India with no sugar or very low calories, including zero-sugar colas, lemon-lime drinks, fruit-flavored diet sodas, low-calorie tonic and mixers and zero-sugar energy-style sodas. It covers sales to households, young professionals, fitness buyers and hospitality outlets through neighborhood stores, supermarkets, delivery apps, online marketplaces and foodservice.
The estimate excludes regular sugared sodas, reduced-sugar drinks that still carry added sugar, juices, bottled water and drinks exported out of the country. The value chain runs from concentrate and sweetener suppliers through bottlers, preform and can makers to distributors, retailers and delivery platforms that serve buyers.
India Diet Soft Drink Market Insights
- The India diet soft drink market was valued at USD 456.5 million in 2025 and is projected to reach USD 1.54 billion by 2035, registering a CAGR of 12.75% during 2026–2035.
- South India held a 32.2% share of 2025 value, because Andhra Pradesh and Telangana account for nearly a fifth of aerated drink sales.
- Cola-based zero-sugar drinks led with a 48.0% share of 2025 value, as Coke Zero, Diet Coke, Pepsi No Sugar and Thums Up XForce anchor shelves.
- Coca-Cola and PepsiCo launched zero-sugar bottles priced at Rs 10 in March 2025, the first time either sold diet drinks at that price in India.
- Varun Beverages said low sugar and no sugar products reached about 59% of its consolidated volume in the first quarter of 2025.
Cola variants lead while energy-style sodas grow fastest
Why do zero-sugar colas hold most of the value?
Based on product type, the market is categorized into cola-based zero-sugar drinks, lemon-lime zero-sugar drinks, fruit-flavored diet sodas, low-calorie tonic and mixers, and zero-sugar energy-style CSDs. Cola-Based Zero-Sugar Drinks led with a 48.0% share of 2025 value, because Diet Coke, Coke Zero, Pepsi No Sugar and Thums Up XForce carry the strongest brand recall. Zero-Sugar Energy-Style CSDs grow fastest at 14.66% a year, as sugar-free energy cans reach delivery apps.
How do Rs 10 packs and premium cans split value?
Based on price tier, the market is categorized into value, mainstream, premium and super-premium products. Mainstream products led with a 46.0% share of 2025 value, because standard bottles and cans from the cola majors dominate store coolers. Super-Premium products grow fastest at 14.05% a year, as craft tonic, prebiotic sodas and imported energy cans win urban buyers who pay more for natural sweeteners.
Why do neighborhood stores still sell most diet sodas?
Based on distribution channel, the market is categorized into general trade, modern trade, quick commerce, e-commerce marketplaces and foodservice and institutional channels. General Trade led with a 50.0% share of 2025 value, because kirana stores with chilled coolers reach almost every town. Quick Commerce grows fastest at 15.99% a year, as dark stores deliver chilled cans within minutes.
How are cans gaining on PET bottles?
Based on packaging format, the market is categorized into PET bottles, aluminum cans, returnable glass bottles and bag-in-box foodservice packs. PET Bottles led with a 52.0% share of 2025 value, because Rs 10 and 500 ml packs are bottled in PET. Aluminium Cans grow fastest at 13.47% a year, as younger buyers prefer chilled single-serve cans ordered online.
| Segment Group | Leading Sub-segment | Share, 2025 | Fastest-growing Sub-segment | CAGR, 2026–2035 |
|---|---|---|---|---|
| By Product Type | Cola-Based Zero-Sugar Drinks | 48.0% | Zero-Sugar Energy-Style CSDs | 14.66% |
| By Price Tier | Mainstream | 46.0% | Super-Premium | 14.05% |
| By Distribution Channel | General Trade | 50.0% | Quick Commerce | 15.99% |
| By Packaging Format | PET Bottles | 52.0% | Aluminium Cans | 13.47% |
Request a Free Sample
Fill in your details and we'll send you a free sample report.
- Sample data tables & charts
- Research methodology
Portfolio shifts, apps and Rs 10 packs widen access
How is the low- and no-sugar portfolio mix accelerating?
Bottlers now treat zero-sugar variants as part of the core range rather than niche cans, and they plan capacity and promotions around them. Varun Beverages, PepsiCo's bottler, said the mix of low sugar and no sugar products rose to about 59% of consolidated volume in the first quarter of 2025, according to its quarterly results release. Agro & Food Processing reported that low and no sugar drinks made up 44.4% of PepsiCo's India volume in 2024, up from 40.2% in 2023. The same publisher reported in February 2026 that Diet Coke sales doubled in 2025. As a result, cola-based zero-sugar drinks hold 48.0% of 2025 value.
Why does quick commerce widen access to chilled zero-sugar cans?
Dark stores run by delivery apps put a full shelf of diet sodas within minutes of urban homes, because they stock diet colas, tonics and energy drinks that small shops rarely carry. Blinkit ran 2,443 stores in June 2026, up from 1,544 a year earlier, and its net order value rose 86% to Rs 17,132 crore in that quarter, according to Business Today. Outlook Business reported that Zepto and Swiggy Instamart ran 1,139 and 1,143 dark stores at the end of fiscal 2026. Thums Up also let buyers pre-book XForce on Zepto in April 2025 before its national rollout. In turn, quick commerce grows at 15.99% a year during 2026–2035.
How do Rs 10 packs make familiar zero-sugar brands easier to buy?
Low entry prices bring first-time buyers into the category, because a Rs 10 bottle removes the price gap that once kept diet colas in premium cans. Coca-Cola launched Thums Up XForce, Coke Zero and Sprite Zero in 250 ml and 500 ml packs from Rs 10 in March 2025, while PepsiCo priced a 200 ml Pepsi No Sugar bottle at Rs 10, according to Agro & Food Processing. Reliance Consumer Products also added a Rs 10 diet version of Campa, The Ken reported, which put a low-price diet cola into the same coolers as sugared rivals. As a result, mainstream products hold 46.0% of 2025 value.
Why does India's diabetes burden lift demand for sugar-free sodas?
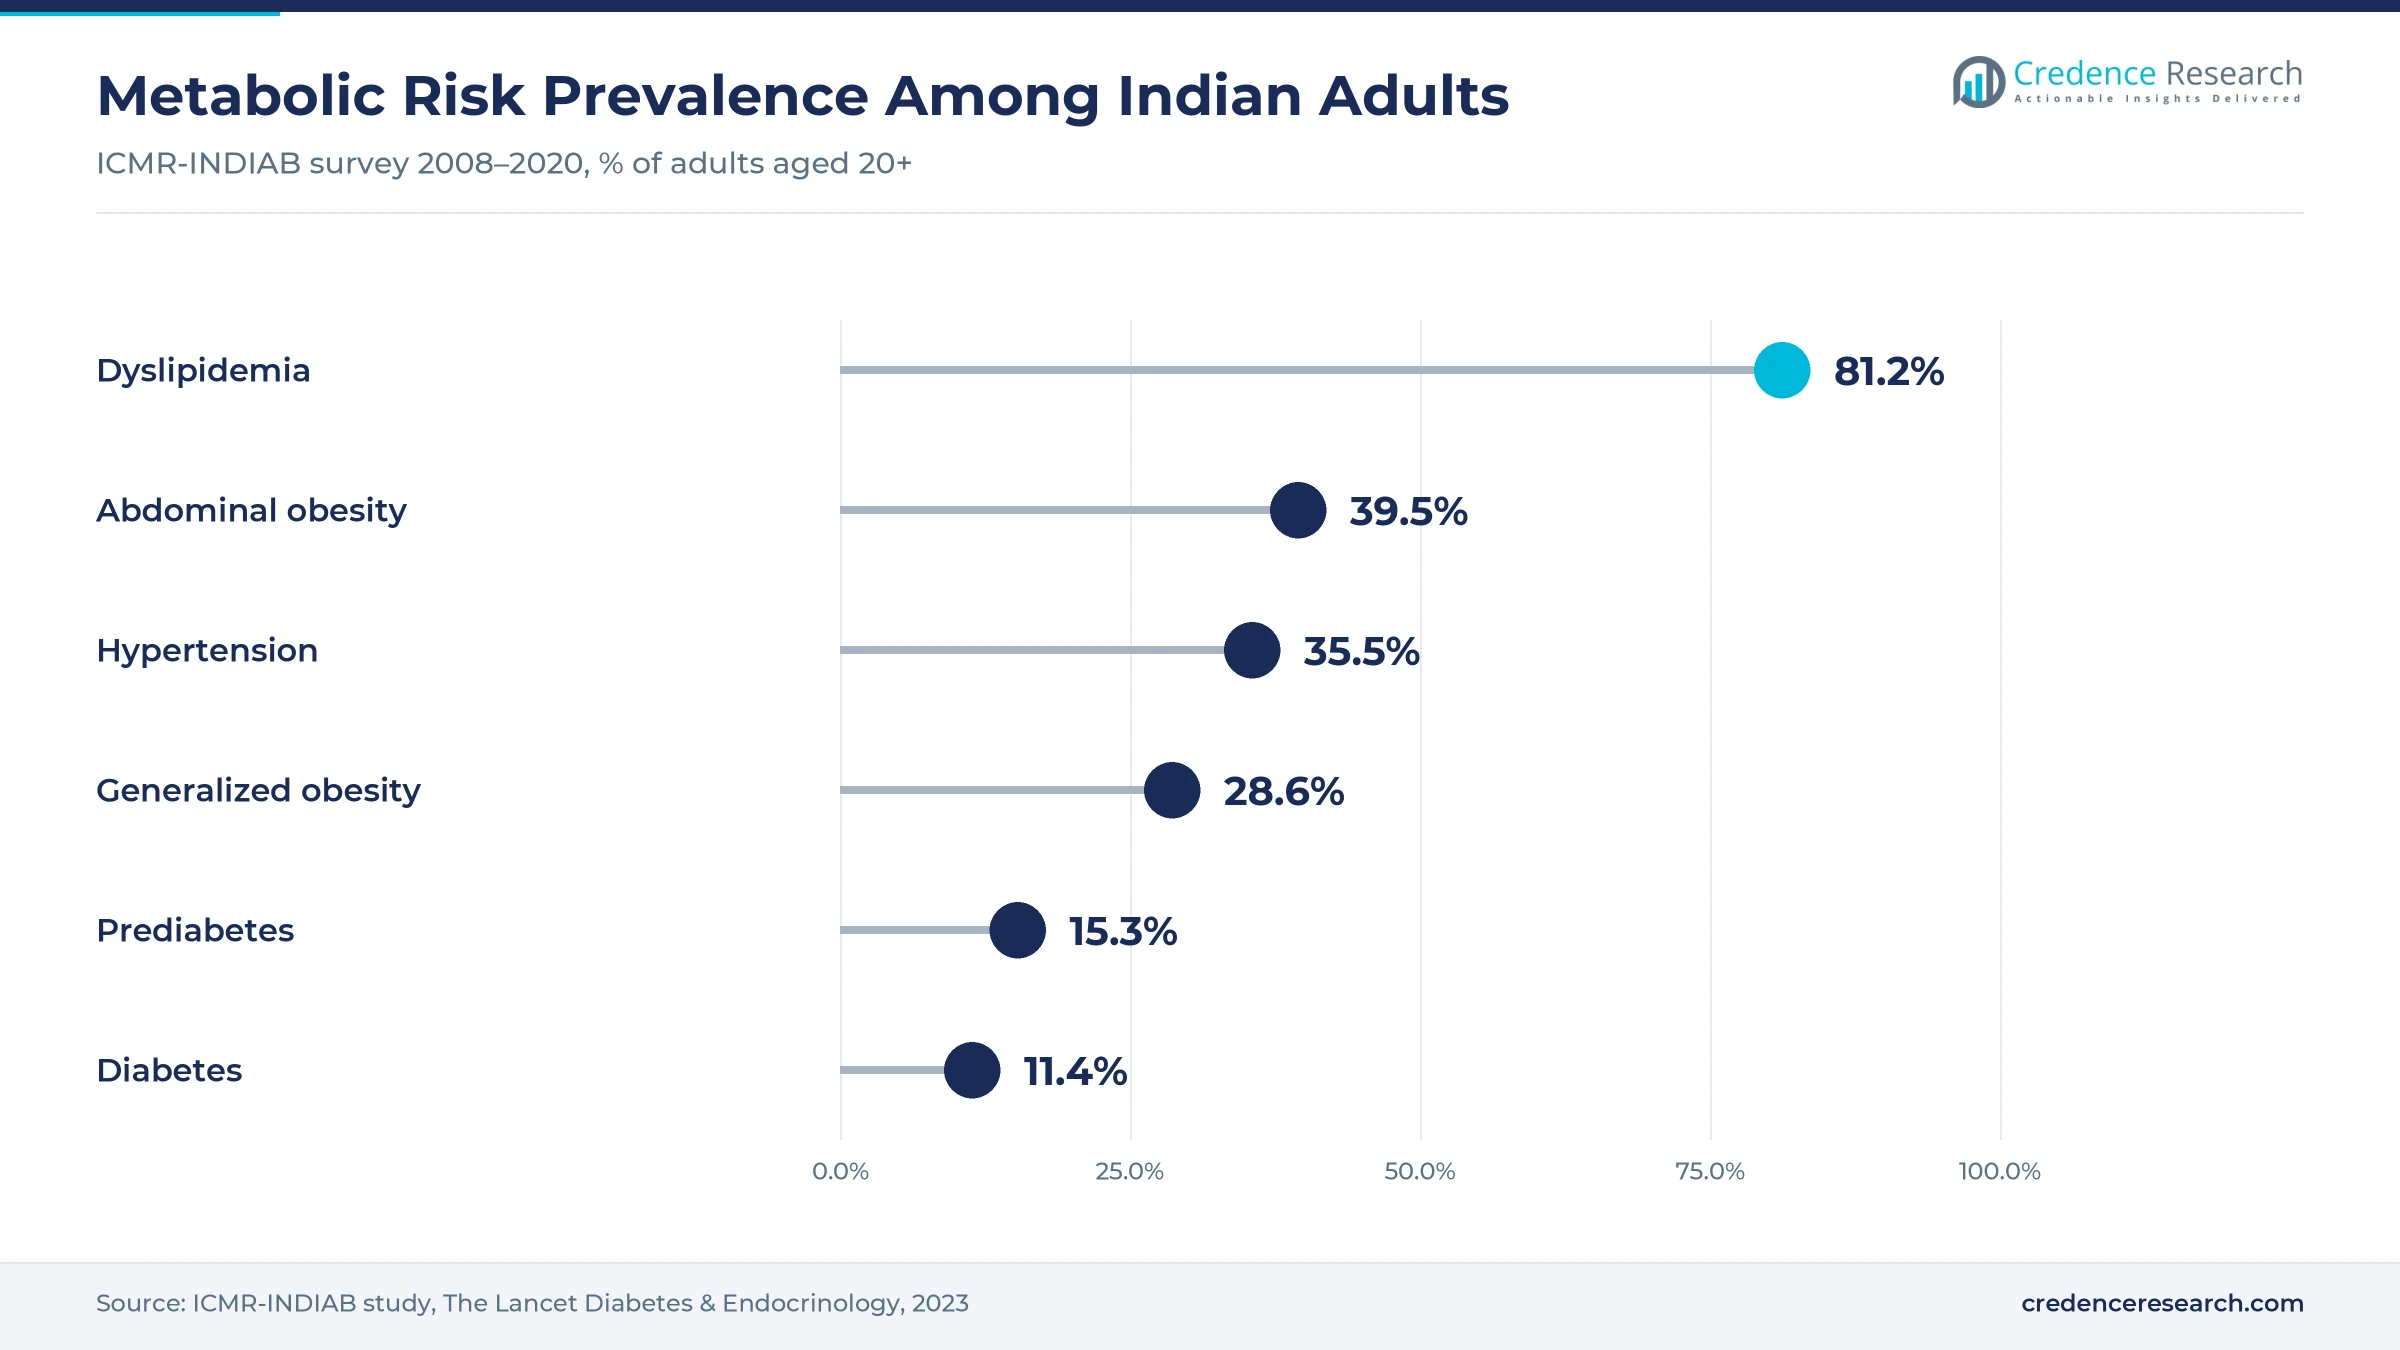
Metabolic health data explain much of the switch, because many households now limit added sugar while keeping familiar fizzy drinks at meals and gatherings. The ICMR-INDIAB study found a diabetes prevalence of 11.4% and a prediabetes prevalence of 15.3% among adults, according to its peer-reviewed national survey. The same survey of 113,043 adults found generalized obesity in 28.6% and abdominal obesity in 39.5% of participants. IANS reported that the study implies about 101 million Indians live with diabetes. In turn, diabetes-aware households and fitness buyers keep zero-sugar colas in their weekly baskets, which supports steady volume growth through 2026–2035.
Natural sweeteners and sugar-free energy reshape shelves
How is the rise of sugar-free energy-style sodas changing shelves?
Young buyers now want caffeine and strong taste in a can without the sugar of a classic energy drink, which is pulling new sugar-free formats onto shelves. HELL ENERGY launched Hell Zero White Peach in India in June 2026 as a Blinkit exclusive, according to Impact. Red Bull Sugar Free sells in a 250 ml can at Rs 125 on BigBasket, which places it at the top of the price ladder. Afaqs reported in May 2025 that a 250 ml Hell can costs Rs 60 against Rs 120 for Red Bull and Rs 20 for Sting. As a result, zero-sugar energy-style CSDs grow at 14.66% a year, the fastest of any product type in this market, and they now sit alongside other caffeinated beverage options.
Why are stevia and monk fruit gaining on synthetic sweeteners?
Ingredient lists matter more than before, because many buyers now question synthetic sweeteners and look for stevia or monk fruit on the label. CHINI KUM raised Rs 1 crore in February 2026 for zero-sugar prebiotic drinks sweetened with stevia and monk fruit, priced from Rs 30 for 160 ml, according to Entrackr. The brand debuted exclusively on Swiggy Instamart in select metro cities, the same report said. The World Health Organization advised in May 2023 against non-sugar sweeteners for weight control, though the conditional advice excludes people with pre-existing diabetes. In turn, demand grows for blends that replace artificial sweeteners, which helps super-premium products grow at 14.05% a year.
Can alcohol-free socializing open space for low-calorie mixers?
Bars, hotels and home hosts offer a clear opening for low-calorie tonic and mixers, because they now want premium drinks that suit guests who skip alcohol or sugar. Jade Forest raised US$1 million led by Mumbai Angels Network and sells reduced-sugar tonic water, ginger ale and club soda in 23 cities, according to The Drinks Business. Svami, a Mumbai maker, sold its light tonic water through about 600 points of sale in eight states in 2019, according to Entrepreneur India. Agro & Food Processing also linked alcohol-free gatherings to lower sugar intake in urban India. As a result, foodservice buyers and hospitality outlets add zero-sugar mixers to menus during 2026–2035.
Could sugar-based taxation become an opening for diet sodas?
A tax rate linked to sugar content could become an opening for diet sodas, because a lower rate for zero-sugar drinks would cut shelf prices against sugared colas. Soft drinks and carbonated fruit drinks no longer attract the 12% compensation cess under the GST changes effective Sept. 22, 2025, according to India Briefing. Storyboard18 reported in August 2025 that the Indian Beverage Association asked the Finance Ministry for a sugar-based tax model that separates low and no sugar variants. Moneylife reported in February 2026 that the Supreme Court pressed FSSAI on front-of-pack warnings for foods high in sugar. In turn, value products could grow faster if the tax gap opens.
High tax, thin margins and sweetener doubts weigh on growth
How does equal GST treatment hold back zero-sugar pricing?
Equal GST treatment is a key barrier to lower shelf prices, because diet sodas pay the same rate as fully sugared colas under the current system. As a result, bottlers cannot pass a tax benefit to health-conscious buyers who would trade across from regular drinks, which limits conversion in price-sensitive towns. Producers respond with smaller Rs 10 packs, combo offers and lobbying through the Indian Beverage Association for a sugar-based tax model that rewards lower sugar.
Why do Rs 10 price points squeeze bottler margins?
Thin unit economics are a real risk for bottlers, because sweeteners, preforms, caps, transport and chilling costs barely fit inside a Rs 10 shelf price. This pressure grows when input costs rise during peak summer months. Agro & Food Processing reported that the Rs 10 price point is not highly profitable for the cola majors. Producers respond with promotions on larger packs, local bottling plants and lighter bottles that cut material and freight costs per case.
How do sweetener doubts affect repeat purchase?
Consumer doubts are a barrier to repeat purchase, because some buyers worry about the long-term health effects of aspartame, sucralose and acesulfame K, and social media posts amplify these concerns. As a result, a share of urban buyers drink diet sodas only occasionally or move to fresh lime soda and coconut water. Producers respond with stevia and monk fruit blends, clear labels and smaller cans that suit moderate intake.
Why do weather swings and cold-chain gaps hurt volumes?
Seasonality is a constant risk for soda makers, because demand peaks in hot months and needs chilled coolers in small towns where cooler density remains low. Varun Beverages said heavy rainfall disrupted its India volumes during parts of 2025, which shows how exposed the category remains to weather. Producers respond with new regional plants, more visi-coolers at kirana stores and delivery app promotions that keep sales steady through monsoon months.
South India leads as the east posts the fastest growth
| Region | Value, 2025 (USD million) | Share, 2025 | CAGR, 2026–2035 |
|---|---|---|---|
| South India | 147.0 | 32.2% | 12.31% |
| North India | 129.6 | 28.4% | 12.91% |
| West India | 105.5 | 23.1% | 12.51% |
| East and Northeast India | 74.4 | 16.3% | 13.61% |
Why does South India lead zero-sugar soda demand?
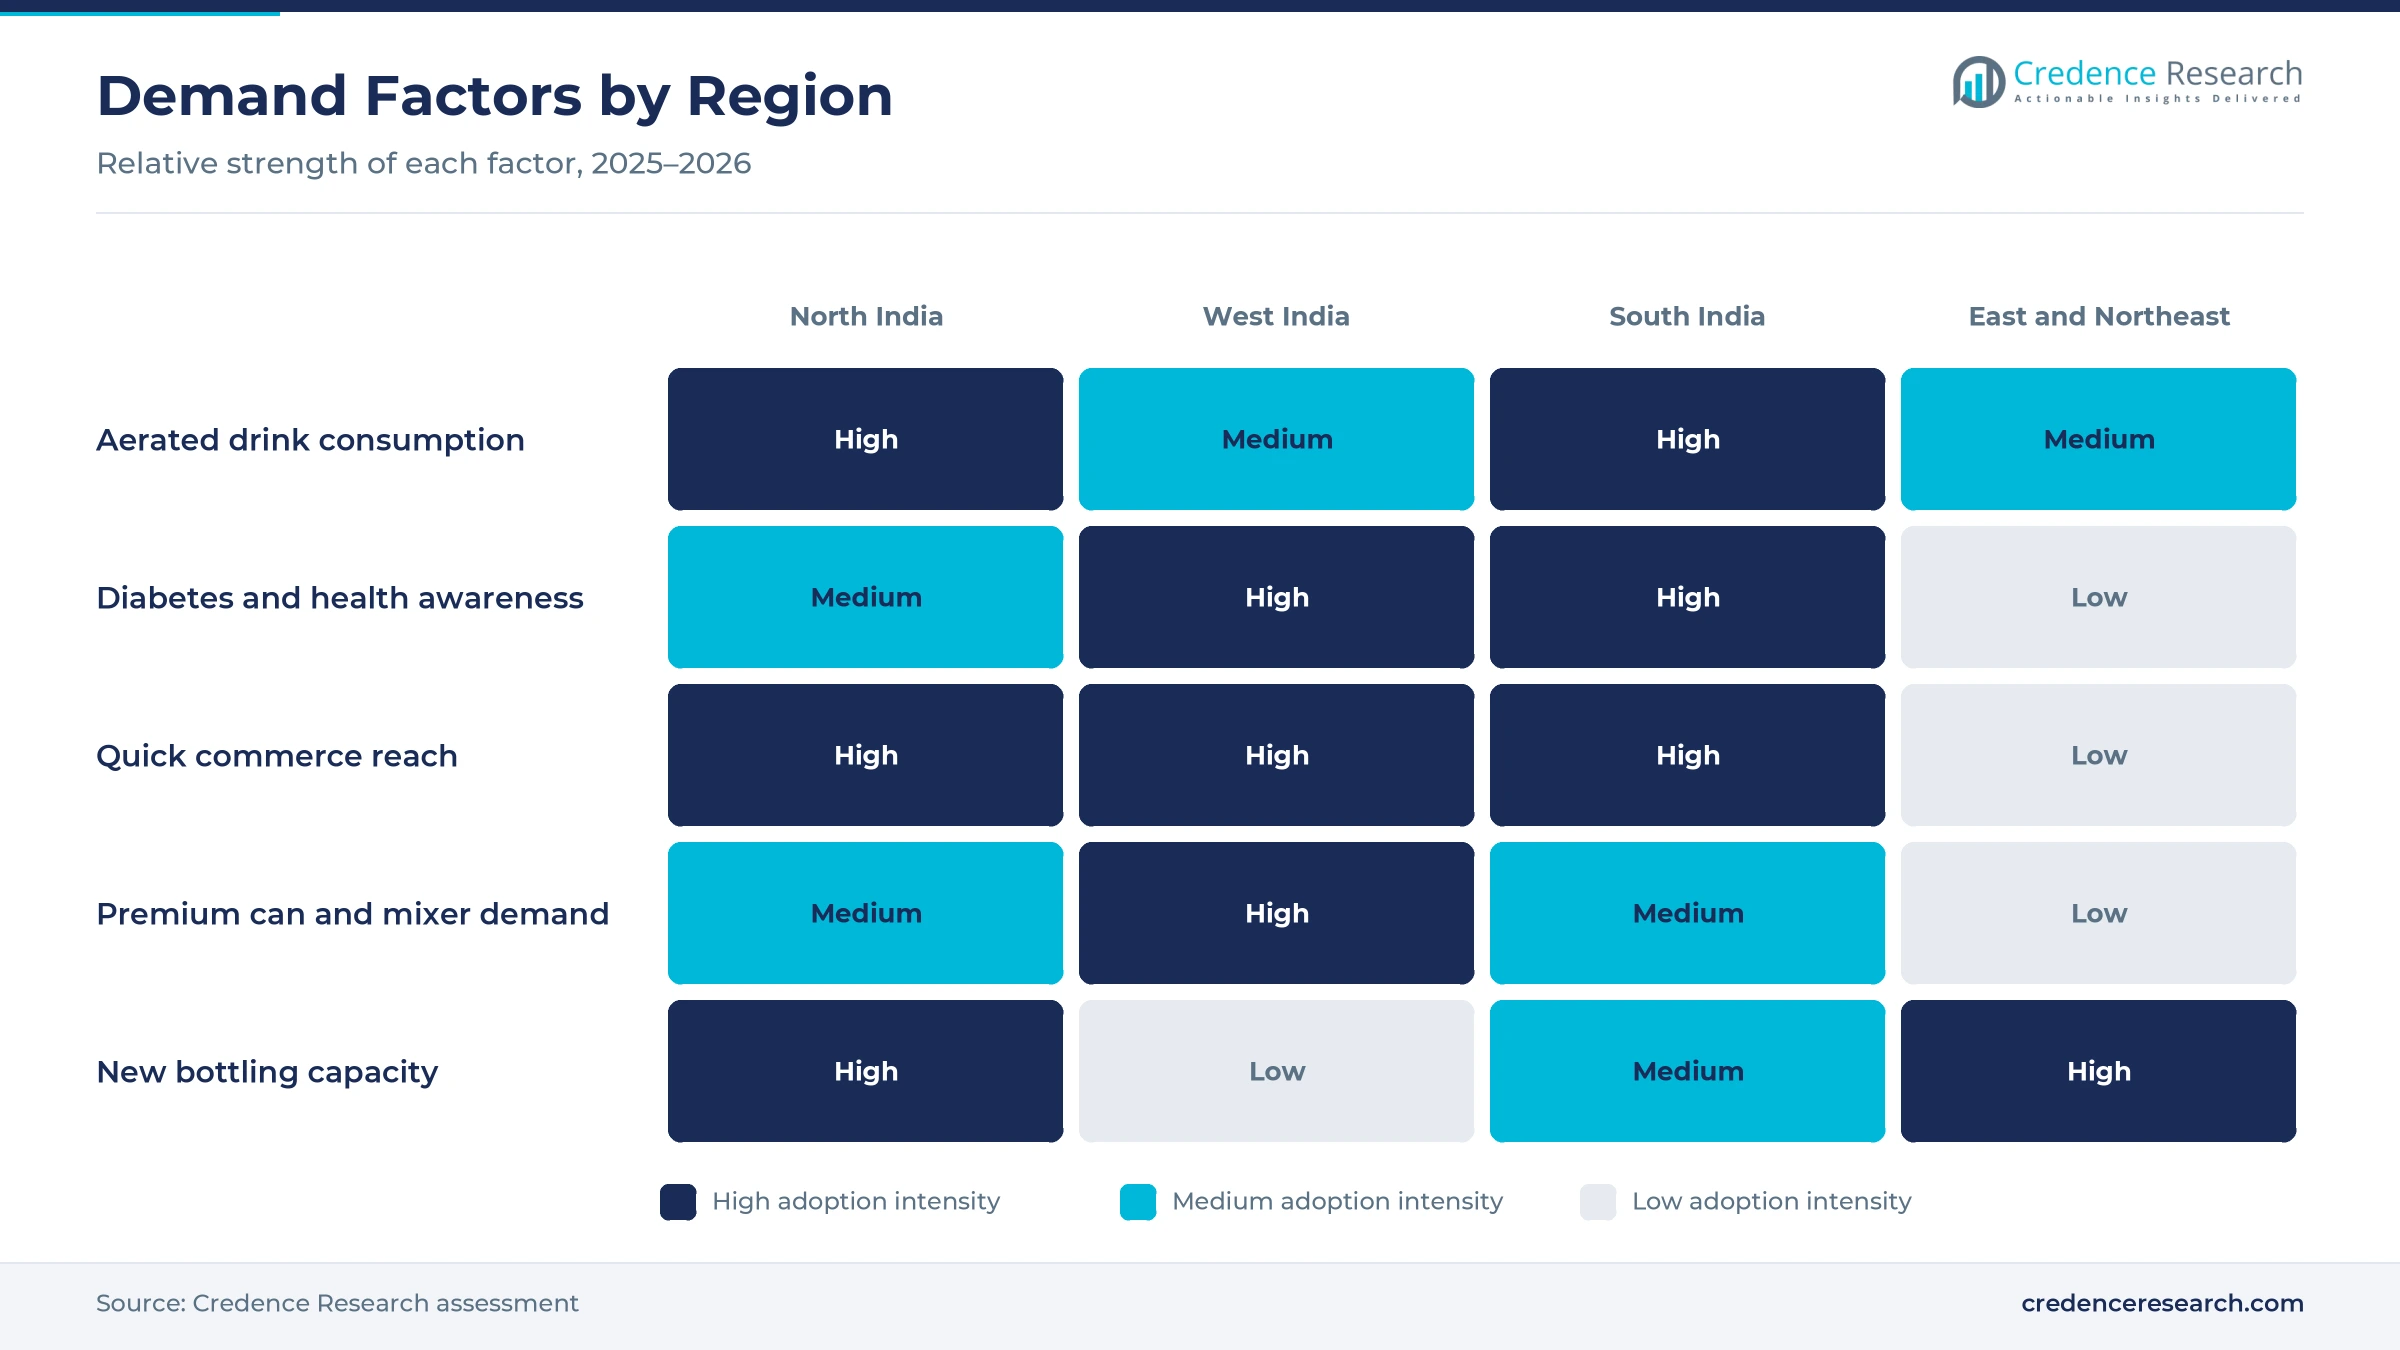
South India held a 32.2% share of 2025 value and grows at 12.31% a year, because Andhra Pradesh and Telangana together account for nearly 20% of aerated drink sales, Agro & Food Processing reported. PepsiCo launched its Rs 10 Pepsi No Sugar bottle first in Andhra Pradesh in March 2025. Kerala, Tamil Nadu, Puducherry and Karnataka also report diabetes prevalence above 10%. As a result, South India remains the largest regional market for diet colas.
How does North India turn new plants into wider reach?
North India held a 28.4% share of 2025 value and grows at 12.91% a year, because Delhi, Punjab and the large Uttar Pradesh market add new buyers each summer. Varun Beverages opened greenfield plants at Prayagraj in Uttar Pradesh and Damtal in Himachal Pradesh for the 2025 season. Uttar Pradesh still reports diabetes prevalence of about 4.8%, the lowest in the country, which leaves room for first-time diet buyers. In turn, the region gains volume through value packs sold in kirana stores.
Why does West India favor premium cans and mixers?
West India held a 23.1% share of 2025 value and grows at 12.51% a year, because Mumbai, Pune and Goa have dense café, bar and modern trade networks. Goa recorded the highest diabetes prevalence in the ICMR-INDIAB study at 26.4%, which supports interest in sugar-free drinks. Svami makes its tonic waters at a factory near Mumbai for hospitality buyers. As a result, West India leads in premium cans and low-calorie mixers.
How fast is East and Northeast India growing?
East and Northeast India held a 16.3% share of 2025 value and grows fastest at 13.61% a year, because new plants and coolers are reaching more towns. Varun Beverages added greenfield plants at Buxar in Bihar and Mendipathar in Meghalaya for the 2025 season, and it reported 10.5% domestic volume growth in the last quarter of 2025. In turn, Rs 10 diet bottles now reach buyers who previously saw only sugared colas.
Zero-sugar launches, tax reform and funding since 2025
| Development | Status and market relevance |
|---|---|
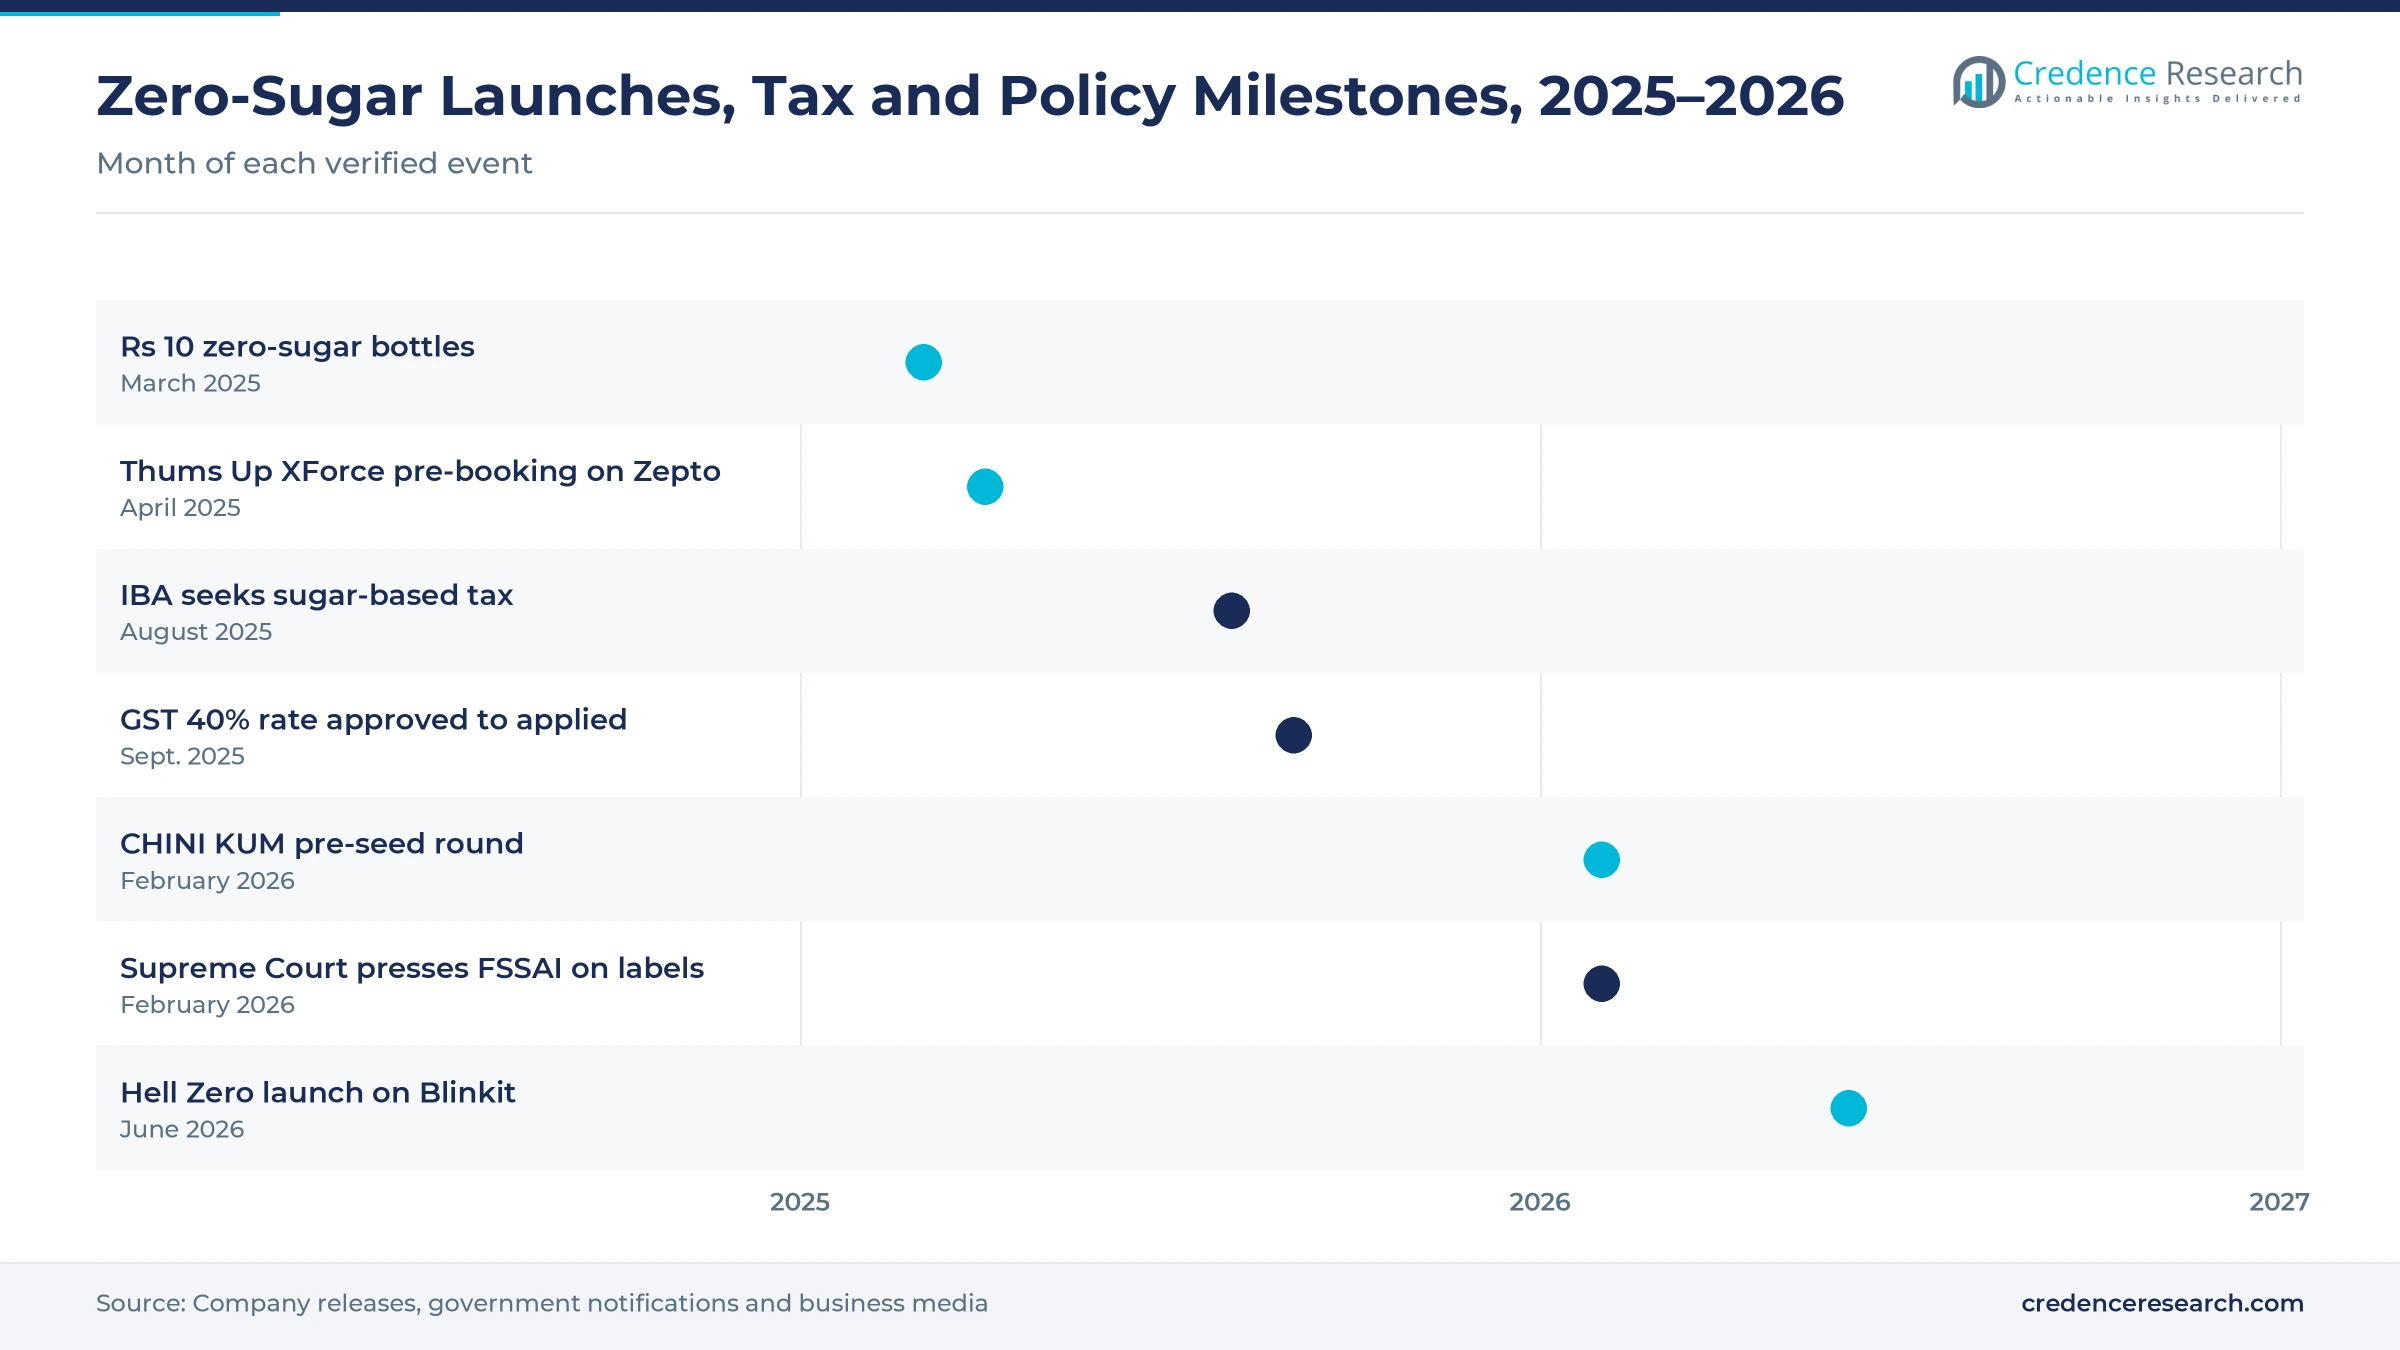
| In March 2025, Coca-Cola and PepsiCo launched zero-sugar bottles priced at Rs 10, including Thums Up XForce, Coke Zero, Sprite Zero and Pepsi No Sugar. | Brings diet colas to mass price points |
| In April 2025, Thums Up and Zepto opened a pre-booking feature for Thums Up XForce ahead of its nationwide rollout. | Uses quick commerce to seed a zero-sugar launch |
| In September 2025, GST changes effective Sept. 22, 2025, removed the 12% compensation cess on soft drinks and carbonated fruit drinks. | Keeps diet and sugared sodas under the same tax treatment |
| In February 2026, CHINI KUM raised Rs 1 crore in a pre-seed round for zero-sugar prebiotic drinks sweetened with stevia and monk fruit. | Funds a natural-sweetener challenger brand |
| In June 2026, HELL ENERGY launched Hell Zero White Peach in India as a Blinkit exclusive. | Adds a sugar-free energy option on quick commerce |
Sweetener systems and lighter packs lift zero-sugar quality
- Blended sweetener systems combine sucralose, acesulfame K, stevia or monk fruit to copy the mouthfeel of sugar, which reduces the aftertaste that once put buyers off diet colas.
- Lightweight PET preforms cut the plastic in each Rs 10 and 500 ml bottle, which lowers material and freight costs for low-price packs.
- High-speed can lines fill chilled single-serve cans for delivery apps and modern trade, which suits younger buyers who prefer cans.
- Cooler and demand analytics link visi-cooler placement and delivery app orders to bottling plans, which reduces stock-outs in hot months.
Need a Custom Version of This Report?
Tailor the scope, geography, or segments to your exact requirements.
- Custom geography or segment scope
- Direct access to our analyst team
Cola majors, Campa and niche brands fight on price and taste
Competition is led by the two cola majors, alongside Reliance Consumer Products, global energy brands and niche makers of tonic and natural-sweetener sodas. Coca-Cola India competes with Diet Coke, Coke Zero, Sprite Zero and Thums Up XForce, and priced zero-sugar bottles from Rs 10 in March 2025. PepsiCo competes through Pepsi No Sugar, Pepsi Black and 7Up No Sugar, bottled by Varun Beverages. Reliance Consumer Products competes on price with Campa and a Rs 10 diet version. ET Retail reported that the combined share of Coca-Cola and PepsiCo in soft drinks fell to about 85% from 93% in January to September 2025, as Campa and other brands gained. Red Bull and HELL ENERGY compete in sugar-free energy cans, while Jade Forest, Svami and CHINI KUM target premium mixers and natural sweeteners. Rivals compete on taste, price packs, cooler reach and delivery app visibility, and brands with deep kirana coverage usually win repeat buyers.
Which brands shape Indian zero-sugar soda shelves?
| Company | Type | Role in the market |
|---|---|---|
| Coca-Cola India | Cola major | Sells Diet Coke, Coke Zero, Sprite Zero and Thums Up XForce from Rs 10 |
| PepsiCo India | Cola major | Sells Pepsi No Sugar in a Rs 10 bottle through Varun Beverages |
| Reliance Consumer Products | Challenger brand owner | Added a Rs 10 diet version of Campa |
| Red Bull | Energy drink brand | Sells Red Bull Sugar Free in 250 ml cans |
| HELL ENERGY | Energy drink brand | Launched Hell Zero White Peach in June 2026 |
| Jade Forest | Premium mixer maker | Sells reduced-sugar tonic water in 23 cities |
| CHINI KUM | Natural-sweetener startup | Raised Rs 1 crore in February 2026 |
Credence Research view on Indian zero-sugar sodas
Credence Research's view is that the Indian diet soda market will grow mainly through price access and portfolio conversion rather than new drinking habits, because buyers already drink cola and lemon-lime sodas and are now switching to zero-sugar versions of the same brands. Cola-based drinks remain the largest value pool, while energy-style sodas, super-premium mixers, quick commerce and cans add the fastest growth. A sugar-based tax model would speed this shift, while sweetener doubts and thin Rs 10 margins could slow it for some brands.
How the national zero-sugar soda estimate was built
The report uses 2025 as the base year on a calendar basis, and market values come from the Credence Research model. That model combines national health survey data, tax rate changes, bottler disclosures, quick commerce operating data and company releases reported in trade media. Regional shares are Credence Research estimates built from state consumption and plant data, while segment splits and growth rates are Credence Research estimates. Sources used are peer-reviewed studies, World Health Organization guidance, company filings and trade and business media, and no interviews or surveys were used.
Affordable zero-sugar packs carry growth to 2035
The India diet soft drink market is expected to reach USD 1.54 billion by 2035, a 12.75% CAGR during 2026–2035, as zero-sugar colas reach more kirana coolers and delivery apps. Growth should be strongest in energy-style sodas, super-premium mixers, aluminum cans and East and Northeast India, because these areas gain most from new plants, new launches and quick commerce. A move to sugar-based taxation would help prices, while thin margins on Rs 10 packs and sweetener doubts could slow some brands.
Frequently Asked Questions
How big is the India diet soft drink market?
Which product type leads Indian zero-sugar soda value?
Which region leads the market?
How did the Rs 10 launches change the category?
How are diet soft drinks taxed in India?
Which sales channel is growing fastest?
Who are the leading companies in the market?
What are the main challenges for diet soda makers in India?
Table of Content
Chapter 1 Market Segmentation
- 1.1 Segmentation Framework
- 1.1.1 Product and Service Classification
- 1.1.2 Application and End-Use Classification
- 1.1.3 Technology and Solution Classification
- 1.1.4 Customer and Distribution Channel Classification
- 1.1.5 Geographic Segmentation
- 1.1.6 Market Segment Definitions and Boundaries
- 1.2 By Product Type
- 1.2.1 Cola-Based Zero-Sugar Drinks
- 1.2.2 Lemon-Lime Zero-Sugar Drinks
- 1.2.3 Fruit-Flavoured Diet Sodas
- 1.2.4 Low-Calorie Tonic and Mixers
- 1.2.5 Zero-Sugar Energy-Style CSDs
- 1.3 By Price Tier
- 1.3.1 Value
- 1.3.2 Mainstream
- 1.3.3 Premium
- 1.3.4 Super-Premium
- 1.4 By Packaging Format
- 1.4.1 PET Bottles
- 1.4.2 Aluminium Cans
- 1.4.3 Returnable Glass Bottles
- 1.4.4 Bag-in-Box Foodservice Packs
Chapter 2 Introduction
- 2.1 Report Objectives and Scope
- 2.2 Product Definition and Industry Terminology
- 2.3 Market Inclusions and Exclusions
- 2.4 Research Process
- 2.4.1 Primary Research and Expert Interviews
- 2.4.2 Secondary Research and Source Review
- 2.4.3 Top-Down and Bottom-Up Estimation
- 2.4.4 Data Triangulation and Verification
- 2.5 Market Size Measurement Basis
- 2.5.1 2025: USD 456.5 million → 2035: USD 1.54 billion
- 2.6 Historical and Forecast Reference Periods
- 2.6.1 Historical Period: 2018-2025
- 2.6.2 Base Year: 2025
- 2.6.3 Forecast Period: 2025-2035
- 2.7 Research Assumptions and Limitations
Chapter 3 Executive Summary
- 3.1 Market Snapshot and Key Findings
- 3.2 Base-Year Market Size, 2025
- 3.3 Forecast Market Size, 2035
- 3.4 Revenue and Volume Growth Outlook
- 3.5 Key Demand and Supply Indicators
- 3.6 Leading Market Segments
- 3.7 Fastest-Growing Market Opportunities
- 3.8 Regional Performance Highlights
- 3.9 Technology and Industry Transformation
- 3.10 Competitive Landscape Summary
- 3.11 Analyst View and Strategic Implications
Chapter 4 India Diet Soft Drink Market Trends and Developments
- 4.1 Historical Industry Development, 2018-2025
- 4.2 Recent Market Trends and Developments
- 4.3 Demand and Customer Behavior Trends
- 4.4 Technology and Product Innovation
- 4.5 Artificial Intelligence, Automation and Digitalization
- 4.6 Local Manufacturing and Supply Chain Realignment
- 4.7 Industry Partnerships, Mergers and Acquisitions
- 4.8 Sustainability and Circular Economy Developments
- 4.9 Government and Private Sector Investment Trends
- 4.10 Emerging Business Models and Commercialization
- 4.11 Industry Developments and Announcements
Chapter 5 India Diet Soft Drink Market Production, Supply and Demand Analysis
- 5.1 Demand Trend and Consumption Analysis, 2018-2025
- 5.2 Demand Forecast, 2025-2035
- 5.3 Production and Output Trend, 2018-2025
- 5.4 Production and Output Forecast, 2025-2035
- 5.5 Installed Capacity and Capacity Utilization
- 5.6 Company-Wise Production Plants and Statistics
- 5.6.1 Installed Production Capacity
- 5.6.2 Actual Production
- 5.6.3 Planned Capacity and Expansion Targets
- 5.7 Supply Chain Structure and Procurement Trends
- 5.8 Supply-Demand Gap and Bottlenecks
- 5.9 Import Dependence and Sourcing Structure
- 5.10 Contract Manufacturing and Outsourcing
- 5.11 Regional Supply and Demand Concentration
Chapter 6 India Diet Soft Drink Market Pricing Analysis
- 6.1 Pricing Structure and Measurement
- 6.2 Historical Pricing Trends, 2018-2025
- 6.3 Pricing Outlook, 2025-2035
- 6.4 Average Selling Price and Unit Economics
- 6.5 Pricing by Product and Market Segment
- 6.6 Geographic Pricing Differences
- 6.7 Key Input, Energy, Labor and Logistics Costs
- 6.8 Contract Pricing and Purchasing Models
- 6.9 Pricing Sensitivity and Competitive Positioning
- 6.10 Price, Margin and Profitability Implications
Chapter 7 India Diet Soft Drink Market Dynamics
- 7.1 Market Growth Drivers
- 7.1.1 Demand-Side Drivers
- 7.1.2 Technology and Innovation Drivers
- 7.1.3 Infrastructure and Investment Drivers
- 7.1.4 Regulatory and Policy Drivers
- 7.2 Market Restraints
- 7.2.1 Cost and Affordability Constraints
- 7.2.2 Technology and Adoption Barriers
- 7.2.3 Supply Chain and Operational Constraints
- 7.3 Market Challenges
- 7.3.1 Competitive Pressure and Margin Erosion
- 7.3.2 Skills, Infrastructure and Implementation Gaps
- 7.4 Emerging Market Opportunities
- 7.5 Market Dynamics Impact and Time-Horizon Assessment
Chapter 8 India Diet Soft Drink Value Chain Analysis
- 8.1 Industry Value Chain Overview
- 8.2 Upstream Suppliers and Critical Inputs
- 8.3 Technology and Component Providers
- 8.4 Manufacturing or Service Delivery
- 8.5 Distribution, Channel Partners and Integrators
- 8.6 Downstream Applications and End Users
- 8.7 Value Addition and Profit Pools
- 8.8 Vertical Integration and Outsourcing
- 8.9 Supplier Concentration and Risk
- 8.10 Supply Chain Localization and Resilience
Chapter 9 India Diet Soft Drink Market Regulations and Policies
- 9.1 Relevant Laws, Standards and Compliance Frameworks
- 9.2 Product, Service, Safety and Quality Requirements
- 9.3 Government Policies, Incentives and Subsidies
- 9.4 Imports, Exports and Trade Barriers
- 9.5 Public Procurement and Local Content Requirements
- 9.6 Environmental and Sustainability Compliance
- 9.7 Upcoming Policy Changes and Market Implications
Chapter 10 India Diet Soft Drink Market Hotspots and Opportunities
- 10.1 Market Opportunity Mapping and Growth Hotspots
- 10.2 High-Growth Applications and Customer Groups
- 10.3 Underserved Markets and White-Space Opportunities
- 10.4 Emerging Technology and Product Opportunities
- 10.5 New Capacity and Investment Hotspots
- 10.6 Market Entry and Expansion Opportunities
- 10.7 Distribution and Partnership Opportunities
- 10.8 Near-Term and Long-Term Commercial Potential
- 10.9 Opportunity Attractiveness and Execution Risks
Chapter 11 India Diet Soft Drink Market Outlook, 2025-2035
- 11.1 Market Size and Analysis
- 11.1.1 Revenue (Market Measurement: 2025: USD 456.5 million → 2035: USD 1.54 billion)
- 11.1.2 Market Volume and Quantity Sold
- 11.1.3 Historical Market Size, 2018-2025
- 11.1.4 Base-Year Market Size, 2025
- 11.2 Market Forecast, 2025-2035
- 11.2.1 Revenue Forecast to 2035
- 11.2.2 Volume Forecast to 2035
- 11.2.3 CAGR and Year-on-Year Growth
- 11.2.4 Incremental Revenue Opportunity
- 11.3 Forecast Assumptions and Scenario Analysis
- 11.3.1 Base-Case Forecast
- 11.3.2 Optimistic and Conservative Scenarios
- 11.3.3 Technology, Pricing and Policy Sensitivities
- 11.4 Market Attractiveness and Growth Outlook
Chapter 12 India Diet Soft Drink Market Segmentation and Outlook
- 12.1 Segmentation Summary and Market Shares, 2025
- 12.2 Largest and Fastest-Growing Segments
- 12.3 By Product Type - Market Size and Forecast, 2025-2035
- 12.3.1 Segment Definition and Scope
- 12.3.2 Historical Market Size, 2018-2025
- 12.3.3 Revenue Forecast, 2025-2035
- 12.3.4 Volume Forecast, 2025-2035
- 12.3.5 Base-Year Market Share, 2025
- 12.3.6 Segment CAGR and Growth Drivers
- 12.3.7 Subsegment Market Size and Forecast
- 12.3.7.1 Cola-Based Zero-Sugar Drinks
- 12.3.7.2 Lemon-Lime Zero-Sugar Drinks
- 12.3.7.3 Fruit-Flavoured Diet Sodas
- 12.3.7.4 Low-Calorie Tonic and Mixers
- 12.3.7.5 Zero-Sugar Energy-Style CSDs
- 12.3.8 Subsegment Pricing and Adoption Trends
- 12.3.9 Leading Suppliers and Competition
- 12.3.10 Regional Demand and Opportunities
- 12.4 By Price Tier - Market Size and Forecast, 2025-2035
- 12.4.1 Segment Definition and Scope
- 12.4.2 Historical Market Size, 2018-2025
- 12.4.3 Revenue Forecast, 2025-2035
- 12.4.4 Volume Forecast, 2025-2035
- 12.4.5 Base-Year Market Share, 2025
- 12.4.6 Segment CAGR and Growth Drivers
- 12.4.7 Subsegment Market Size and Forecast
- 12.4.7.1 Value
- 12.4.7.2 Mainstream
- 12.4.7.3 Premium
- 12.4.7.4 Super-Premium
- 12.4.8 Subsegment Pricing and Adoption Trends
- 12.4.9 Leading Suppliers and Competition
- 12.4.10 Regional Demand and Opportunities
- 12.5 By Packaging Format - Market Size and Forecast, 2025-2035
- 12.5.1 Segment Definition and Scope
- 12.5.2 Historical Market Size, 2018-2025
- 12.5.3 Revenue Forecast, 2025-2035
- 12.5.4 Volume Forecast, 2025-2035
- 12.5.5 Base-Year Market Share, 2025
- 12.5.6 Segment CAGR and Growth Drivers
- 12.5.7 Subsegment Market Size and Forecast
- 12.5.7.1 PET Bottles
- 12.5.7.2 Aluminium Cans
- 12.5.7.3 Returnable Glass Bottles
- 12.5.7.4 Bag-in-Box Foodservice Packs
- 12.5.8 Subsegment Pricing and Adoption Trends
- 12.5.9 Leading Suppliers and Competition
- 12.5.10 Regional Demand and Opportunities
- 12.6 Segment Growth Comparison
- 12.7 Segment Attractiveness and Priority Matrix
Chapter 13 India Diet Soft Drink Geographic Market Outlook, 2025-2035
- 13.1 Domestic Market Distribution and Demand Clusters
- 13.2 State- or Province-Wise Market Size and Forecast, 2025-2035
- 13.3 City and Metropolitan Market Outlook
- 13.4 Industrial, Manufacturing and Commercial Clusters
- 13.5 Geographic Concentration of Key End Users
- 13.6 Local Pricing and Purchasing Differences
- 13.7 Domestic Production Facilities and Capacity Map
- 13.8 Local Infrastructure and Project Pipeline
- 13.9 State-Level Policy and Incentive Differences
- 13.10 Subnational Investment Hotspots and Opportunities
- 13.11 Distribution and Logistics Networks
- 13.12 Domestic Competitive Footprint
Chapter 14 India Diet Soft Drink Technology, Innovation and Sustainability Outlook
- 14.1 Technology Landscape and Maturity
- 14.2 Product, Process and Service Innovation
- 14.3 AI, Automation and Digital Tools in the Industry
- 14.4 Technology Adoption and Performance Benchmarking
- 14.5 Innovation Pipeline and R&D Investment
- 14.6 Patent and Intellectual Property Trends
- 14.7 Energy Efficiency and Resource Management
- 14.8 Sustainability, Recycling and Circularity
- 14.9 Technology Roadmap, 2025-2035
- 14.10 Risks of Obsolescence and Technology Substitution
Chapter 15 India Diet Soft Drink Market Key Strategic Imperatives
- 15.1 Growth and Market Entry Priorities
- 15.2 High-Return Products and Segments
- 15.3 Pricing, Profitability and Cost Optimization
- 15.4 Technology Investment and Product Differentiation
- 15.5 Supply Chain Localization and Resilience
- 15.6 Distribution and Customer Acquisition
- 15.7 Partnership, Acquisition and Capacity Strategy
- 15.8 Regional Expansion Priorities
- 15.9 Short-, Medium- and Long-Term Actions
Chapter 16 Competition Outlook
- 16.1 Industry Competition Characteristics
- 16.2 Market Structure and Concentration
- 16.3 Market Share and Competitive Positioning, 2025
- 16.4 Company-Wise Revenue and Product Benchmarking
- 16.5 Production and Service Capacity Benchmarking
- 16.6 Technology, Pricing and Differentiation
- 16.7 Regional Footprint and Distribution Strength
- 16.8 Mergers, Acquisitions and Strategic Alliances
- 16.9 New Entrants and Competitive Threats
- 16.10 Porter's Five Forces and Industry Attractiveness
- 16.11 Competitive Outlook, 2025-2035
Chapter 17 Company Profiles
- 17.1 Company Coverage and Selection Criteria
- 17.2 Coca-Cola India
- 17.2.1 Business Description
- 17.2.2 Company Ownership and Geographic Presence
- 17.2.3 Product and Service Portfolio
- 17.2.4 Manufacturing and Operating Footprint
- 17.2.5 Production Capacity and Expansion Plans
- 17.2.6 Financial Performance and Investment
- 17.2.7 Market Share and Competitive Position
- 17.2.8 Technology and Innovation Capabilities
- 17.2.9 Strategic Alliances or Partnerships
- 17.2.10 Recent Developments
- 17.2.11 Growth Strategy and Outlook
- 17.3 PepsiCo India
- 17.4 Reliance Consumer Products
- 17.5 Red Bull India
- 17.6 Monster Energy
- 17.7 HELL ENERGY
- 17.8 Svami Drinks
- 17.9 Jade Forest Beverages
- 17.10 CHINI KUM
- 17.11 Other Relevant Market Participants
Note: Every listed company is profiled on the structure shown under the first company. The company list is preliminary and may change based on research findings, market developments, data availability and client requirements.
Chapter 18 Disclaimer
- 18.1 Research and Forecast Disclaimer
- 18.2 Data Source and Estimation Limitations
Note: The depth of individual sections depends on data availability for this market. Volume, capacity, trade and other unit-based metrics are included where applicable.

