
Formula cans still anchor Australian infant feeding spend
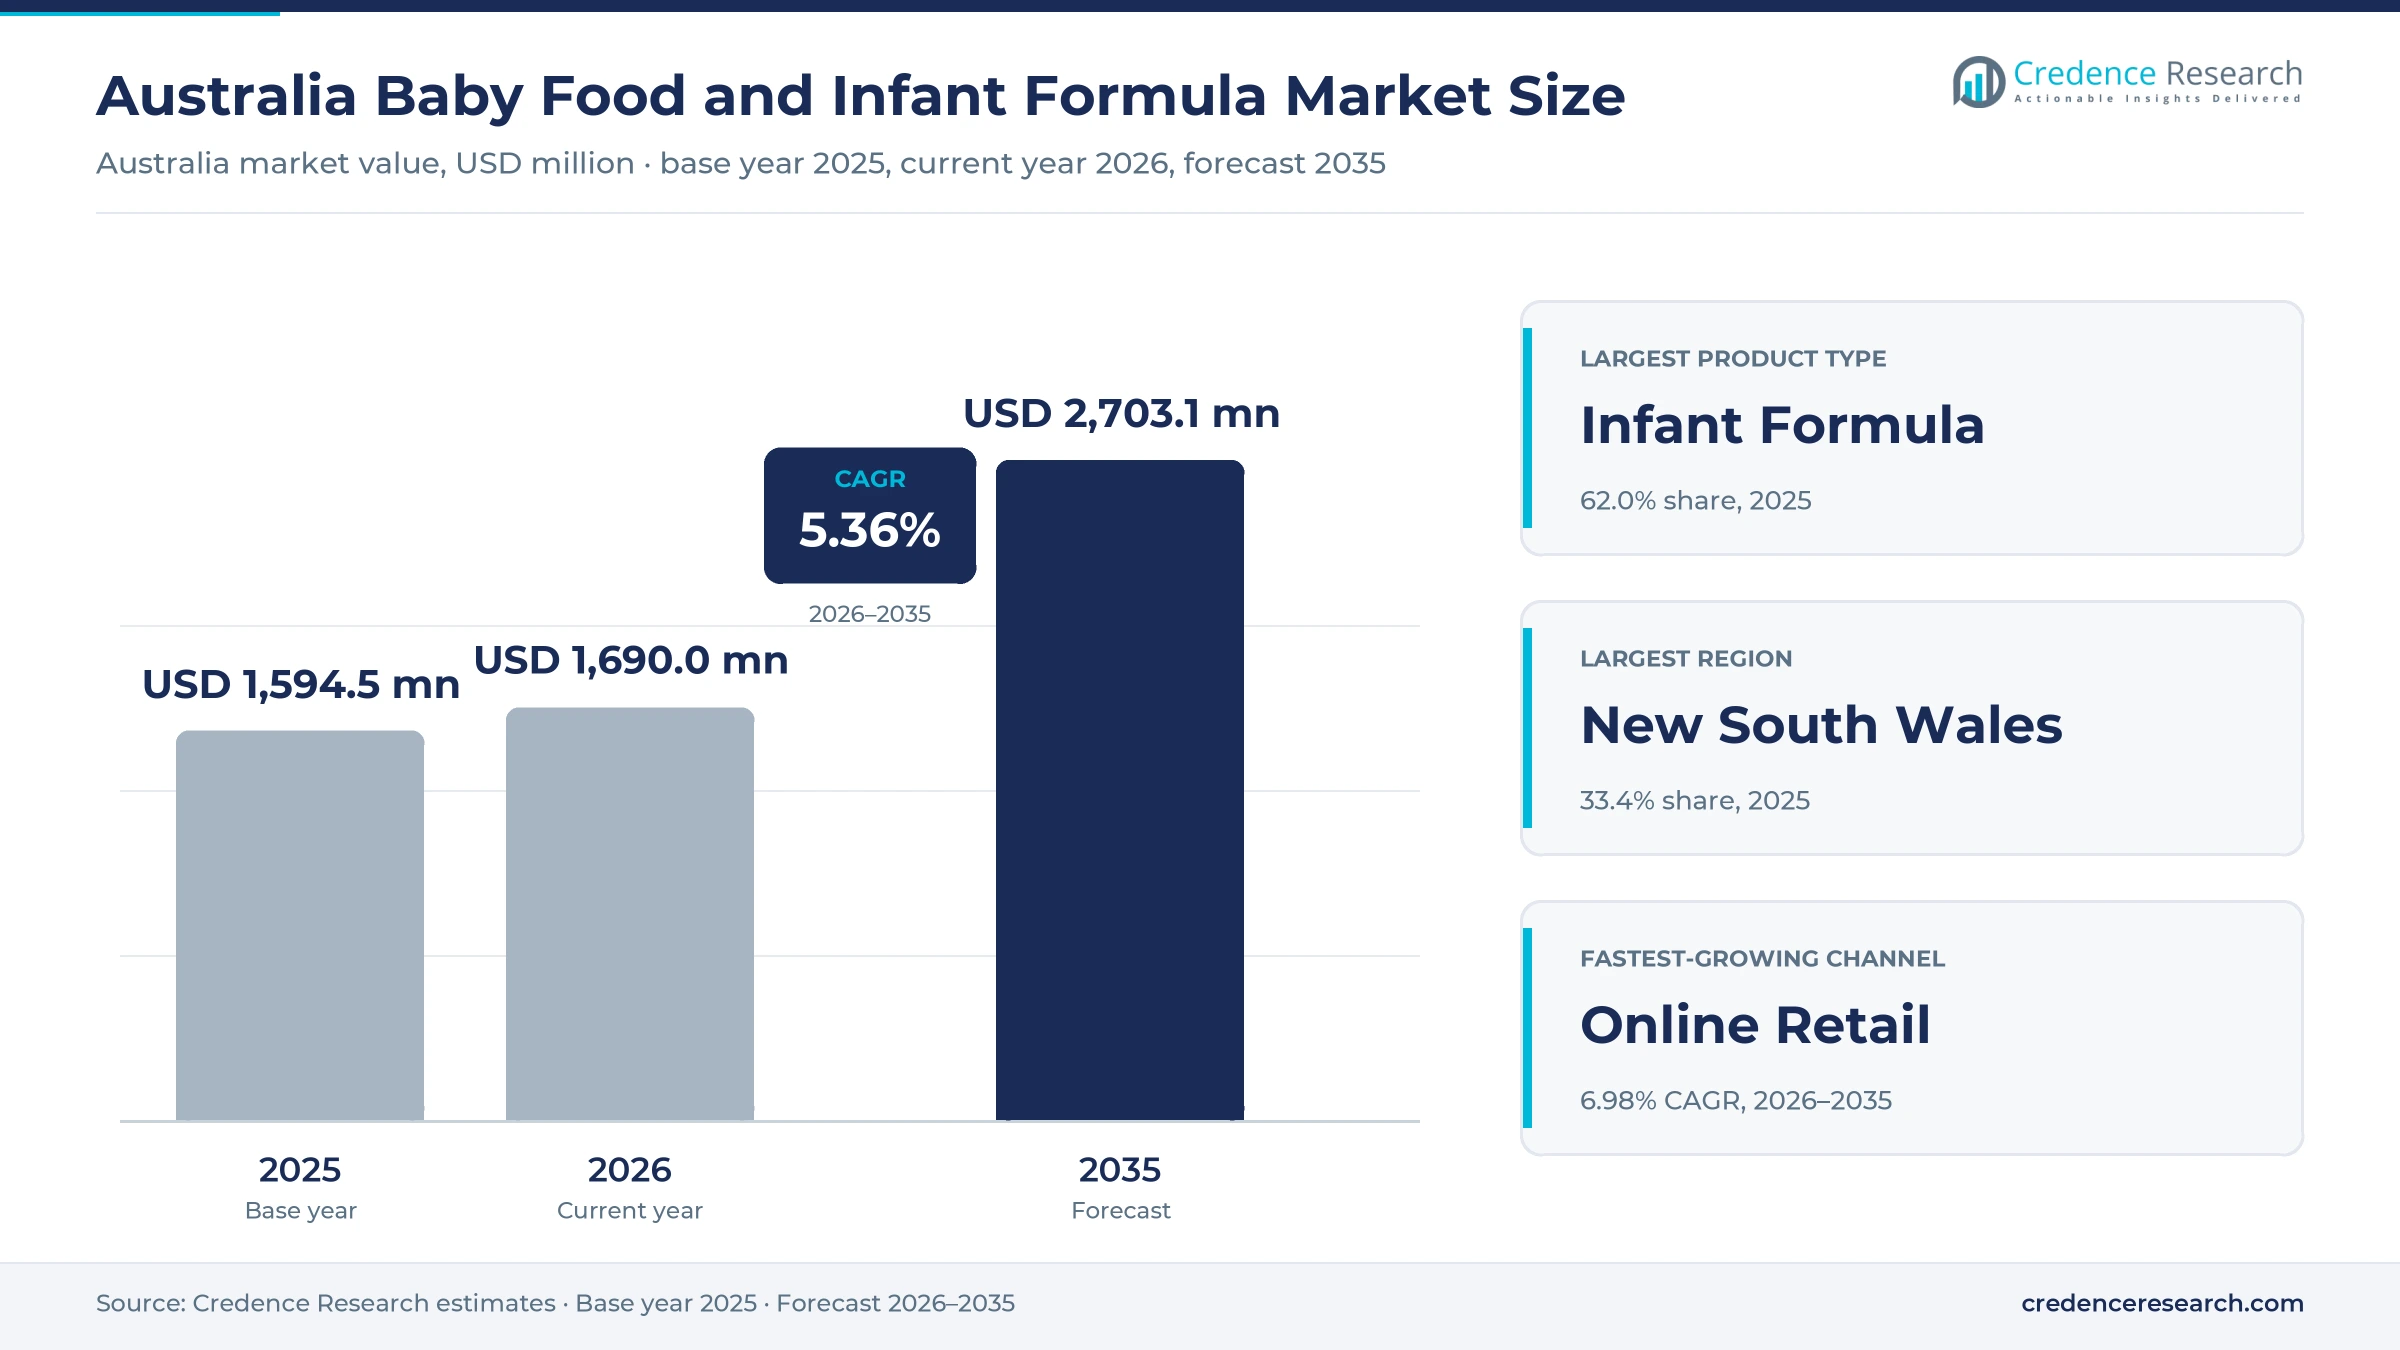
The Australia baby food and infant formula market was valued at USD 420.0 million in 2025 and is projected to increase from USD 442.5 million in 2026 to USD 707.9 million by 2035, registering a CAGR of 5.36% during 2026–2035. Demand comes from parents who rely on formula after the first months of life, from toddlers who move onto growing-up milks, and from families who buy purees, cereals and snacks as solids begin. New South Wales held the largest regional share, 33.4% in 2025, because it records the most births of any state. Queensland is the fastest-growing region at 5.63% a year, as its young family population keeps expanding. However, the rules are changing, because a revised infant formula standard began a five-year transition in September 2024 and the federal government is preparing mandatory limits on formula marketing after the voluntary industry agreement ended in February 2025.
What does this estimate count across infant feeding?
The estimate measures the value of infant formula, follow-on and toddler milks, prepared purees and meals, dried cereals, baby snacks and baby drinks sold through Australian supermarkets, pharmacies, online stores, specialist baby retailers and healthcare channels. It counts purchases by households, childcare providers and gift buyers, valued at retail selling prices.
The estimate excludes breast pumps, bottles, feeding accessories and general family foods that are not made for infants or toddlers, as well as bulk formula exported by manufacturers under their own export contracts. The value chain runs from dairy farms and ingredient suppliers through formula blenders and food makers to retailers, pharmacies and the parents who choose products for their children.
Australia Baby Food and Infant Formula Market Insights
- The Australia baby food and infant formula market was valued at USD 420.0 million in 2025 and is projected to reach USD 707.9 million by 2035, registering a CAGR of 5.36% during 2026–2035.
- New South Wales held a 33.4% share of 2025 value, because the state registered 86,978 births in 2024, the highest count of any Australian state.
- Infant formula led with a 62.0% share of 2025 value, because only 37.5% of Australian children were exclusively breastfed to around six months in 2022.
- A revised infant formula standard took effect on Sept. 13, 2024, and every product sold in Australia must comply by Sept. 13, 2029.
- Online retail grows fastest among channels at 6.98% a year during 2026–2035, as supermarket online penetration reached a record 15.1% at Woolworths in fiscal 2025.
Formula leads value while snacks and pouches grow fastest
Why does formula hold most of the value?
Based on product type, the market is categorized into infant formula, prepared baby food, dried baby food, baby snacks and baby drinks. Infant Formula led with a 62.0% share of 2025 value, because a can lasts days rather than weeks and most infants receive some formula in the first year. Baby Snacks grow fastest at 6.49% a year, as toddlers eat more finger foods between meals.
How do price tiers divide household spending?
Based on price tier, the market is categorized into value, mainstream, premium and super-premium products. Mainstream products led with a 38.0% share of 2025 value, because supermarket brands and established formula ranges fill most family baskets. Super-Premium products grow fastest at 6.28% a year, as organic, goat milk and specialised formulas win parents who pay for specific ingredients.
Where do Australian parents buy these products?
Based on distribution channel, the market is categorized into supermarkets and hypermarkets, pharmacies and chemists, online retail, specialist baby retail and healthcare and institutional channels. Supermarkets and Hypermarkets led with a 58.0% share of 2025 value, because weekly grocery trips carry most purchases. Online Retail grows fastest at 6.98% a year, as parents order bulky cans with home delivery.
Which packaging formats carry the most value?
Based on packaging format, the market is categorized into metal cans, flexible pouches, jars and tubs, and cartons and boxes. Metal Cans led with a 60.0% share of 2025 value, because powdered formula needs a sealed, resealable container with a scoop. Flexible Pouches grow fastest at 6.29% a year, as squeezable purees suit travel, childcare bags and older babies who self-feed.
| Segment Group | Leading Sub-segment | Share, 2025 | Fastest-growing Sub-segment | CAGR, 2026–2035 |
|---|---|---|---|---|
| By Product Type | Infant Formula | 62.0% | Baby Snacks | 6.49% |
| By Price Tier | Mainstream | 38.0% | Super-Premium | 6.28% |
| By Distribution Channel | Supermarkets and Hypermarkets | 58.0% | Online Retail | 6.98% |
| By Packaging Format | Metal Cans | 60.0% | Flexible Pouches | 6.29% |
Request a Free Sample
Fill in your details and we'll send you a free sample report.
- Sample data tables & charts
- Research methodology
Working parents and premium nutrition lift spending
How does working-parent convenience lift prepared foods?
Parents who return to paid work have less time to cook purees, so they buy ready meals, snacks and formula that fit childcare days. The female labor force participation rate in Australia reached 62.5% in 2025, up from 59.2% in 2015, according to World Bank data. The federal 3 Day Guarantee began on Jan. 5, 2026, and gives every eligible family at least 72 hours of subsidized child care per child each fortnight. Paid Parental Leave also rose to 26 weeks for children born from July 1, 2026, with a 12% superannuation payment for births from July 1, 2025. As a result, baby snacks grow fastest among product types at 6.49% a year during 2026–2035.
Why does the premium nutrition mix raise value per child?
Australian parents increasingly choose formulas built around a specific protein, probiotic or organic claim, which raises the price of each can. Only 37.5% of children were exclusively breastfed to around six months in 2022, while 90.6% received breast milk at some stage, according to the Australian Bureau of Statistics. Danone Nutricia updated its Aptamil Gold+ range in 2025 with a new look and revised levels of probiotic strains in its toddler stages. Bellamy's Organic sells dual-certified organic formula alongside cereals, pouches, pasta and snacks for children up to 36 months and older. In turn, super-premium products grow fastest among price tiers at 6.28% a year.
How is omnichannel retail widening the buying routes?
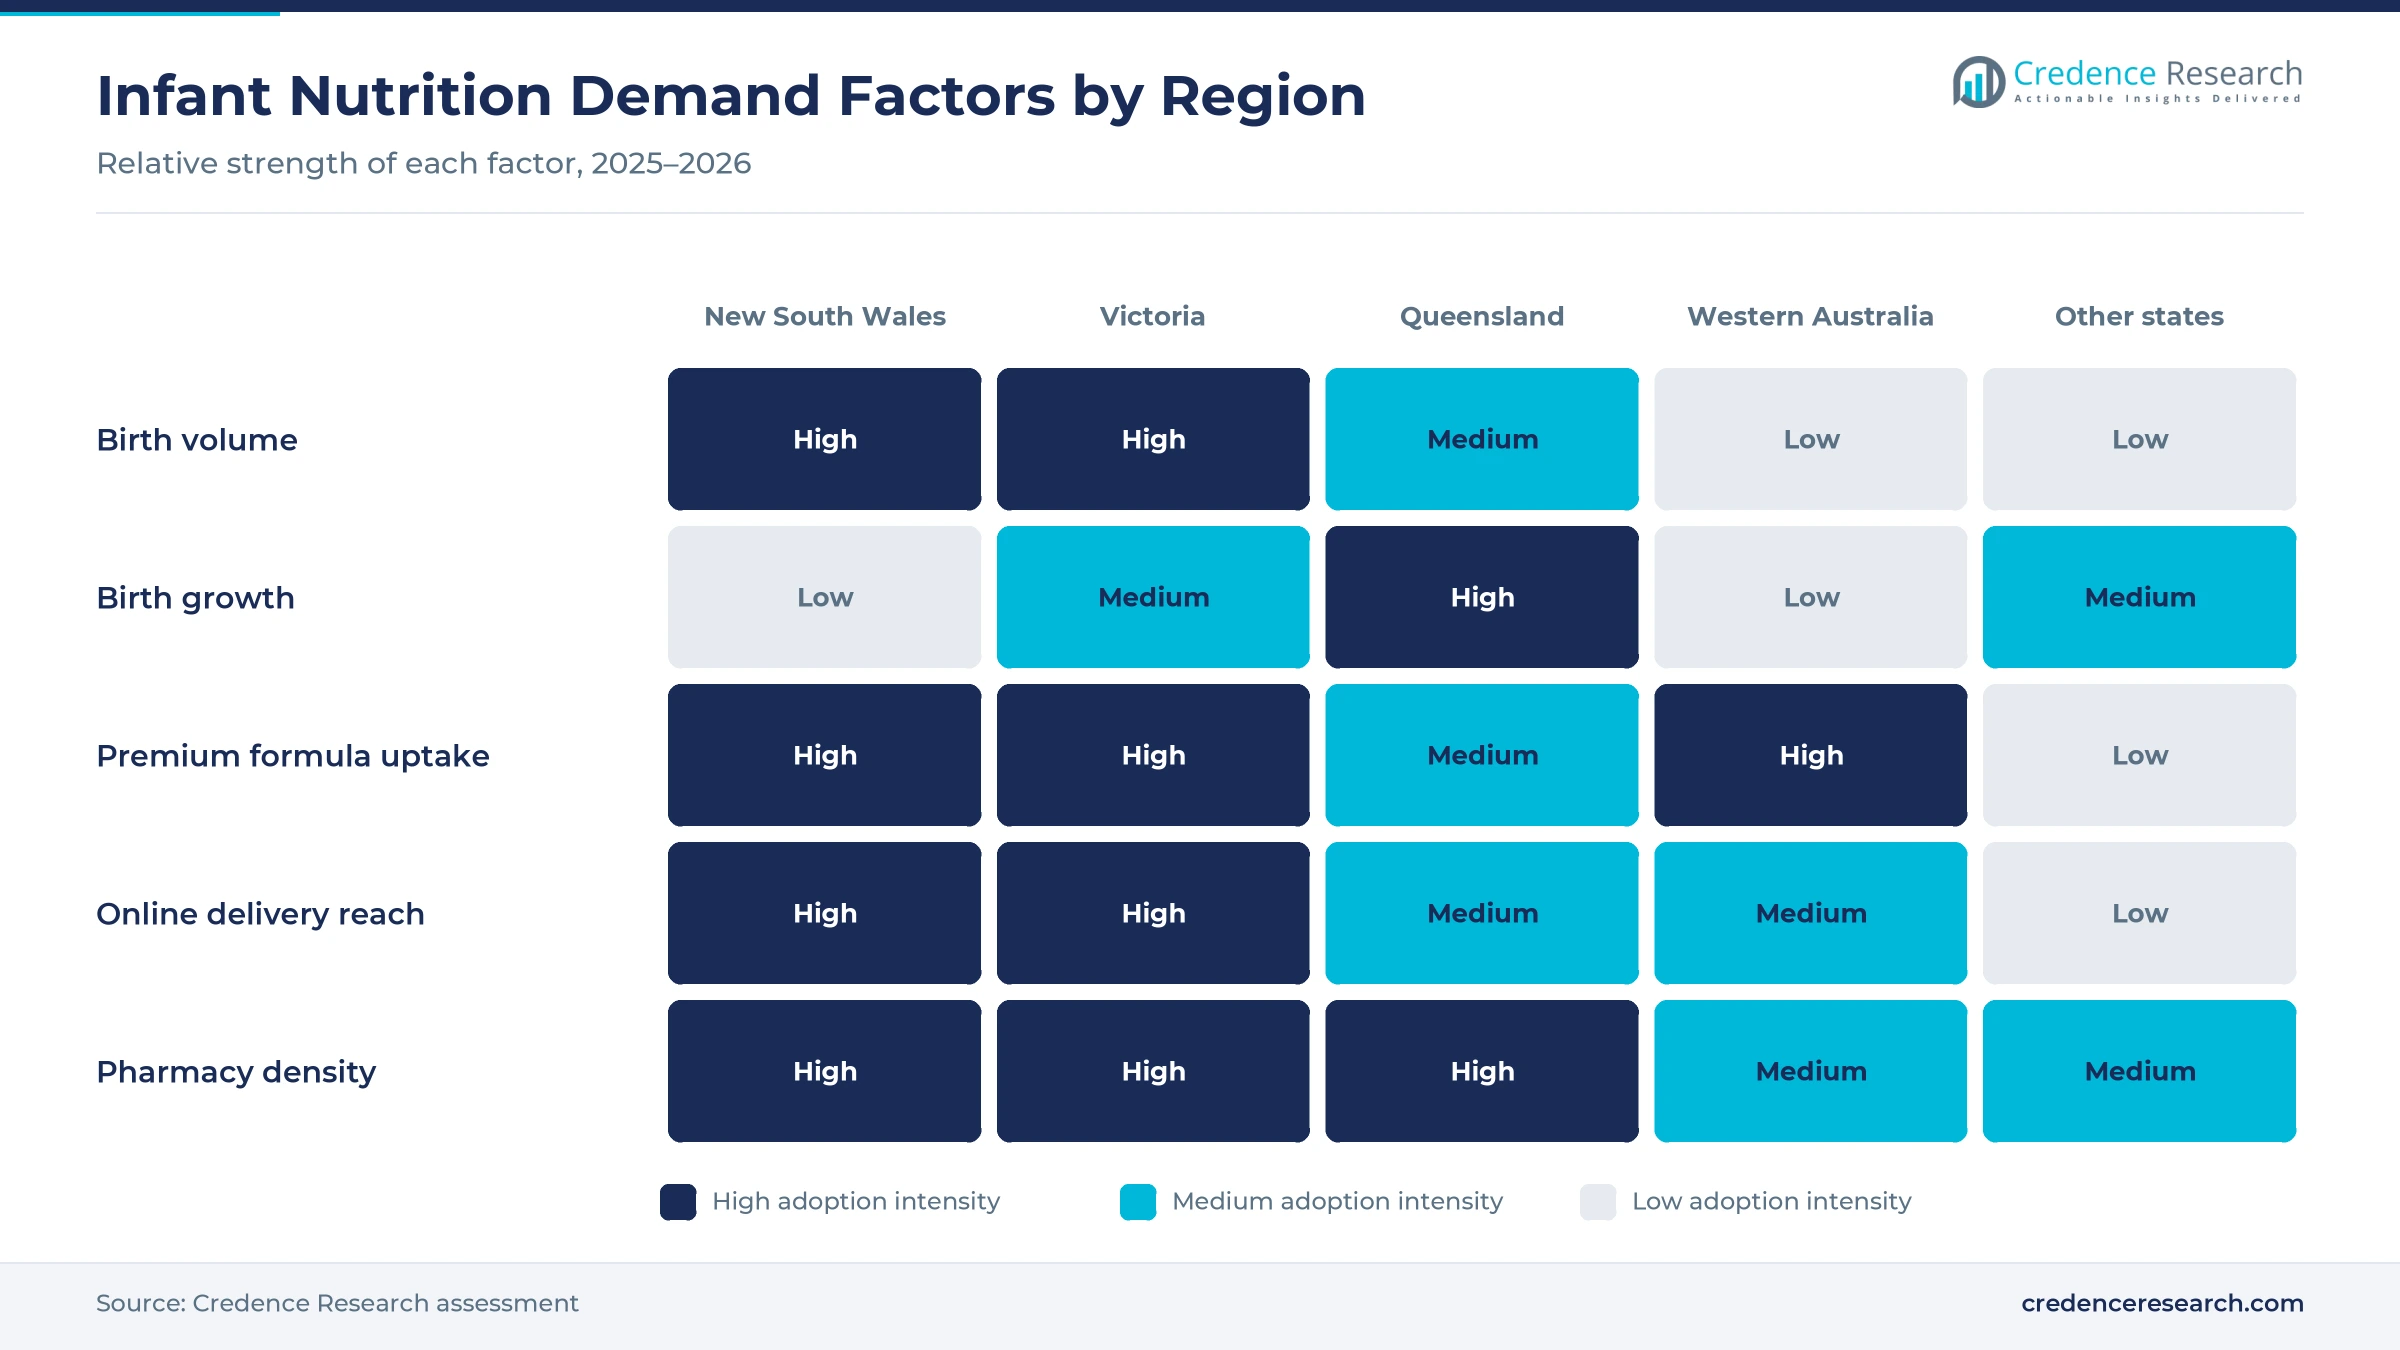
Parents now split purchases between supermarket aisles, pharmacy shelves and online orders, which keeps products in front of buyers wherever they shop. Woolworths reported that online penetration in its Australian food business reached a record 15.1% in the 52 weeks to June 29, 2025, up 1.5 points on the prior year. A single recalled specialty formula in January 2026 had been sold at Coles, Woolworths, Big W, IGA, Costco, pharmacies and Amazon, according to Food Standards Australia New Zealand. LittleOak opened ordering for pharmacies across the country through the MyAPI portal of Australian Pharmaceutical Industries in October 2024. As a result, online retail grows fastest among channels at 6.98% a year.
Why does a steady birth base keep demand resilient?
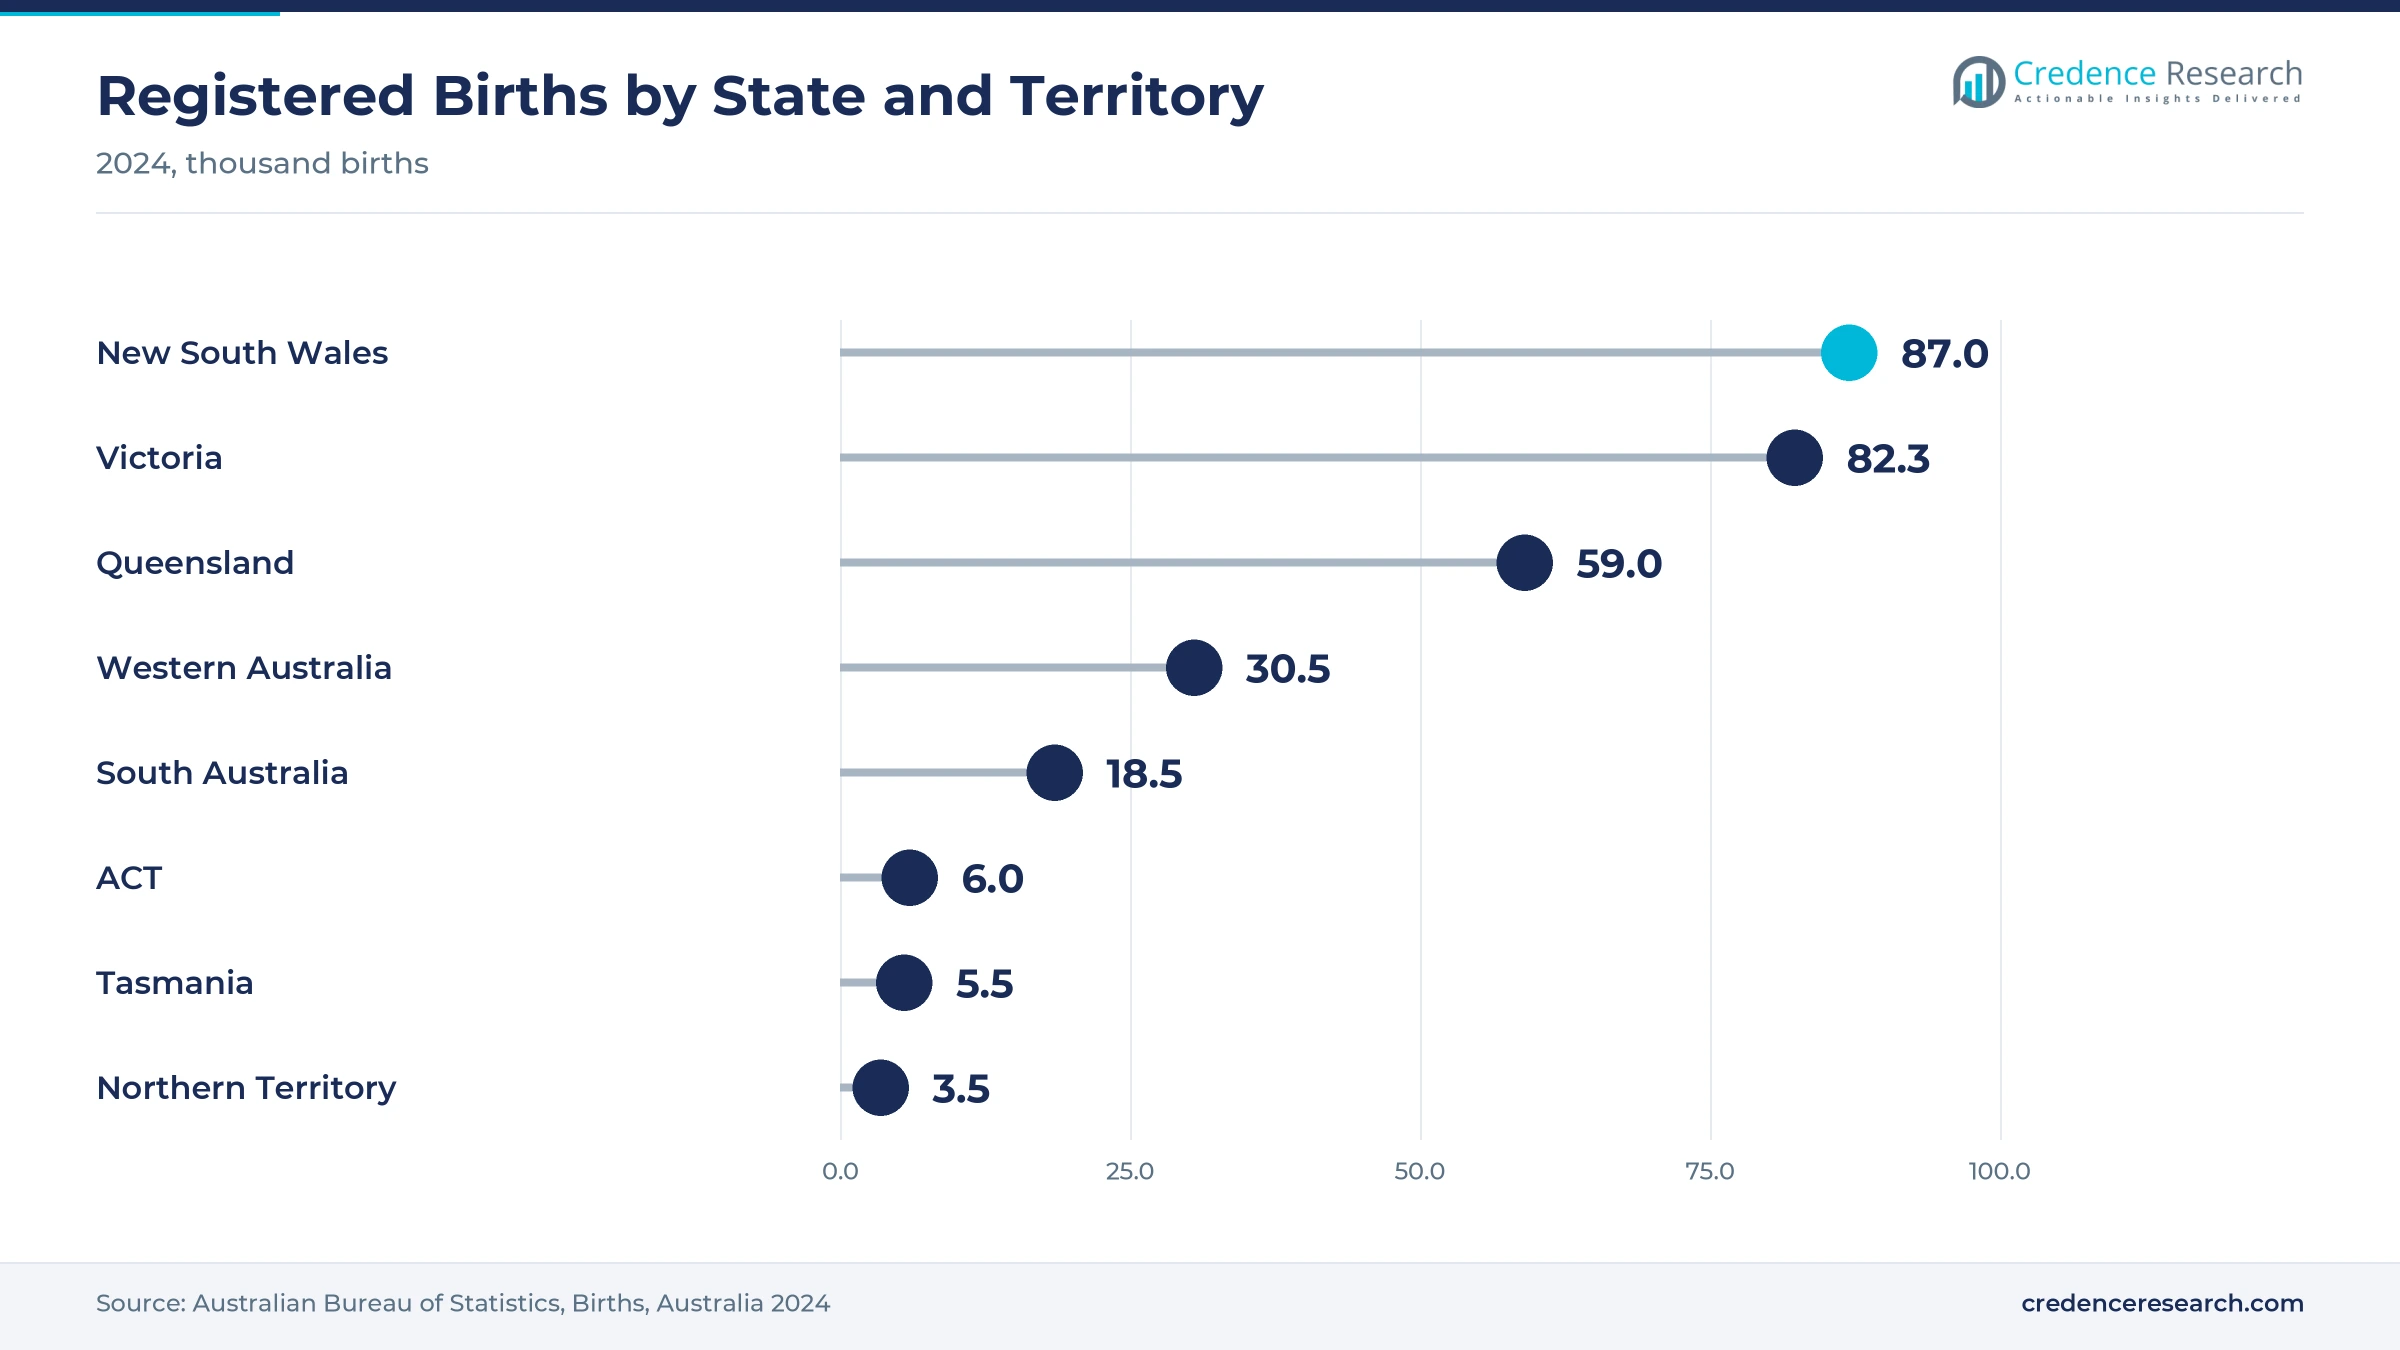
Every newborn creates roughly three years of demand for formula, toddler milk and first foods, so the birth count sets the floor for volume. Australia registered 292,318 births in 2024, up 1.9% from 2023, according to the Australian Bureau of Statistics. New South Wales registered 86,978 births and Victoria 82,328, although Victoria's count was lifted by faster registration processing after earlier delays. Queensland recorded 58,986 births, and the Northern Territory posted the largest proportional increase in births among all states and territories. In turn, Queensland holds a 20.4% share of 2025 value, and its young family population keeps expanding through the forecast period.
New formula rules and nutrition reviews reshape shelves
How is the revised formula standard shifting labels?
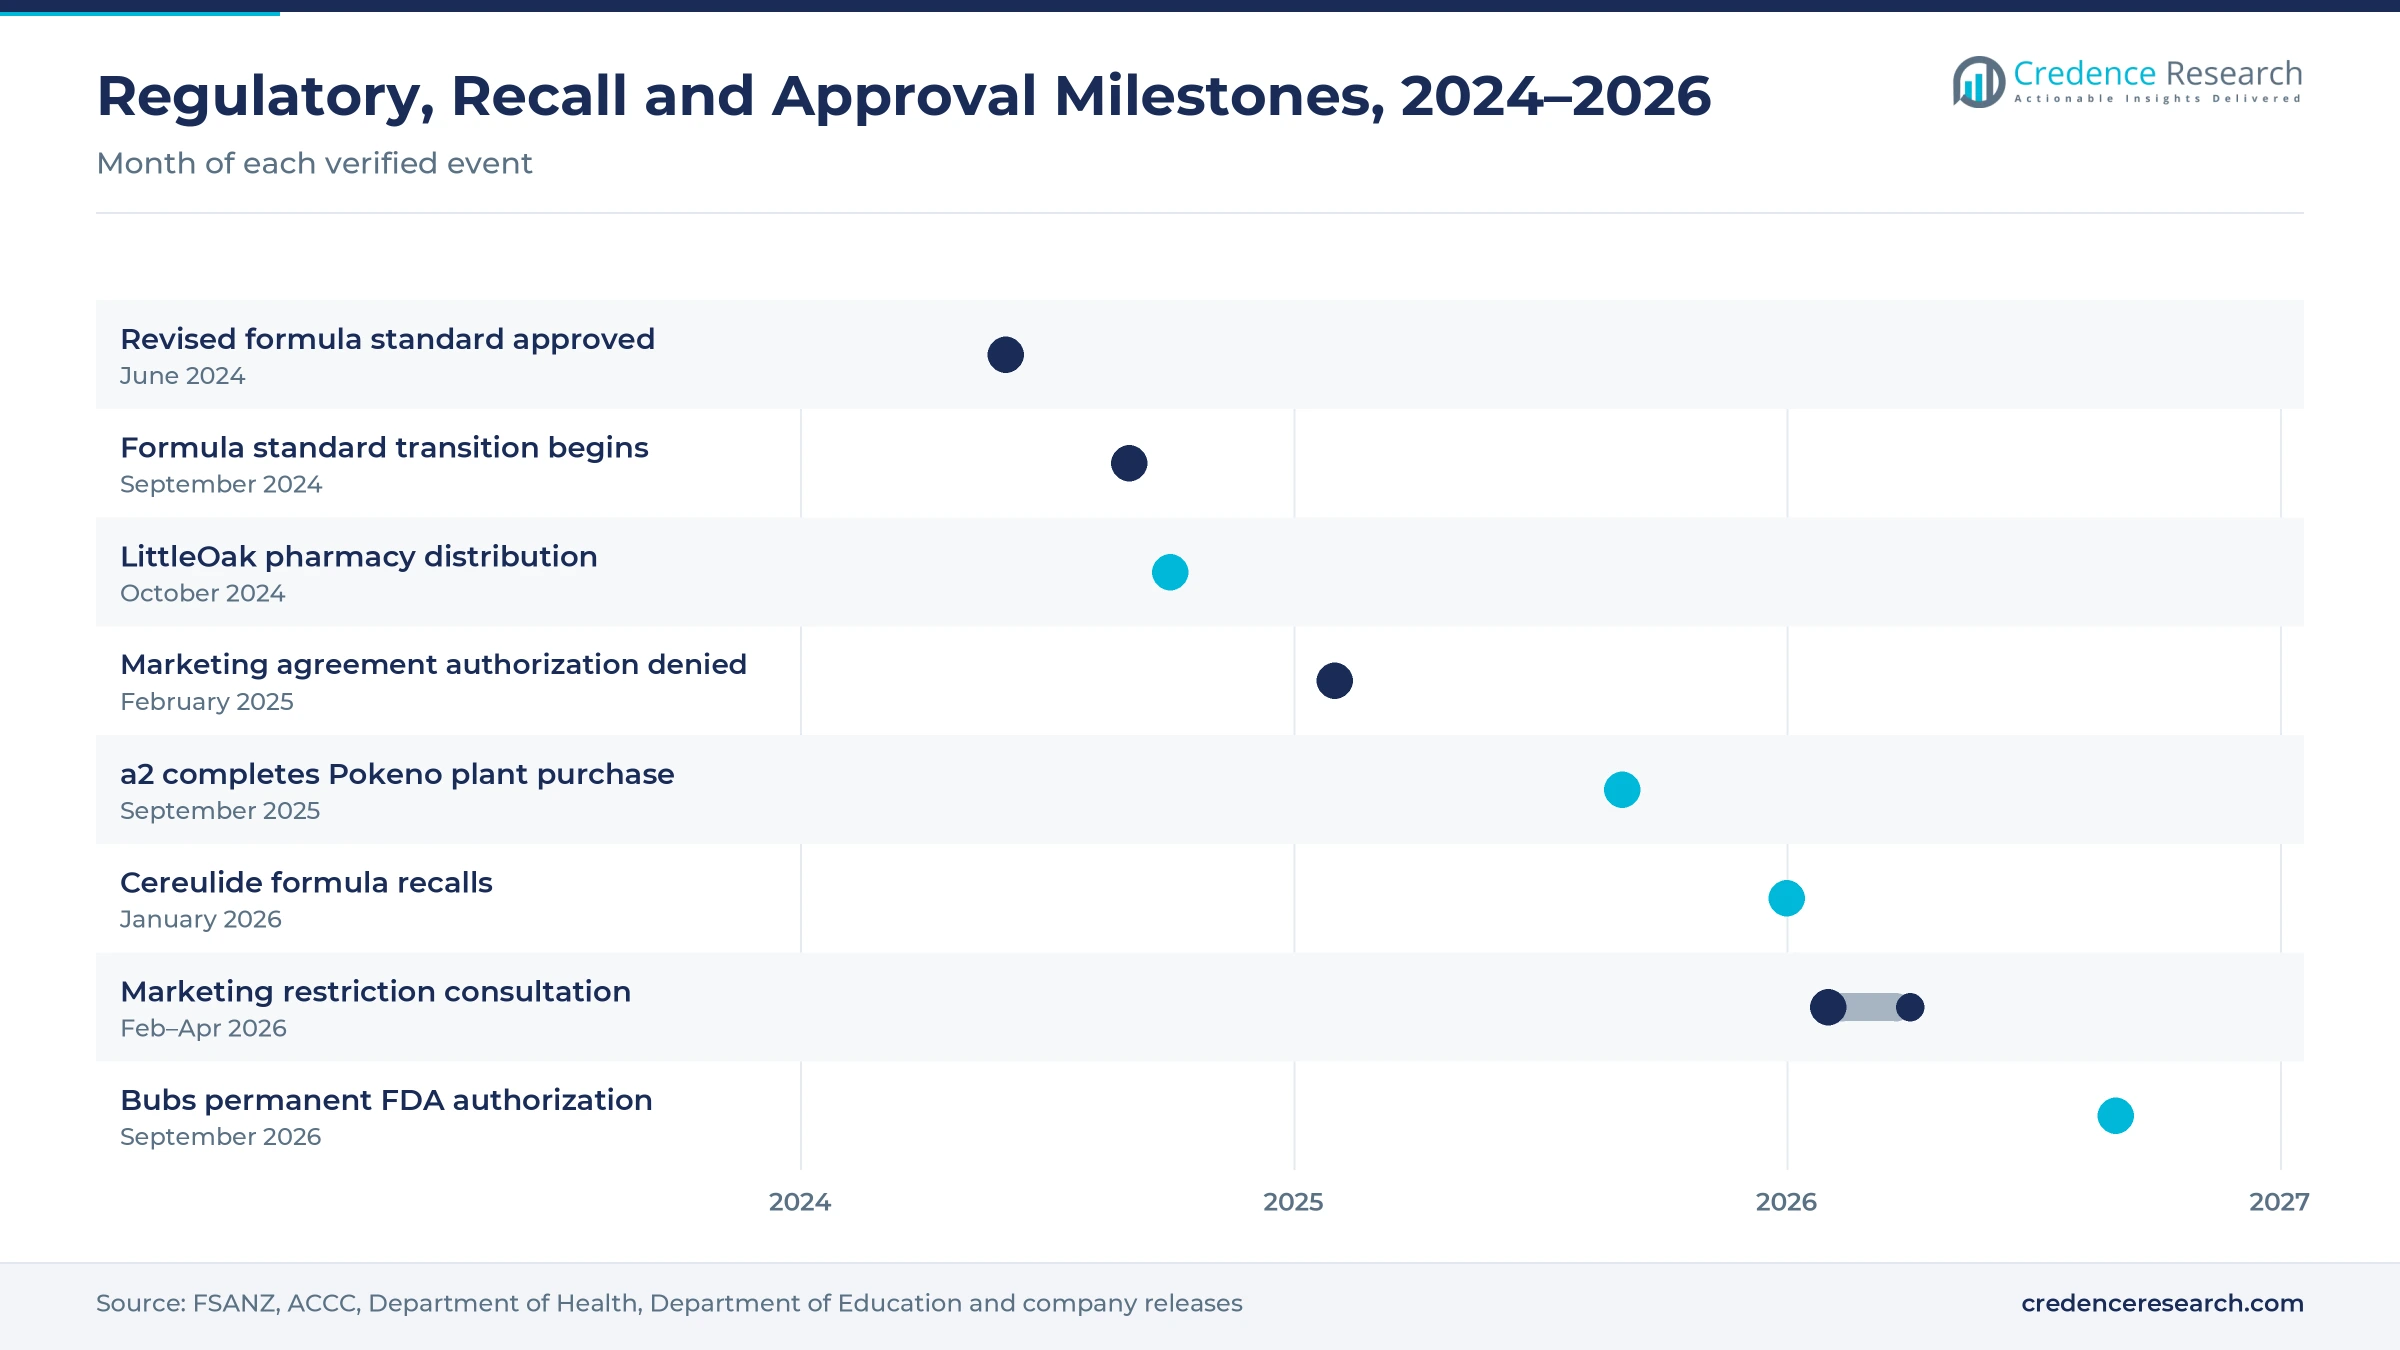
Formula makers must redesign labels and recipes for a stricter national standard, which favors brands with strong regulatory teams. The Food Standards Australia New Zealand Board approved the infant formula proposal on June 4, 2024, and the revised rules took effect on Sept. 13, 2024, according to the food standards agency. The five-year transition ends on Sept. 13, 2029, when every product sold must meet the new standard. The rules make a nutrition information statement mandatory, prohibit proxy advertising and create a separate category for special medical purpose products for infants. As a result, healthcare and institutional channels gain clearer rules for the specialised formulas they supply.
Why is formula marketing moving toward mandatory limits?
The shift from a voluntary industry code to legislated marketing controls is changing how brands reach new parents. The competition regulator denied authorization for the industry agreement on Feb. 6, 2025, saying its voluntary nature and limited reach over digital marketing undermined its value, according to the ACCC. The agreement, in place since 1992, ended on Feb. 28, 2025, after the government had announced in October 2024 that it would mandate the restrictions. A federal consultation ran from Feb. 27 to April 17, 2026, and considered extending limits to toddler milk and retailer promotions. In turn, brands lean on pharmacy advice and product quality rather than broad promotion.
Can better-nutrition purees and snacks open new demand?
Food ministers want commercial infant foods to carry less sugar and more iron, which opens room for reformulated ready-to-eat purees and snacks. About 90% of Australian infants did not meet the estimated requirement for iron in a 2021 national study, according to the food regulation policy paper. Its public consultation drew 58 submissions in 2024, and 92% of public health, research and government stakeholders supported a regulatory approach. The paper found that 25% of young children also fell short of the iron requirement, which supports iron-fortified cereals and meals. As a result, makers of iron-rich, low-sugar flexible pouches can gain share as rules tighten.
Will export-grade dairy manufacturing lift local brands?
Formula plants that pass foreign regulators can also strengthen trust and supply security for Australian shoppers. Bubs Australia received permanent authorization from the U.S. Food and Drug Administration for three formulas on Sept. 7, 2026, including its goat milk and grass-fed ranges. The a2 Milk Company completed its purchase of the Pokeno plant in September 2025, a site that already makes its a2 Gentle Gold and a2Genesis English-label products. Australia produced 8,315 million liters of milk in 2024–25 from 3,772 farms, according to Dairy Australia, while New Zealand dairy supplies the trans-Tasman blending base. In turn, premium local brands can defend their shelf space in Australia.
Recalls, falling fertility and price pressure test brands
Contamination recalls expose ingredient supply risk
Formula relies on global ingredient chains, so a single contaminated input can reach several brands at once. Nestlé recalled five batches of Alfamino in January 2026, and Sanulac recalled two Alula batches on Jan. 22 over possible cereulide contamination. The Infant Nutrition Council said 20% to 40% of formula products and inputs in Australia are imported. As a result, brands are adding supplier testing and dual sourcing for oils and proteins.
Record-low fertility caps volume growth
Australia's total fertility rate fell to 1.481 births per woman in 2024, well below the replacement level of about 2.1 births per woman. As a result, the number of infants entering the market each year grows slowly, and brands must raise value per child rather than rely on more babies. Companies respond with premium recipes, toddler ranges and older-child snacks, which extend the years a family spends in the category.
Cost-of-living pressure pushes trading down
Higher grocery and housing costs leave many young families with less spare income for premium cans and pouches. In turn, value and mainstream products keep a firm base, while some parents switch between brands during promotions or choose larger, cheaper pack sizes. Manufacturers respond with tiered ranges, multipacks and loyalty programs, which help keep price-sensitive families with a brand. Private label ranges at the major supermarkets add further pressure on branded prices in the value and mainstream tiers.
Stricter marketing rules raise compliance costs
Brands face tighter limits on how they describe and promote formula, which makes launching a new product slower and more expensive. The revised standard bans proxy advertising, while legislation to replace the voluntary agreement is still being drafted. As a result, smaller brands must fund label redesigns and legal reviews with fewer channels for consumer outreach. Companies respond by building pharmacist and health professional education programs that stay within the rules.
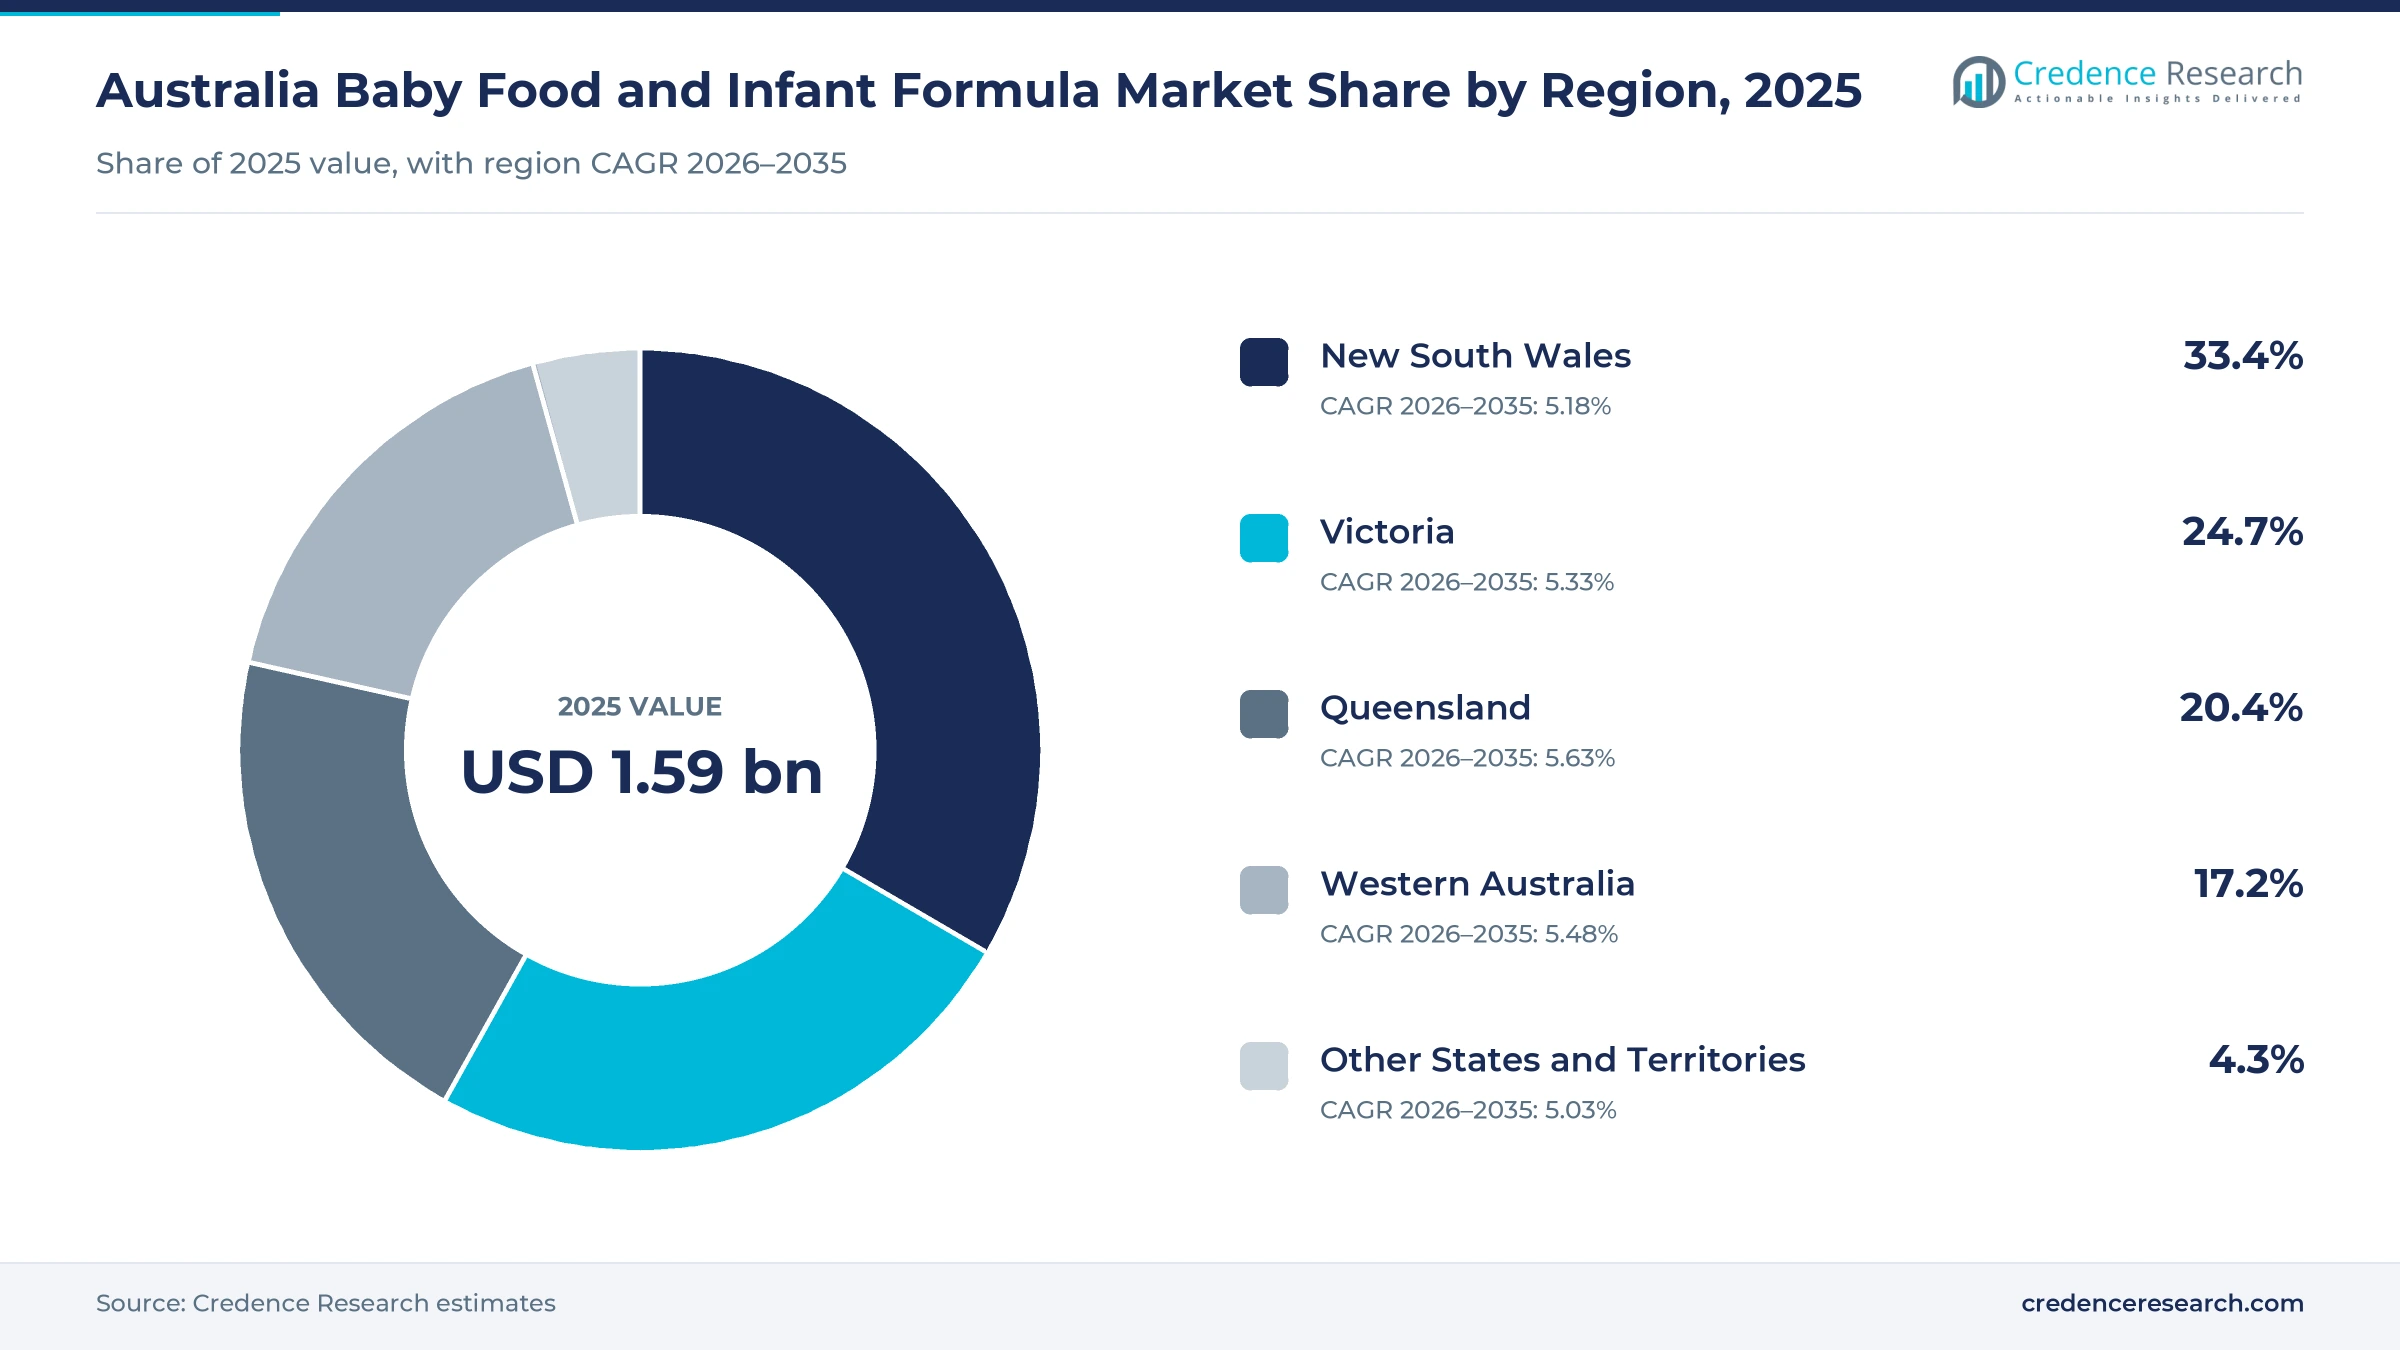
New South Wales leads while Queensland grows fastest
| Region | Value, 2025 (USD million) | Share, 2025 | CAGR, 2026–2035 |
|---|---|---|---|
| New South Wales | 140.3 | 33.4% | 5.18% |
| Victoria | 103.7 | 24.7% | 5.33% |
| Queensland | 85.7 | 20.4% | 5.63% |
| Western Australia | 72.2 | 17.2% | 5.48% |
| Other States and Territories | 18.1 | 4.3% | 5.03% |
Why does New South Wales hold the largest share?
New South Wales held a 33.4% share of 2025 value and grows at 5.18% a year, because the state registered 86,978 births in 2024, the most of any state. Its registered births fell 3.4% from 2023, which explains a growth rate below the national average. The state also has the largest population, which gives brands the widest base of supermarkets and pharmacies. As a result, New South Wales stays the main volume base for brands entering the country.
How does Victoria support demand?
Victoria held a 24.7% share of 2025 value and grows at 5.33% a year, because the state registered 82,328 births in 2024. That count rose 12.9% partly because birth registration processing improved after earlier delays, so the underlying trend is steadier than the headline. Melbourne's large young family suburbs keep supermarket and pharmacy demand broad. In turn, Victoria tracks the national growth rate closely through 2035.
Why is Queensland growing fastest?
Queensland held a 20.4% share of 2025 value and grows fastest at 5.63% a year, because its registered births keep rising while several other states record declines. The state registered 58,986 births in 2024, up 0.7% from 2023, while New South Wales and Western Australia recorded falls. Queensland also had more births than Western Australia and South Australia combined, which gives brands a large base. As a result, Queensland adds value faster than any other region.
What drives demand in Western Australia?
Western Australia held a 17.2% share of 2025 value and grows at 5.48% a year, because the state registered 30,516 births in 2024, the fourth-highest count in the country. That count was 4.7% lower than in 2023 after changes in registration processing, so the underlying trend is steadier. Its value share is larger than its birth count suggests, which points to higher spending per child on premium ranges. In turn, Western Australia pairs a smaller birth base with higher spending per child.
How do the other states and territories contribute?
The other states and territories held a 4.3% share of 2025 value and grow at 5.03% a year, because South Australia, Tasmania, the ACT and the Northern Territory register fewer births. The Northern Territory recorded the highest total fertility rate in 2024, while the ACT recorded the lowest. Remote communities depend on fewer stores and longer freight routes. As a result, these regions grow more slowly than the large eastern states.
Regulatory decisions, recalls and approvals since 2024
| Development | Status and market relevance |
|---|---|
| In September 2024, the revised infant formula standard took effect and began a five-year transition to Sept. 13, 2029. | Resets labels and composition for every formula sold |
| In October 2024, LittleOak made its goat milk formulas available to pharmacies nationally through Australian Pharmaceutical Industries. | Widens pharmacy access for a premium local brand |
| In February 2025, the ACCC denied authorization for the voluntary formula marketing agreement, which ended on Feb. 28. | Clears the way for mandatory marketing limits |
| In January 2026, Nestlé and Sanulac recalled formula batches over possible cereulide contamination from a supplier ingredient. | Raises ingredient testing and sourcing standards |
| In September 2026, Bubs Australia received permanent U.S. FDA authorization for three infant formulas. | Confirms export-grade manufacturing for a local brand |
Can, pouch and protein formats define the product range
- Resealable metal cans protect powdered formula from moisture and light, which keeps a scoop-based product safe for weeks after opening.
- Spouted flexible pouches hold purees in a light, shelf-stable pack, which suits travel and older babies who feed themselves from squeeze packs.
- Goat and A2 protein bases give parents alternatives to standard cow milk protein, which supports higher prices in premium tiers.
- Certified organic supply chains trace milk and produce from farm to can, which lets brands such as Bellamy's Organic carry dual organic certification.
Need a Custom Version of This Report?
Tailor the scope, geography, or segments to your exact requirements.
- Custom geography or segment scope
- Direct access to our analyst team
Local organic brands challenge global formula makers
Competition combines global nutrition companies, Australian and New Zealand dairy brands and local baby food makers. Danone Nutricia and Nestlé Australia hold strong positions in standard and specialised formula, with Nestlé's Alfamino sold through hospitals, pharmacies and general practitioners. The a2 Milk Company, Bubs Australia, Bellamy's Organic and LittleOak compete on protein source, organic claims and Australian or New Zealand origin. In wet foods, Kraft Heinz sells Heinz for Baby pouches, while PZ Cussons owns Rafferty's Garden, which it bought in 2013 after the ACCC blocked a Heinz bid because the two firms led infant food supply. Companies compete on pharmacist trust, supermarket ranging, recall readiness and the ability to meet the revised formula standard by 2029.
Which brands lead Australian infant nutrition?
| Company | Type | Role in the market |
|---|---|---|
| Danone Nutricia Australia | Global formula maker | Updated its Aptamil Gold+ range and toddler probiotic levels in 2025 |
| Nestlé Australia | Global formula maker | Supplies Alfamino specialised formula through hospitals and pharmacies |
| The a2 Milk Company | A2 protein formula brand | Bought the Pokeno plant that makes its English-label formula |
| Bubs Australia | Goat and cow milk formula brand | Won permanent U.S. FDA authorization for three formulas in 2026 |
| Bellamy's Organic | Organic formula and food brand | Sells dual-certified organic formula, cereals, pouches and snacks |
| LittleOak Company | Goat milk formula brand | Distributes to pharmacies nationally through API since 2024 |
| Kraft Heinz Australia | Wet food maker | Sells Heinz for Baby 120-gram pouches for babies from six months |
| PZ Cussons Australia | Wet food maker | Owns the Rafferty's Garden baby food brand |
Premium formula and better pouches carry value growth
Credence Research's view is that Australian baby food and infant formula value will grow faster than births, because parents keep moving toward premium, organic and specialised products. Infant formula remains the core of spending, while baby snacks and flexible pouches grow fastest as working parents seek convenience. Mandatory marketing limits and the 2029 formula deadline will favor brands with strong regulatory and quality teams. Companies that pair trusted supply, pharmacist relationships and better-nutrition recipes should gain the most share by 2035.
Births, feeding and retail data shape the estimate
The report uses 2025 as the base year on a calendar basis, and market values come from the Credence Research model. That model combines official birth and breastfeeding statistics, labor force data, food regulator decisions, retailer disclosures and company releases. Segment splits and region growth rates are Credence Research estimates, while region shares follow the client's regional split. Sources used are official statistics, regulator and government releases, and company announcements, and no interviews or surveys were used.
Premium mix and online buying support growth to 2035
The Australia baby food and infant formula market is expected to reach USD 707.9 million by 2035, a 5.36% CAGR during 2026–2035, as premium formula, convenient snacks and online buying lift value per child. Growth should be strongest in baby snacks, super-premium products, online retail and Queensland, because these areas gain most from working parents and a growing family population. Low fertility, recalls and price pressure could slow some categories, while the revised formula standard should raise quality across the shelf by 2029.
Frequently Asked Questions
How big is the Australia baby food and infant formula market?
Which product type leads the market?
Which region leads the market?
How many babies are born in Australia each year?
What changed in Australian infant formula rules?
What happened to the voluntary formula marketing agreement?
Which companies lead the Australian market?
What are the main challenges for the market?
Table of Content
Chapter 1 Market Segmentation
- 1.1 Segmentation Framework
- 1.1.1 Product and Service Classification
- 1.1.2 Application and End-Use Classification
- 1.1.3 Technology and Solution Classification
- 1.1.4 Customer and Distribution Channel Classification
- 1.1.5 Geographic Segmentation
- 1.1.6 Market Segment Definitions and Boundaries
- 1.2 By Product Type
- 1.2.1 Infant Formula
- 1.2.2 Prepared Baby Food
- 1.2.3 Dried Baby Food
- 1.2.4 Baby Snacks
- 1.2.5 Baby Drinks
- 1.3 By Price Tier
- 1.3.1 Value
- 1.3.2 Mainstream
- 1.3.3 Premium
- 1.3.4 Super-Premium
- 1.4 By Packaging Format
- 1.4.1 Metal Cans
- 1.4.2 Flexible Pouches
- 1.4.3 Jars and Tubs
- 1.4.4 Cartons and Boxes
Chapter 2 Introduction
- 2.1 Report Objectives and Scope
- 2.2 Product Definition and Industry Terminology
- 2.3 Market Inclusions and Exclusions
- 2.4 Research Process
- 2.4.1 Primary Research and Expert Interviews
- 2.4.2 Secondary Research and Source Review
- 2.4.3 Top-Down and Bottom-Up Estimation
- 2.4.4 Data Triangulation and Verification
- 2.5 Market Size Measurement Basis
- 2.5.1 2025: USD 420.0 million → 2035: USD 707.9 million
- 2.6 Historical and Forecast Reference Periods
- 2.6.1 Historical Period: 2018-2025
- 2.6.2 Base Year: 2025
- 2.6.3 Forecast Period: 2025-2035
- 2.7 Research Assumptions and Limitations
Chapter 3 Executive Summary
- 3.1 Market Snapshot and Key Findings
- 3.2 Base-Year Market Size, 2025
- 3.3 Forecast Market Size, 2035
- 3.4 Revenue and Volume Growth Outlook
- 3.5 Key Demand and Supply Indicators
- 3.6 Leading Market Segments
- 3.7 Fastest-Growing Market Opportunities
- 3.8 Regional Performance Highlights
- 3.9 Technology and Industry Transformation
- 3.10 Competitive Landscape Summary
- 3.11 Analyst View and Strategic Implications
Chapter 4 Australia Baby Food and Infant Formula Market Trends and Developments
- 4.1 Historical Industry Development, 2018-2025
- 4.2 Recent Market Trends and Developments
- 4.3 Demand and Customer Behavior Trends
- 4.4 Technology and Product Innovation
- 4.5 Artificial Intelligence, Automation and Digitalization
- 4.6 Local Manufacturing and Supply Chain Realignment
- 4.7 Industry Partnerships, Mergers and Acquisitions
- 4.8 Sustainability and Circular Economy Developments
- 4.9 Government and Private Sector Investment Trends
- 4.10 Emerging Business Models and Commercialization
- 4.11 Industry Developments and Announcements
Chapter 5 Australia Baby Food and Infant Formula Market Production, Supply and Demand Analysis
- 5.1 Demand Trend and Consumption Analysis, 2018-2025
- 5.2 Demand Forecast, 2025-2035
- 5.3 Production and Output Trend, 2018-2025
- 5.4 Production and Output Forecast, 2025-2035
- 5.5 Installed Capacity and Capacity Utilization
- 5.6 Company-Wise Production Plants and Statistics
- 5.6.1 Installed Production Capacity
- 5.6.2 Actual Production
- 5.6.3 Planned Capacity and Expansion Targets
- 5.7 Supply Chain Structure and Procurement Trends
- 5.8 Supply-Demand Gap and Bottlenecks
- 5.9 Import Dependence and Sourcing Structure
- 5.10 Contract Manufacturing and Outsourcing
- 5.11 Regional Supply and Demand Concentration
Chapter 6 Australia Baby Food and Infant Formula Market Pricing Analysis
- 6.1 Pricing Structure and Measurement
- 6.2 Historical Pricing Trends, 2018-2025
- 6.3 Pricing Outlook, 2025-2035
- 6.4 Average Selling Price and Unit Economics
- 6.5 Pricing by Product and Market Segment
- 6.6 Geographic Pricing Differences
- 6.7 Key Input, Energy, Labor and Logistics Costs
- 6.8 Contract Pricing and Purchasing Models
- 6.9 Pricing Sensitivity and Competitive Positioning
- 6.10 Price, Margin and Profitability Implications
Chapter 7 Australia Baby Food and Infant Formula Market Dynamics
- 7.1 Market Growth Drivers
- 7.1.1 Demand-Side Drivers
- 7.1.2 Technology and Innovation Drivers
- 7.1.3 Infrastructure and Investment Drivers
- 7.1.4 Regulatory and Policy Drivers
- 7.2 Market Restraints
- 7.2.1 Cost and Affordability Constraints
- 7.2.2 Technology and Adoption Barriers
- 7.2.3 Supply Chain and Operational Constraints
- 7.3 Market Challenges
- 7.3.1 Competitive Pressure and Margin Erosion
- 7.3.2 Skills, Infrastructure and Implementation Gaps
- 7.4 Emerging Market Opportunities
- 7.5 Market Dynamics Impact and Time-Horizon Assessment
Chapter 8 Australia Baby Food and Infant Formula Value Chain Analysis
- 8.1 Industry Value Chain Overview
- 8.2 Upstream Suppliers and Critical Inputs
- 8.3 Technology and Component Providers
- 8.4 Manufacturing or Service Delivery
- 8.5 Distribution, Channel Partners and Integrators
- 8.6 Downstream Applications and End Users
- 8.7 Value Addition and Profit Pools
- 8.8 Vertical Integration and Outsourcing
- 8.9 Supplier Concentration and Risk
- 8.10 Supply Chain Localization and Resilience
Chapter 9 Australia Baby Food and Infant Formula Market Regulations and Policies
- 9.1 Relevant Laws, Standards and Compliance Frameworks
- 9.2 Product, Service, Safety and Quality Requirements
- 9.3 Government Policies, Incentives and Subsidies
- 9.4 Imports, Exports and Trade Barriers
- 9.5 Public Procurement and Local Content Requirements
- 9.6 Environmental and Sustainability Compliance
- 9.7 Upcoming Policy Changes and Market Implications
Chapter 10 Australia Baby Food and Infant Formula Market Hotspots and Opportunities
- 10.1 Market Opportunity Mapping and Growth Hotspots
- 10.2 High-Growth Applications and Customer Groups
- 10.3 Underserved Markets and White-Space Opportunities
- 10.4 Emerging Technology and Product Opportunities
- 10.5 New Capacity and Investment Hotspots
- 10.6 Market Entry and Expansion Opportunities
- 10.7 Distribution and Partnership Opportunities
- 10.8 Near-Term and Long-Term Commercial Potential
- 10.9 Opportunity Attractiveness and Execution Risks
Chapter 11 Australia Baby Food and Infant Formula Market Outlook, 2025-2035
- 11.1 Market Size and Analysis
- 11.1.1 Revenue (Market Measurement: 2025: USD 420.0 million → 2035: USD 707.9 million)
- 11.1.2 Market Volume and Quantity Sold
- 11.1.3 Historical Market Size, 2018-2025
- 11.1.4 Base-Year Market Size, 2025
- 11.2 Market Forecast, 2025-2035
- 11.2.1 Revenue Forecast to 2035
- 11.2.2 Volume Forecast to 2035
- 11.2.3 CAGR and Year-on-Year Growth
- 11.2.4 Incremental Revenue Opportunity
- 11.3 Forecast Assumptions and Scenario Analysis
- 11.3.1 Base-Case Forecast
- 11.3.2 Optimistic and Conservative Scenarios
- 11.3.3 Technology, Pricing and Policy Sensitivities
- 11.4 Market Attractiveness and Growth Outlook
Chapter 12 Australia Baby Food and Infant Formula Market Segmentation and Outlook
- 12.1 Segmentation Summary and Market Shares, 2025
- 12.2 Largest and Fastest-Growing Segments
- 12.3 By Product Type - Market Size and Forecast, 2025-2035
- 12.3.1 Segment Definition and Scope
- 12.3.2 Historical Market Size, 2018-2025
- 12.3.3 Revenue Forecast, 2025-2035
- 12.3.4 Volume Forecast, 2025-2035
- 12.3.5 Base-Year Market Share, 2025
- 12.3.6 Segment CAGR and Growth Drivers
- 12.3.7 Subsegment Market Size and Forecast
- 12.3.7.1 Infant Formula
- 12.3.7.2 Prepared Baby Food
- 12.3.7.3 Dried Baby Food
- 12.3.7.4 Baby Snacks
- 12.3.7.5 Baby Drinks
- 12.3.8 Subsegment Pricing and Adoption Trends
- 12.3.9 Leading Suppliers and Competition
- 12.3.10 Regional Demand and Opportunities
- 12.4 By Price Tier - Market Size and Forecast, 2025-2035
- 12.4.1 Segment Definition and Scope
- 12.4.2 Historical Market Size, 2018-2025
- 12.4.3 Revenue Forecast, 2025-2035
- 12.4.4 Volume Forecast, 2025-2035
- 12.4.5 Base-Year Market Share, 2025
- 12.4.6 Segment CAGR and Growth Drivers
- 12.4.7 Subsegment Market Size and Forecast
- 12.4.7.1 Value
- 12.4.7.2 Mainstream
- 12.4.7.3 Premium
- 12.4.7.4 Super-Premium
- 12.4.8 Subsegment Pricing and Adoption Trends
- 12.4.9 Leading Suppliers and Competition
- 12.4.10 Regional Demand and Opportunities
- 12.5 By Packaging Format - Market Size and Forecast, 2025-2035
- 12.5.1 Segment Definition and Scope
- 12.5.2 Historical Market Size, 2018-2025
- 12.5.3 Revenue Forecast, 2025-2035
- 12.5.4 Volume Forecast, 2025-2035
- 12.5.5 Base-Year Market Share, 2025
- 12.5.6 Segment CAGR and Growth Drivers
- 12.5.7 Subsegment Market Size and Forecast
- 12.5.7.1 Metal Cans
- 12.5.7.2 Flexible Pouches
- 12.5.7.3 Jars and Tubs
- 12.5.7.4 Cartons and Boxes
- 12.5.8 Subsegment Pricing and Adoption Trends
- 12.5.9 Leading Suppliers and Competition
- 12.5.10 Regional Demand and Opportunities
- 12.6 Segment Growth Comparison
- 12.7 Segment Attractiveness and Priority Matrix
Chapter 13 Australia Baby Food and Infant Formula Geographic Market Outlook, 2025-2035
- 13.1 Domestic Market Distribution and Demand Clusters
- 13.2 State- or Province-Wise Market Size and Forecast, 2025-2035
- 13.3 City and Metropolitan Market Outlook
- 13.4 Industrial, Manufacturing and Commercial Clusters
- 13.5 Geographic Concentration of Key End Users
- 13.6 Local Pricing and Purchasing Differences
- 13.7 Domestic Production Facilities and Capacity Map
- 13.8 Local Infrastructure and Project Pipeline
- 13.9 State-Level Policy and Incentive Differences
- 13.10 Subnational Investment Hotspots and Opportunities
- 13.11 Distribution and Logistics Networks
- 13.12 Domestic Competitive Footprint
Chapter 14 Australia Baby Food and Infant Formula Technology, Innovation and Sustainability Outlook
- 14.1 Technology Landscape and Maturity
- 14.2 Product, Process and Service Innovation
- 14.3 AI, Automation and Digital Tools in the Industry
- 14.4 Technology Adoption and Performance Benchmarking
- 14.5 Innovation Pipeline and R&D Investment
- 14.6 Patent and Intellectual Property Trends
- 14.7 Energy Efficiency and Resource Management
- 14.8 Sustainability, Recycling and Circularity
- 14.9 Technology Roadmap, 2025-2035
- 14.10 Risks of Obsolescence and Technology Substitution
Chapter 15 Australia Baby Food and Infant Formula Market Key Strategic Imperatives
- 15.1 Growth and Market Entry Priorities
- 15.2 High-Return Products and Segments
- 15.3 Pricing, Profitability and Cost Optimization
- 15.4 Technology Investment and Product Differentiation
- 15.5 Supply Chain Localization and Resilience
- 15.6 Distribution and Customer Acquisition
- 15.7 Partnership, Acquisition and Capacity Strategy
- 15.8 Regional Expansion Priorities
- 15.9 Short-, Medium- and Long-Term Actions
Chapter 16 Competition Outlook
- 16.1 Industry Competition Characteristics
- 16.2 Market Structure and Concentration
- 16.3 Market Share and Competitive Positioning, 2025
- 16.4 Company-Wise Revenue and Product Benchmarking
- 16.5 Production and Service Capacity Benchmarking
- 16.6 Technology, Pricing and Differentiation
- 16.7 Regional Footprint and Distribution Strength
- 16.8 Mergers, Acquisitions and Strategic Alliances
- 16.9 New Entrants and Competitive Threats
- 16.10 Porter's Five Forces and Industry Attractiveness
- 16.11 Competitive Outlook, 2025-2035
Chapter 17 Company Profiles
- 17.1 Company Coverage and Selection Criteria
- 17.2 Nestlé Australia Ltd.
- 17.2.1 Business Description
- 17.2.2 Company Ownership and Geographic Presence
- 17.2.3 Product and Service Portfolio
- 17.2.4 Manufacturing and Operating Footprint
- 17.2.5 Production Capacity and Expansion Plans
- 17.2.6 Financial Performance and Investment
- 17.2.7 Market Share and Competitive Position
- 17.2.8 Technology and Innovation Capabilities
- 17.2.9 Strategic Alliances or Partnerships
- 17.2.10 Recent Developments
- 17.2.11 Growth Strategy and Outlook
- 17.3 Danone Nutricia Australia Pty Ltd.
- 17.4 Bellamy's Organic
- 17.5 The a2 Milk Company Limited
- 17.6 Bubs Australia Limited
- 17.7 Abbott Australasia Pty Ltd.
- 17.8 Kraft Heinz Australia
- 17.9 PZ Cussons Australia Pty Ltd.
- 17.10 HiPP Australia
- 17.11 LittleOak Company
- 17.12 Other Relevant Market Participants
Note: Every listed company is profiled on the structure shown under the first company. The company list is preliminary and may change based on research findings, market developments, data availability and client requirements.
Chapter 18 Disclaimer
- 18.1 Research and Forecast Disclaimer
- 18.2 Data Source and Estimation Limitations
Note: The depth of individual sections depends on data availability for this market. Volume, capacity, trade and other unit-based metrics are included where applicable.

