
Ready-to-eat greens move from niche to weekly basket item
The Asia Pacific packaged salad market was valued at USD 2.51 billion in 2025 and is projected to increase from USD 2.73 billion in 2026 to USD 5.48 billion by 2035, registering a CAGR of 8.05% during 2026–2035. Demand comes from urban households that want vegetables without washing and cutting, from convenience stores that sell single-serve bowls, and from cafes and caterers that buy prepared leaves in bulk. Greater China held the largest sub-regional share, 54.0% in 2025, because its large urban population is buying more chilled food through supermarkets and apps. South Asia and Southeast Asia is the fastest-growing sub-region at 9.10% a year, as modern retail and cold storage reach more cities. Japan remains the most mature market in the region, where packaged greens are already a regular weekly purchase. China's cold chain volume also rose 4.5% to 381.4 million tons in 2025, which supports wider chilled distribution.
Which ready-to-eat salad products does the regional estimate cover?
The estimate measures retail and foodservice spending on washed, cut and packed salad products sold chilled across the Asia Pacific region. It covers bagged leaves, salad kits with dressings and toppings, chopped salad mixes and fresh-cut vegetable bases such as shredded cabbage. Values are measured at the price paid by households, restaurants, caterers and institutions that buy these products.
The estimate excludes whole heads of lettuce sold loose, deli salads made in store, bottled dressings sold separately and frozen vegetables. The value chain runs from contract growers and seed suppliers through washing, cutting and packing plants to cold chain operators, retailers, online grocers and foodservice distributors in Greater China, Japan and South Korea, Australia and New Zealand, and South Asia and Southeast Asia.
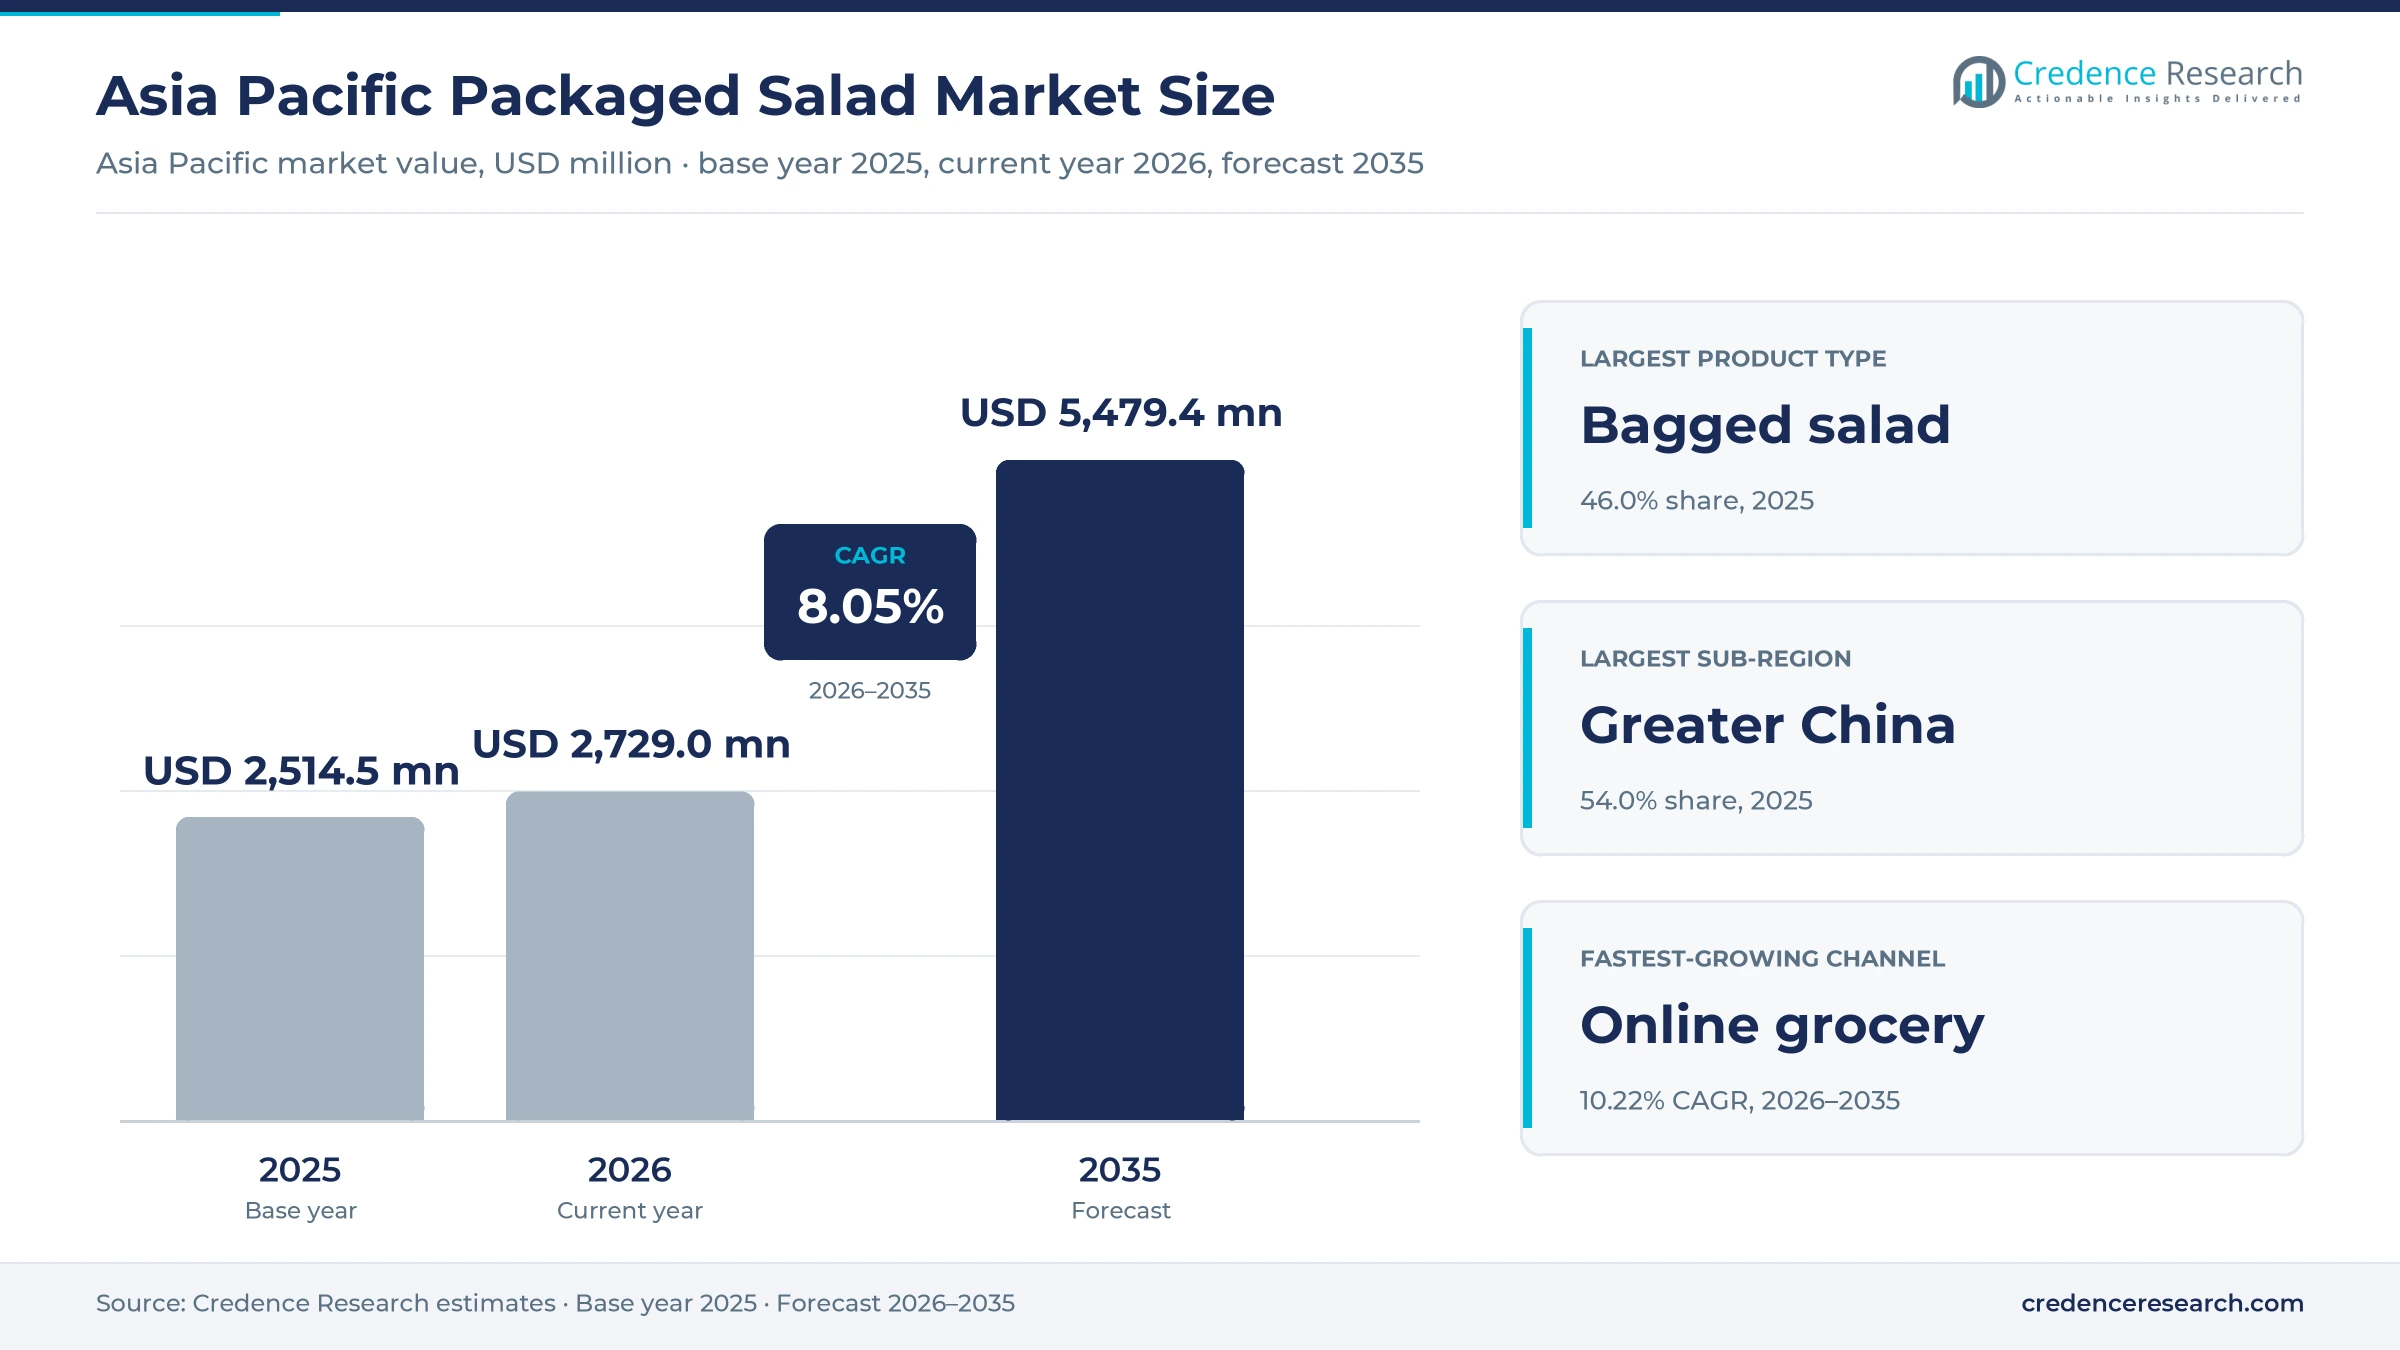
Asia Pacific Packaged Salad Market Insights
- The Asia Pacific packaged salad market was valued at USD 2.51 billion in 2025 and is projected to reach USD 5.48 billion by 2035, registering a CAGR of 8.05% during 2026–2035.
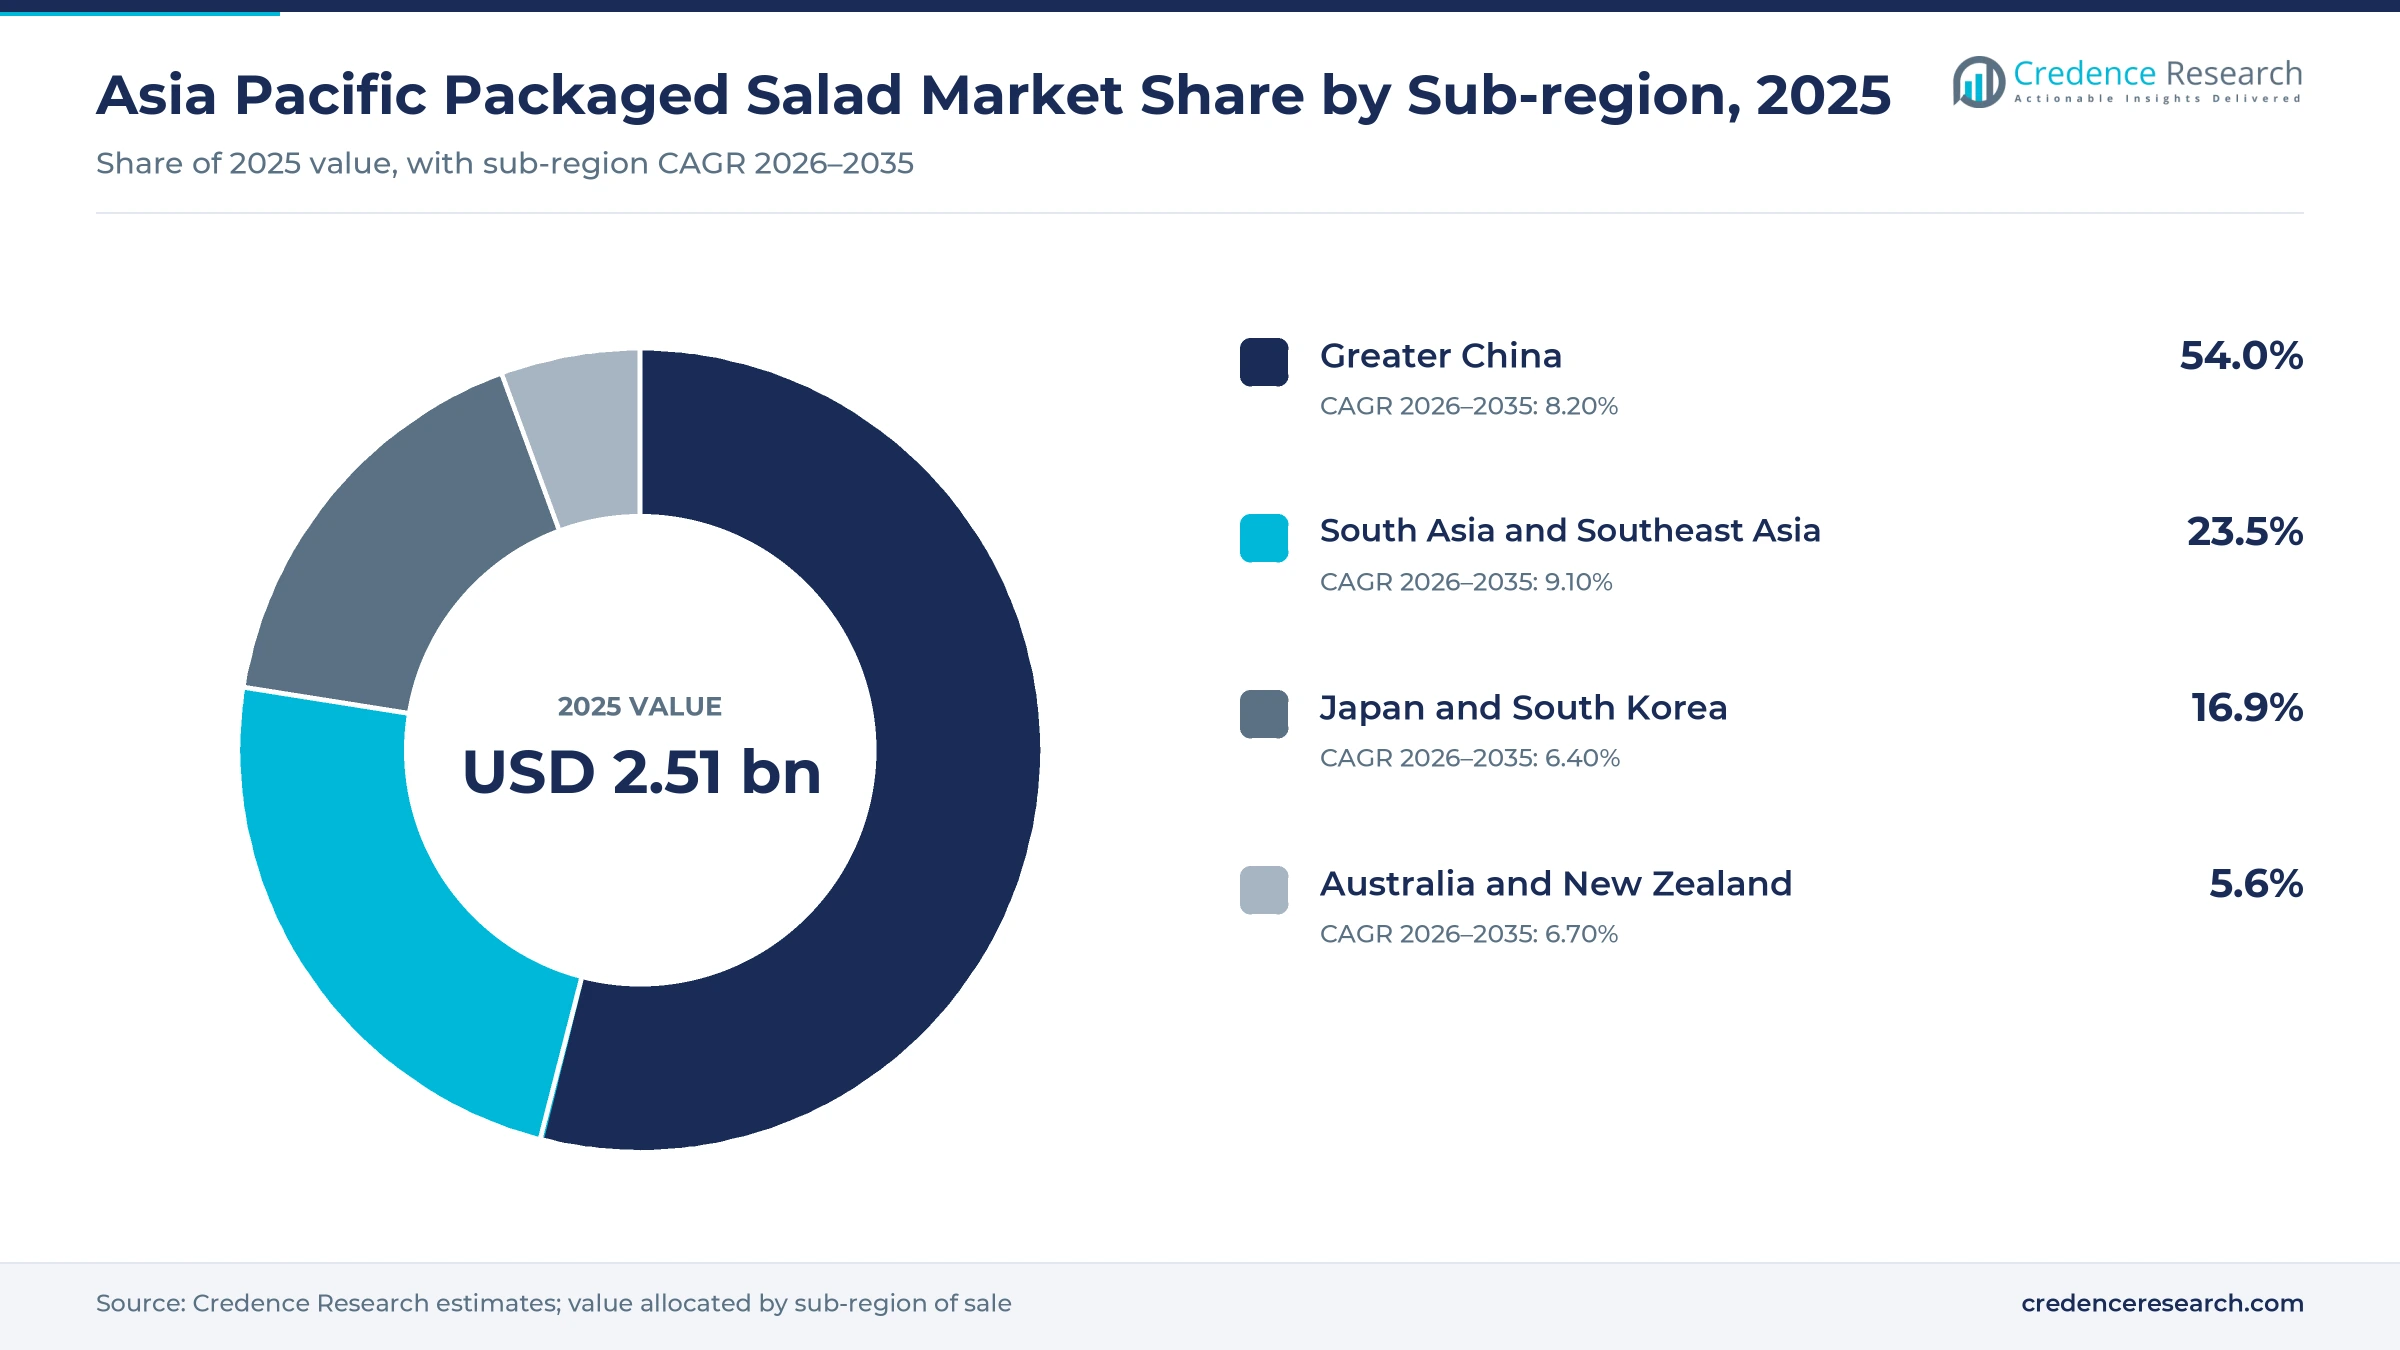
- Greater China held a 54.0% share of 2025 value, because its cities hold most of the region's chilled food buyers.
- Bagged salad led product demand with a 46.0% share of 2025 value, because single-leaf and mixed-leaf bags are the entry product.
- Salad Club began selling heat-processed broccoli in tray-top sealed packs on Dec. 3, 2025, its first use of that container.
- China's cold storage capacity reached 267 million cubic meters in 2025, up 5.53% from the year before, which widens chilled distribution.
Bagged leaves lead while salad kits grow fastest
Why do bagged leaves dominate product demand?
Based on product type, the market is categorized into bagged salad, salad kits, chopped salad mixes and fresh-cut vegetable salad bases. Bagged Salad led with a 46.0% share of 2025 value, because bags of spinach, rocket and mixed leaves are the cheapest way to start buying ready greens. Salad Kits grow fastest at 9.31% a year, as kits with dressings and toppings replace a full meal for office workers.
How do supermarkets anchor distribution?
Based on distribution channel, the market is categorized into supermarkets and specialty stores, convenience stores, online grocery and foodservice supply. Supermarkets and Specialty Stores led with a 58.0% share of 2025 value, because chilled shelves in large stores turn stock quickly. Online Grocery grows fastest at 10.22% a year, as app orders in China and Southeast Asia reach households through cold delivery.
Why do households account for most spending?
Based on customer type, the market is categorized into households, commercial foodservice buyers and institutional foodservice buyers. Households led with a 68.0% share of 2025 value, because most bags and kits are bought for home meals and lunch boxes. Commercial Foodservice Buyers grow fastest at 8.63% a year, as cafes and sandwich chains buy shredded lettuce and mixed leaves to cut kitchen labor.
How do flexible bags lead packaging formats?
Based on packaging format, the market is categorized into flexible bags and pouches, rigid bowls and trays and clamshell containers. Flexible Bags and Pouches led with a 57.0% share of 2025 value, because gas-flushed film bags are light and cheap to fill. Rigid Bowls and Trays grow fastest at 9.08% a year, as single-serve bowls and sealed trays suit convenience stores and ready-to-eat vegetable lines.
| Segment Group | Leading Sub-segment | Share, 2025 | Fastest-growing Sub-segment | CAGR, 2026–2035 |
|---|---|---|---|---|
| By Product Type | Bagged Salad | 46.0% | Salad Kits | 9.31% |
| By Distribution Channel | Supermarkets and Specialty Stores | 58.0% | Online Grocery | 10.22% |
| By Customer Type | Households | 68.0% | Commercial Foodservice Buyers | 8.63% |
| By Packaging Format | Flexible Bags and Pouches | 57.0% | Rigid Bowls and Trays | 9.08% |
Request a Free Sample
Fill in your details and we'll send you a free sample report.
- Sample data tables & charts
- Research methodology
Convenience, local processing and kit launches lift demand
How does convenient vegetable eating lift demand?
Busy households want to eat more vegetables without washing and cutting them, which makes ready greens a weekly purchase. In Australia, 90% of households bought fresh salad in the 52 weeks to Nov. 2, 2025, and buyers spent about A$108.29 each over the year, according to NielsenIQ Homescan data published by AUSVEG. Prepacked products took 98.0% of fresh salad dollar sales in major supermarkets in the same period. In Japan, Salad Club launched a seven-vegetable salad with kale on June 6, 2025, in a 100-gram bag priced at 235 yen. As a result, households hold a 68.0% share of 2025 value, while bagged salad leads products with 46.0%.
Why does distributed fresh-cut processing widen supply?
Processors now wash and pack greens close to farms and cities, which keeps short-life products fresh for more buyers. Salad Club receives and processes about 10 tons of vegetables a day at its Enshu factory, according to a company release dated Aug. 26, 2026. Rainbow Fresh grows on 300 acres at Lewiston in South Australia and washes and bags about 500 metric tons of lettuce and leaf blends a year, with products ready within 24 hours of harvest. Cut Fresh Salads, a division of Covino Farms, processes produce from farms in Victoria and Queensland and delivers it in refrigerated vehicles. In turn, commercial foodservice buyers grow at 8.63% a year, as caterers buy more prepared leaves.
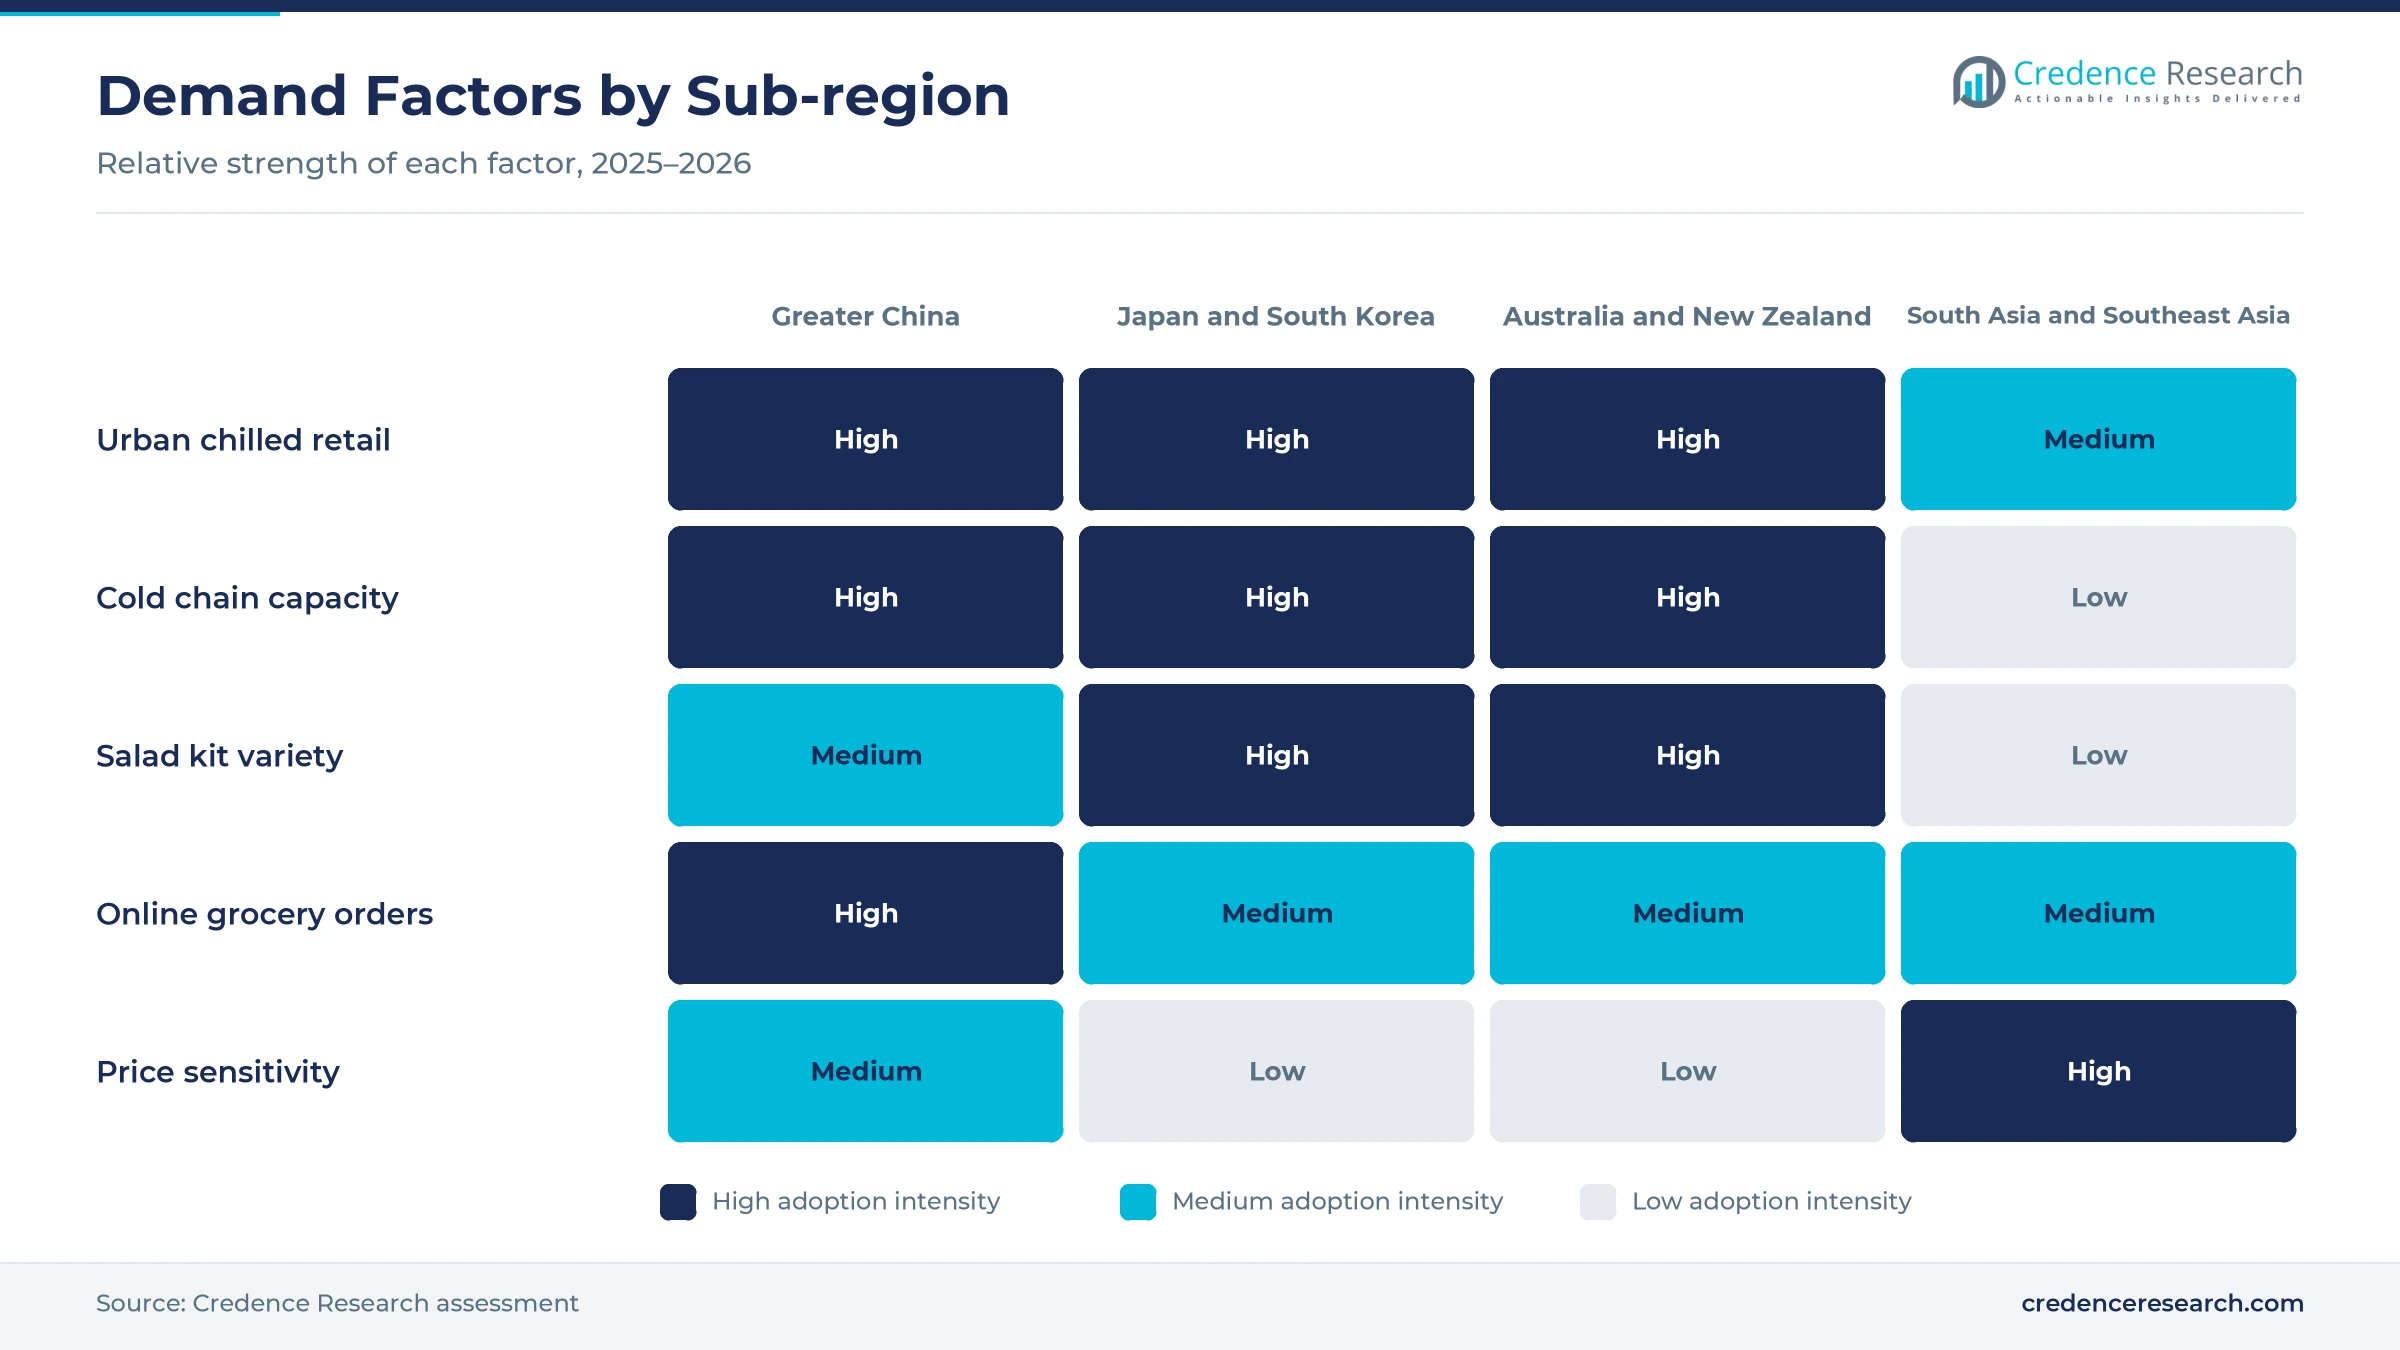
How does salad-kit assortment innovation raise spending?
Brands add new kits, flavors and formats, which lifts the spend per shopping trip and keeps buyers coming back. LeaderBrand launched a Mexican Salad and a Rocketslaw kit in New Zealand in November 2025, each with its own dressing. Salad Club also released a spring cabbage mix in March 2025 for a limited period, using cabbage from contract growers in Kanagawa, Miyazaki and Nagasaki. Kewpie said its salad-eating index for fiscal 2025 rose to 101% of the prior year, and it targets 105% by fiscal 2028. As a result, salad kits grow fastest among products at 9.31% a year, which lifts average spend per pack.
Why do urban growth and cold chains expand reach?
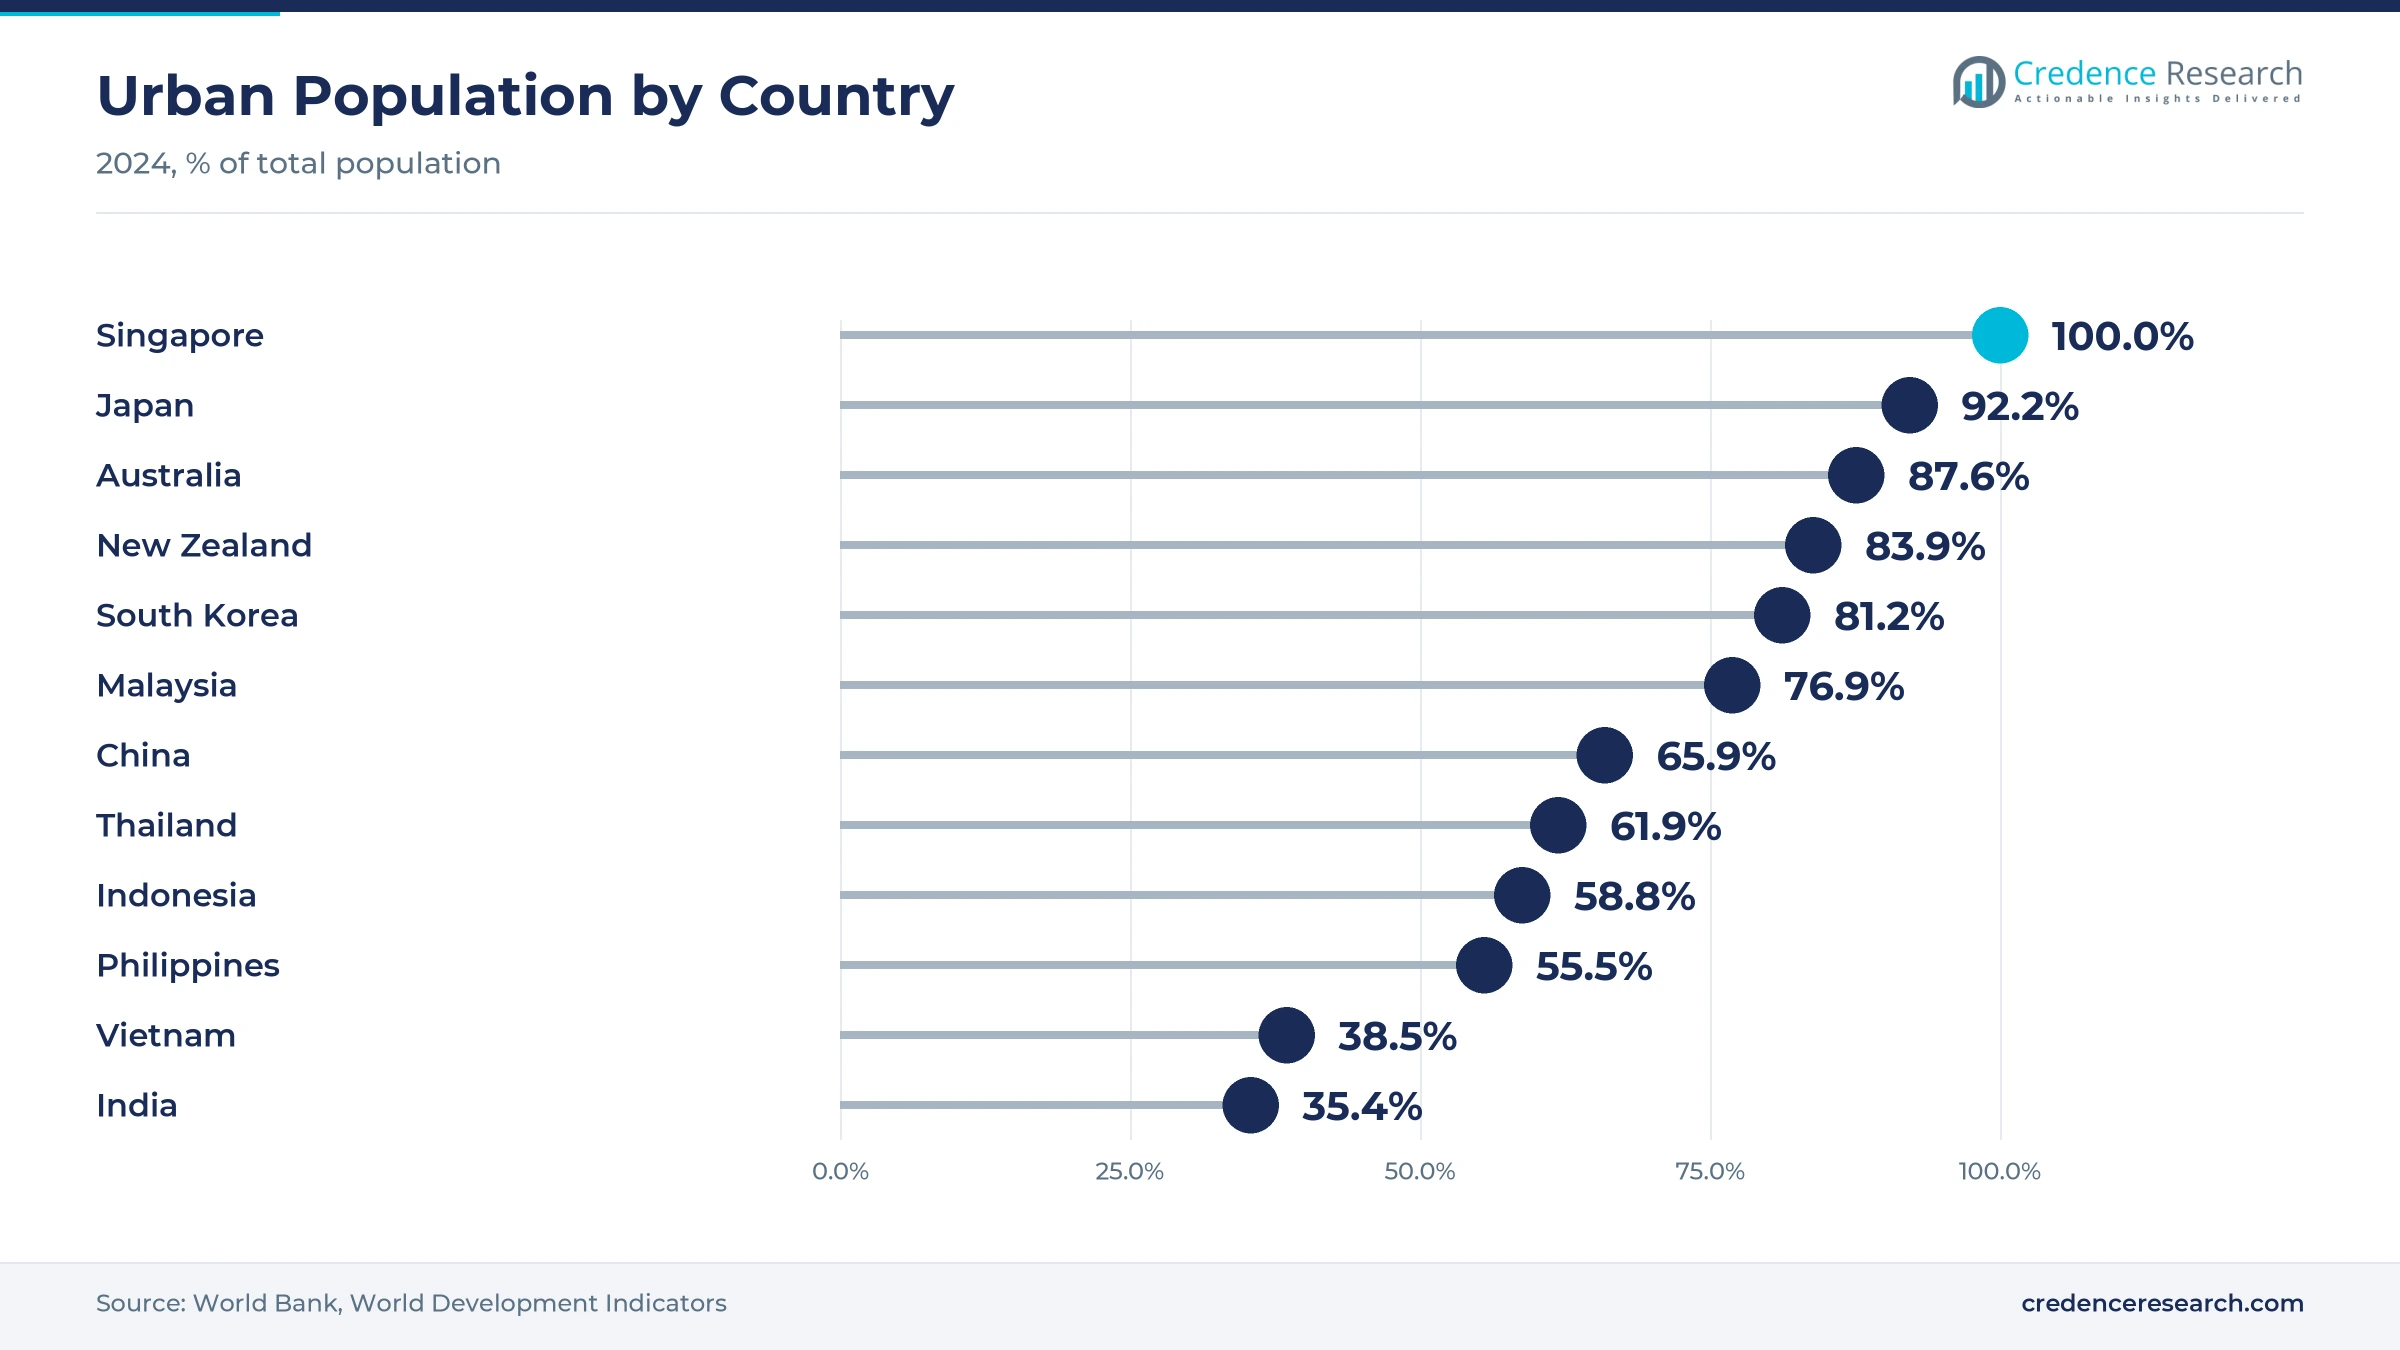
More people live in cities with chilled retail, which brings ready greens within reach of new buyers each year. Urban dwellers made up about 66% of China's population, 59% of Indonesia's and 38% of Vietnam's in 2024, according to World Bank data. China's cold chain logistics volume reached 381.4 million tons in 2025, up 4.5%, and cold storage capacity rose 5.53% to 267 million cubic meters. China's Ministry of Agriculture and Rural Affairs also added 12.5 million tons of farm-gate cold storage capacity between 2020 and 2022. In turn, chilled bags and kits reach more cities each year, supported by cold chain investment.
Cooked vegetable packs, app orders and indoor farms rise
How is the shift to cooked vegetable packs widening ranges?
Makers are moving beyond raw leaves into cooked vegetables that can be eaten straight from the pack. Salad Club began selling steamed and grilled broccoli made from domestic crops on Dec. 3, 2025, its first product in a tray-top sealed container. The company said the products are washed, cut and heat-processed, with a four-day consumption deadline. The company also said broccoli was expected to join the farm ministry's list of 14 designated vegetables in April 2026, which supports steady supply. As a result, rigid bowls and trays grow fastest among packaging formats at 9.08% a year, as convenience stores add more ready-to-eat vegetable lines.
Why are online grocery orders on the rise?
Shoppers increasingly order chilled food on apps, which suits short-life products that need fast delivery. China's online retail sales of physical goods reached 13,092.3 billion yuan in 2025, up 5.2%, and made up 26.1% of total retail sales of consumer goods, according to the National Bureau of Statistics. The country also handled 199.0 billion express deliveries in 2025, which builds the last-mile network that chilled goods need. Greengrocer and market channels in Australia grew fresh salad dollar sales by 7.9% in the year to November 2025, faster than major supermarkets. In turn, online grocery grows fastest among channels at 10.22% a year.
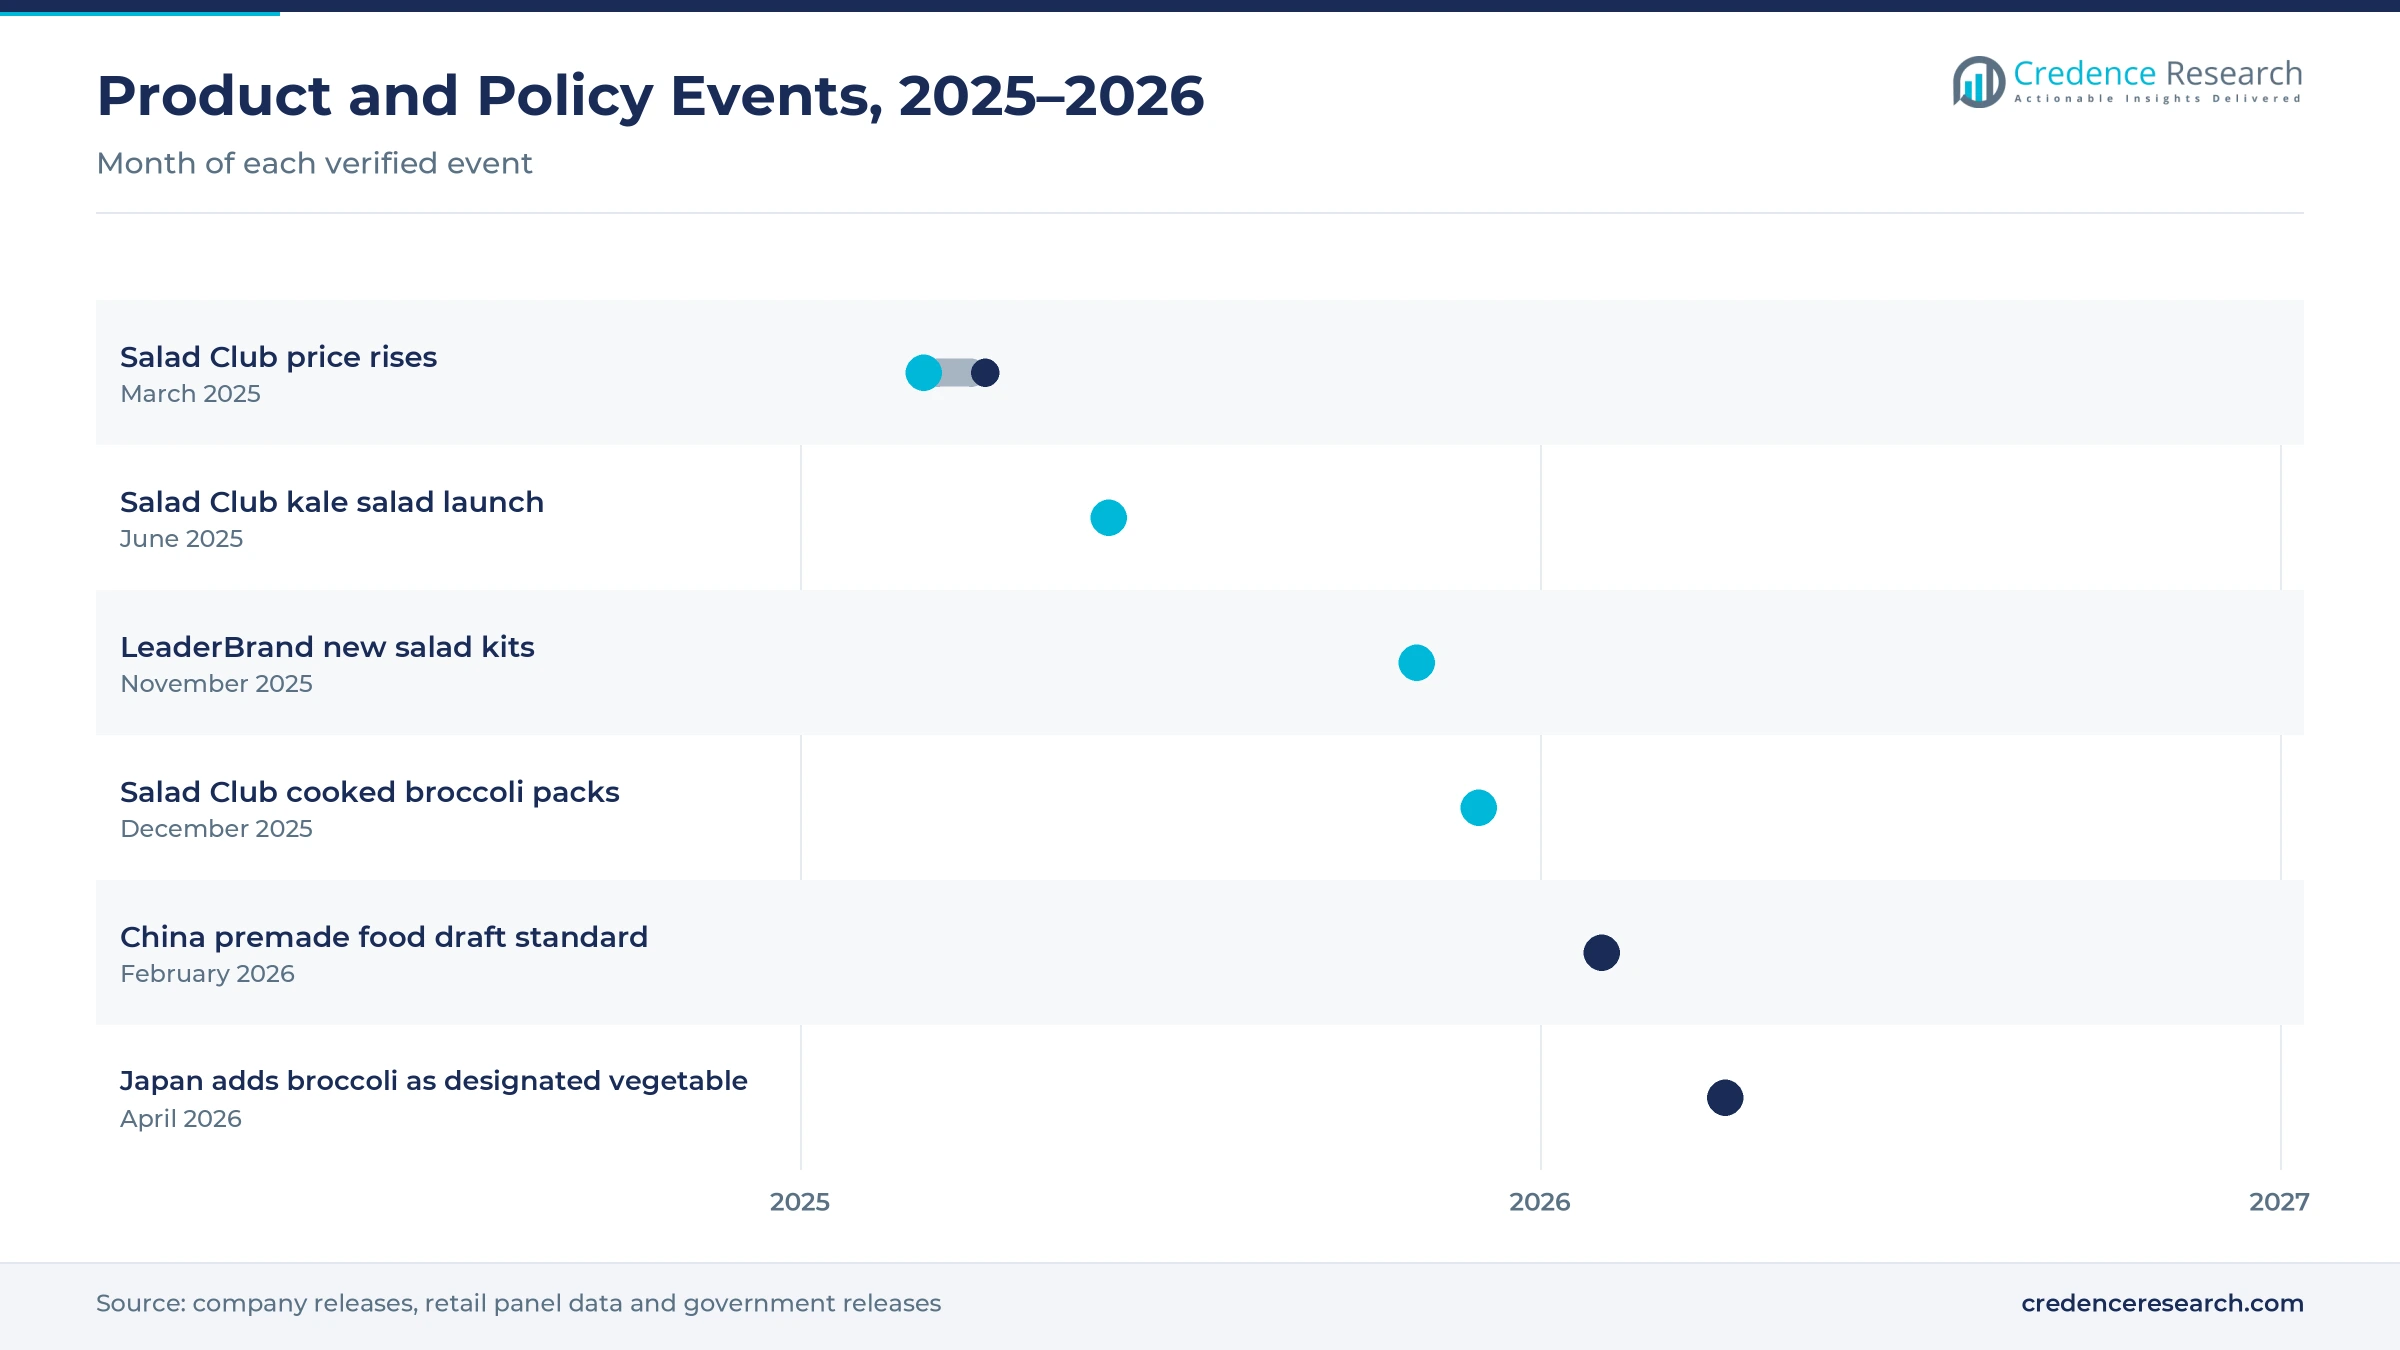
Can single-person households open a new market?
Smaller households need smaller packs, which opens room for single-serve bowls and kits in East Asia. South Korea counted 8.05 million single-person households at the end of 2024, or 36.1% of all households, according to its Welfare Ministry. Salad Club's national store network in Japan also gives single-serve packs a wide retail base. Single-serve bowls also suit lunch buyers who shop daily rather than weekly, which raises purchase frequency. Kewpie also plans to position salad as a more complete meal in its long-term plan. As a result, Japan and South Korea holds a 16.9% share of 2025 value, and convenience stores grow at a pace close to the market average.
Is there room for growth in local indoor-grown greens?
Indoor farms near cities can supply clean leaves year round, which gives processors steadier raw material. Singapore's vegetable farms reached a yield of 231.4 metric tons per hectare in 2024, up from 227.2 metric tons, according to the Singapore Food Agency. The agency also said several large indoor vertical farms will be set up and ramped up in 2025 and 2026. India's vegetable output reached an estimated 219.67 million metric tons in 2024-25, up 6%, which widens the supply base for fresh vegetables sold in cities. In turn, South Asia and Southeast Asia holds a 23.5% share of 2025 value and keeps gaining.
Crop shocks, short shelf life and food safety strain supply
How do crop shocks raise input costs?
Poor weather cuts cabbage and lettuce supply, which pushes up the cost of raw material for processors. Salad Club raised prices by 5% to 10% on 19 items from March 1, 2025, and added temporary rises of 20% to 30% on cabbage-based items. As a result, shoppers in Japan paid more for staple packs for several months. Makers respond by signing more contract growers in different climate zones and by using more of each vegetable. Kewpie, for example, used 84.3% of unused vegetable parts, mainly cabbage, in fiscal 2025 and targets at least 88% by fiscal 2028.
Why does short shelf life limit reach?
Cut leaves last only a few days, which limits how far a plant can ship its products. Salad Club's newer packs carry a four-day consumption deadline from the processing date. In turn, rural stores and smaller cities with weak cold chains often stock few lines. Processors respond with modified atmosphere packaging, smaller regional plants and daily deliveries to keep waste down. These steps raise costs, but they let products reach stores that are several hours from the nearest plant.
How do food safety risks affect trust?
Ready-to-eat greens are not cooked before eating, which makes any contamination a serious risk for brands. LeaderBrand recalled about 40 salad lines in New Zealand in March 2017 because some batches may have contained Listeria. As a result, retailers in the region demand strict washing, testing and traceability from suppliers. Processors respond with HACCP plans, regular testing and batch tracking. Cut Fresh Salads, for example, holds HACCP certification for its processing in Victoria, which reassures foodservice buyers.
Why does price sensitivity slow uptake in emerging markets?
Packed greens cost far more per kilogram than loose vegetables, which deters price-conscious shoppers. Fresh salad sold at about A$14.37 per kilogram in Australia in 2025, while all vegetables averaged A$5.90. In turn, buyers in India and Southeast Asia often choose loose produce from wet markets. Brands respond with value packs, private-label lines and larger bags for families. These options narrow the price gap, but they also squeeze margins for processors.
Greater China leads as South and Southeast Asia gain
| Sub-region | Value, 2025 (USD billion) | Share, 2025 | CAGR, 2026–2035 |
|---|---|---|---|
| Greater China | 1.36 | 54.0% | 8.20% |
| South Asia and Southeast Asia | 0.59 | 23.5% | 9.10% |
| Japan and South Korea | 0.42 | 16.9% | 6.40% |
| Australia and New Zealand | 0.14 | 5.6% | 6.70% |
How do cities and cold storage shape Chinese demand?
Greater China held a 54.0% share of 2025 value and grows at 8.20% a year, because its large cities contain most of the region's chilled food buyers. The urbanization rate of permanent residents in China reached 67.89% at the end of 2025. Cold storage capacity also rose to 267 million cubic meters in 2025, according to FreshPlaza, citing the China Federation of Logistics and Purchasing. As a result, chilled bags and bowls now reach supermarkets and app warehouses in many more cities.
Where does modern retail add the most new buyers?
South Asia and Southeast Asia held a 23.5% share of 2025 value and grows fastest at 9.10% a year, because modern retail and cold storage are spreading in large cities. India's vegetable output reached an estimated 219.67 million metric tons in 2024-25, up 6%. Singapore also expects new indoor vertical farms to ramp up in 2025 and 2026, which adds local leaf supply. However, low prices for loose produce in wet markets still limit uptake outside high-income urban areas.
What keeps Japanese and Korean demand steady?
Japan and South Korea held a 16.9% share of 2025 value and grows at 6.40% a year, because ready greens are already a regular purchase in Japan. Salad Club sells in about 18,200 stores and holds the largest value share of Japan's market. South Korea adds demand from 8.05 million single-person households that prefer small packs. In turn, growth here comes more from new formats, such as cooked vegetable packs, than from new buyers.
What shapes supermarket-led demand in Australia and New Zealand?
Australia and New Zealand held a 5.6% share of 2025 value and grows at 6.70% a year, because major supermarkets sell most bags and kits. Major supermarkets took 87.6% of Australian fresh salad dollar sales in the year to November 2025. LeaderBrand and Southern Fresh Foods supply New Zealand from growing bases in the North Island.
Launches, price revisions and policy moves, 2025 to 2026
| Development | Status and market relevance |
|---|---|
| In January 2025, Salad Club announced price rises of 5% to 10% on 19 packaged salad items from March 1, 2025. | Passes higher cabbage, lettuce and labor costs to buyers |
| In June 2025, Salad Club launched a seven-vegetable salad with kale in a 100-gram bag. | Adds a nutrition-led product to its range |
| In November 2025, LeaderBrand launched a Mexican Salad and a Rocketslaw kit in New Zealand. | Widens kit choice in New Zealand supermarkets |
| In December 2025, Salad Club began selling heat-processed broccoli in tray-top sealed packs. | Moves the company into ready-to-eat cooked vegetables |
| In February 2026, China's National Health Commission released a draft premade food standard that excludes fresh-cut vegetables. | Leaves fresh-cut products under existing food safety standards |
Gas flushing, cold chains and sealed trays extend shelf life
- Mixed-gas filling replaces the air in a bag with a gas blend that slows browning, which Salad Club co-developed with Kewpie.
- Cold chain networks keep products at low temperatures from plant to shelf, which lets makers reach more cities each year.
- Tray-top sealing closes rigid trays with a film lid, which suits cooked vegetables and single-serve bowls.
- Wash and dry lines clean and spin leaves in automated produce processing equipment, which cuts labor and lowers the risk of contamination.
Need a Custom Version of This Report?
Tailor the scope, geography, or segments to your exact requirements.
- Custom geography or segment scope
- Direct access to our analyst team
Growers compete on contract farms, plants and retail ties
Competition in the region combines a large Japanese leader, family-owned growers in Australia and New Zealand, and many local fresh-cut processors that supply Chinese cities. Salad Club, a joint venture of Kewpie Corporation and Mitsubishi Corporation, holds the largest value share in Japan and sells in about 18,200 stores. Kewpie supports it with freshness research and its own cut vegetable business. In Australia, Rainbow Fresh supplies Foodland, Drakes and IGA stores in South Australia, while Cut Fresh Salads serves foodservice buyers from Laverton North in Victoria. LeaderBrand and Southern Fresh Foods compete in New Zealand with kits, baby leaves and herbs. Companies compete on access to contract farms, plant locations near cities, cold chain reach and retail ties. Private labels also matter, because supermarkets in Australia sell many bags under their own brands.
Companies profiled and their roles in this market
| Company | Type | Role in the market |
|---|---|---|
| Kewpie Corporation (Salad Club) | Processor and brand owner | Holds the largest value share of packaged salad in Japan |
| Rainbow Fresh | Grower and packer | Washes and bags about 500 metric tons of leaves a year in South Australia |
| Cut Fresh Salads | Processor | Supplies processed produce from Victoria and Queensland farms |
| LeaderBrand | Grower and processor | Launched new salad kits in New Zealand in November 2025 |
| Southern Fresh Foods | Grower and processor | Grows and processes baby vegetables, salads and herbs in Waikato |
Credence Research view on ready-to-eat greens in the region
Credence Research's view is that ready greens will keep growing in the Asia Pacific region because more urban households want vegetables that need no preparation. Bagged salad stays the largest product, while kits grow fastest as brands add dressings and toppings. Greater China keeps the largest share, and South Asia and Southeast Asia grow fastest as cold chains spread. However, crop shocks, short shelf life and price sensitivity will slow some makers. Processors that combine contract farms with plants near cities should gain share fastest.
How the regional ready-to-eat greens estimate was built
The report uses 2025 as the base year on a calendar basis, and market values come from the Credence Research model. That model combines retail panel data, urban population statistics, cold chain capacity, vegetable output and company information on stores, plants and product launches. Segment splits and sub-regional growth rates are Credence Research estimates, while sub-regional shares follow the client-defined split. Sources used are official statistics, industry body data, company releases and trade news, and no interviews or surveys were used.
Cold chains and kit variety carry growth to 2035
Regional value is expected to reach USD 5.48 billion by 2035, an 8.05% CAGR during 2026–2035, as more households and caterers buy ready greens. Growth should be strongest in South Asia and Southeast Asia, where cold storage and modern retail are still spreading. Japan will add value through cooked vegetable packs and single-serve formats rather than new buyers. Australia and New Zealand will grow mainly through kits and private-label lines in supermarkets. Faster cold chain investment would raise this outlook, while repeated crop failures would lower it.
Frequently Asked Questions
How big is the Asia Pacific packaged salad market?
Which product type leads regional demand?
Which sub-region leads the regional market?
Why does online grocery grow fastest among channels?
How do cold chains affect the market?
Which packaging format leads the market?
Who are the leading companies in the region?
What are the main challenges for makers?
Table of Content
Chapter 1 Market Segmentation
- 1.1 Segmentation Framework
- 1.1.1 Product and Service Classification
- 1.1.2 Application and End-Use Classification
- 1.1.3 Technology and Solution Classification
- 1.1.4 Customer and Distribution Channel Classification
- 1.1.5 Geographic Segmentation
- 1.1.6 Market Segment Definitions and Boundaries
- 1.2 By Product Type
- 1.2.1 Bagged Salad
- 1.2.2 Salad Kits
- 1.2.3 Chopped Salad Mixes
- 1.2.4 Fresh-Cut Vegetable Salad Bases
- 1.3 By Customer Type
- 1.3.1 Households
- 1.3.2 Commercial Foodservice Buyers
- 1.3.3 Institutional Foodservice Buyers
- 1.4 By Packaging Format
- 1.4.1 Flexible Bags and Pouches
- 1.4.2 Rigid Bowls and Trays
- 1.4.3 Clamshell Containers
- 1.5 By Sub-region
- 1.5.1 Greater China
- 1.5.2 Japan and South Korea
- 1.5.3 Australia and New Zealand
- 1.5.4 South Asia and Southeast Asia
Chapter 2 Introduction
- 2.1 Report Objectives and Scope
- 2.2 Product Definition and Industry Terminology
- 2.3 Market Inclusions and Exclusions
- 2.4 Research Process
- 2.4.1 Primary Research and Expert Interviews
- 2.4.2 Secondary Research and Source Review
- 2.4.3 Top-Down and Bottom-Up Estimation
- 2.4.4 Data Triangulation and Verification
- 2.5 Market Size Measurement Basis
- 2.5.1 2025: USD 2.51 billion → 2035: USD 5.48 billion
- 2.6 Historical and Forecast Reference Periods
- 2.6.1 Historical Period: 2018-2025
- 2.6.2 Base Year: 2025
- 2.6.3 Forecast Period: 2025-2035
- 2.7 Research Assumptions and Limitations
Chapter 3 Executive Summary
- 3.1 Market Snapshot and Key Findings
- 3.2 Base-Year Market Size, 2025
- 3.3 Forecast Market Size, 2035
- 3.4 Revenue and Volume Growth Outlook
- 3.5 Key Demand and Supply Indicators
- 3.6 Leading Market Segments
- 3.7 Fastest-Growing Market Opportunities
- 3.8 Regional Performance Highlights
- 3.9 Technology and Industry Transformation
- 3.10 Competitive Landscape Summary
- 3.11 Analyst View and Strategic Implications
Chapter 4 Asia Pacific Packaged Salad Market Trends and Developments
- 4.1 Historical Industry Development, 2018-2025
- 4.2 Recent Market Trends and Developments
- 4.3 Demand and Customer Behavior Trends
- 4.4 Technology and Product Innovation
- 4.5 Artificial Intelligence, Automation and Digitalization
- 4.6 Local Manufacturing and Supply Chain Realignment
- 4.7 Industry Partnerships, Mergers and Acquisitions
- 4.8 Sustainability and Circular Economy Developments
- 4.9 Government and Private Sector Investment Trends
- 4.10 Emerging Business Models and Commercialization
- 4.11 Industry Developments and Announcements
Chapter 5 Asia Pacific Packaged Salad Market Production, Supply and Demand Analysis
- 5.1 Demand Trend and Consumption Analysis, 2018-2025
- 5.2 Demand Forecast, 2025-2035
- 5.3 Production and Output Trend, 2018-2025
- 5.4 Production and Output Forecast, 2025-2035
- 5.5 Installed Capacity and Capacity Utilization
- 5.6 Company-Wise Production Plants and Statistics
- 5.6.1 Installed Production Capacity
- 5.6.2 Actual Production
- 5.6.3 Planned Capacity and Expansion Targets
- 5.7 Supply Chain Structure and Procurement Trends
- 5.8 Supply-Demand Gap and Bottlenecks
- 5.9 Import Dependence and Sourcing Structure
- 5.10 Contract Manufacturing and Outsourcing
- 5.11 Regional Supply and Demand Concentration
Chapter 6 Asia Pacific Packaged Salad Market Pricing Analysis
- 6.1 Pricing Structure and Measurement
- 6.2 Historical Pricing Trends, 2018-2025
- 6.3 Pricing Outlook, 2025-2035
- 6.4 Average Selling Price and Unit Economics
- 6.5 Pricing by Product and Market Segment
- 6.6 Geographic Pricing Differences
- 6.7 Key Input, Energy, Labor and Logistics Costs
- 6.8 Contract Pricing and Purchasing Models
- 6.9 Pricing Sensitivity and Competitive Positioning
- 6.10 Price, Margin and Profitability Implications
Chapter 7 Asia Pacific Packaged Salad Market Dynamics
- 7.1 Market Growth Drivers
- 7.1.1 Demand-Side Drivers
- 7.1.2 Technology and Innovation Drivers
- 7.1.3 Infrastructure and Investment Drivers
- 7.1.4 Regulatory and Policy Drivers
- 7.2 Market Restraints
- 7.2.1 Cost and Affordability Constraints
- 7.2.2 Technology and Adoption Barriers
- 7.2.3 Supply Chain and Operational Constraints
- 7.3 Market Challenges
- 7.3.1 Competitive Pressure and Margin Erosion
- 7.3.2 Skills, Infrastructure and Implementation Gaps
- 7.4 Emerging Market Opportunities
- 7.5 Market Dynamics Impact and Time-Horizon Assessment
Chapter 8 Asia Pacific Packaged Salad Value Chain Analysis
- 8.1 Industry Value Chain Overview
- 8.2 Upstream Suppliers and Critical Inputs
- 8.3 Technology and Component Providers
- 8.4 Manufacturing or Service Delivery
- 8.5 Distribution, Channel Partners and Integrators
- 8.6 Downstream Applications and End Users
- 8.7 Value Addition and Profit Pools
- 8.8 Vertical Integration and Outsourcing
- 8.9 Supplier Concentration and Risk
- 8.10 Supply Chain Localization and Resilience
Chapter 9 Asia Pacific Packaged Salad Market Regulations and Policies
- 9.1 Relevant Laws, Standards and Compliance Frameworks
- 9.2 Product, Service, Safety and Quality Requirements
- 9.3 Government Policies, Incentives and Subsidies
- 9.4 Imports, Exports and Trade Barriers
- 9.5 Public Procurement and Local Content Requirements
- 9.6 Environmental and Sustainability Compliance
- 9.7 Upcoming Policy Changes and Market Implications
Chapter 10 Asia Pacific Packaged Salad Market Hotspots and Opportunities
- 10.1 Market Opportunity Mapping and Growth Hotspots
- 10.2 High-Growth Applications and Customer Groups
- 10.3 Underserved Markets and White-Space Opportunities
- 10.4 Emerging Technology and Product Opportunities
- 10.5 New Capacity and Investment Hotspots
- 10.6 Market Entry and Expansion Opportunities
- 10.7 Distribution and Partnership Opportunities
- 10.8 Near-Term and Long-Term Commercial Potential
- 10.9 Opportunity Attractiveness and Execution Risks
Chapter 11 Asia Pacific Packaged Salad Market Outlook, 2025-2035
- 11.1 Market Size and Analysis
- 11.1.1 Revenue (Market Measurement: 2025: USD 2.51 billion → 2035: USD 5.48 billion)
- 11.1.2 Market Volume and Quantity Sold
- 11.1.3 Historical Market Size, 2018-2025
- 11.1.4 Base-Year Market Size, 2025
- 11.2 Market Forecast, 2025-2035
- 11.2.1 Revenue Forecast to 2035
- 11.2.2 Volume Forecast to 2035
- 11.2.3 CAGR and Year-on-Year Growth
- 11.2.4 Incremental Revenue Opportunity
- 11.3 Forecast Assumptions and Scenario Analysis
- 11.3.1 Base-Case Forecast
- 11.3.2 Optimistic and Conservative Scenarios
- 11.3.3 Technology, Pricing and Policy Sensitivities
- 11.4 Market Attractiveness and Growth Outlook
Chapter 12 Asia Pacific Packaged Salad Market Segmentation and Outlook
- 12.1 Segmentation Summary and Market Shares, 2025
- 12.2 Largest and Fastest-Growing Segments
- 12.3 By Product Type - Market Size and Forecast, 2025-2035
- 12.3.1 Segment Definition and Scope
- 12.3.2 Historical Market Size, 2018-2025
- 12.3.3 Revenue Forecast, 2025-2035
- 12.3.4 Volume Forecast, 2025-2035
- 12.3.5 Base-Year Market Share, 2025
- 12.3.6 Segment CAGR and Growth Drivers
- 12.3.7 Subsegment Market Size and Forecast
- 12.3.7.1 Bagged Salad
- 12.3.7.2 Salad Kits
- 12.3.7.3 Chopped Salad Mixes
- 12.3.7.4 Fresh-Cut Vegetable Salad Bases
- 12.3.8 Subsegment Pricing and Adoption Trends
- 12.3.9 Leading Suppliers and Competition
- 12.3.10 Regional Demand and Opportunities
- 12.4 By Customer Type - Market Size and Forecast, 2025-2035
- 12.4.1 Segment Definition and Scope
- 12.4.2 Historical Market Size, 2018-2025
- 12.4.3 Revenue Forecast, 2025-2035
- 12.4.4 Volume Forecast, 2025-2035
- 12.4.5 Base-Year Market Share, 2025
- 12.4.6 Segment CAGR and Growth Drivers
- 12.4.7 Subsegment Market Size and Forecast
- 12.4.7.1 Households
- 12.4.7.2 Commercial Foodservice Buyers
- 12.4.7.3 Institutional Foodservice Buyers
- 12.4.8 Subsegment Pricing and Adoption Trends
- 12.4.9 Leading Suppliers and Competition
- 12.4.10 Regional Demand and Opportunities
- 12.5 By Packaging Format - Market Size and Forecast, 2025-2035
- 12.5.1 Segment Definition and Scope
- 12.5.2 Historical Market Size, 2018-2025
- 12.5.3 Revenue Forecast, 2025-2035
- 12.5.4 Volume Forecast, 2025-2035
- 12.5.5 Base-Year Market Share, 2025
- 12.5.6 Segment CAGR and Growth Drivers
- 12.5.7 Subsegment Market Size and Forecast
- 12.5.7.1 Flexible Bags and Pouches
- 12.5.7.2 Rigid Bowls and Trays
- 12.5.7.3 Clamshell Containers
- 12.5.8 Subsegment Pricing and Adoption Trends
- 12.5.9 Leading Suppliers and Competition
- 12.5.10 Regional Demand and Opportunities
- 12.6 By Sub-region - Market Size and Forecast, 2025-2035
- 12.6.1 Segment Definition and Scope
- 12.6.2 Historical Market Size, 2018-2025
- 12.6.3 Revenue Forecast, 2025-2035
- 12.6.4 Volume Forecast, 2025-2035
- 12.6.5 Base-Year Market Share, 2025
- 12.6.6 Segment CAGR and Growth Drivers
- 12.6.7 Subsegment Market Size and Forecast
- 12.6.7.1 Greater China
- 12.6.7.2 Japan and South Korea
- 12.6.7.3 Australia and New Zealand
- 12.6.7.4 South Asia and Southeast Asia
- 12.6.8 Subsegment Pricing and Adoption Trends
- 12.6.9 Leading Suppliers and Competition
- 12.6.10 Regional Demand and Opportunities
- 12.7 Segment Growth Comparison
- 12.8 Segment Attractiveness and Priority Matrix
Chapter 13 Asia Pacific Packaged Salad End-Use and Application Market Outlook
- 13.1 End-Use Industry and Customer Demand Structure
- 13.2 Leading Applications and Customer Groups
- 13.3 End-Use Market Size, Share and Forecast
- 13.4 Major End-Use Industry Deep Dives
- 13.4.1 Customer Requirements and Use Cases
- 13.4.2 Demand and Replacement Cycles
- 13.4.3 Technical and Regulatory Considerations
- 13.4.4 Purchasing and Procurement Models
- 13.4.5 Leading Vendors and Distribution Channels
- 13.4.6 Forecast and Commercial Opportunities
- 13.5 Emerging Applications and Cross-Segment Demand
- 13.6 End-Use Industry Investment Priorities
Chapter 14 Asia Pacific Packaged Salad Geographic Market Outlook, 2025-2035
- 14.1 Regional Market Size and Country-Level Shares, 2025
- 14.2 Country Market Size Comparison, 2025
- 14.3 Country Market Forecasts, 2025-2035
- 14.4 Subregional Industrial and Demand Clusters
- 14.5 Intra-Regional Pricing and Cost Differences
- 14.6 Cross-Border Trade and Supply Networks
- 14.7 Regional Supply and Demand Balances
- 14.8 Country Opportunity Comparison and Prioritization
Note: Every listed country is covered on the structure shown under the first country.
Chapter 15 Asia Pacific Packaged Salad Technology, Innovation and Sustainability Outlook
- 15.1 Technology Landscape and Maturity
- 15.2 Product, Process and Service Innovation
- 15.3 AI, Automation and Digital Tools in the Industry
- 15.4 Technology Adoption and Performance Benchmarking
- 15.5 Innovation Pipeline and R&D Investment
- 15.6 Patent and Intellectual Property Trends
- 15.7 Energy Efficiency and Resource Management
- 15.8 Sustainability, Recycling and Circularity
- 15.9 Technology Roadmap, 2025-2035
- 15.10 Risks of Obsolescence and Technology Substitution
Chapter 16 Asia Pacific Packaged Salad Market Key Strategic Imperatives
- 16.1 Growth and Market Entry Priorities
- 16.2 High-Return Products and Segments
- 16.3 Pricing, Profitability and Cost Optimization
- 16.4 Technology Investment and Product Differentiation
- 16.5 Supply Chain Localization and Resilience
- 16.6 Distribution and Customer Acquisition
- 16.7 Partnership, Acquisition and Capacity Strategy
- 16.8 Regional Expansion Priorities
- 16.9 Short-, Medium- and Long-Term Actions
Chapter 17 Competition Outlook
- 17.1 Industry Competition Characteristics
- 17.2 Market Structure and Concentration
- 17.3 Market Share and Competitive Positioning, 2025
- 17.4 Company-Wise Revenue and Product Benchmarking
- 17.5 Production and Service Capacity Benchmarking
- 17.6 Technology, Pricing and Differentiation
- 17.7 Regional Footprint and Distribution Strength
- 17.8 Mergers, Acquisitions and Strategic Alliances
- 17.9 New Entrants and Competitive Threats
- 17.10 Porter's Five Forces and Industry Attractiveness
- 17.11 Competitive Outlook, 2025-2035
Chapter 18 Company Profiles
- 18.1 Company Coverage and Selection Criteria
- 18.2 Kewpie Corporation
- 18.2.1 Business Description
- 18.2.2 Company Ownership and Geographic Presence
- 18.2.3 Product and Service Portfolio
- 18.2.4 Manufacturing and Operating Footprint
- 18.2.5 Production Capacity and Expansion Plans
- 18.2.6 Financial Performance and Investment
- 18.2.7 Market Share and Competitive Position
- 18.2.8 Technology and Innovation Capabilities
- 18.2.9 Strategic Alliances or Partnerships
- 18.2.10 Recent Developments
- 18.2.11 Growth Strategy and Outlook
- 18.3 Rainbow Fresh
- 18.4 LeaderBrand
- 18.5 Southern Fresh Foods
- 18.6 Cut Fresh Salads
- 18.7 Other Relevant Market Participants
Note: Every listed company is profiled on the structure shown under the first company. The company list is preliminary and may change based on research findings, market developments, data availability and client requirements.
Chapter 19 Disclaimer
- 19.1 Research and Forecast Disclaimer
- 19.2 Data Source and Estimation Limitations
Note: The depth of individual sections depends on data availability for this market. Volume, capacity, trade and other unit-based metrics are included where applicable.

