
Bottled jasmine tea anchors Indonesian daily drinking
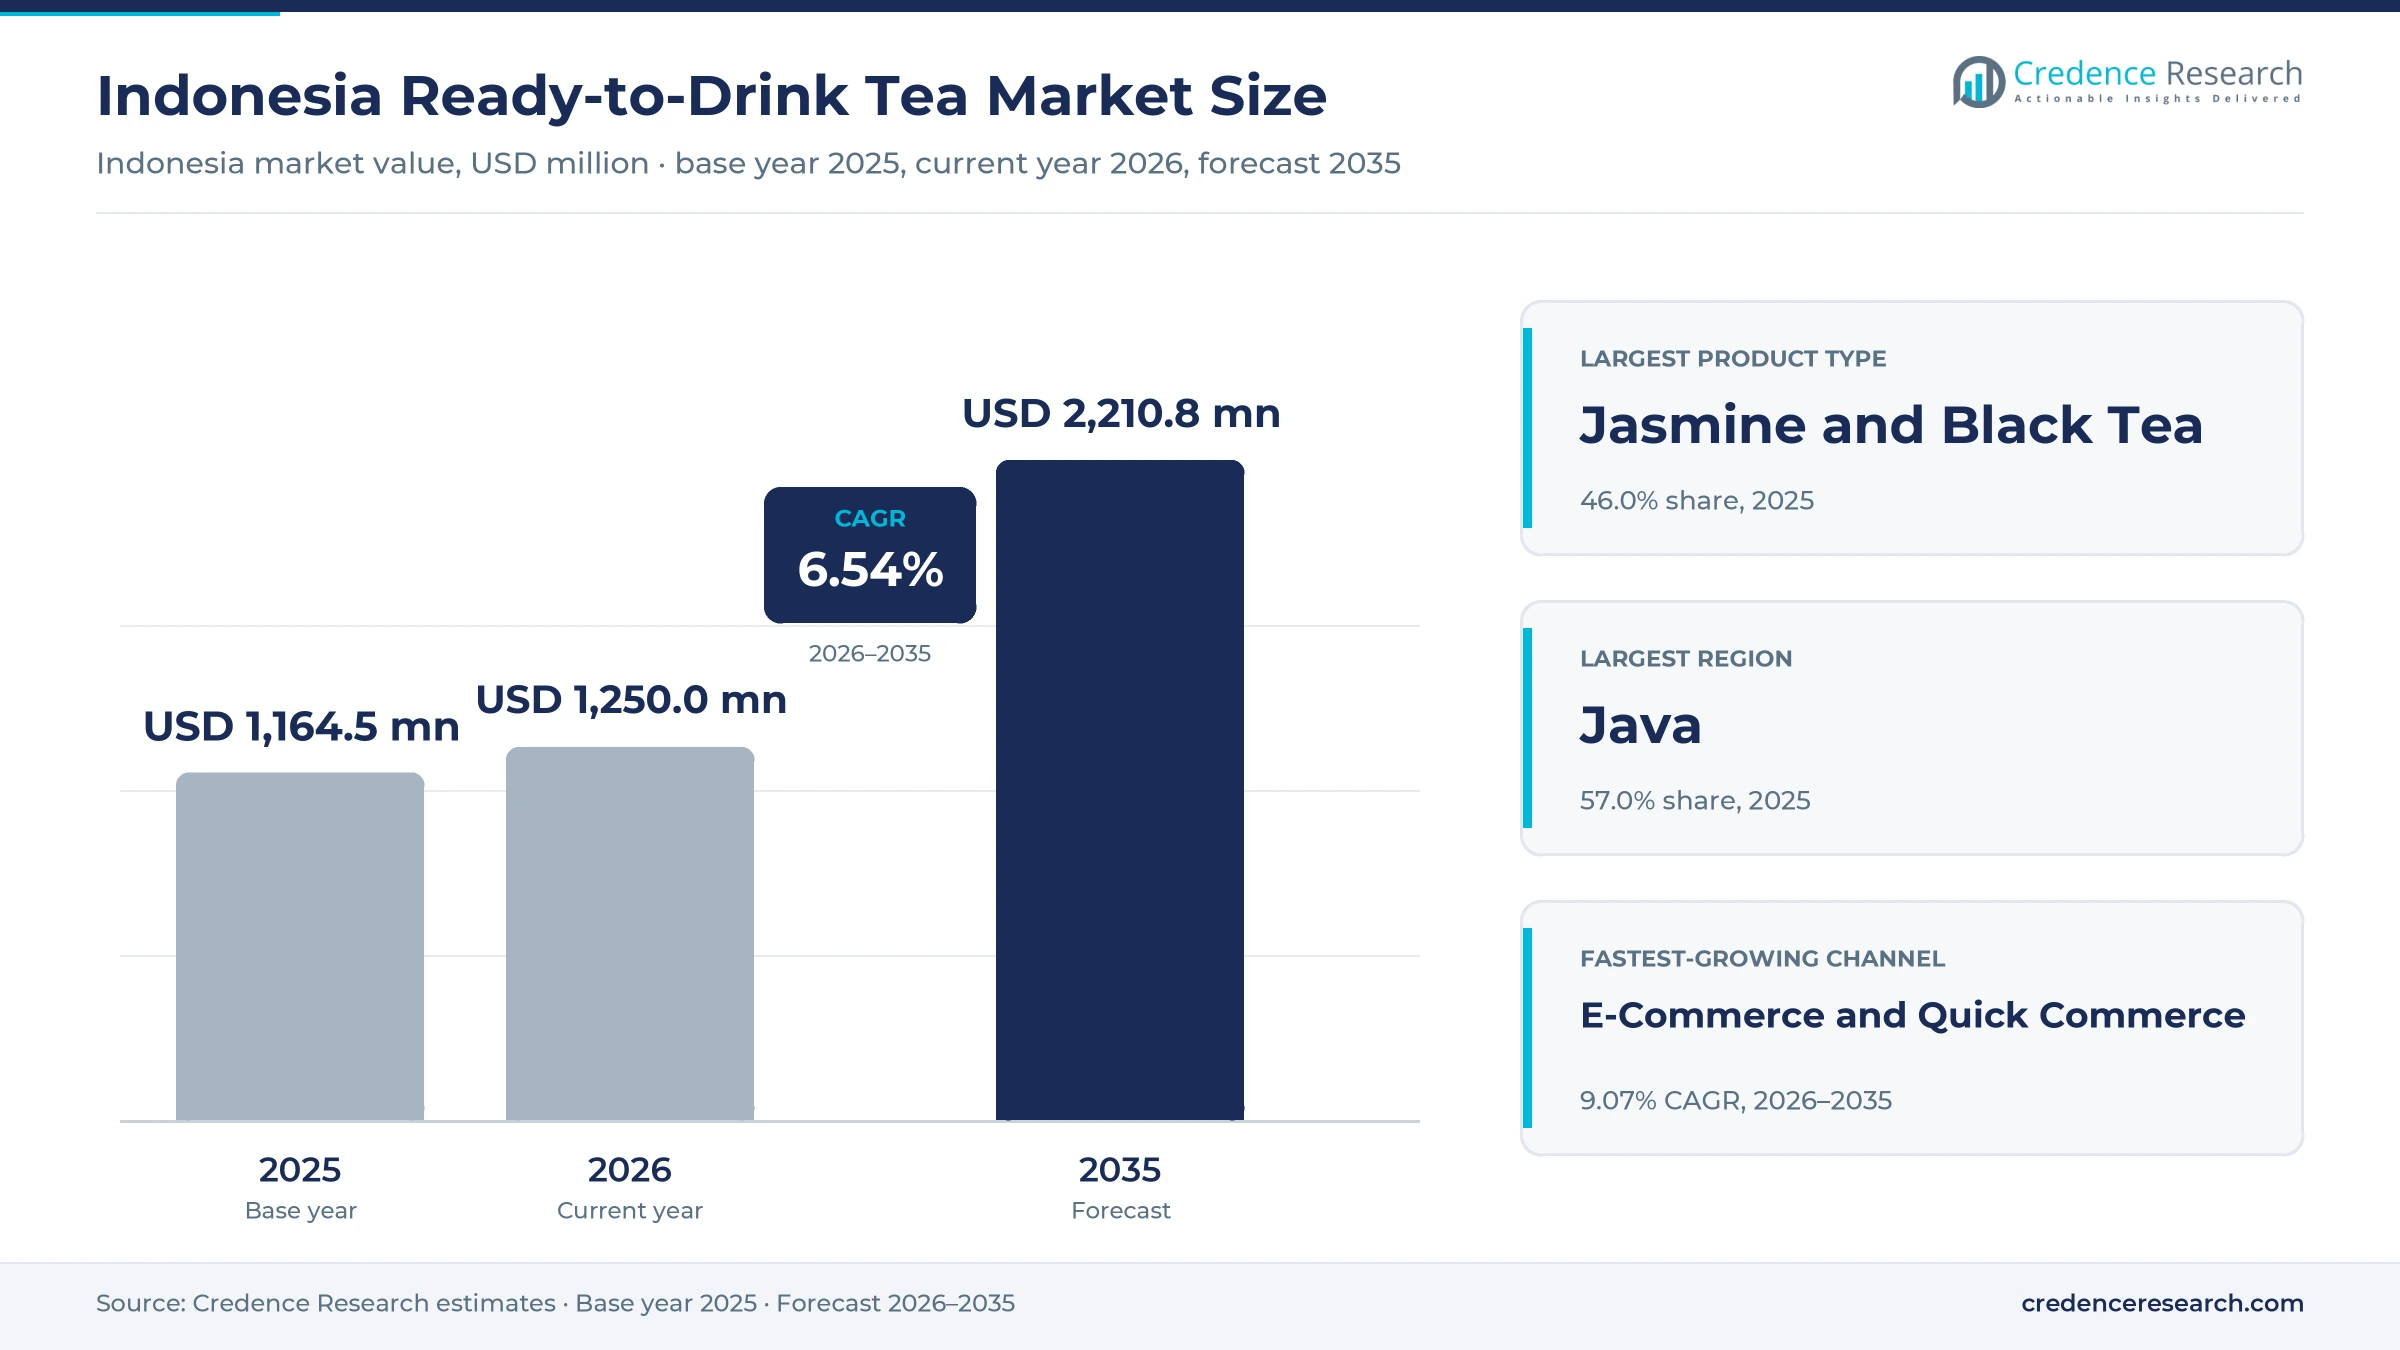
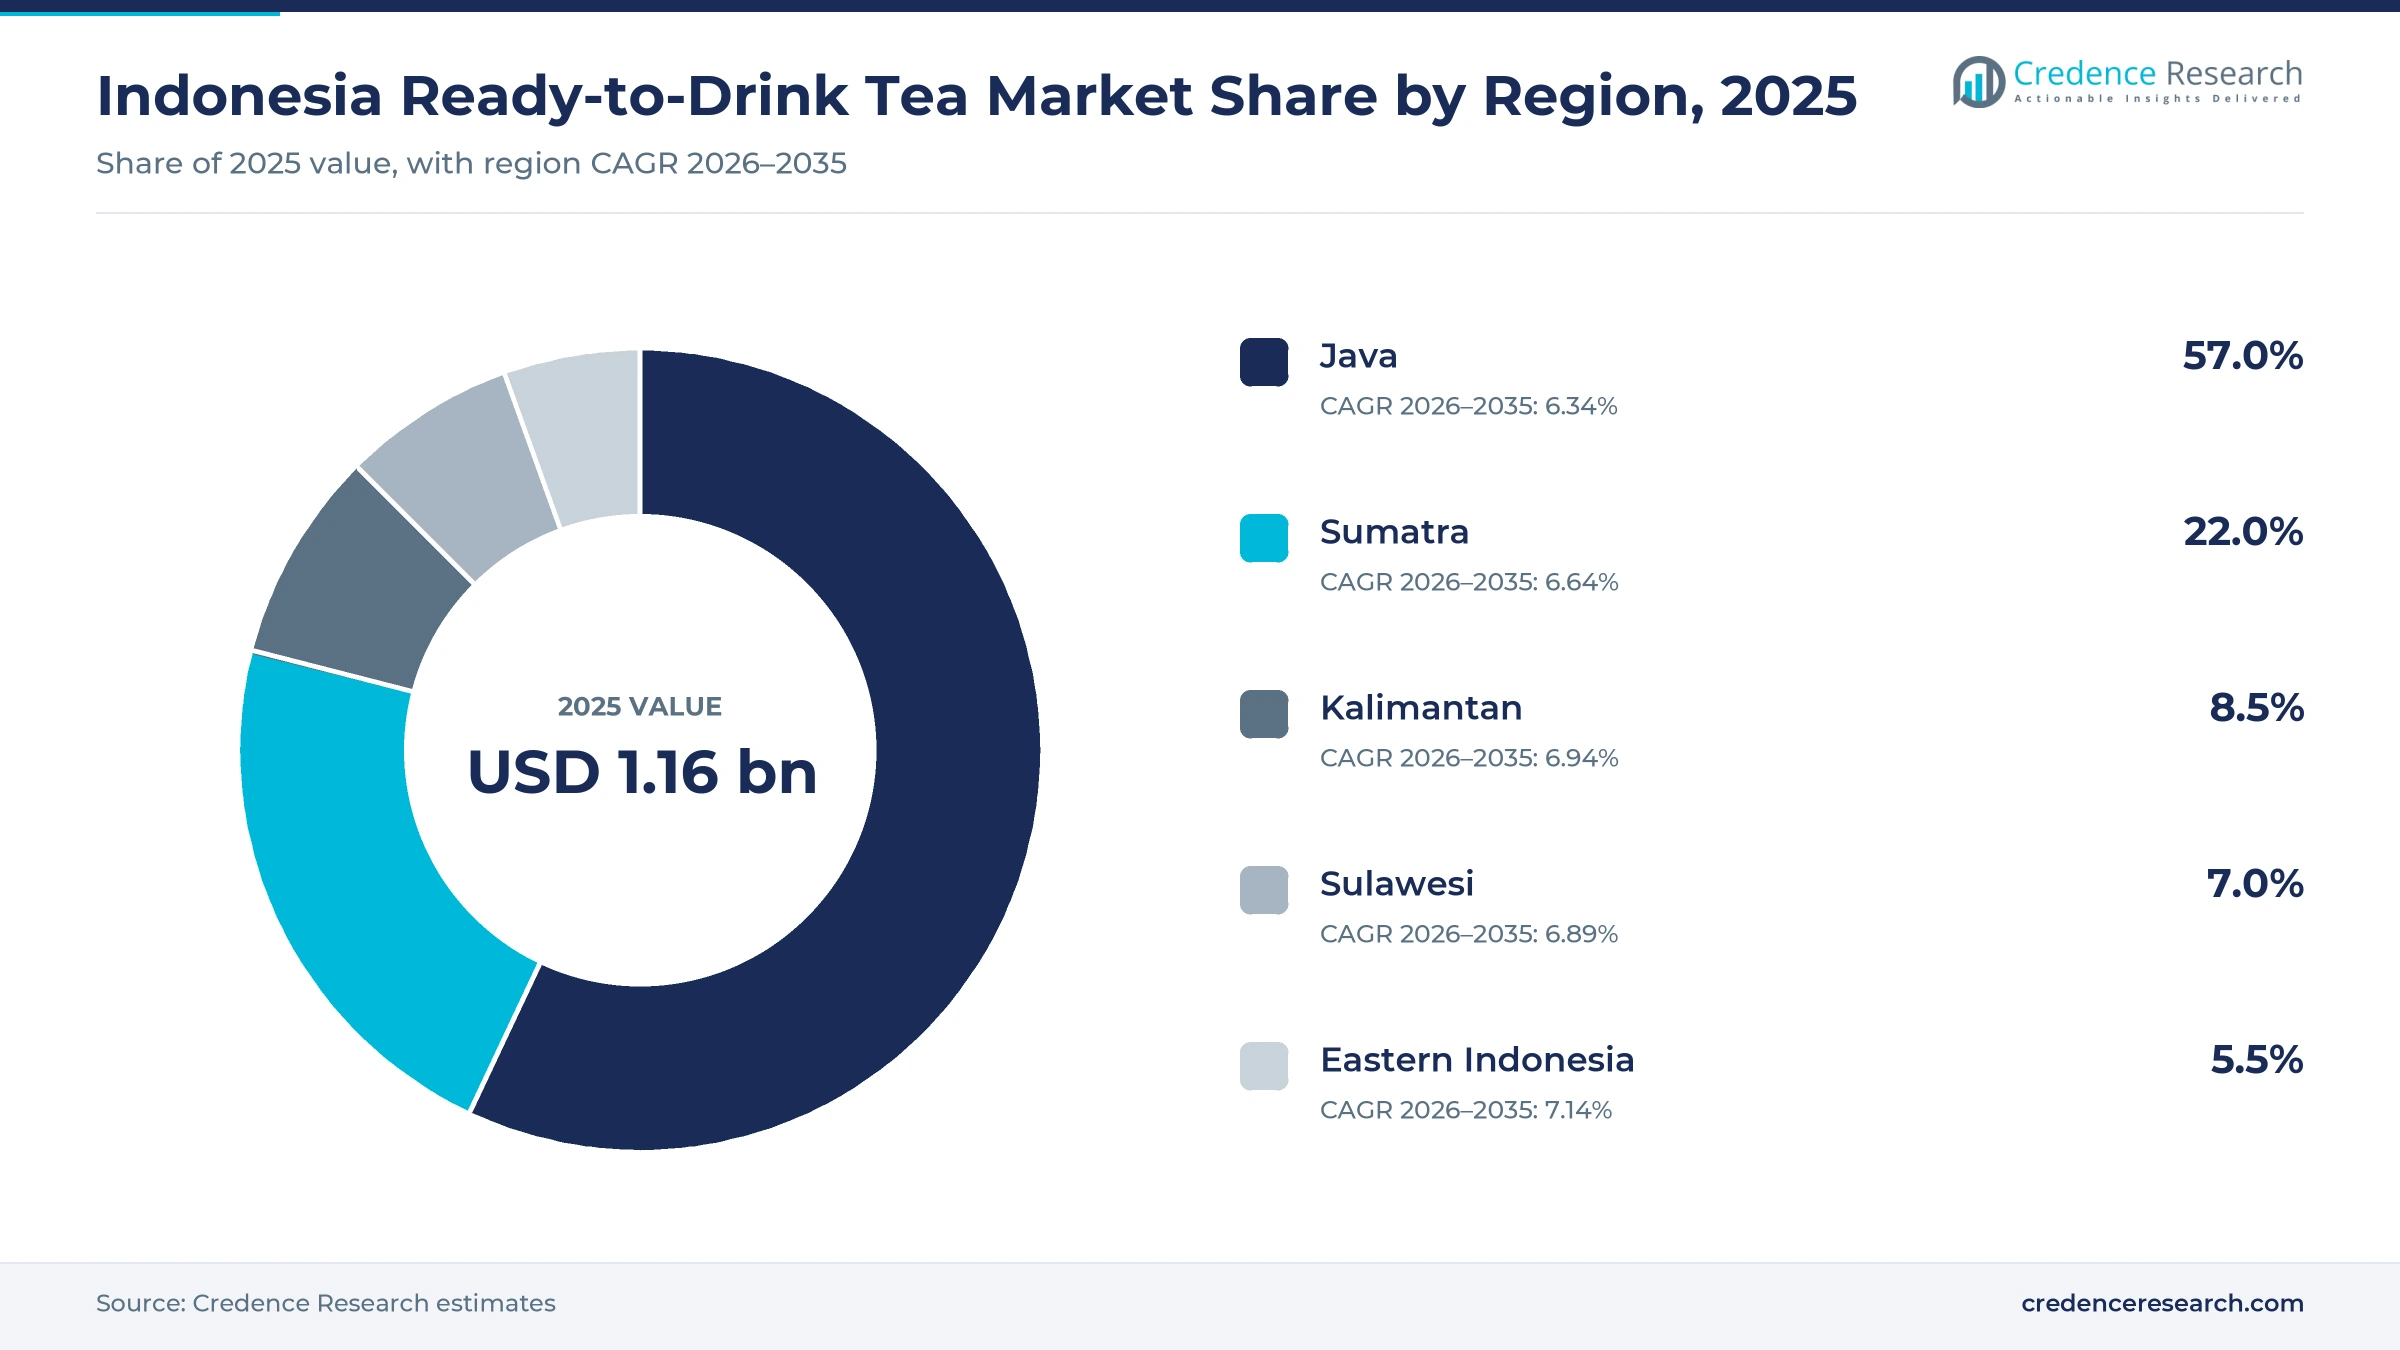
The Indonesia ready-to-drink tea market was valued at USD 1.16 billion in 2025 and is projected to increase from USD 1.25 billion in 2026 to USD 2.21 billion by 2035, registering a CAGR of 6.54% during 2026–2035. Demand comes from students, commuters and families who buy chilled tea with meals, on the move and during breaks, mostly through warung, minimarkets and food stalls. Java held the largest regional share, 57.0% in 2025, because the island is home to more than half of the population and most bottling plants. Eastern Indonesia is the fastest-growing region at 7.14% a year, as minimarket chains and distributors push deeper into smaller cities. However, sugar rules are tightening, because a health ministry decree signed in April 2026 introduced A to D Nutri-Level grades for ready-to-drink beverages, and the finance ministry now plans an excise on sweetened packaged drinks from the second half of 2027.
What does this estimate count across packaged tea drinks?
The estimate measures the value of packaged tea beverages that are ready to drink without brewing, including jasmine and black tea, green tea, fruit-infused tea, herbal and functional tea and milk tea. It covers bottles, cartons, cups, cans and glass bottles sold through convenience stores, supermarkets, warung, online stores and foodservice outlets, valued at consumer selling prices.
The estimate excludes loose leaf tea, tea bags, instant tea powders and freshly brewed tea made in cafes and street stalls, which are counted in other beverage categories. The value chain runs from tea estates and sugar refiners through bottlers and packaging suppliers to distributors, retailers and the consumers who buy a chilled tea several times a week.
Indonesia Ready-to-Drink Tea Market Insights
- The Indonesia ready-to-drink tea market was valued at USD 1.16 billion in 2025 and is projected to reach USD 2.21 billion by 2035, registering a CAGR of 6.54% during 2026–2035.
- Java held a 57.0% share of 2025 value, because 55.65% of the 284.67 million people counted in the 2025 intercensal survey live on the island.
- Jasmine and black tea led with a 46.0% share of 2025 value, because classic sweet jasmine tea remains the everyday choice with meals.
- A health ministry decree signed on April 14, 2026, grades ready-to-drink beverages from A to D, with grade D for more than 10 grams of sugar per 100 milliliters.
- E-commerce and quick commerce grow fastest among channels at 9.07% a year during 2026–2035, as urban buyers order chilled multipacks for delivery.
Jasmine tea leads while herbal and milk teas grow fastest
Why does jasmine and black tea hold most of the value?
Based on product type, the market is categorized into jasmine and black tea, green tea, fruit-infused tea, herbal and functional tea, and milk tea. Jasmine and Black Tea led with a 46.0% share of 2025 value, because sweet jasmine tea is the classic pairing with rice meals. Herbal and Functional Tea grows fastest at 7.83% a year, as health-oriented buyers try teas with added herbs, vitamins or less sugar.
Where do Indonesian consumers buy chilled tea?
Based on distribution channel, the market is categorized into convenience stores, supermarkets and hypermarkets, traditional grocery and warung, e-commerce and quick commerce, and foodservice. Traditional Grocery and Warung led with a 38.0% share of 2025 value, because small neighborhood shops sell single chilled servings every day. E-Commerce and Quick Commerce grows fastest at 9.07% a year, as city households order drinks with groceries.
Which packaging formats carry the most value?
Based on packaging format, the market is categorized into PET bottles, aseptic cartons, plastic cups and cans and glass bottles. PET Bottles led with a 52.0% share of 2025 value, because resealable bottles suit commuters and come in sizes from 350 milliliters to 1.5 liters. Aseptic Cartons grow fastest at 6.71% a year, as school and family buyers choose shelf-stable aseptic carton packs that need no refrigeration.
How do price tiers divide tea spending?
Based on price tier, the market is categorized into value, mainstream, premium and functional premium products. Mainstream products led with a 42.0% share of 2025 value, because the best-known bottled jasmine teas sit at this everyday price point. Functional Premium products grow fastest at 7.99% a year, as buyers pay more for less-sugar, herbal and added-benefit recipes.
| Segment Group | Leading Sub-segment | Share, 2025 | Fastest-growing Sub-segment | CAGR, 2026–2035 |
|---|---|---|---|---|
| By Product Type | Jasmine and Black Tea | 46.0% | Herbal and Functional Tea | 7.83% |
| By Distribution Channel | Traditional Grocery and Warung | 38.0% | E-Commerce and Quick Commerce | 9.07% |
| By Packaging Format | PET Bottles | 52.0% | Aseptic Cartons | 6.71% |
| By Price Tier | Mainstream | 42.0% | Functional Premium | 7.99% |
Request a Free Sample
Fill in your details and we'll send you a free sample report.
- Sample data tables & charts
- Research methodology
Young buyers, local leaf and new recipes lift demand
How do a large consumer base and urban buying lift demand?
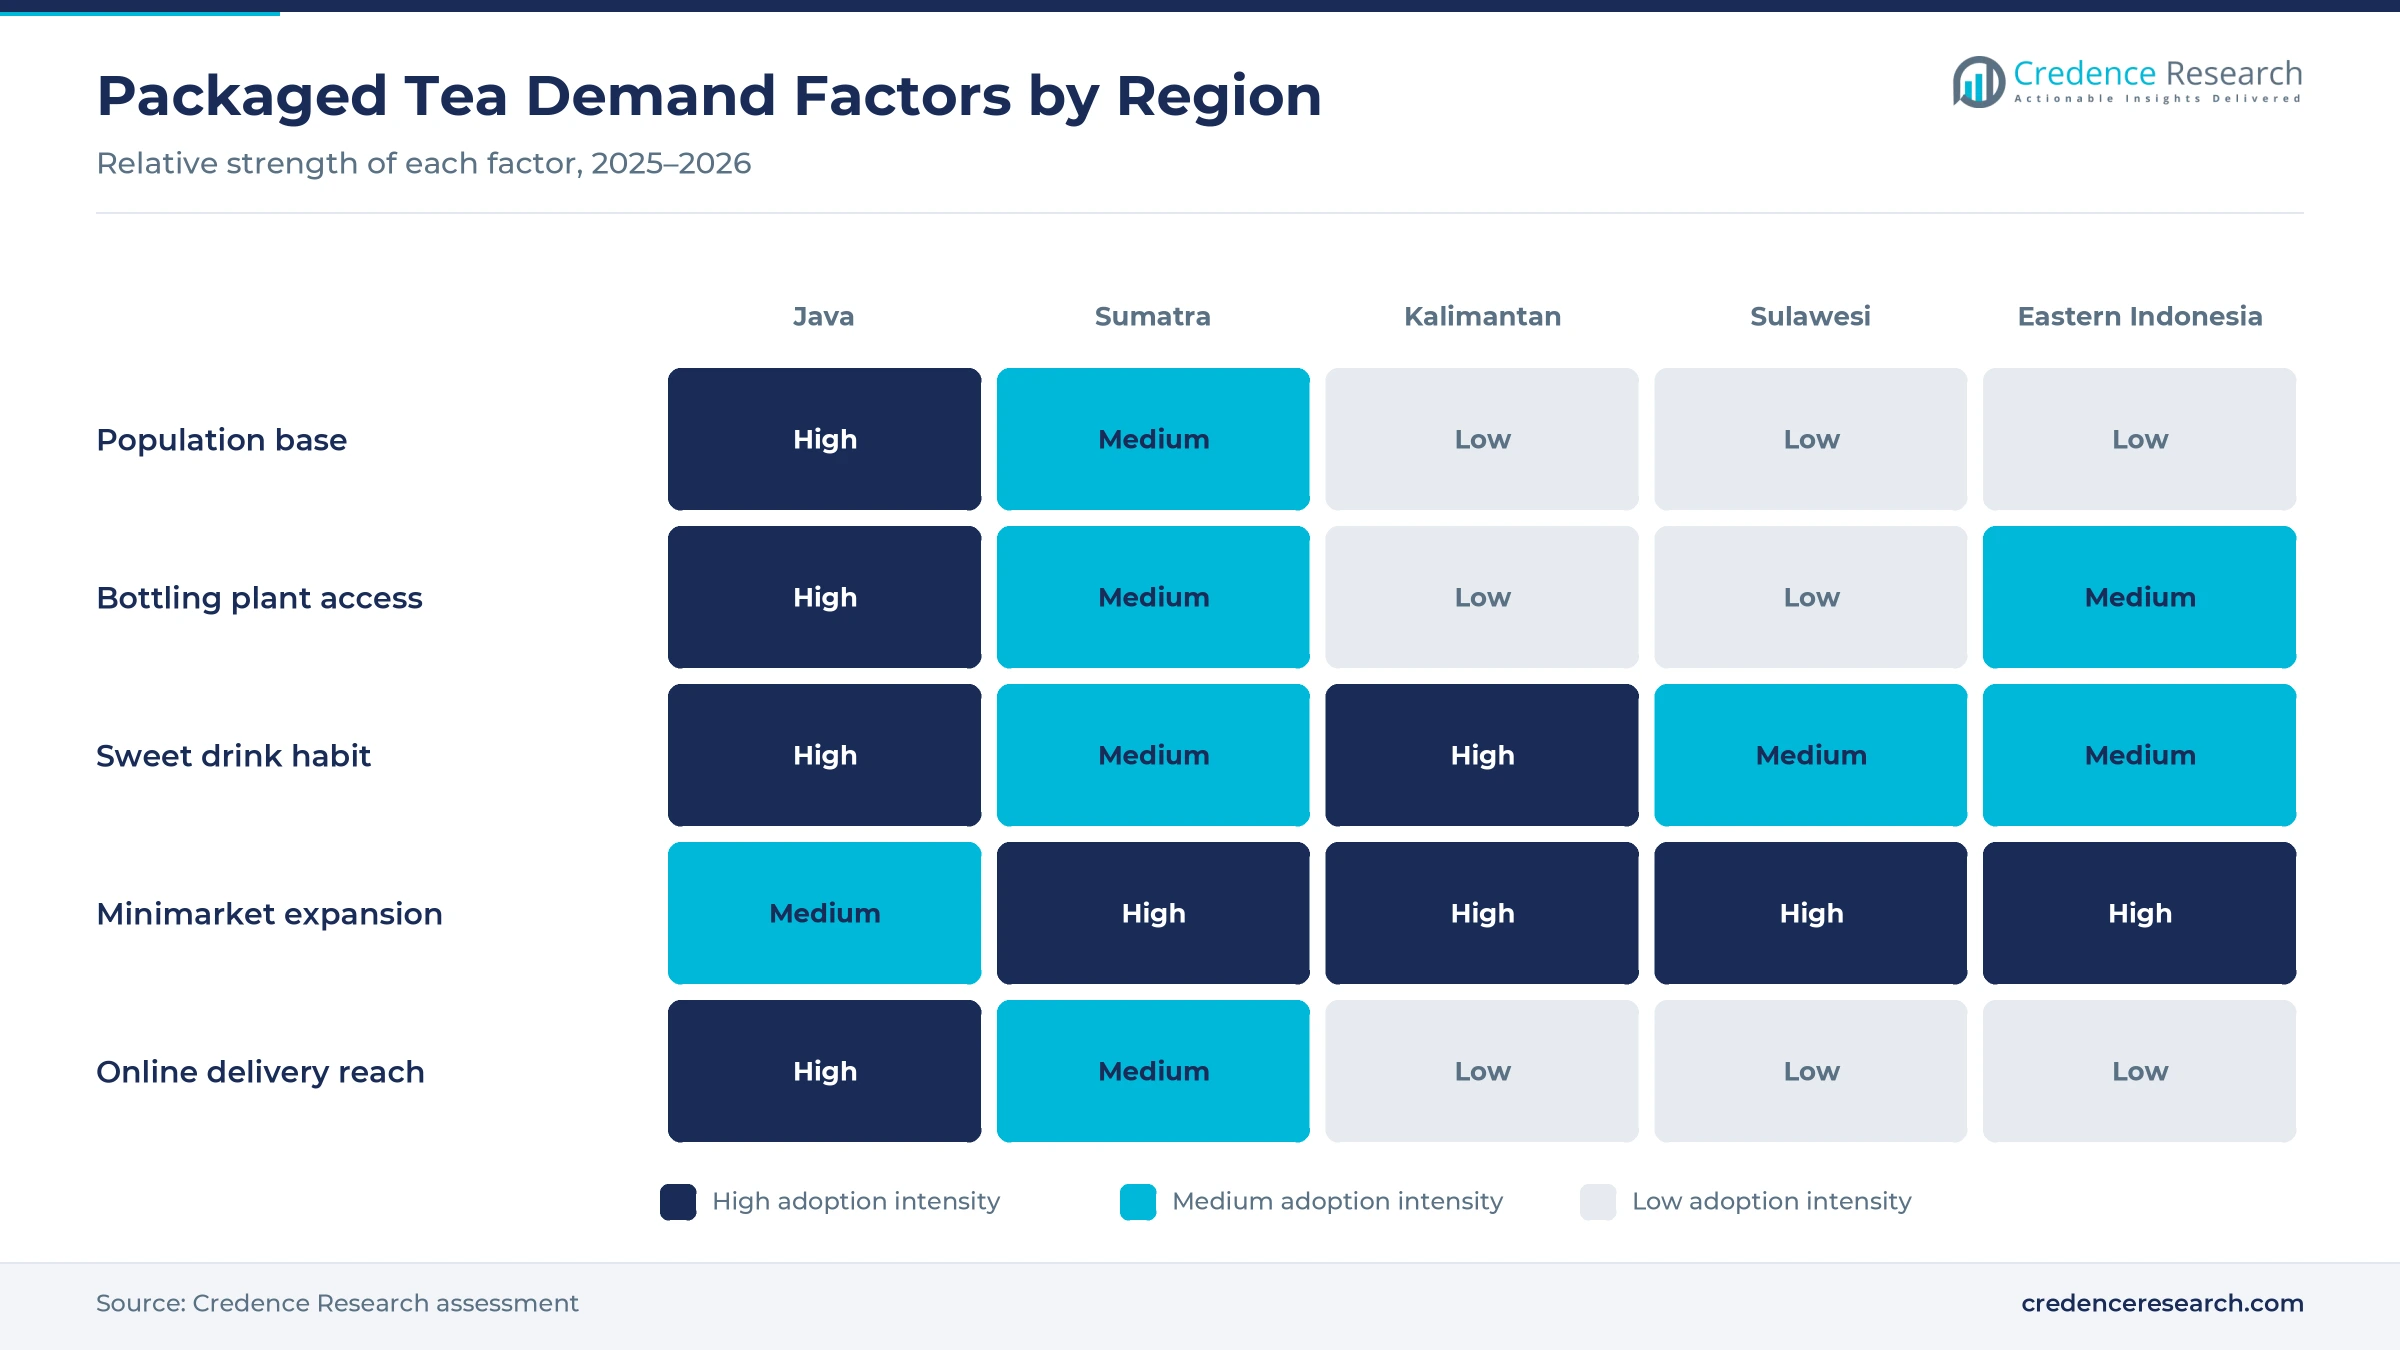
Indonesia combines one of the largest populations in Asia with a steady shift to city life, which multiplies the occasions for buying a chilled tea away from home. The 2025 intercensal survey counted 284.67 million people, growing 1.08% a year, with 55.65% living on Java, according to Statistics Indonesia. The urban share of the population reached 59.4% in 2025, up from 56.3% in 2020, according to World Bank data. Alfamart planned 1,000 new outlets in 2025, and its stores outside Java made up 35% of its network in the first quarter. As a result, convenience stores hold a firm place in daily tea purchases across the main cities of Java and Sumatra.
Why does domestic tea supply support local bottlers?
Local tea leaf and a dense bottling network let Indonesian brands keep costs and prices low enough for daily buying. Indonesia produced 116,507 tons of tea from 97,564 hectares in 2023, and West Java alone harvested 75,703 tons, according to Statistics Indonesia data published in its 2024 tea statistics. PT Sinar Sosro, registered on July 17, 1974, runs 12 plants, including sites in Medan, Palembang, Cibitung, Gresik and Gianyar, according to Fortune Indonesia. Ultrajaya says its Teh Kotak brand leads the tea-in-carton segment, while Ichitan and Mitsubishi agreed in 2014 to build an IDR 400 billion beverage plant. In turn, the wider packaged food and beverage industry gains a domestic supply base for tea drinks.
How are portfolio innovation and reformulation widening demand?
Brands now refresh flavors and cut sugar to keep younger and health-oriented buyers in the category. Frestea reformulated its apple, jasmine and honey green tea variants with less sugar in March 2024, its first formula change in 22 years, according to SWA and Mojok. Teh Pucuk Harum Less Sugar carries the food agency's healthier choice logo and uses no artificial sweeteners, according to detikHealth. Ichitan said Thai Milk Tea and Brown Sugar Milk drove growth at its Indonesian unit, which met its first-half 2026 targets, according to Ichitan Group. As a result, herbal and functional tea grows fastest among product types at 7.83% a year during 2026–2035.
Why does a young, sweet-drink habit keep volumes high?
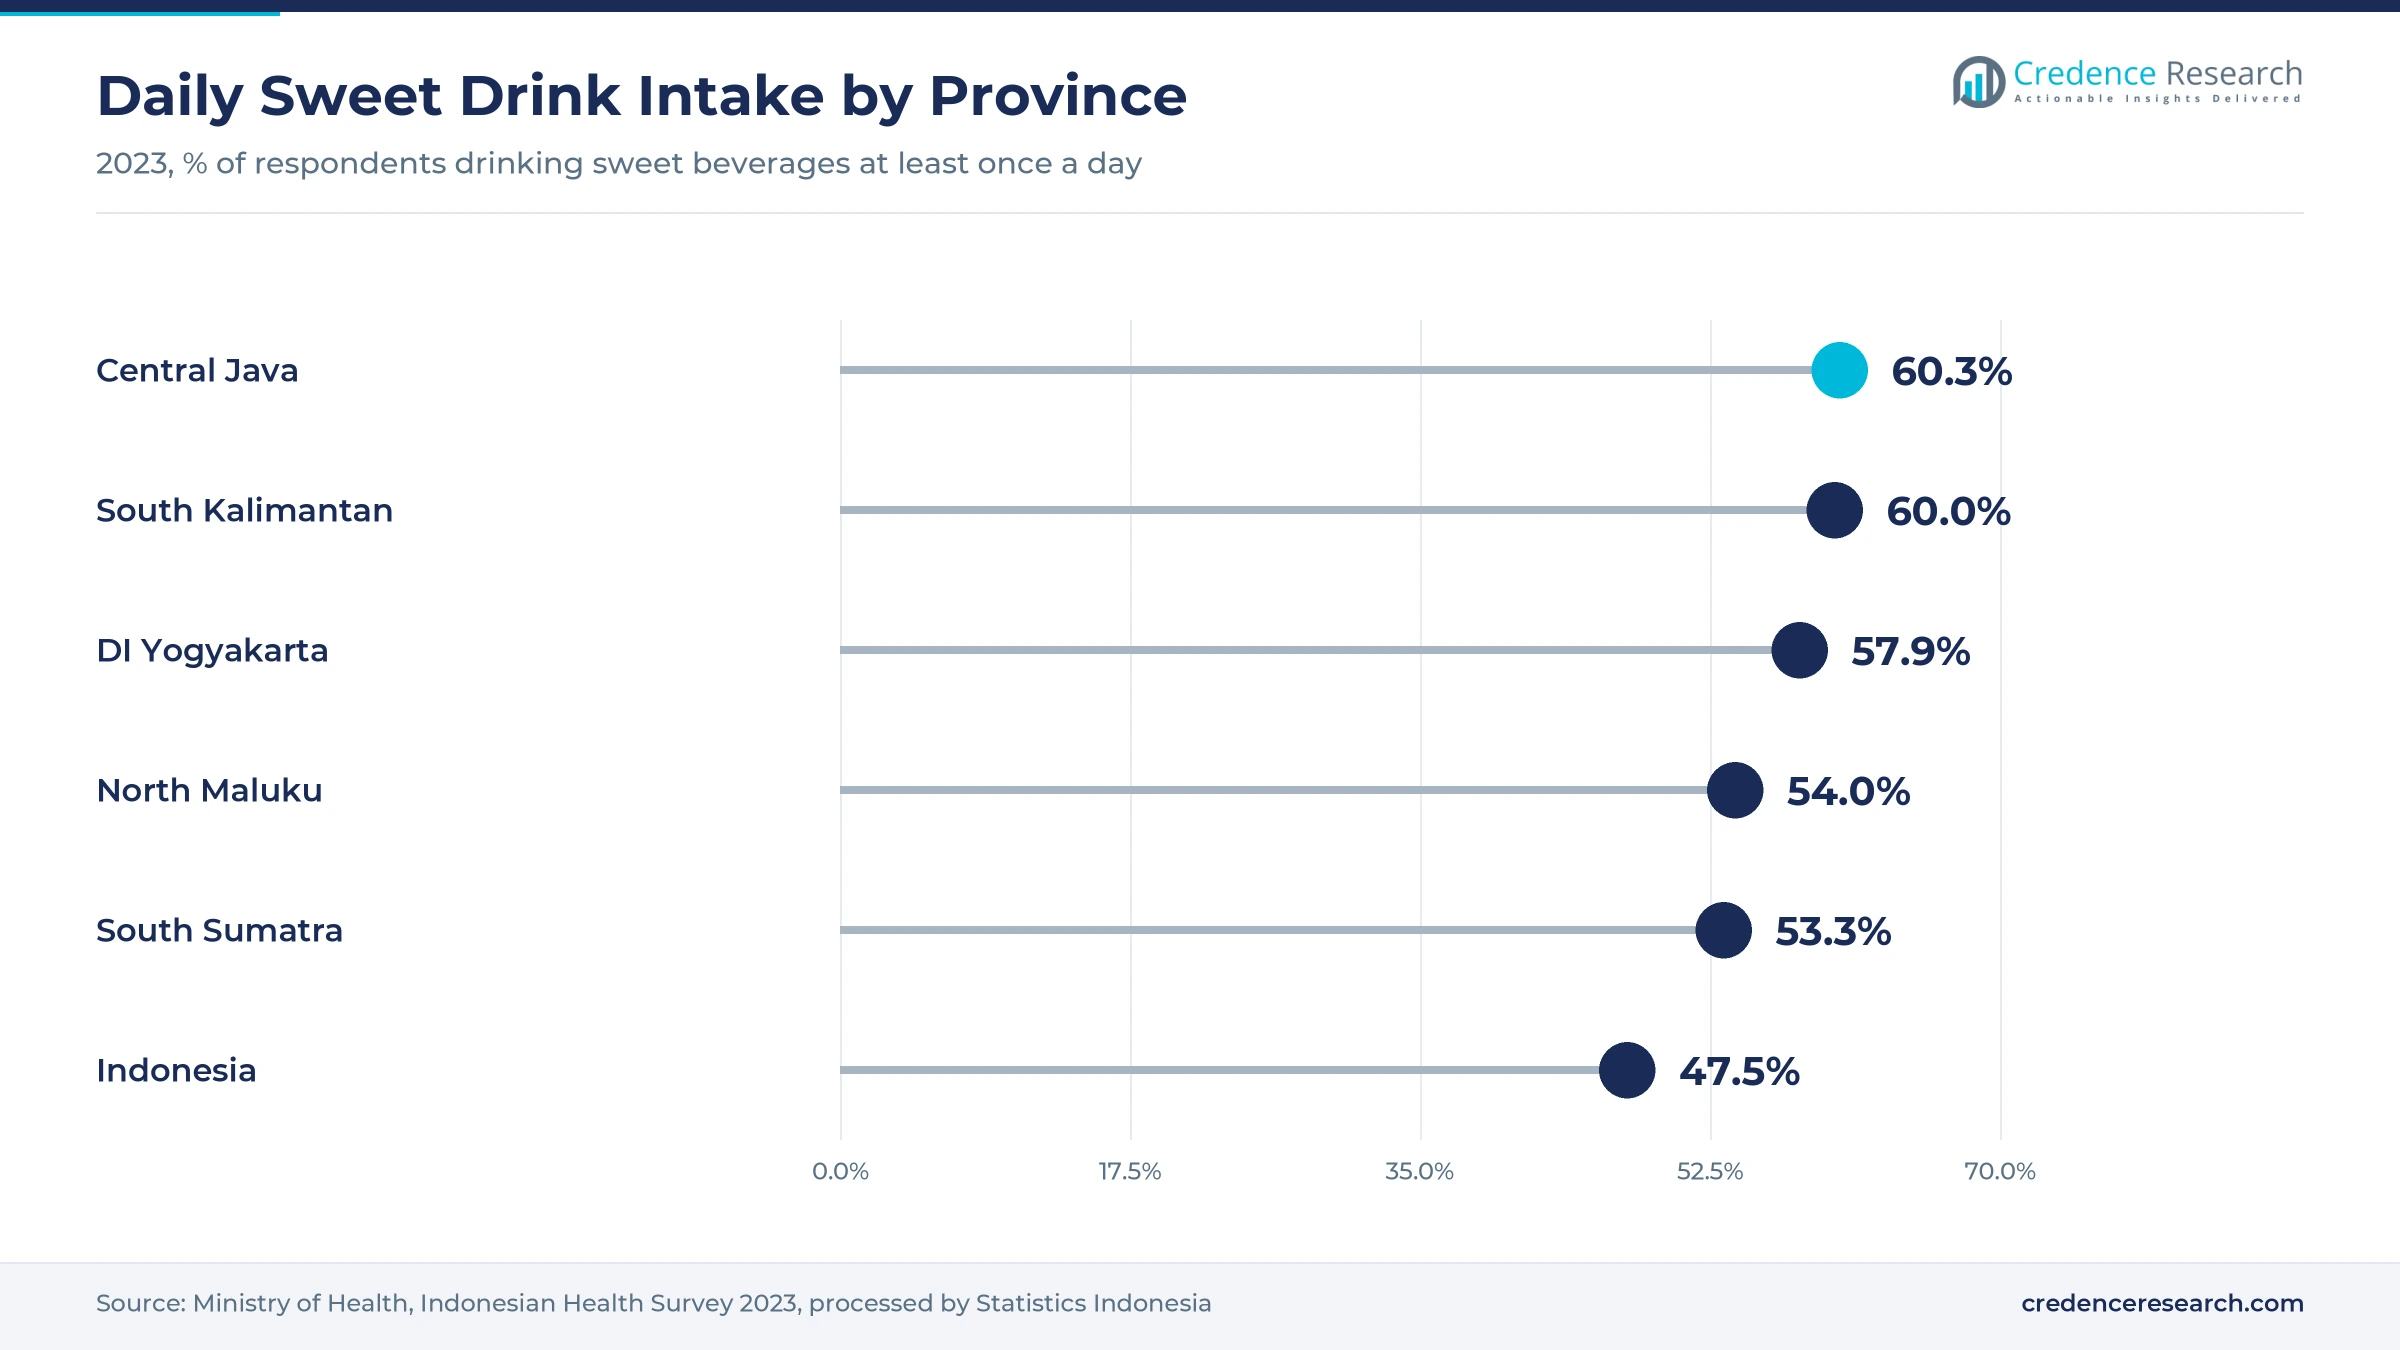
Sweet drinks are part of daily life for most Indonesian households, which gives packaged tea a large and repeat customer base. The 2023 Indonesian Health Survey found that 47.5% of respondents drank sweet beverages at least once a day, according to CNA Indonesia, which cited a Statistics Indonesia analysis. Daily intake reached 53% among children aged 5 to 9 and 60.3% in Central Java, the highest of any province. The 2025 intercensal survey also found that 68.92% of Indonesians belong to the younger generations. In turn, teen and student buyers remain a core group, and low-priced plastic cups stay a staple at school canteens and warung.
Sugar grading and outer-island retail reshape the shelf
How is Nutri-Level grading shifting tea recipes?
The shift from voluntary claims to graded sugar labels is pushing brands to cut sugar before the rules become mandatory. Health Ministry Decree HK.01.07/MENKES/301/2026, signed on April 14, 2026, grades ready-to-drink beverages A for 1 gram of sugar or less per 100 milliliters and D for more than 10 grams, according to the decree. Grade B products may use only natural sweeteners, and large businesses are covered first. Labeling becomes mandatory two years after maximum sugar limits are set under Government Regulation 28 of 2024, whose Article 194 lets the state set limits and excise. As a result, reformulated teas gain shelf space across modern retail.
Why is distribution shifting toward outer islands and general trade?
The rise of multi-distributor networks is moving growth from Jakarta malls toward second-tier cities and small shops. Ichitan described a shift from modern trade to general trade and from one distributor to several in a presentation at the 2026 Indonesia Investment and Trade Forum, saying this gives deeper reach in an island country. Its Indonesian unit met first-half 2026 targets by focusing on tier-two cities. Alfamart sales outside Java rose 15.7% in the first half of 2025, according to IDN Financials. The 2025 intercensal survey also places 44.35% of the population off Java. In turn, Kalimantan grows at 6.94% a year during 2026–2035, faster than the two western islands.
Can lower-sugar teas open room ahead of the excise?
A planned excise on sweetened packaged drinks opens room for brands that move early to low-sugar and naturally sweetened teas. The finance ministry targets the second half of 2027 for the excise and expects Rp1.7 trillion in revenue, Customs and Excise Director General Djaka Budhi Utama said on Oct. 9, 2026, according to BCA Sekuritas. Officials have cited an ASEAN average excise of Rp1,771 per liter as a reference. Grade B under the Nutri-Level decree allows only natural sweeteners such as stevia, which favors plant-based recipes. As a result, functional premium products grow fastest among price tiers at 7.99% a year.
Will recycled PET and new pack sizes open fresh demand?
Plastic rules and brand refreshes create an opening for teas in recycled bottles and in sizes matched to each occasion. Coca-Cola Europacific Partners Indonesia launched bottles made of 100% recycled PET, excluding cap and label, in June 2023, supplied by a recycling plant in West Java built with Dynapack Asia, according to Packaging Gateway. Frestea moved its 500-milliliter and 1.5-liter bottles to full-sleeve packs on Sept. 18, 2025, while the 350-milliliter bottle gained a new half sleeve, according to Coca-Cola Indonesia. In turn, PET bottles keep a 52.0% share of 2025 value as brands upgrade their packs and add recycled content to more of their tea range.
Excise risk, halal rules and plastic limits test makers
Sweetened-drink excise keeps pricing uncertain
The excise on sweetened packaged drinks has slipped from one budget year to the next, which makes price planning hard for tea makers. The 2024 state budget already targeted Rp4.4 trillion from the levy, but the technical rules were never issued, according to Investor Trust. The food and beverage producers association Gapmmi has warned that the tax would raise consumer prices and weaken purchasing power. As a result, brands are preparing lower-sugar recipes and smaller packs to protect price points.
Halal certification raises compliance work
Every packaged tea sold by medium and large businesses must now carry halal certification, which adds audits for ingredients, flavors and plants. The obligation took effect on Oct. 18, 2024, under Law 33 of 2014 and Government Regulation 42 of 2024, while micro and small firms have until Oct. 17, 2026, according to the halal product agency. Products without certification face written warnings or withdrawal from the market. In turn, small regional bottlers face higher costs than national brands.
Plastic limits put small bottles under pressure
Regional plastic rules can restrict the small single-serve bottles that carry much of the market's daily volume. Bali's Circular Letter 9 of 2025, issued by Governor I Wayan Koster on April 2, 2025, bans the production of single-use plastic bottled water below 1 liter in the province, according to law firm SSEK. As a result, tea makers watch for similar rules on other drinks and expand returnable glass, cartons and recycled PET.
Rising diet-related health costs sharpen scrutiny
Higher spending on diet-related disease is turning sugary drinks into a public finance issue, which raises pressure on sweet tea brands. National health insurance payouts for kidney failure rose from Rp2.32 trillion in 2019 to Rp13.38 trillion in 2025, according to Investor Trust. Health officials link frequent sweet drink intake with diabetes and kidney risk. In turn, tea makers fund education campaigns and widen their less-sugar ranges to stay ahead of tighter rules.
Java leads while Eastern Indonesia grows fastest
| Region | Value, 2025 (USD billion) | Share, 2025 | CAGR, 2026–2035 |
|---|---|---|---|
| Java | 0.66 | 57.0% | 6.34% |
| Sumatra | 0.26 | 22.0% | 6.64% |
| Kalimantan | 0.10 | 8.5% | 6.94% |
| Sulawesi | 0.08 | 7.0% | 6.89% |
| Eastern Indonesia | 0.06 | 5.5% | 7.14% |
Why does Java hold the largest share?
Java held a 57.0% share of 2025 value and grows at 6.34% a year, because 55.65% of Indonesians live on the island and most national bottlers run plants there. Sinar Sosro operates sites in Jakarta, Cibitung, Ungaran, Gresik and Mojokerto, while West Java grows most of the country's tea leaf. Central Java also recorded the highest daily sweet drink intake in 2023, at 60.3% of respondents. As a result, Java remains the main volume base, although its growth trails the outer islands.
How does Sumatra support demand?
Sumatra held a 22.0% share of 2025 value and grows at 6.64% a year, because large cities such as Medan and Palembang host both bottling plants and dense warung networks. Sinar Sosro runs plants in Medan and Palembang, which cut freight costs for the island. South Sumatra recorded daily sweet drink intake of 53.3% in 2023, above the national rate of 47.5%. In turn, Sumatra tracks the national growth rate closely through 2035.
What lifts demand in Kalimantan?
Kalimantan held an 8.5% share of 2025 value and grows at 6.94% a year, because minimarket chains keep opening stores outside Java and sweet drink habits run high. South Kalimantan recorded daily sweet drink intake of 60% in 2023, the second-highest of any province. Alfamart has also focused its new store openings on islands beyond Java since 2025. As a result, Kalimantan grows faster than Java and Sumatra.
How does Sulawesi contribute?
Sulawesi held a 7.0% share of 2025 value and grows at 6.89% a year, because demand rests on a smaller urban base and on warung networks across the island. Ichitan's focus on tier-two cities and multi-distributor reach fits this region, where warung carry most single-serve sales. Its warung networks also depend on regional distributors that carry chilled single servings to smaller towns. In turn, Sulawesi gains share slowly as modern retail spreads.
Why is Eastern Indonesia growing fastest?
Eastern Indonesia held a 5.5% share of 2025 value and grows fastest at 7.14% a year, because retail chains and distributors are reaching islands that were served mostly by small shops. North Maluku recorded daily sweet drink intake of 54% in 2023, above the national rate. Sinar Sosro also runs a plant in Gianyar, Bali, which shortens supply routes to the eastern islands. As a result, this region adds value fastest from a small base.
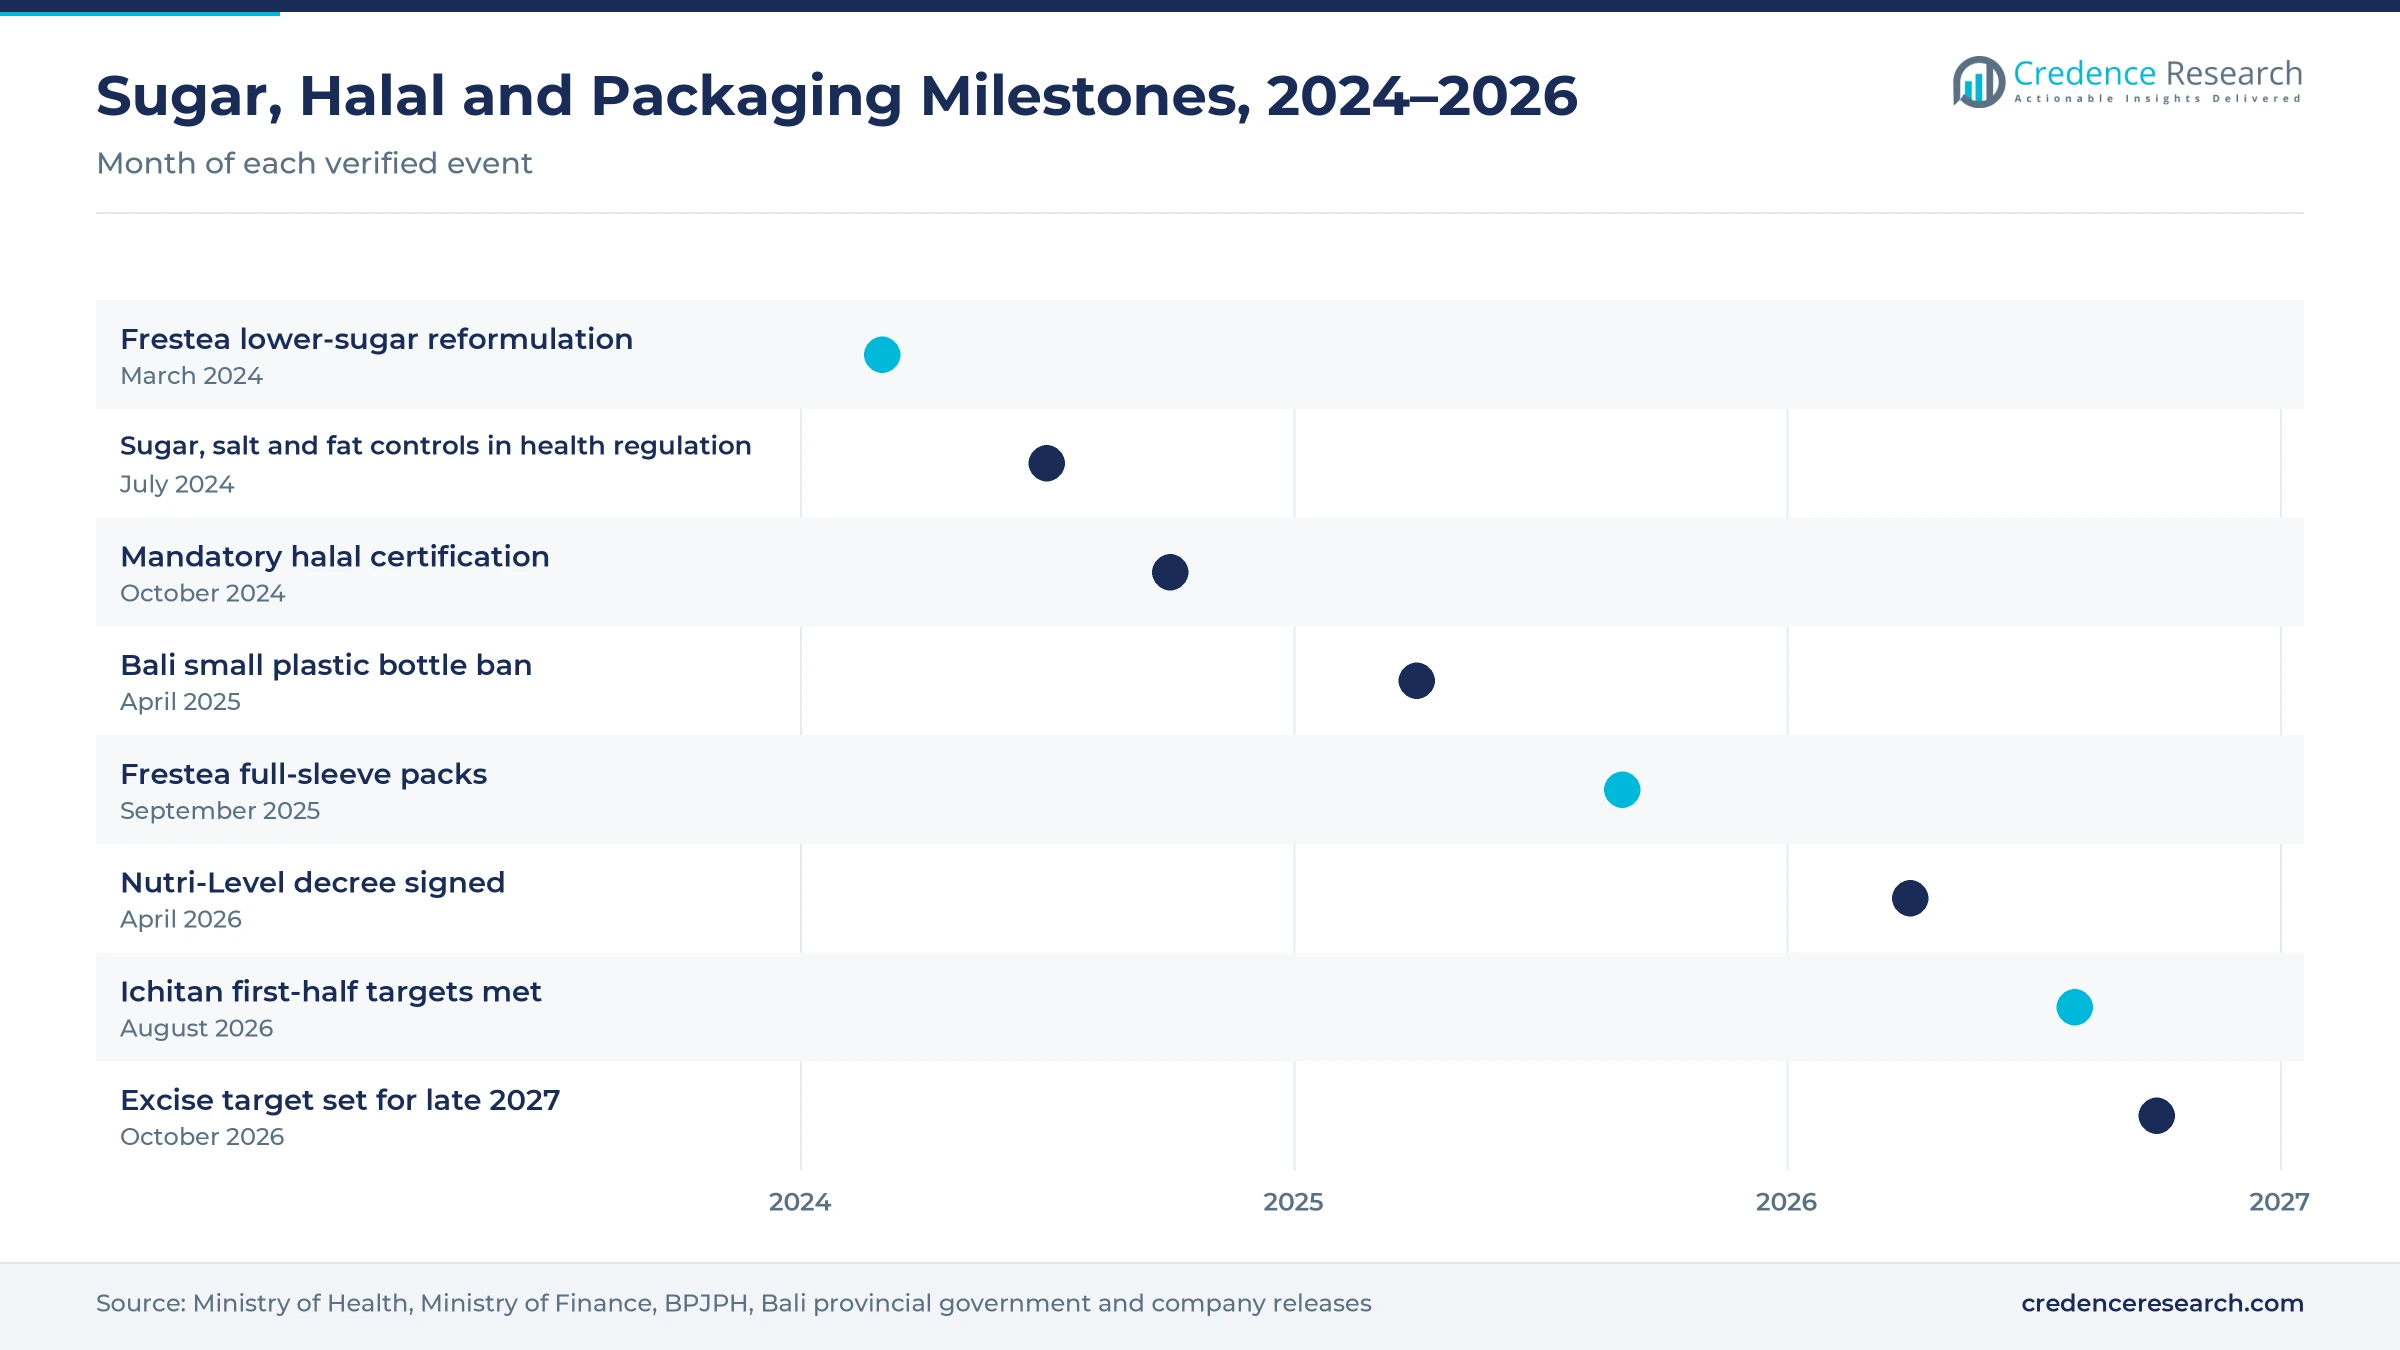
Sugar, halal and packaging milestones since 2024
| Development | Status and market relevance |
|---|---|
| In March 2024, Frestea reformulated its apple, jasmine and honey green tea variants with less sugar, its first formula change in 22 years. | Signals the industry move to lower-sugar recipes |
| In October 2024, mandatory halal certification took effect for food and beverage products of medium and large businesses. | Adds certification audits for every packaged tea |
| In April 2025, Bali banned the production of single-use plastic bottled water below 1 liter under Circular Letter 9 of 2025. | Raises attention on small plastic beverage packs |
| In April 2026, the health ministry signed a decree that grades ready-to-drink beverages from A to D by sugar content. | Sets the frame for future sugar labels on tea |
| In October 2026, the finance ministry said it targets the second half of 2027 for an excise on sweetened packaged drinks. | Pushes brands to cut sugar before the levy |
Aseptic filling and lighter PET shape the product range
- Aseptic carton filling sterilizes tea and packs it cold into multilayer cartons, which lets products such as Teh Kotak travel without refrigeration.
- Hot-fill and aseptic PET lines fill bottles from 350 milliliters to 1.5 liters, which serves both single commuters and family stock-up buyers.
- Recycled PET resin turns collected bottles back into food-grade packaging, which helps brands answer regional plastic rules.
- Sugar reduction and natural sweetening blends lower sugar with natural sweeteners and herbs, which helps recipes reach better Nutri-Level grades.
Need a Custom Version of This Report?
Tailor the scope, geography, or segments to your exact requirements.
- Custom geography or segment scope
- Direct access to our analyst team
Heritage tea brands face global and Thai challengers
Competition combines heritage Indonesian tea brands, local food groups and global beverage companies. PT Sinar Sosro, maker of Tehbotol Sosro since the 1970s, runs 12 plants and also sells S-Tee and Fruit Tea Sosro. Mayora sells Teh Pucuk Harum, Orang Tua sells Teh Gelas, and Ultrajaya leads tea in cartons with Teh Kotak. Coca-Cola markets Frestea, and Coca-Cola Europacific Partners Indonesia bottles the company's drinks, while Wings sells Javana, ABC sells Nu Tea and Indofood CBP sells Ichi Ocha. PT Ichi Tan Indonesia brings Thai milk tea recipes through a venture with Mitsubishi and the Alfa Group. Companies compete on price per serving, warung reach, flavor rotation, sugar reduction and halal and packaging compliance.
Which brands lead Indonesian packaged tea?
| Company | Type | Role in the market |
|---|---|---|
| PT Sinar Sosro | Heritage tea bottler | Runs 12 plants and sells Tehbotol Sosro, S-Tee and Fruit Tea Sosro |
| PT Mayora Indah Tbk | Food and beverage group | Sells Teh Pucuk Harum, including a Less Sugar variant |
| PT Ultrajaya Milk Industry & Trading Company Tbk | Dairy and carton beverage maker | Leads tea in cartons with Teh Kotak |
| Coca-Cola Europacific Partners Indonesia | Global beverage bottler | Bottles Coca-Cola drinks and uses recycled PET from West Java |
| OT Group | Food and beverage group | Sells the Teh Gelas tea brand |
| Wings Food | Consumer goods group | Sells the Javana tea brand |
| PT ABC President Indonesia | Beverage joint venture | Sells the Nu Tea brand |
| PT Indofood CBP Sukses Makmur Tbk | Packaged food group | Kept the Ichi Ocha tea line after its Asahi venture ended |
| PT Ichi Tan Indonesia | Thai-backed tea maker | Grew with Thai Milk Tea and Brown Sugar Milk in 2026 |
Lower-sugar recipes and outer-island reach drive value
Credence Research's view is that Indonesian ready-to-drink tea will keep growing in value as brands sell lower-sugar recipes at slightly higher prices and reach new buyers outside Java. Jasmine and black tea remains the core of spending, while herbal, functional and milk teas grow fastest. The Nutri-Level decree and the planned excise will favor makers that reformulate early and hold their price points. Companies that pair warung reach with recycled packaging and halal-ready supply chains should gain the most share by 2035.
Population, consumption and retail data shape the model
The report uses 2025 as the base year on a calendar basis, and market values come from the Credence Research model. That model combines population and urbanization statistics, health survey data on sweet drink intake, tea production statistics, regulatory decisions, retailer disclosures and company releases. Segment splits and region growth rates are Credence Research estimates, while region shares are Credence Research estimates built from population and retail data. Sources used are official statistics, regulator and government releases, and company announcements, and no interviews or surveys were used.
Reformulated teas and wider retail support growth to 2035
The Indonesia ready-to-drink tea market is expected to reach USD 2.21 billion by 2035, a 6.54% CAGR during 2026–2035, as lower-sugar recipes, new flavors and wider retail reach lift value per serving. Growth should be strongest in herbal and functional tea, e-commerce and quick commerce, functional premium products and Eastern Indonesia, because these areas gain most from health-minded buyers and retail expansion. The planned excise and plastic rules could slow some value packs, while Nutri-Level grading should reward brands that cut sugar first.
Frequently Asked Questions
How big is the Indonesia ready-to-drink tea market?
Which product type leads the market?
Which region leads the market?
What is the Nutri-Level label for beverages?
When will the sweetened drink excise start?
How common are sweet drinks in Indonesia?
Which companies lead the Indonesian market?
What are the main challenges for the market?
Table of Content
Chapter 1 Market Segmentation
- 1.1 Segmentation Framework
- 1.1.1 Product and Service Classification
- 1.1.2 Application and End-Use Classification
- 1.1.3 Technology and Solution Classification
- 1.1.4 Customer and Distribution Channel Classification
- 1.1.5 Geographic Segmentation
- 1.1.6 Market Segment Definitions and Boundaries
- 1.2 By Product Type
- 1.2.1 Jasmine and Black Tea
- 1.2.2 Green Tea
- 1.2.3 Fruit-Infused Tea
- 1.2.4 Herbal and Functional Tea
- 1.2.5 Milk Tea
- 1.3 By Packaging Format
- 1.3.1 PET Bottles
- 1.3.2 Aseptic Cartons
- 1.3.3 Plastic Cups
- 1.3.4 Cans and Glass Bottles
- 1.4 By Price Tier
- 1.4.1 Value
- 1.4.2 Mainstream
- 1.4.3 Premium
- 1.4.4 Functional Premium
Chapter 2 Introduction
- 2.1 Report Objectives and Scope
- 2.2 Product Definition and Industry Terminology
- 2.3 Market Inclusions and Exclusions
- 2.4 Research Process
- 2.4.1 Primary Research and Expert Interviews
- 2.4.2 Secondary Research and Source Review
- 2.4.3 Top-Down and Bottom-Up Estimation
- 2.4.4 Data Triangulation and Verification
- 2.5 Market Size Measurement Basis
- 2.5.1 2025: USD 1.16 billion → 2035: USD 2.21 billion
- 2.6 Historical and Forecast Reference Periods
- 2.6.1 Historical Period: 2018-2025
- 2.6.2 Base Year: 2025
- 2.6.3 Forecast Period: 2025-2035
- 2.7 Research Assumptions and Limitations
Chapter 3 Executive Summary
- 3.1 Market Snapshot and Key Findings
- 3.2 Base-Year Market Size, 2025
- 3.3 Forecast Market Size, 2035
- 3.4 Revenue and Volume Growth Outlook
- 3.5 Key Demand and Supply Indicators
- 3.6 Leading Market Segments
- 3.7 Fastest-Growing Market Opportunities
- 3.8 Regional Performance Highlights
- 3.9 Technology and Industry Transformation
- 3.10 Competitive Landscape Summary
- 3.11 Analyst View and Strategic Implications
Chapter 4 Indonesia Ready-to-Drink Tea Market Trends and Developments
- 4.1 Historical Industry Development, 2018-2025
- 4.2 Recent Market Trends and Developments
- 4.3 Demand and Customer Behavior Trends
- 4.4 Technology and Product Innovation
- 4.5 Artificial Intelligence, Automation and Digitalization
- 4.6 Local Manufacturing and Supply Chain Realignment
- 4.7 Industry Partnerships, Mergers and Acquisitions
- 4.8 Sustainability and Circular Economy Developments
- 4.9 Government and Private Sector Investment Trends
- 4.10 Emerging Business Models and Commercialization
- 4.11 Industry Developments and Announcements
Chapter 5 Indonesia Ready-to-Drink Tea Market Production, Supply and Demand Analysis
- 5.1 Demand Trend and Consumption Analysis, 2018-2025
- 5.2 Demand Forecast, 2025-2035
- 5.3 Production and Output Trend, 2018-2025
- 5.4 Production and Output Forecast, 2025-2035
- 5.5 Installed Capacity and Capacity Utilization
- 5.6 Company-Wise Production Plants and Statistics
- 5.6.1 Installed Production Capacity
- 5.6.2 Actual Production
- 5.6.3 Planned Capacity and Expansion Targets
- 5.7 Supply Chain Structure and Procurement Trends
- 5.8 Supply-Demand Gap and Bottlenecks
- 5.9 Import Dependence and Sourcing Structure
- 5.10 Contract Manufacturing and Outsourcing
- 5.11 Regional Supply and Demand Concentration
Chapter 6 Indonesia Ready-to-Drink Tea Market Pricing Analysis
- 6.1 Pricing Structure and Measurement
- 6.2 Historical Pricing Trends, 2018-2025
- 6.3 Pricing Outlook, 2025-2035
- 6.4 Average Selling Price and Unit Economics
- 6.5 Pricing by Product and Market Segment
- 6.6 Geographic Pricing Differences
- 6.7 Key Input, Energy, Labor and Logistics Costs
- 6.8 Contract Pricing and Purchasing Models
- 6.9 Pricing Sensitivity and Competitive Positioning
- 6.10 Price, Margin and Profitability Implications
Chapter 7 Indonesia Ready-to-Drink Tea Market Dynamics
- 7.1 Market Growth Drivers
- 7.1.1 Demand-Side Drivers
- 7.1.2 Technology and Innovation Drivers
- 7.1.3 Infrastructure and Investment Drivers
- 7.1.4 Regulatory and Policy Drivers
- 7.2 Market Restraints
- 7.2.1 Cost and Affordability Constraints
- 7.2.2 Technology and Adoption Barriers
- 7.2.3 Supply Chain and Operational Constraints
- 7.3 Market Challenges
- 7.3.1 Competitive Pressure and Margin Erosion
- 7.3.2 Skills, Infrastructure and Implementation Gaps
- 7.4 Emerging Market Opportunities
- 7.5 Market Dynamics Impact and Time-Horizon Assessment
Chapter 8 Indonesia Ready-to-Drink Tea Value Chain Analysis
- 8.1 Industry Value Chain Overview
- 8.2 Upstream Suppliers and Critical Inputs
- 8.3 Technology and Component Providers
- 8.4 Manufacturing or Service Delivery
- 8.5 Distribution, Channel Partners and Integrators
- 8.6 Downstream Applications and End Users
- 8.7 Value Addition and Profit Pools
- 8.8 Vertical Integration and Outsourcing
- 8.9 Supplier Concentration and Risk
- 8.10 Supply Chain Localization and Resilience
Chapter 9 Indonesia Ready-to-Drink Tea Market Regulations and Policies
- 9.1 Relevant Laws, Standards and Compliance Frameworks
- 9.2 Product, Service, Safety and Quality Requirements
- 9.3 Government Policies, Incentives and Subsidies
- 9.4 Imports, Exports and Trade Barriers
- 9.5 Public Procurement and Local Content Requirements
- 9.6 Environmental and Sustainability Compliance
- 9.7 Upcoming Policy Changes and Market Implications
Chapter 10 Indonesia Ready-to-Drink Tea Market Hotspots and Opportunities
- 10.1 Market Opportunity Mapping and Growth Hotspots
- 10.2 High-Growth Applications and Customer Groups
- 10.3 Underserved Markets and White-Space Opportunities
- 10.4 Emerging Technology and Product Opportunities
- 10.5 New Capacity and Investment Hotspots
- 10.6 Market Entry and Expansion Opportunities
- 10.7 Distribution and Partnership Opportunities
- 10.8 Near-Term and Long-Term Commercial Potential
- 10.9 Opportunity Attractiveness and Execution Risks
Chapter 11 Indonesia Ready-to-Drink Tea Market Outlook, 2025-2035
- 11.1 Market Size and Analysis
- 11.1.1 Revenue (Market Measurement: 2025: USD 1.16 billion → 2035: USD 2.21 billion)
- 11.1.2 Market Volume and Quantity Sold
- 11.1.3 Historical Market Size, 2018-2025
- 11.1.4 Base-Year Market Size, 2025
- 11.2 Market Forecast, 2025-2035
- 11.2.1 Revenue Forecast to 2035
- 11.2.2 Volume Forecast to 2035
- 11.2.3 CAGR and Year-on-Year Growth
- 11.2.4 Incremental Revenue Opportunity
- 11.3 Forecast Assumptions and Scenario Analysis
- 11.3.1 Base-Case Forecast
- 11.3.2 Optimistic and Conservative Scenarios
- 11.3.3 Technology, Pricing and Policy Sensitivities
- 11.4 Market Attractiveness and Growth Outlook
Chapter 12 Indonesia Ready-to-Drink Tea Market Segmentation and Outlook
- 12.1 Segmentation Summary and Market Shares, 2025
- 12.2 Largest and Fastest-Growing Segments
- 12.3 By Product Type - Market Size and Forecast, 2025-2035
- 12.3.1 Segment Definition and Scope
- 12.3.2 Historical Market Size, 2018-2025
- 12.3.3 Revenue Forecast, 2025-2035
- 12.3.4 Volume Forecast, 2025-2035
- 12.3.5 Base-Year Market Share, 2025
- 12.3.6 Segment CAGR and Growth Drivers
- 12.3.7 Subsegment Market Size and Forecast
- 12.3.7.1 Jasmine and Black Tea
- 12.3.7.2 Green Tea
- 12.3.7.3 Fruit-Infused Tea
- 12.3.7.4 Herbal and Functional Tea
- 12.3.7.5 Milk Tea
- 12.3.8 Subsegment Pricing and Adoption Trends
- 12.3.9 Leading Suppliers and Competition
- 12.3.10 Regional Demand and Opportunities
- 12.4 By Packaging Format - Market Size and Forecast, 2025-2035
- 12.4.1 Segment Definition and Scope
- 12.4.2 Historical Market Size, 2018-2025
- 12.4.3 Revenue Forecast, 2025-2035
- 12.4.4 Volume Forecast, 2025-2035
- 12.4.5 Base-Year Market Share, 2025
- 12.4.6 Segment CAGR and Growth Drivers
- 12.4.7 Subsegment Market Size and Forecast
- 12.4.7.1 PET Bottles
- 12.4.7.2 Aseptic Cartons
- 12.4.7.3 Plastic Cups
- 12.4.7.4 Cans and Glass Bottles
- 12.4.8 Subsegment Pricing and Adoption Trends
- 12.4.9 Leading Suppliers and Competition
- 12.4.10 Regional Demand and Opportunities
- 12.5 By Price Tier - Market Size and Forecast, 2025-2035
- 12.5.1 Segment Definition and Scope
- 12.5.2 Historical Market Size, 2018-2025
- 12.5.3 Revenue Forecast, 2025-2035
- 12.5.4 Volume Forecast, 2025-2035
- 12.5.5 Base-Year Market Share, 2025
- 12.5.6 Segment CAGR and Growth Drivers
- 12.5.7 Subsegment Market Size and Forecast
- 12.5.7.1 Value
- 12.5.7.2 Mainstream
- 12.5.7.3 Premium
- 12.5.7.4 Functional Premium
- 12.5.8 Subsegment Pricing and Adoption Trends
- 12.5.9 Leading Suppliers and Competition
- 12.5.10 Regional Demand and Opportunities
- 12.6 Segment Growth Comparison
- 12.7 Segment Attractiveness and Priority Matrix
Chapter 13 Indonesia Ready-to-Drink Tea Geographic Market Outlook, 2025-2035
- 13.1 Domestic Market Distribution and Demand Clusters
- 13.2 State- or Province-Wise Market Size and Forecast, 2025-2035
- 13.3 City and Metropolitan Market Outlook
- 13.4 Industrial, Manufacturing and Commercial Clusters
- 13.5 Geographic Concentration of Key End Users
- 13.6 Local Pricing and Purchasing Differences
- 13.7 Domestic Production Facilities and Capacity Map
- 13.8 Local Infrastructure and Project Pipeline
- 13.9 State-Level Policy and Incentive Differences
- 13.10 Subnational Investment Hotspots and Opportunities
- 13.11 Distribution and Logistics Networks
- 13.12 Domestic Competitive Footprint
Chapter 14 Indonesia Ready-to-Drink Tea Technology, Innovation and Sustainability Outlook
- 14.1 Technology Landscape and Maturity
- 14.2 Product, Process and Service Innovation
- 14.3 AI, Automation and Digital Tools in the Industry
- 14.4 Technology Adoption and Performance Benchmarking
- 14.5 Innovation Pipeline and R&D Investment
- 14.6 Patent and Intellectual Property Trends
- 14.7 Energy Efficiency and Resource Management
- 14.8 Sustainability, Recycling and Circularity
- 14.9 Technology Roadmap, 2025-2035
- 14.10 Risks of Obsolescence and Technology Substitution
Chapter 15 Indonesia Ready-to-Drink Tea Market Key Strategic Imperatives
- 15.1 Growth and Market Entry Priorities
- 15.2 High-Return Products and Segments
- 15.3 Pricing, Profitability and Cost Optimization
- 15.4 Technology Investment and Product Differentiation
- 15.5 Supply Chain Localization and Resilience
- 15.6 Distribution and Customer Acquisition
- 15.7 Partnership, Acquisition and Capacity Strategy
- 15.8 Regional Expansion Priorities
- 15.9 Short-, Medium- and Long-Term Actions
Chapter 16 Competition Outlook
- 16.1 Industry Competition Characteristics
- 16.2 Market Structure and Concentration
- 16.3 Market Share and Competitive Positioning, 2025
- 16.4 Company-Wise Revenue and Product Benchmarking
- 16.5 Production and Service Capacity Benchmarking
- 16.6 Technology, Pricing and Differentiation
- 16.7 Regional Footprint and Distribution Strength
- 16.8 Mergers, Acquisitions and Strategic Alliances
- 16.9 New Entrants and Competitive Threats
- 16.10 Porter's Five Forces and Industry Attractiveness
- 16.11 Competitive Outlook, 2025-2035
Chapter 17 Company Profiles
- 17.1 Company Coverage and Selection Criteria
- 17.2 PT Mayora Indah Tbk
- 17.2.1 Business Description
- 17.2.2 Company Ownership and Geographic Presence
- 17.2.3 Product and Service Portfolio
- 17.2.4 Manufacturing and Operating Footprint
- 17.2.5 Production Capacity and Expansion Plans
- 17.2.6 Financial Performance and Investment
- 17.2.7 Market Share and Competitive Position
- 17.2.8 Technology and Innovation Capabilities
- 17.2.9 Strategic Alliances or Partnerships
- 17.2.10 Recent Developments
- 17.2.11 Growth Strategy and Outlook
- 17.3 PT Sinar Sosro
- 17.4 PT Ultrajaya Milk Industry & Trading Company Tbk
- 17.5 Coca-Cola Europacific Partners Indonesia
- 17.6 PT ABC President Indonesia
- 17.7 OT Group
- 17.8 Wings Food
- 17.9 PT Indofood CBP Sukses Makmur Tbk
- 17.10 PT Ichi Tan Indonesia
- 17.11 Other Relevant Market Participants
Note: Every listed company is profiled on the structure shown under the first company. The company list is preliminary and may change based on research findings, market developments, data availability and client requirements.
Chapter 18 Disclaimer
- 18.1 Research and Forecast Disclaimer
- 18.2 Data Source and Estimation Limitations
Note: The depth of individual sections depends on data availability for this market. Volume, capacity, trade and other unit-based metrics are included where applicable.

