
Hybrid adoption and protected growing shape demand
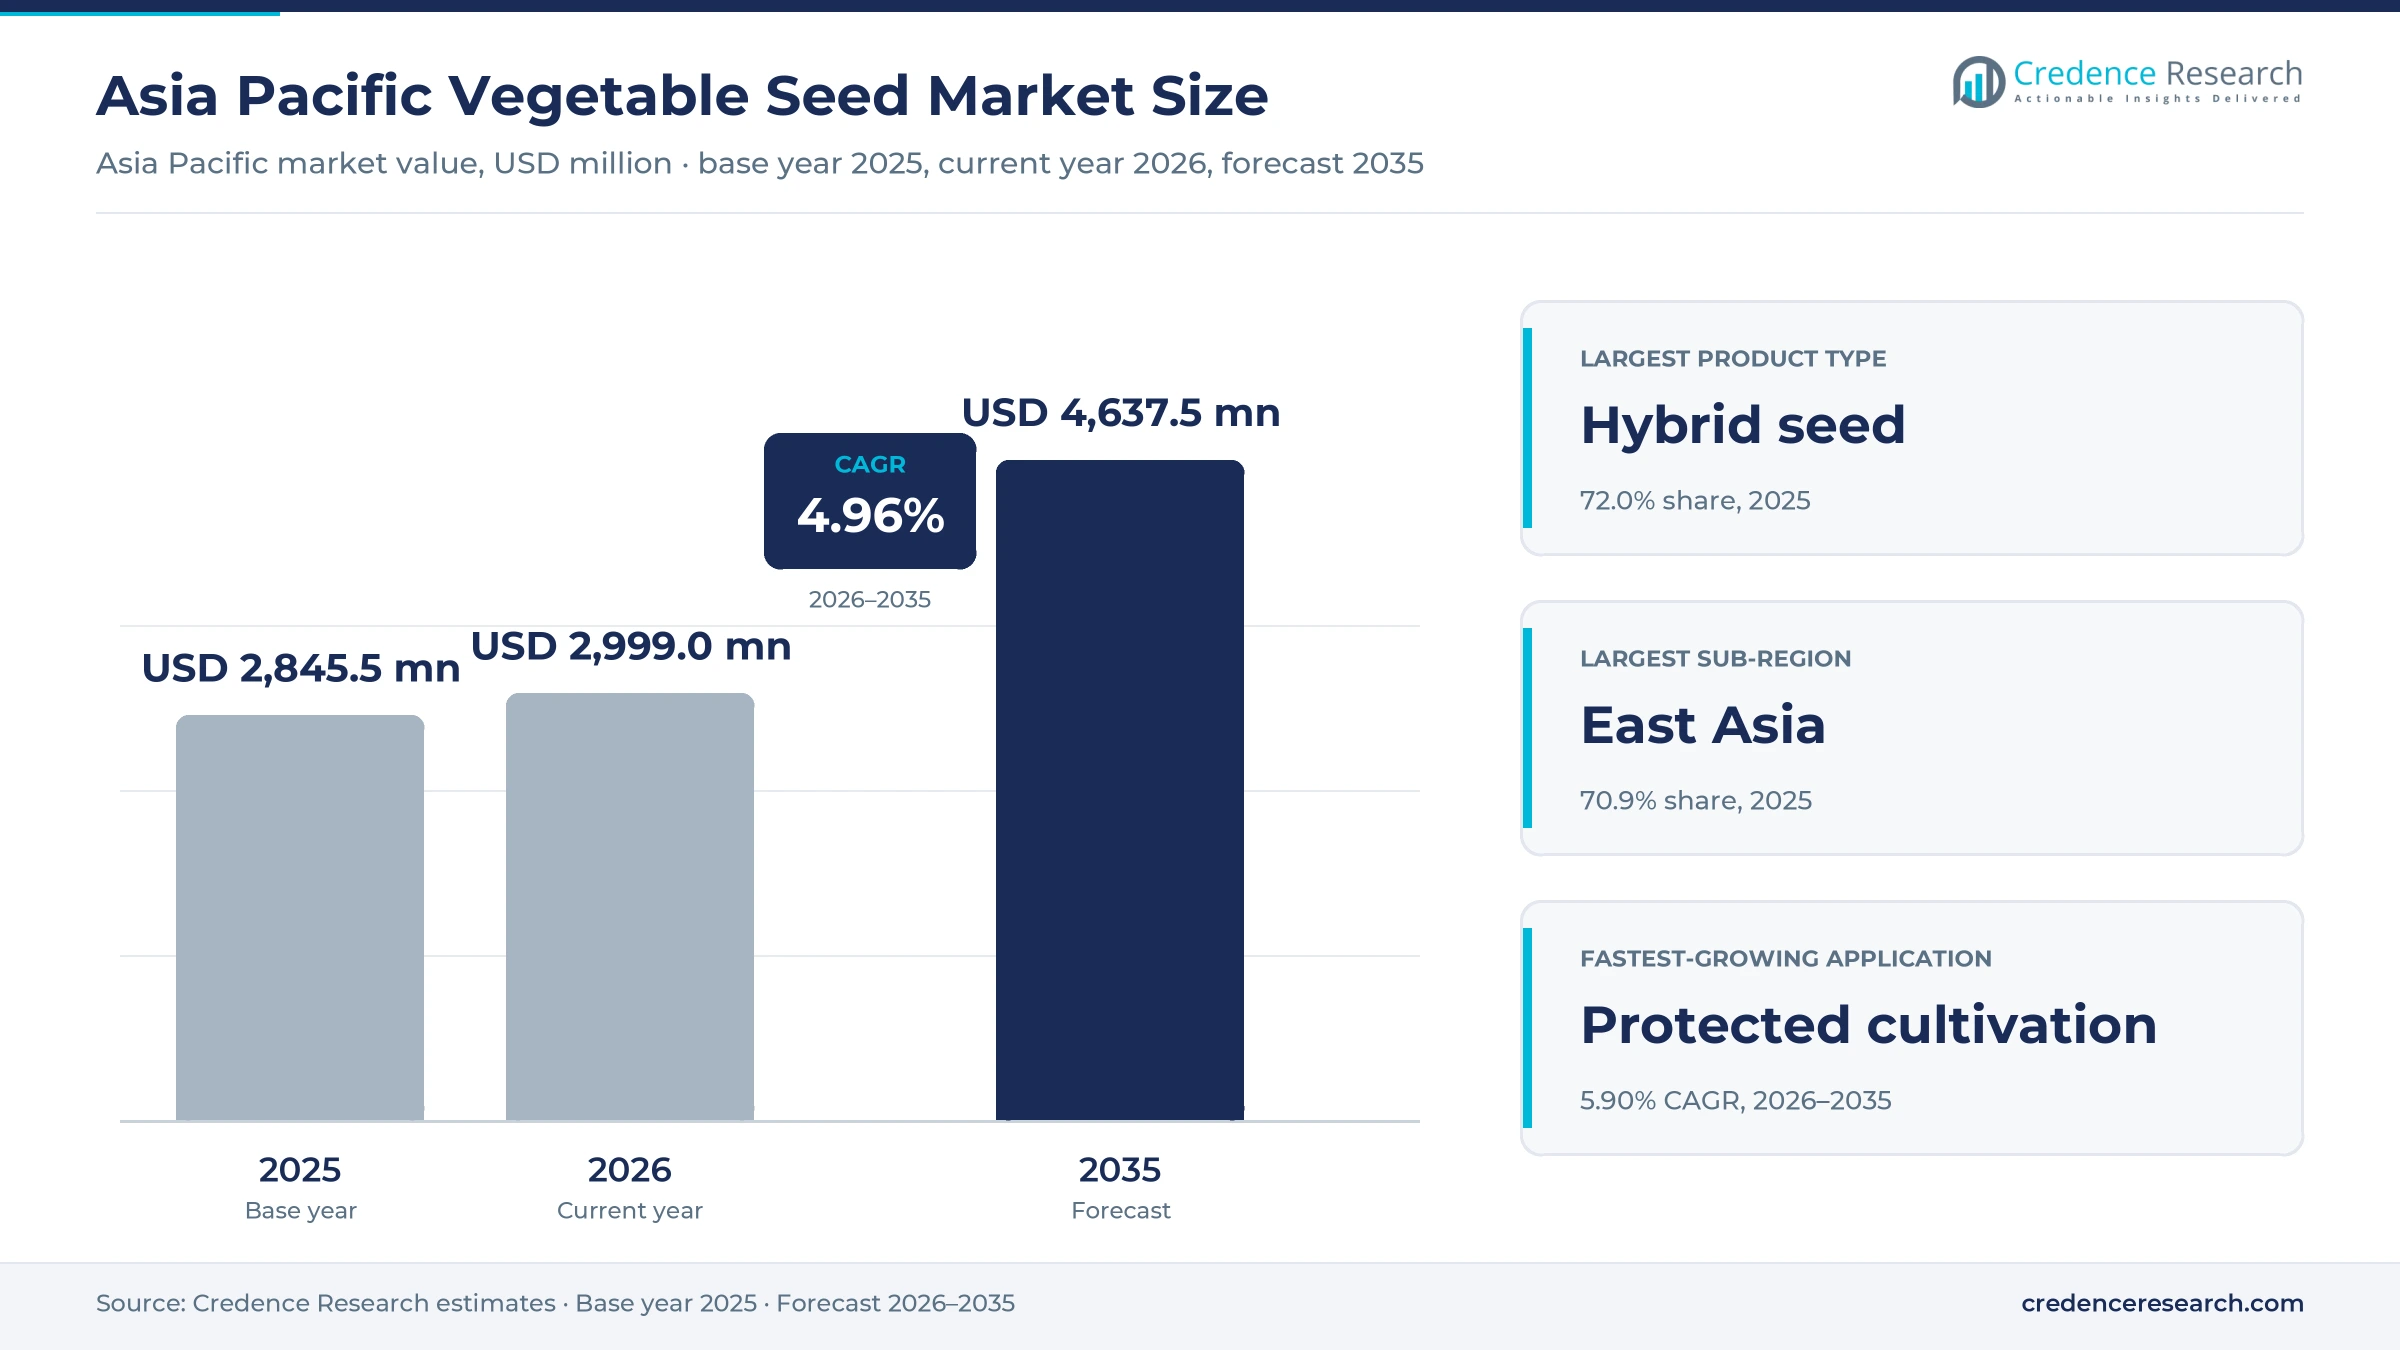
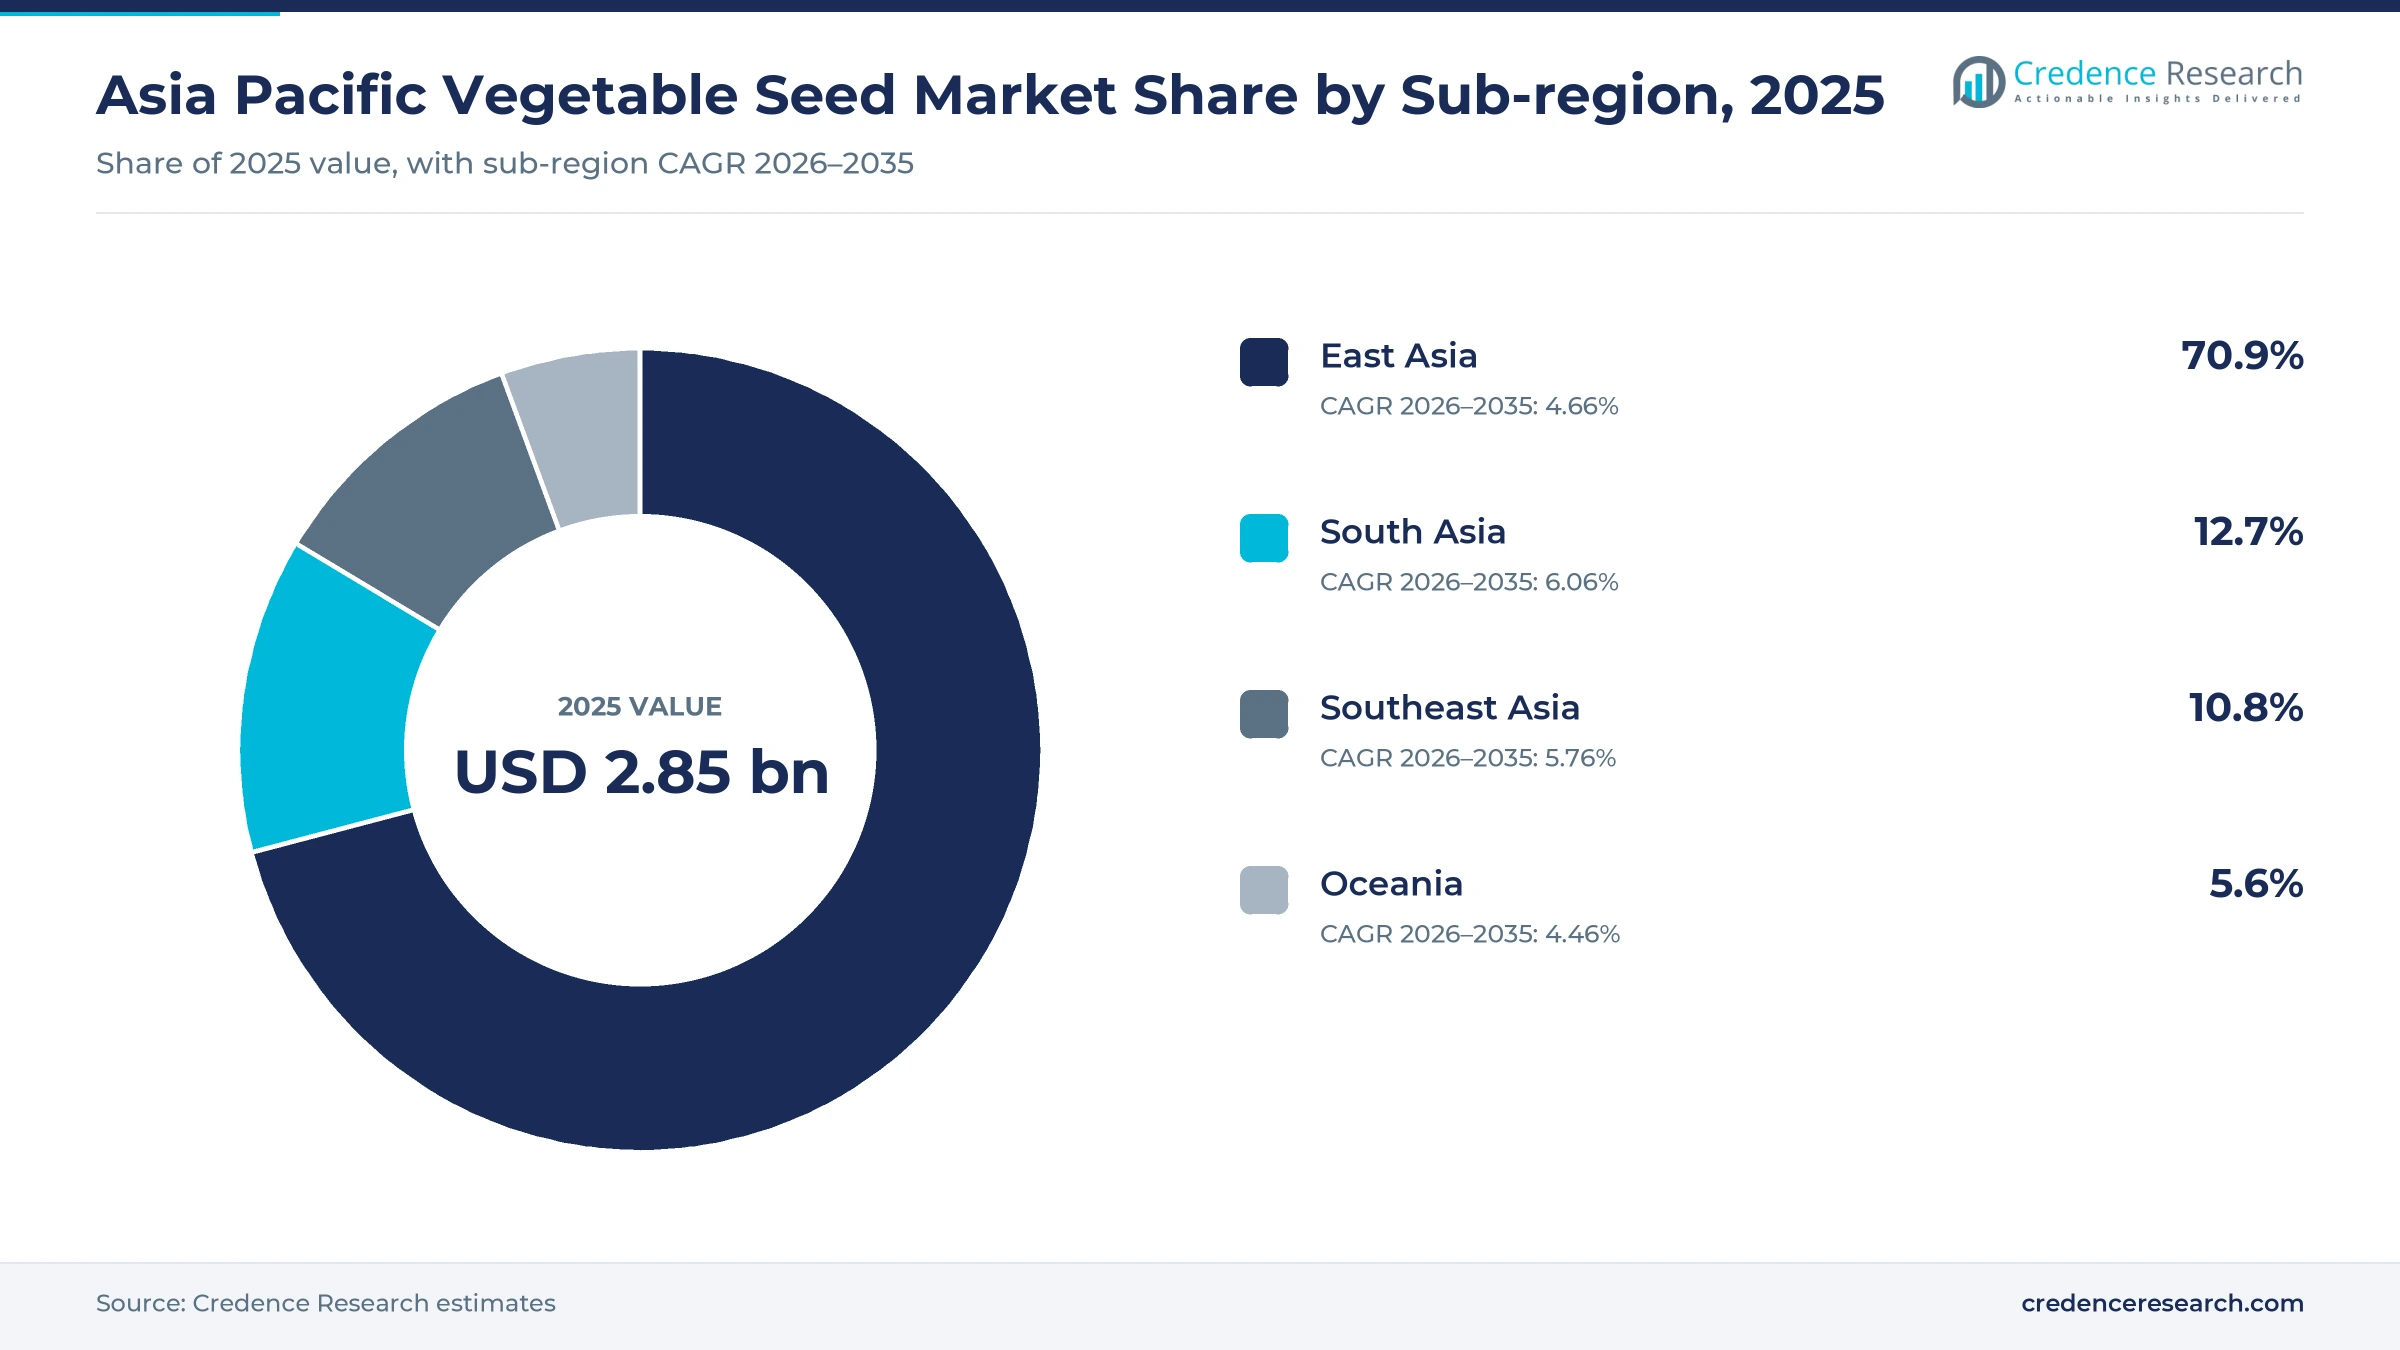
The Asia Pacific vegetable seed market was valued at USD 2.85 billion in 2025 and is projected to increase from USD 3.00 billion in 2026 to USD 4.64 billion by 2035, registering a CAGR of 4.96% during 2026–2035. Demand comes from professional growers, propagation nurseries and home gardeners that buy tomato, pepper, cucumber, cabbage and leafy vegetable seed each season. East Asia held the largest sub-regional share, 70.9% in 2025, because China grows close to half of the world's vegetables and buys hybrid seed for intensive greenhouse and open-field farms. South Asia is the fastest-growing sub-region at 6.06% a year, as Indian and Bangladeshi growers switch from saved seed to commercial hybrids. However, the biggest regulatory change came from China, where revised plant variety protection rules took effect in June 2025 and raised penalties for seed piracy, which supports investment in new varieties.
Which vegetable seed types and buyers does the estimate cover?
The estimate measures the value of vegetable seed sold for sowing in Asia Pacific, including first-generation hybrid seed, improved open-pollinated seed and commercially sold landrace seed. It counts seed bought by professional growers, propagation nurseries and home gardeners through dealer networks, direct producer sales and consumer retail stores.
The estimate excludes seed potatoes, seed for field crops such as grains and oilseeds, transplants sold as young plants and farm-saved seed that is not sold. The value chain runs from breeding stations and seed production farms through processing and testing plants to distributors, dealers, nurseries and growers in each sub-region.
Asia Pacific Vegetable Seed Market Insights
- The Asia Pacific vegetable seed market was valued at USD 2.85 billion in 2025 and is projected to reach USD 4.64 billion by 2035, registering a CAGR of 4.96% during 2026–2035.
- East Asia held a 70.9% share of 2025 value, because mainland China accounted for 45.5% of world vegetable output by volume in 2020.
- First-generation hybrid seed led with a 72.0% share of 2025 value, because hybrids give growers higher yields, uniform harvests and disease resistance.
- China's revised plant variety protection regulations took effect on June 1, 2025, raising maximum fines for seed infringement from five to ten times the goods' value.
- Protected cultivation grows fastest at 5.90% a year during 2026–2035, as greenhouse and net-house growers buy premium tomato, pepper and cucumber seed.
Hybrids lead while protected cultivation grows fastest
Why does hybrid seed hold most of the value?
Based on product type, the market is categorized into first-generation hybrid seed, improved open-pollinated seed and commercially sold landrace seed. First-generation hybrid seed led with a 72.0% share of 2025 value, because hybrids give growers higher yields, uniform harvests and built-in disease resistance. First-generation hybrid seed also grows fastest at 5.24% a year, as smallholders in South and Southeast Asia move away from saved seed.
Which crop families drive seed spending?
Based on crop type, the market is categorized into solanaceous crops, cucurbit crops, brassica crops and non-brassica vegetables. Solanaceous crops led with a 38.0% share of 2025 value, because tomato, pepper and eggplant seed carries the highest price per kilogram. Cucurbit crops grow fastest at 5.43% a year, as cucumber, pumpkin and bitter gourd hybrids spread across tropical farms.
How do open-field and greenhouse growers differ?
Based on application, the market is categorized into open-field cultivation, protected cultivation and home gardening. Open-field cultivation led with a 66.0% share of 2025 value, because most Asian vegetables still grow outdoors on small family farms. Protected cultivation grows fastest at 5.90% a year, as greenhouse and net-house growers pay more for premium seed with strong disease packages.
Which channels move the most seed?
Based on distribution channel, the market is categorized into dealer networks, direct producer sales and consumer retail. Dealer networks led with a 64.0% share of 2025 value, because village dealers reach millions of small growers with advice and credit. Direct producer sales grow fastest at 5.64% a year, as breeders sell straight to large growers and nurseries.
| Segment Group | Leading Sub-segment | Share, 2025 | Fastest-growing Sub-segment | CAGR, 2026–2035 |
|---|---|---|---|---|
| By Product Type | First-generation hybrid seed | 72.0% | First-generation hybrid seed | 5.24% |
| By Crop Type | Solanaceous crops | 38.0% | Cucurbit crops | 5.43% |
| By Application | Open-field cultivation | 66.0% | Protected cultivation | 5.90% |
| By Distribution Channel | Dealer networks | 64.0% | Direct producer sales | 5.64% |
Request a Free Sample
Fill in your details and we'll send you a free sample report.
- Sample data tables & charts
- Research methodology
Improved germplasm, greenhouses and quality rules lift sales
How does commercial adoption of improved germplasm lift sales?
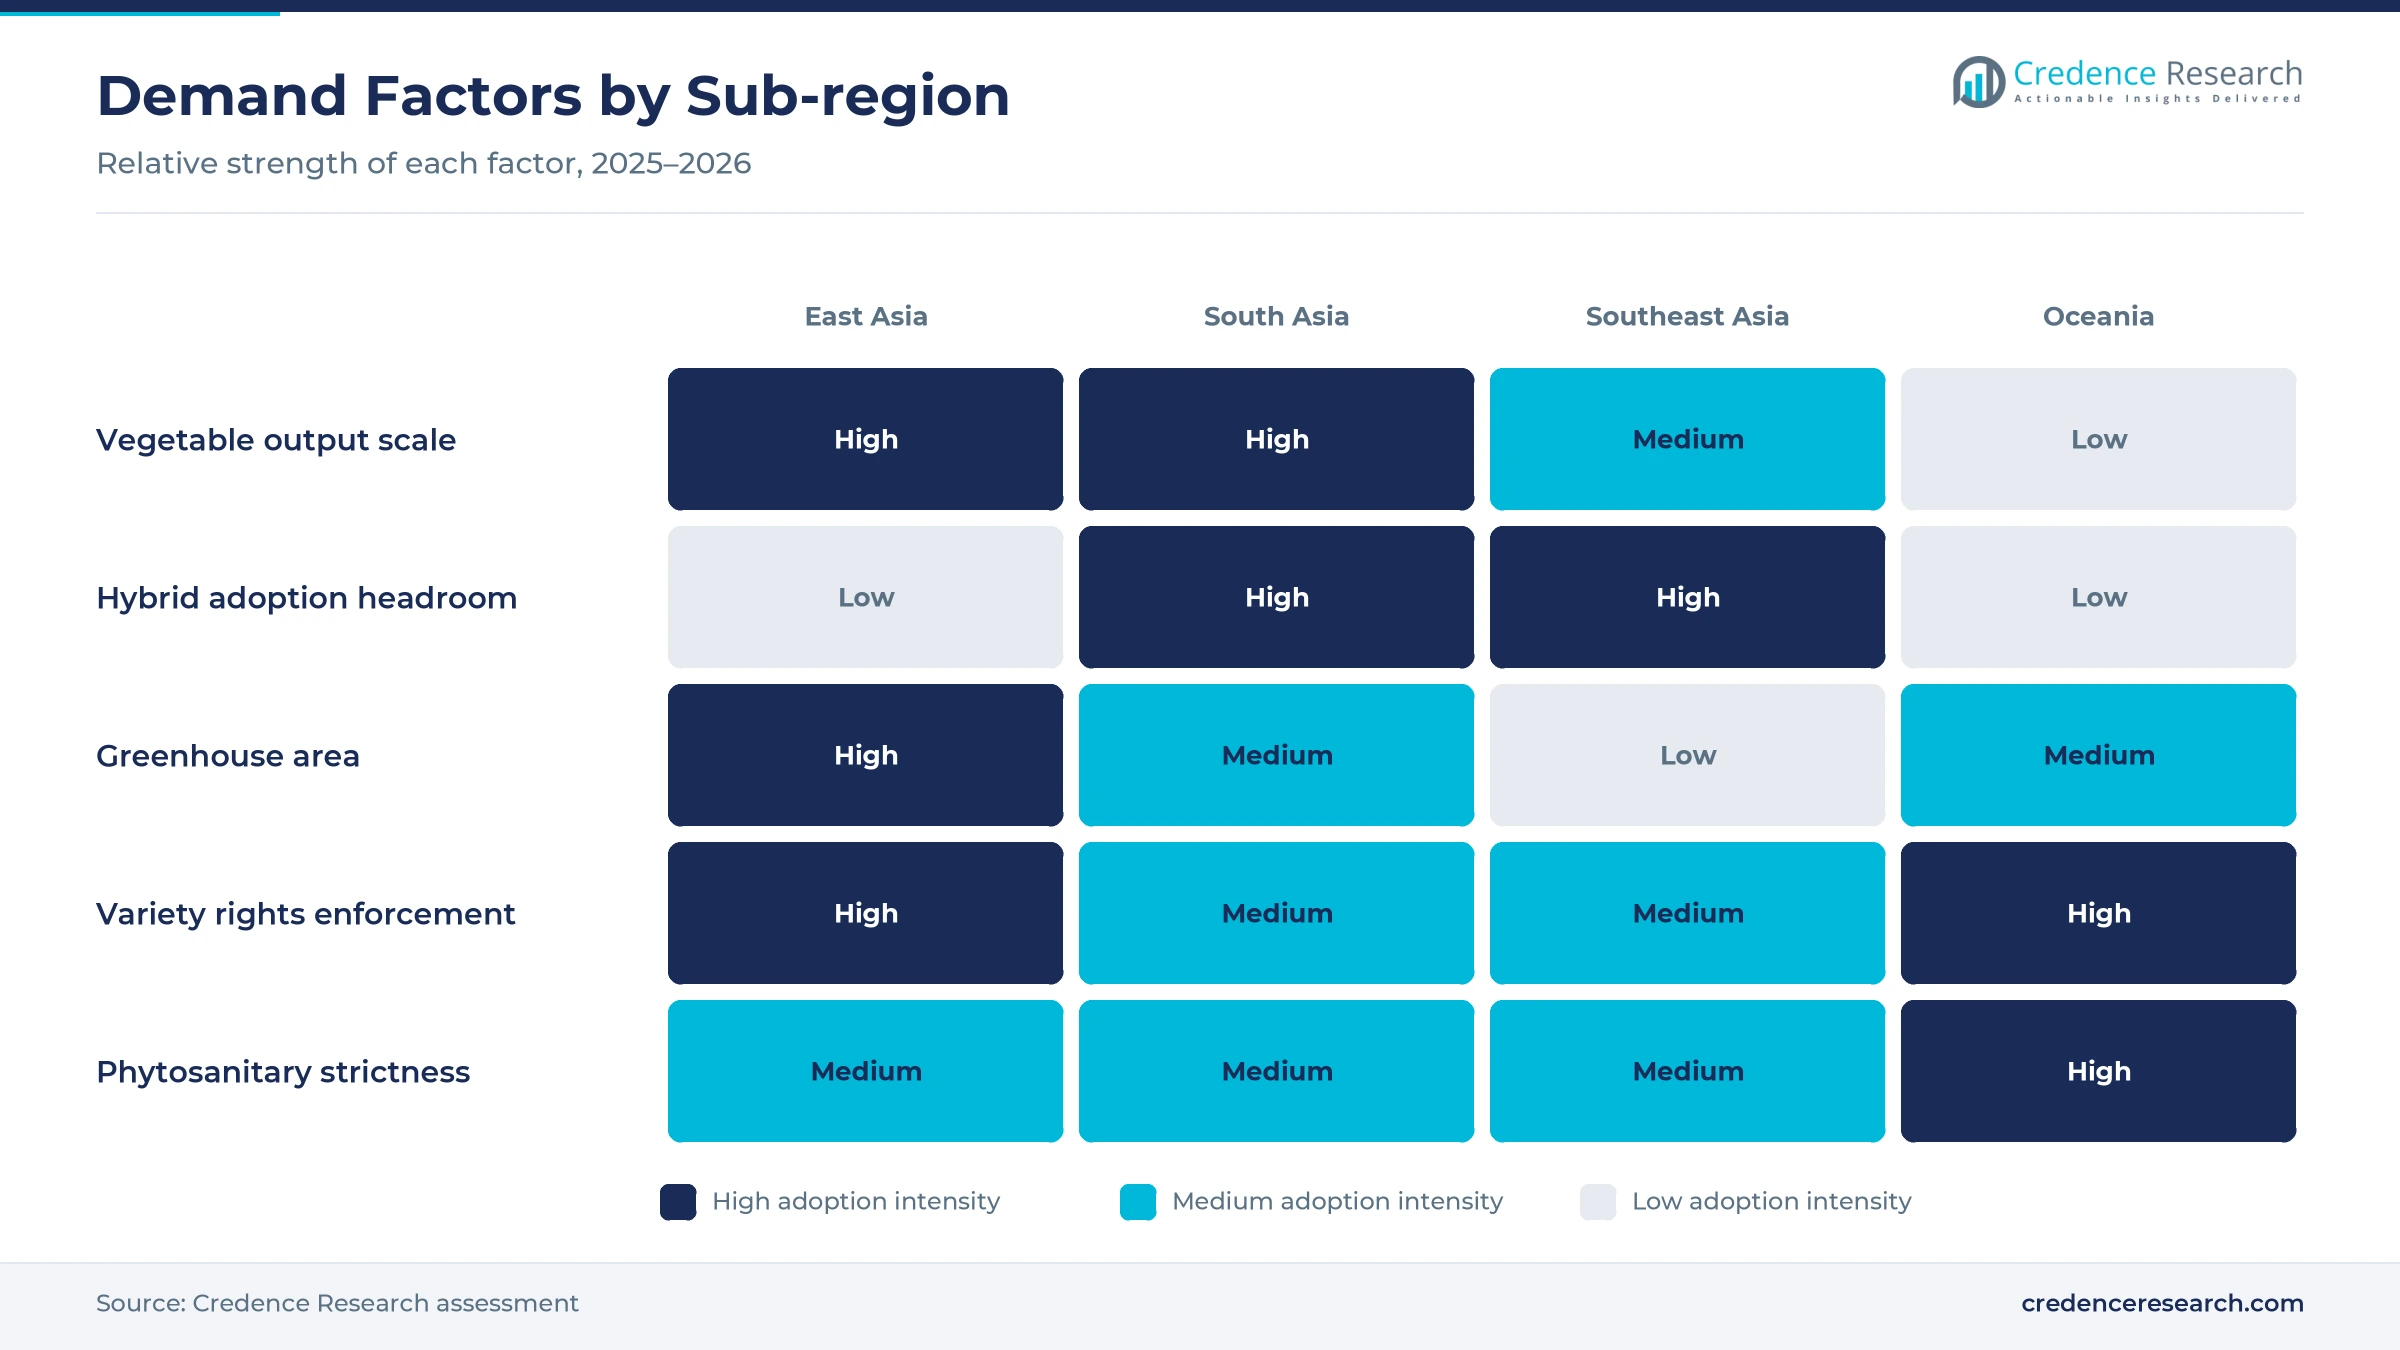
Commercial adoption of improved germplasm lifts sales, because growers who switch from saved seed to hybrids buy fresh seed every season. F1 hybrids hold about 70% of the Indian vegetable seed market by value, according to a World Vegetable Center chapter. East-West Seed opened its 36-hectare Hortanova Research Center in Batangas, Philippines, on Feb. 28, 2025, and its Suprema Gold squash raised output by 30% through virus resistance, according to the company. The Asia and Pacific Seed Association also counts more than 500 private seed company members. As a result, first-generation hybrid seed holds 72.0% of 2025 value, the largest product type in the region.
Why do protected cultivation and local adaptation raise value?
Protected cultivation and local adaptation raise value, because greenhouse growers need varieties bred for heat, humidity and local diseases. Nearly half of the world's greenhouse vegetable area sits in Asia, at about 0.2 million hectares in 2018, according to the same World Vegetable Center chapter. Sakata Seed opened its Ishigaki Research Station in Okinawa on June 21, 2026, to breed weather-tolerant tomato, squash and okra for tropical markets. Syngenta also launched its SapRaise hi-tech seedling nursery in Nashik in April 2024, where growers plant about 80,000 acres of tomato. In turn, protected cultivation grows at 5.90% a year, the fastest application during 2026–2035.
How does seed quality and phytosanitary differentiation help?
Seed quality and phytosanitary differentiation help established breeders, because stricter testing rewards companies with clean production and traceable seed lots. Australia required tomato and capsicum seed to be tested for tomato brown rugose fruit virus by authorized laboratories from Nov. 12, 2025, according to the Department of Agriculture, Fisheries and Forestry. India's draft Seeds Bill proposes QR codes on seed packets and fines of up to 3 million rupees for poor-quality seed. The draft drew about 18,000 responses after consultation in November and December 2025. As a result, buyers favor certified hybrid seed from breeders with strong testing systems.
Why does the high value of vegetables support seed spending?
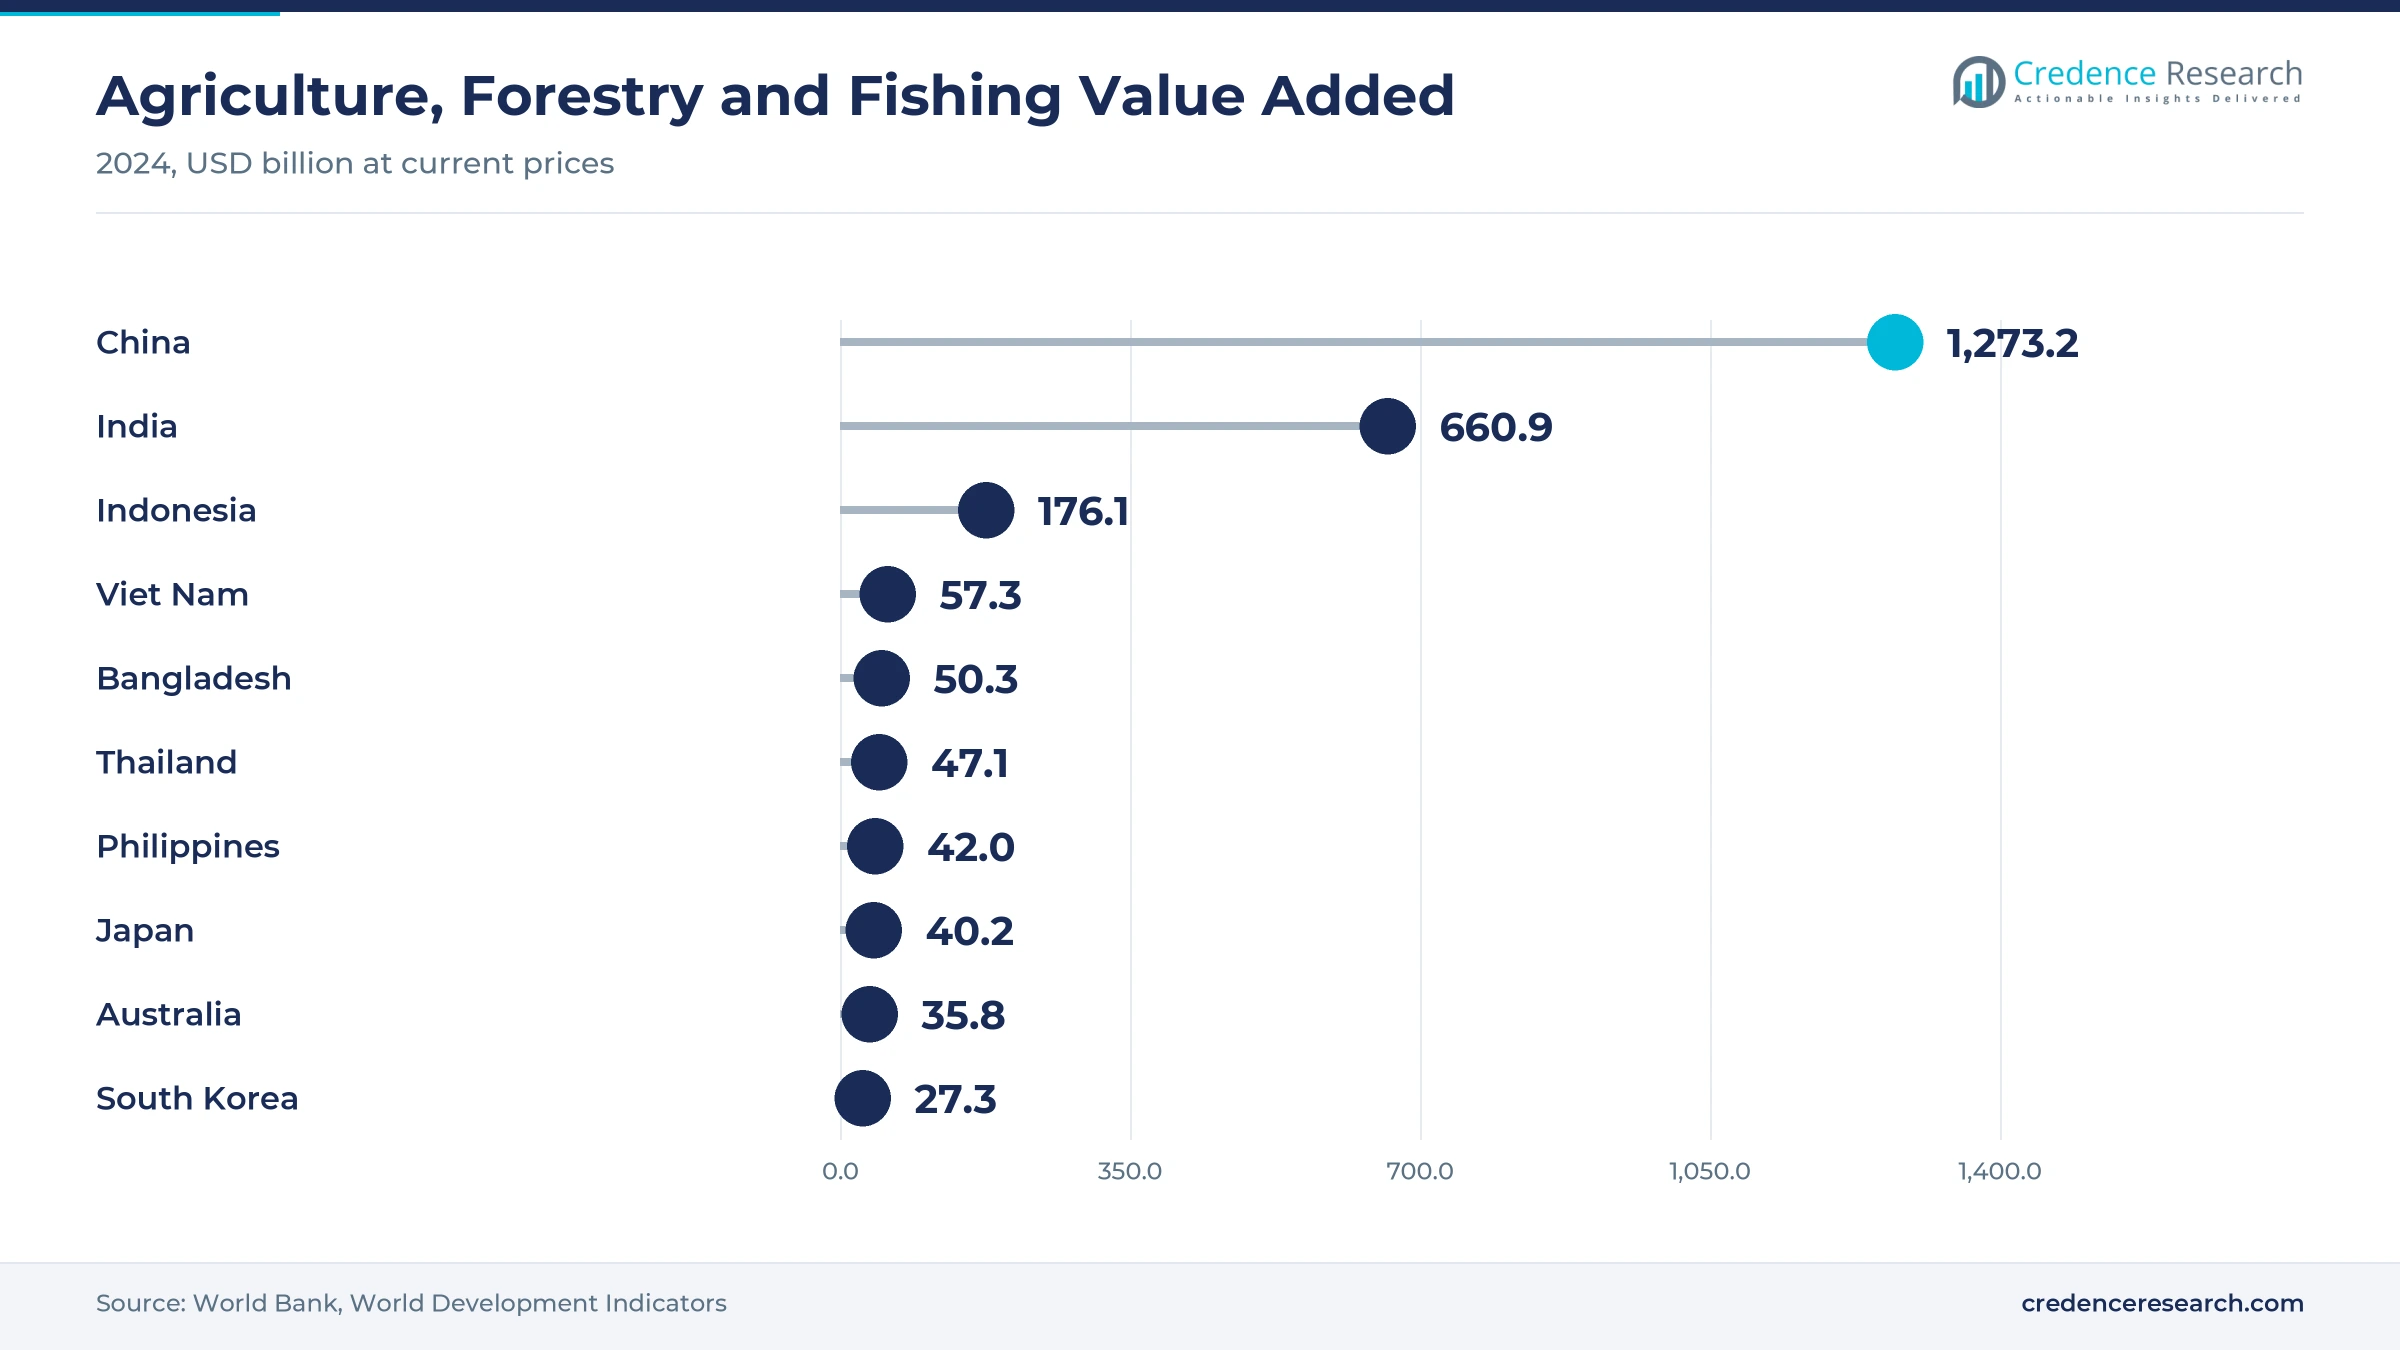
The high value of vegetables supports seed spending, because a good seed lot returns many times its cost in harvest value. Vegetables made up 19% of the value of global primary crop production in 2023, but only about 12% of its quantity, according to the FAO Statistical Yearbook 2025. Asia produced 78% of world vegetable value in 2020, or US$441 billion of US$568 billion. China's vegetable output also grew 5.7% a year from 1990 to 2020, compared with 1.5% outside Asia. In turn, East Asia holds the largest sub-regional share of seed value, because China leads regional vegetable output by a wide margin.
Seedling nurseries and variety rights reshape seed supply
How is the shift to professional seedling nurseries changing demand?
The shift to professional seedling nurseries is changing demand, because growers now buy healthy young plants instead of raising seedlings in open beds. Syngenta's SapRaise program in Maharashtra produces tomato, cauliflower, watermelon, capsicum and hot pepper seedlings with partner nurseries. Nashik district alone grows about 30,000 acres of cauliflower and 10,000 acres of capsicum and hot pepper. Syngenta started the program in April 2024 as a pilot, with plans to reach farmers in all Indian states. As a result, direct producer sales grow at 5.64% a year, the fastest channel, because breeders sell straight to large nurseries and growers that order seed in bulk before each season.
Why is the rise of stronger variety rights notable?
The rise of stronger variety rights is notable, because breeders invest more when copies of their hybrids face real penalties. China approved revised plant variety protection regulations on April 18, 2025, and they took effect on June 1, 2025, according to a legal review. The rules extend protection to harvested material and raise maximum fines from five to ten times the value of the goods. China had received 12,080 forest and grass variety applications and granted 5,848 by the end of 2024. In turn, breeders can fund new molecular breeding programs with more confidence in East Asia, because copies of protected hybrids now carry higher penalties.
Can climate-resilient varieties open new markets?
Climate-resilient varieties can open new markets, because heat, floods and new viruses cut yields for farmers across tropical Asia. Sakata's Ishigaki station uses a subtropical climate to test tomato, squash and okra in harsher conditions and speed up breeding cycles. East-West Seed's Suprema Gold squash carries intermediate resistance to squash leaf curl virus. Its Behula pumpkin also held nearly 70% of a local market in Bangladesh in August 2026, according to company field day reports. As a result, cucurbit crops grow at 5.43% a year, the fastest crop type, while seed treated with film coatings and pelleting gains space.
Is there room to grow through dealer field days?
Dealer field days offer room to grow, because smallholders adopt new hybrids after they see results on nearby farms. East-West Seed hosted more than 300 farmers and nearly 30 sub-dealers at a field day in Nakhon Si Thammarat, Thailand, in August 2026. The company also honored 26 farmer partners from six Indian states in Aurangabad in the same month. Its knowledge transfer team trains growers in Myanmar and other countries on crop practices, including spacing, nursery care and pest control. In turn, dealer networks keep 64.0% of 2025 value, because local dealers turn trial results into seed orders.
Fake seed, climate stress and seed saving weigh on sales
How do counterfeit and poor-quality lots hurt growers?
Counterfeit and poor-quality lots hurt growers, because a failed seed lot can wipe out a full season of income for a small farm. As a result, growers lose trust in new hybrids, and genuine brands lose sales to cheap copies in rural markets. Governments respond with registration rules, QR codes and stronger fines, which help buyers check the source of each packet. This risk falls as traceability spreads across major growing countries.
Why does climate stress raise seed production risk?
Climate stress raises seed production risk, because heat and heavy rain at flowering reduce seed yields on production farms. In turn, breeders face uneven supply of popular hybrids, which can leave dealers short in peak sowing months. Companies respond with production sites in several countries, protected seed farms and larger safety stocks, which spread weather risk. This pressure favors breeders with wide production networks across the region.
How does farm-saved seed limit hybrid uptake?
Farm-saved seed limits hybrid uptake, because many smallholders still keep seed from open-pollinated crops to avoid buying each season. As a result, hybrid sales grow slowly in poorer areas where cash and credit are scarce at sowing time. Breeders respond with small packs, dealer credit and field days that show yield gains, which help farmers try hybrids at low risk. This habit will keep open-pollinated seed in use for years.
Why do import rules slow seed movement?
Import rules slow seed movement, because each country sets its own testing, labeling and quarantine requirements for seed lots. In turn, breeders must test the same lot several times, which adds cost and delays deliveries to growers. Companies respond with accredited laboratories, clean production sites and early planning for shipments, which reduce rejected consignments. This burden favors larger breeders with regulatory teams in each market.
China keeps East Asia far ahead of other sub-regions
| Sub-region | Value, 2025 (USD billion) | Share, 2025 | CAGR, 2026–2035 |
|---|---|---|---|
| East Asia | 2.02 | 70.9% | 4.66% |
| South Asia | 0.36 | 12.7% | 6.06% |
| Southeast Asia | 0.31 | 10.8% | 5.76% |
| Oceania | 0.16 | 5.6% | 4.46% |
Why does East Asia hold the dominant share?
East Asia held a 70.9% share of 2025 value and grows at 4.66% a year, because mainland China accounted for 45.5% of world vegetable output by volume in 2020. Chinese growers run large greenhouse areas that buy premium tomato, pepper and cucumber seed. Rijk Zwaan planned a 32-hectare research center in Jimo for all of Asia, while Enza Zaden sells through a Beijing joint venture. As a result, East Asia leads both in volume and in premium seed spending.
What makes South Asia the fastest-growing sub-region?
South Asia held a 12.7% share of 2025 value and grows fastest at 6.06% a year, because Indian and Bangladeshi growers keep moving from saved seed to hybrids. F1 hybrids already hold most of the Indian vegetable seed market by value, according to the World Vegetable Center. India's draft Seeds Bill also proposes 27-member central and 15-member state seed committees. In turn, South Asia adds new hybrid buyers faster than any other sub-region.
How does Southeast Asia support tropical breeding?
Southeast Asia held a 10.8% share of 2025 value and grows at 5.76% a year, because tropical growers need varieties bred for heat, rain and local viruses. East-West Seed opened its Hortanova Research Center in the Philippines in February 2025 to test squash, sweet corn and bitter gourd. The company also hosts field days for farmers and sub-dealers in Thailand. As a result, Southeast Asia gains from breeders that develop tropical hybrids close to farms.
How does Oceania contribute?
Oceania held a 5.6% share of 2025 value and grows at 4.46% a year, because Australia and New Zealand have fewer growers but buy high-value seed for greenhouse and export crops. Australia added authorized laboratory testing for tomato and capsicum seed in November 2025. Many growers there use multi-span glasshouses for tomatoes and cucumbers. In turn, Oceania remains a premium but small sub-region within the regional market.
Breeding stations, rules and testing changes since 2024
| Development | Status and market relevance |
|---|---|
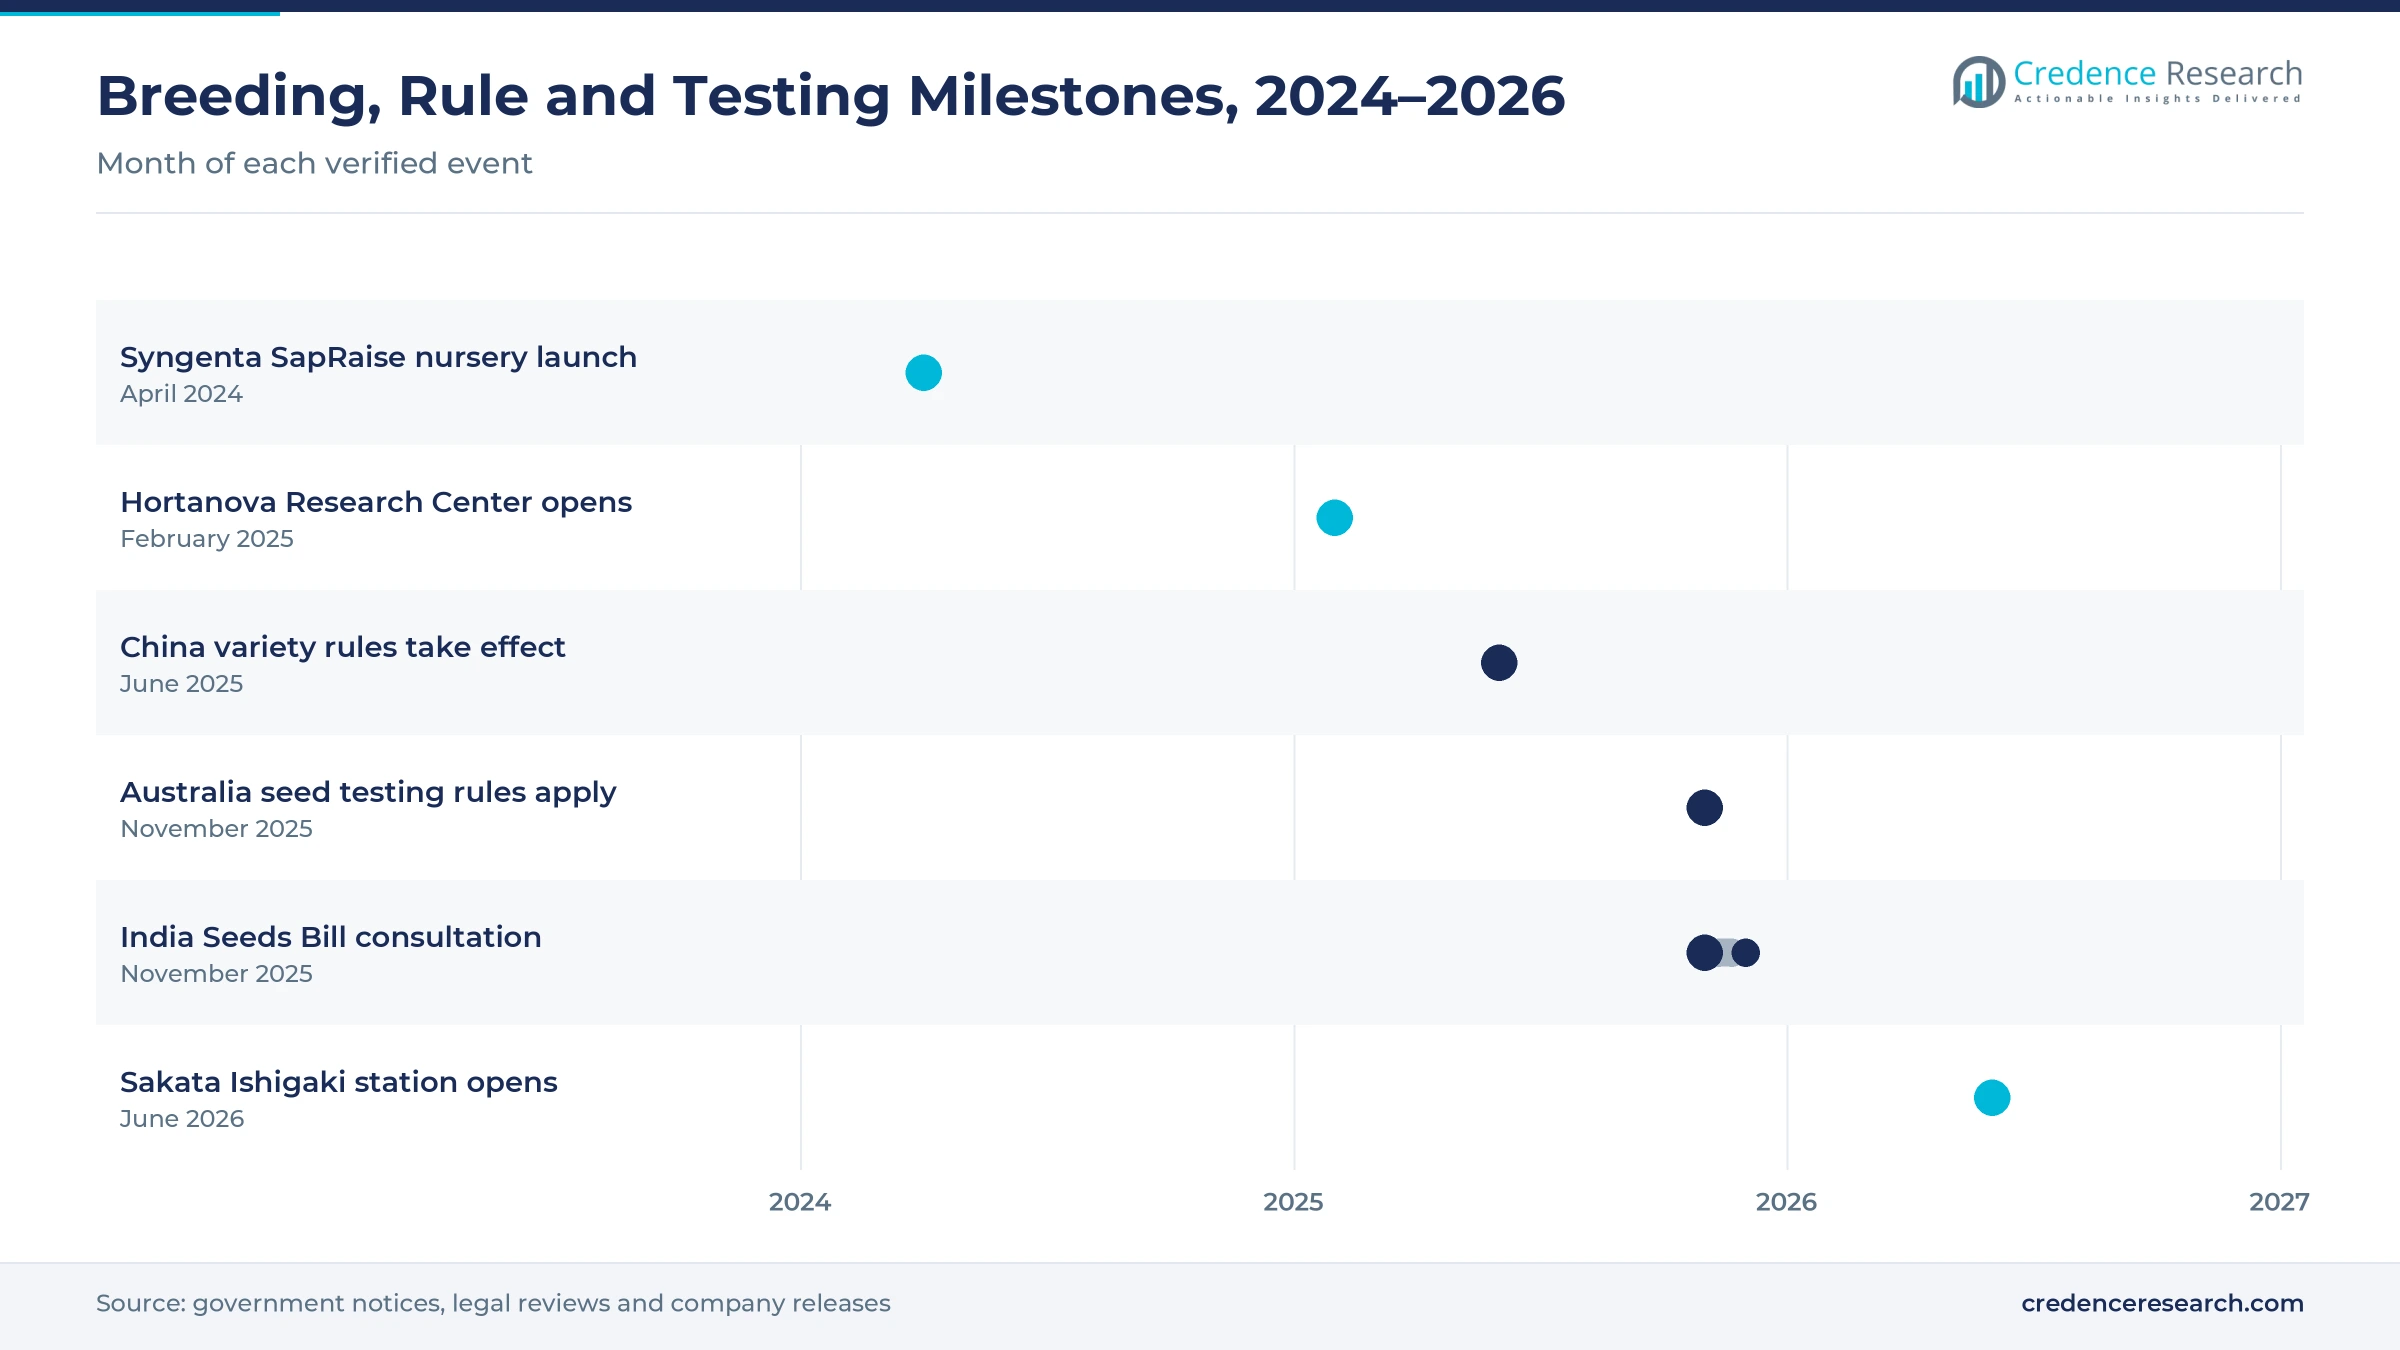
| In April 2024, Syngenta launched its SapRaise seedling nursery program in Nashik and Pune, Maharashtra. | Brings professional seedling supply to Indian growers |
| In February 2025, East-West Seed opened its 36-hectare Hortanova Research Center in Batangas, Philippines. | Adds tropical breeding and trial capacity |
| In June 2025, China's revised plant variety protection regulations took effect with higher penalties. | Strengthens breeder rights in the largest market |
| In November 2025, Australia began accepting only authorized laboratory tests for tomato and capsicum seed imports. | Raises phytosanitary standards for seed lots |
| In June 2026, Sakata Seed opened its Ishigaki Research Station in Okinawa for weather-tolerant varieties. | Speeds breeding for tropical markets |
Molecular breeding, disease testing and priming tools matter
- Molecular marker breeding speeds the selection of disease resistance and heat tolerance, which helps breeders release hybrids for tropical climates in fewer seasons.
- Real-time qPCR seed health testing detects viruses such as tomato brown rugose fruit virus in seed lots, which lets breeders meet stricter import rules in Australia and other markets.
- Seed priming, coating and pelleting improve germination and make small seeds easier to sow in nursery trays and precision planters across greenhouse farms.
- Protected seed production and storage shield parent lines from weather and pests, while dry cold storage keeps seed viable during long shipments between countries.
Need a Custom Version of This Report?
Tailor the scope, geography, or segments to your exact requirements.
- Custom geography or segment scope
- Direct access to our analyst team
Global breeders and Asian specialists compete on traits
Competition combines global breeders with broad trait portfolios and Asian specialists that know local crops, climates and dealer networks. East-West Seed competes in tropical vegetables across Southeast and South Asia and opened its Hortanova Research Center in 2025. Sakata Seed competes from Japan and opened a subtropical research station in 2026. Syngenta Vegetable Seeds competes in Indian tomato, pepper and seedling supply through its SapRaise nurseries. Rijk Zwaan and Enza Zaden compete in Chinese greenhouse crops through research sites and a joint venture. Bayer, Takii, Limagrain, BASF and Known-You Seed are also tracked in the company list. Rivals compete on disease resistance, yield, shelf life, seed purity, dealer support and price, which keeps local trials and field days important for every breeder.
Which breeders serve Asia Pacific growers?
| Company | Type | Role in the market |
|---|---|---|
| East-West Seed | Tropical vegetable breeder | Opened the Hortanova Research Center in the Philippines in 2025 |
| Sakata Seed Corporation | Japanese breeder | Opened the Ishigaki Research Station in 2026 |
| Syngenta Vegetable Seeds | Global breeder | Runs SapRaise seedling nurseries in Maharashtra |
| Rijk Zwaan | Global breeder | Planned a research center in Jimo for Asian markets |
| Enza Zaden | Global breeder | Sells in China through Enza Zaden Beijing Seeds |
Credence Research view on hybrid uptake in Asia
Credence Research's view is that Asia Pacific vegetable seed sales will grow steadily because smallholders keep switching to hybrids while greenhouse growers pay more for disease resistance. Hybrid seed remains the largest value pool, while protected cultivation and South Asia add the fastest growth. Stronger variety rights in China and stricter testing in Australia favor breeders with clean, traceable seed. Companies that pair local breeding stations with strong dealer networks should gain the most, because growers adopt hybrids they have seen succeed on nearby farms.
How the regional seed sales estimate was built
The report uses 2025 as the base year on a calendar basis, and market values come from the Credence Research model. That model combines international agency statistics on vegetable output and value, agricultural value added, seed regulations and company releases on breeding stations and launches. Segment splits and sub-regional growth rates are Credence Research estimates, while sub-regional shares follow the client-provided split. Sources used are international agency data, government notices, research institute papers, legal reviews and company releases, and no interviews or surveys were used.
South Asia and greenhouse growers carry growth to 2035
The Asia Pacific vegetable seed market is expected to reach USD 4.64 billion by 2035, a 4.96% CAGR during 2026–2035, as growers adopt hybrids, greenhouses and professional seedlings across the region. Growth should be strongest in protected cultivation, cucurbit crops and South Asia, because these areas gain most from new varieties and better farm incomes. Counterfeit seed, climate stress and farm-saved seed could slow growth in some markets, while stronger variety rights should support breeder investment.
Frequently Asked Questions
How big is the Asia Pacific vegetable seed market?
Which product type leads Asia Pacific vegetable seed sales?
Which sub-region leads the market?
How did China change its plant variety rules?
Why are hybrids popular in India?
Which application grows fastest?
Who are the leading companies in this market?
What are the main challenges for seed companies?
Table of Content
Chapter 1 Market Segmentation
- 1.1 Segmentation Framework
- 1.1.1 Product and Service Classification
- 1.1.2 Application and End-Use Classification
- 1.1.3 Technology and Solution Classification
- 1.1.4 Customer and Distribution Channel Classification
- 1.1.5 Geographic Segmentation
- 1.1.6 Market Segment Definitions and Boundaries
- 1.2 By Product Type
- 1.2.1 First-generation hybrid seed
- 1.2.2 Improved open-pollinated seed
- 1.2.3 Commercially sold landrace seed
- 1.3 By Crop Type
- 1.3.1 Solanaceous crops
- 1.3.2 Cucurbit crops
- 1.3.3 Brassica crops
- 1.3.4 Non-brassica vegetables
- 1.4 By Application
- 1.4.1 Open-field cultivation
- 1.4.2 Protected cultivation
- 1.4.3 Home gardening
- 1.5 By Sub-region
- 1.5.1 East Asia
- 1.5.2 South Asia
- 1.5.3 Southeast Asia
- 1.5.4 Oceania
Chapter 2 Introduction
- 2.1 Report Objectives and Scope
- 2.2 Product Definition and Industry Terminology
- 2.3 Market Inclusions and Exclusions
- 2.4 Research Process
- 2.4.1 Primary Research and Expert Interviews
- 2.4.2 Secondary Research and Source Review
- 2.4.3 Top-Down and Bottom-Up Estimation
- 2.4.4 Data Triangulation and Verification
- 2.5 Market Size Measurement Basis
- 2.5.1 2025: USD 2.85 billion → 2035: USD 4.64 billion
- 2.6 Historical and Forecast Reference Periods
- 2.6.1 Historical Period: 2018-2025
- 2.6.2 Base Year: 2025
- 2.6.3 Forecast Period: 2025-2035
- 2.7 Research Assumptions and Limitations
Chapter 3 Executive Summary
- 3.1 Market Snapshot and Key Findings
- 3.2 Base-Year Market Size, 2025
- 3.3 Forecast Market Size, 2035
- 3.4 Revenue and Volume Growth Outlook
- 3.5 Key Demand and Supply Indicators
- 3.6 Leading Market Segments
- 3.7 Fastest-Growing Market Opportunities
- 3.8 Regional Performance Highlights
- 3.9 Technology and Industry Transformation
- 3.10 Competitive Landscape Summary
- 3.11 Analyst View and Strategic Implications
Chapter 4 Asia Pacific Vegetable Seed Market Trends and Developments
- 4.1 Historical Industry Development, 2018-2025
- 4.2 Recent Market Trends and Developments
- 4.3 Demand and Customer Behavior Trends
- 4.4 Technology and Product Innovation
- 4.5 Artificial Intelligence, Automation and Digitalization
- 4.6 Local Manufacturing and Supply Chain Realignment
- 4.7 Industry Partnerships, Mergers and Acquisitions
- 4.8 Sustainability and Circular Economy Developments
- 4.9 Government and Private Sector Investment Trends
- 4.10 Emerging Business Models and Commercialization
- 4.11 Industry Developments and Announcements
Chapter 5 Asia Pacific Vegetable Seed Market Production, Supply and Demand Analysis
- 5.1 Demand Trend and Consumption Analysis, 2018-2025
- 5.2 Demand Forecast, 2025-2035
- 5.3 Production and Output Trend, 2018-2025
- 5.4 Production and Output Forecast, 2025-2035
- 5.5 Installed Capacity and Capacity Utilization
- 5.6 Company-Wise Production Plants and Statistics
- 5.6.1 Installed Production Capacity
- 5.6.2 Actual Production
- 5.6.3 Planned Capacity and Expansion Targets
- 5.7 Supply Chain Structure and Procurement Trends
- 5.8 Supply-Demand Gap and Bottlenecks
- 5.9 Import Dependence and Sourcing Structure
- 5.10 Contract Manufacturing and Outsourcing
- 5.11 Regional Supply and Demand Concentration
Chapter 6 Asia Pacific Vegetable Seed Market Pricing Analysis
- 6.1 Pricing Structure and Measurement
- 6.2 Historical Pricing Trends, 2018-2025
- 6.3 Pricing Outlook, 2025-2035
- 6.4 Average Selling Price and Unit Economics
- 6.5 Pricing by Product and Market Segment
- 6.6 Geographic Pricing Differences
- 6.7 Key Input, Energy, Labor and Logistics Costs
- 6.8 Contract Pricing and Purchasing Models
- 6.9 Pricing Sensitivity and Competitive Positioning
- 6.10 Price, Margin and Profitability Implications
Chapter 7 Asia Pacific Vegetable Seed Market Dynamics
- 7.1 Market Growth Drivers
- 7.1.1 Demand-Side Drivers
- 7.1.2 Technology and Innovation Drivers
- 7.1.3 Infrastructure and Investment Drivers
- 7.1.4 Regulatory and Policy Drivers
- 7.2 Market Restraints
- 7.2.1 Cost and Affordability Constraints
- 7.2.2 Technology and Adoption Barriers
- 7.2.3 Supply Chain and Operational Constraints
- 7.3 Market Challenges
- 7.3.1 Competitive Pressure and Margin Erosion
- 7.3.2 Skills, Infrastructure and Implementation Gaps
- 7.4 Emerging Market Opportunities
- 7.5 Market Dynamics Impact and Time-Horizon Assessment
Chapter 8 Asia Pacific Vegetable Seed Value Chain Analysis
- 8.1 Industry Value Chain Overview
- 8.2 Upstream Suppliers and Critical Inputs
- 8.3 Technology and Component Providers
- 8.4 Manufacturing or Service Delivery
- 8.5 Distribution, Channel Partners and Integrators
- 8.6 Downstream Applications and End Users
- 8.7 Value Addition and Profit Pools
- 8.8 Vertical Integration and Outsourcing
- 8.9 Supplier Concentration and Risk
- 8.10 Supply Chain Localization and Resilience
Chapter 9 Asia Pacific Vegetable Seed Market Regulations and Policies
- 9.1 Relevant Laws, Standards and Compliance Frameworks
- 9.2 Product, Service, Safety and Quality Requirements
- 9.3 Government Policies, Incentives and Subsidies
- 9.4 Imports, Exports and Trade Barriers
- 9.5 Public Procurement and Local Content Requirements
- 9.6 Environmental and Sustainability Compliance
- 9.7 Upcoming Policy Changes and Market Implications
Chapter 10 Asia Pacific Vegetable Seed Market Hotspots and Opportunities
- 10.1 Market Opportunity Mapping and Growth Hotspots
- 10.2 High-Growth Applications and Customer Groups
- 10.3 Underserved Markets and White-Space Opportunities
- 10.4 Emerging Technology and Product Opportunities
- 10.5 New Capacity and Investment Hotspots
- 10.6 Market Entry and Expansion Opportunities
- 10.7 Distribution and Partnership Opportunities
- 10.8 Near-Term and Long-Term Commercial Potential
- 10.9 Opportunity Attractiveness and Execution Risks
Chapter 11 Asia Pacific Vegetable Seed Market Outlook, 2025-2035
- 11.1 Market Size and Analysis
- 11.1.1 Revenue (Market Measurement: 2025: USD 2.85 billion → 2035: USD 4.64 billion)
- 11.1.2 Market Volume and Quantity Sold
- 11.1.3 Historical Market Size, 2018-2025
- 11.1.4 Base-Year Market Size, 2025
- 11.2 Market Forecast, 2025-2035
- 11.2.1 Revenue Forecast to 2035
- 11.2.2 Volume Forecast to 2035
- 11.2.3 CAGR and Year-on-Year Growth
- 11.2.4 Incremental Revenue Opportunity
- 11.3 Forecast Assumptions and Scenario Analysis
- 11.3.1 Base-Case Forecast
- 11.3.2 Optimistic and Conservative Scenarios
- 11.3.3 Technology, Pricing and Policy Sensitivities
- 11.4 Market Attractiveness and Growth Outlook
Chapter 12 Asia Pacific Vegetable Seed Market Segmentation and Outlook
- 12.1 Segmentation Summary and Market Shares, 2025
- 12.2 Largest and Fastest-Growing Segments
- 12.3 By Product Type - Market Size and Forecast, 2025-2035
- 12.3.1 Segment Definition and Scope
- 12.3.2 Historical Market Size, 2018-2025
- 12.3.3 Revenue Forecast, 2025-2035
- 12.3.4 Volume Forecast, 2025-2035
- 12.3.5 Base-Year Market Share, 2025
- 12.3.6 Segment CAGR and Growth Drivers
- 12.3.7 Subsegment Market Size and Forecast
- 12.3.7.1 First-generation hybrid seed
- 12.3.7.2 Improved open-pollinated seed
- 12.3.7.3 Commercially sold landrace seed
- 12.3.8 Subsegment Pricing and Adoption Trends
- 12.3.9 Leading Suppliers and Competition
- 12.3.10 Regional Demand and Opportunities
- 12.4 By Crop Type - Market Size and Forecast, 2025-2035
- 12.4.1 Segment Definition and Scope
- 12.4.2 Historical Market Size, 2018-2025
- 12.4.3 Revenue Forecast, 2025-2035
- 12.4.4 Volume Forecast, 2025-2035
- 12.4.5 Base-Year Market Share, 2025
- 12.4.6 Segment CAGR and Growth Drivers
- 12.4.7 Subsegment Market Size and Forecast
- 12.4.7.1 Solanaceous crops
- 12.4.7.2 Cucurbit crops
- 12.4.7.3 Brassica crops
- 12.4.7.4 Non-brassica vegetables
- 12.4.8 Subsegment Pricing and Adoption Trends
- 12.4.9 Leading Suppliers and Competition
- 12.4.10 Regional Demand and Opportunities
- 12.5 By Application - Market Size and Forecast, 2025-2035
- 12.5.1 Segment Definition and Scope
- 12.5.2 Historical Market Size, 2018-2025
- 12.5.3 Revenue Forecast, 2025-2035
- 12.5.4 Volume Forecast, 2025-2035
- 12.5.5 Base-Year Market Share, 2025
- 12.5.6 Segment CAGR and Growth Drivers
- 12.5.7 Subsegment Market Size and Forecast
- 12.5.7.1 Open-field cultivation
- 12.5.7.2 Protected cultivation
- 12.5.7.3 Home gardening
- 12.5.8 Subsegment Pricing and Adoption Trends
- 12.5.9 Leading Suppliers and Competition
- 12.5.10 Regional Demand and Opportunities
- 12.6 By Sub-region - Market Size and Forecast, 2025-2035
- 12.6.1 Segment Definition and Scope
- 12.6.2 Historical Market Size, 2018-2025
- 12.6.3 Revenue Forecast, 2025-2035
- 12.6.4 Volume Forecast, 2025-2035
- 12.6.5 Base-Year Market Share, 2025
- 12.6.6 Segment CAGR and Growth Drivers
- 12.6.7 Subsegment Market Size and Forecast
- 12.6.7.1 East Asia
- 12.6.7.2 South Asia
- 12.6.7.3 Southeast Asia
- 12.6.7.4 Oceania
- 12.6.8 Subsegment Pricing and Adoption Trends
- 12.6.9 Leading Suppliers and Competition
- 12.6.10 Regional Demand and Opportunities
- 12.7 Segment Growth Comparison
- 12.8 Segment Attractiveness and Priority Matrix
Chapter 13 Asia Pacific Vegetable Seed End-Use and Application Market Outlook
- 13.1 End-Use Industry and Customer Demand Structure
- 13.2 Leading Applications and Customer Groups
- 13.3 End-Use Market Size, Share and Forecast
- 13.4 Major End-Use Industry Deep Dives
- 13.4.1 Customer Requirements and Use Cases
- 13.4.2 Demand and Replacement Cycles
- 13.4.3 Technical and Regulatory Considerations
- 13.4.4 Purchasing and Procurement Models
- 13.4.5 Leading Vendors and Distribution Channels
- 13.4.6 Forecast and Commercial Opportunities
- 13.5 Emerging Applications and Cross-Segment Demand
- 13.6 End-Use Industry Investment Priorities
Chapter 14 Asia Pacific Vegetable Seed Geographic Market Outlook, 2025-2035
- 14.1 Regional Market Size and Country-Level Shares, 2025
- 14.2 Country Market Size Comparison, 2025
- 14.3 Country Market Forecasts, 2025-2035
- 14.4 Subregional Industrial and Demand Clusters
- 14.5 Intra-Regional Pricing and Cost Differences
- 14.6 Cross-Border Trade and Supply Networks
- 14.7 Regional Supply and Demand Balances
- 14.8 Country Opportunity Comparison and Prioritization
Note: Every listed country is covered on the structure shown under the first country.
Chapter 15 Asia Pacific Vegetable Seed Technology, Innovation and Sustainability Outlook
- 15.1 Technology Landscape and Maturity
- 15.2 Product, Process and Service Innovation
- 15.3 AI, Automation and Digital Tools in the Industry
- 15.4 Technology Adoption and Performance Benchmarking
- 15.5 Innovation Pipeline and R&D Investment
- 15.6 Patent and Intellectual Property Trends
- 15.7 Energy Efficiency and Resource Management
- 15.8 Sustainability, Recycling and Circularity
- 15.9 Technology Roadmap, 2025-2035
- 15.10 Risks of Obsolescence and Technology Substitution
Chapter 16 Asia Pacific Vegetable Seed Market Key Strategic Imperatives
- 16.1 Growth and Market Entry Priorities
- 16.2 High-Return Products and Segments
- 16.3 Pricing, Profitability and Cost Optimization
- 16.4 Technology Investment and Product Differentiation
- 16.5 Supply Chain Localization and Resilience
- 16.6 Distribution and Customer Acquisition
- 16.7 Partnership, Acquisition and Capacity Strategy
- 16.8 Regional Expansion Priorities
- 16.9 Short-, Medium- and Long-Term Actions
Chapter 17 Competition Outlook
- 17.1 Industry Competition Characteristics
- 17.2 Market Structure and Concentration
- 17.3 Market Share and Competitive Positioning, 2025
- 17.4 Company-Wise Revenue and Product Benchmarking
- 17.5 Production and Service Capacity Benchmarking
- 17.6 Technology, Pricing and Differentiation
- 17.7 Regional Footprint and Distribution Strength
- 17.8 Mergers, Acquisitions and Strategic Alliances
- 17.9 New Entrants and Competitive Threats
- 17.10 Porter's Five Forces and Industry Attractiveness
- 17.11 Competitive Outlook, 2025-2035
Chapter 18 Company Profiles
- 18.1 Company Coverage and Selection Criteria
- 18.2 Syngenta Vegetable Seeds
- 18.2.1 Business Description
- 18.2.2 Company Ownership and Geographic Presence
- 18.2.3 Product and Service Portfolio
- 18.2.4 Manufacturing and Operating Footprint
- 18.2.5 Production Capacity and Expansion Plans
- 18.2.6 Financial Performance and Investment
- 18.2.7 Market Share and Competitive Position
- 18.2.8 Technology and Innovation Capabilities
- 18.2.9 Strategic Alliances or Partnerships
- 18.2.10 Recent Developments
- 18.2.11 Growth Strategy and Outlook
- 18.3 Bayer Vegetable Seeds
- 18.4 Sakata Seed Corporation
- 18.5 East-West Seed
- 18.6 Takii & Co., Ltd.
- 18.7 Limagrain Vegetable Seeds
- 18.8 Rijk Zwaan
- 18.9 BASF Vegetable Seeds
- 18.10 Enza Zaden
- 18.11 Known-You Seed Co., Ltd.
- 18.12 Other Relevant Market Participants
Note: Every listed company is profiled on the structure shown under the first company. The company list is preliminary and may change based on research findings, market developments, data availability and client requirements.
Chapter 19 Disclaimer
- 19.1 Research and Forecast Disclaimer
- 19.2 Data Source and Estimation Limitations
Note: The depth of individual sections depends on data availability for this market. Volume, capacity, trade and other unit-based metrics are included where applicable.

