
Large orchards and daily household use anchor demand
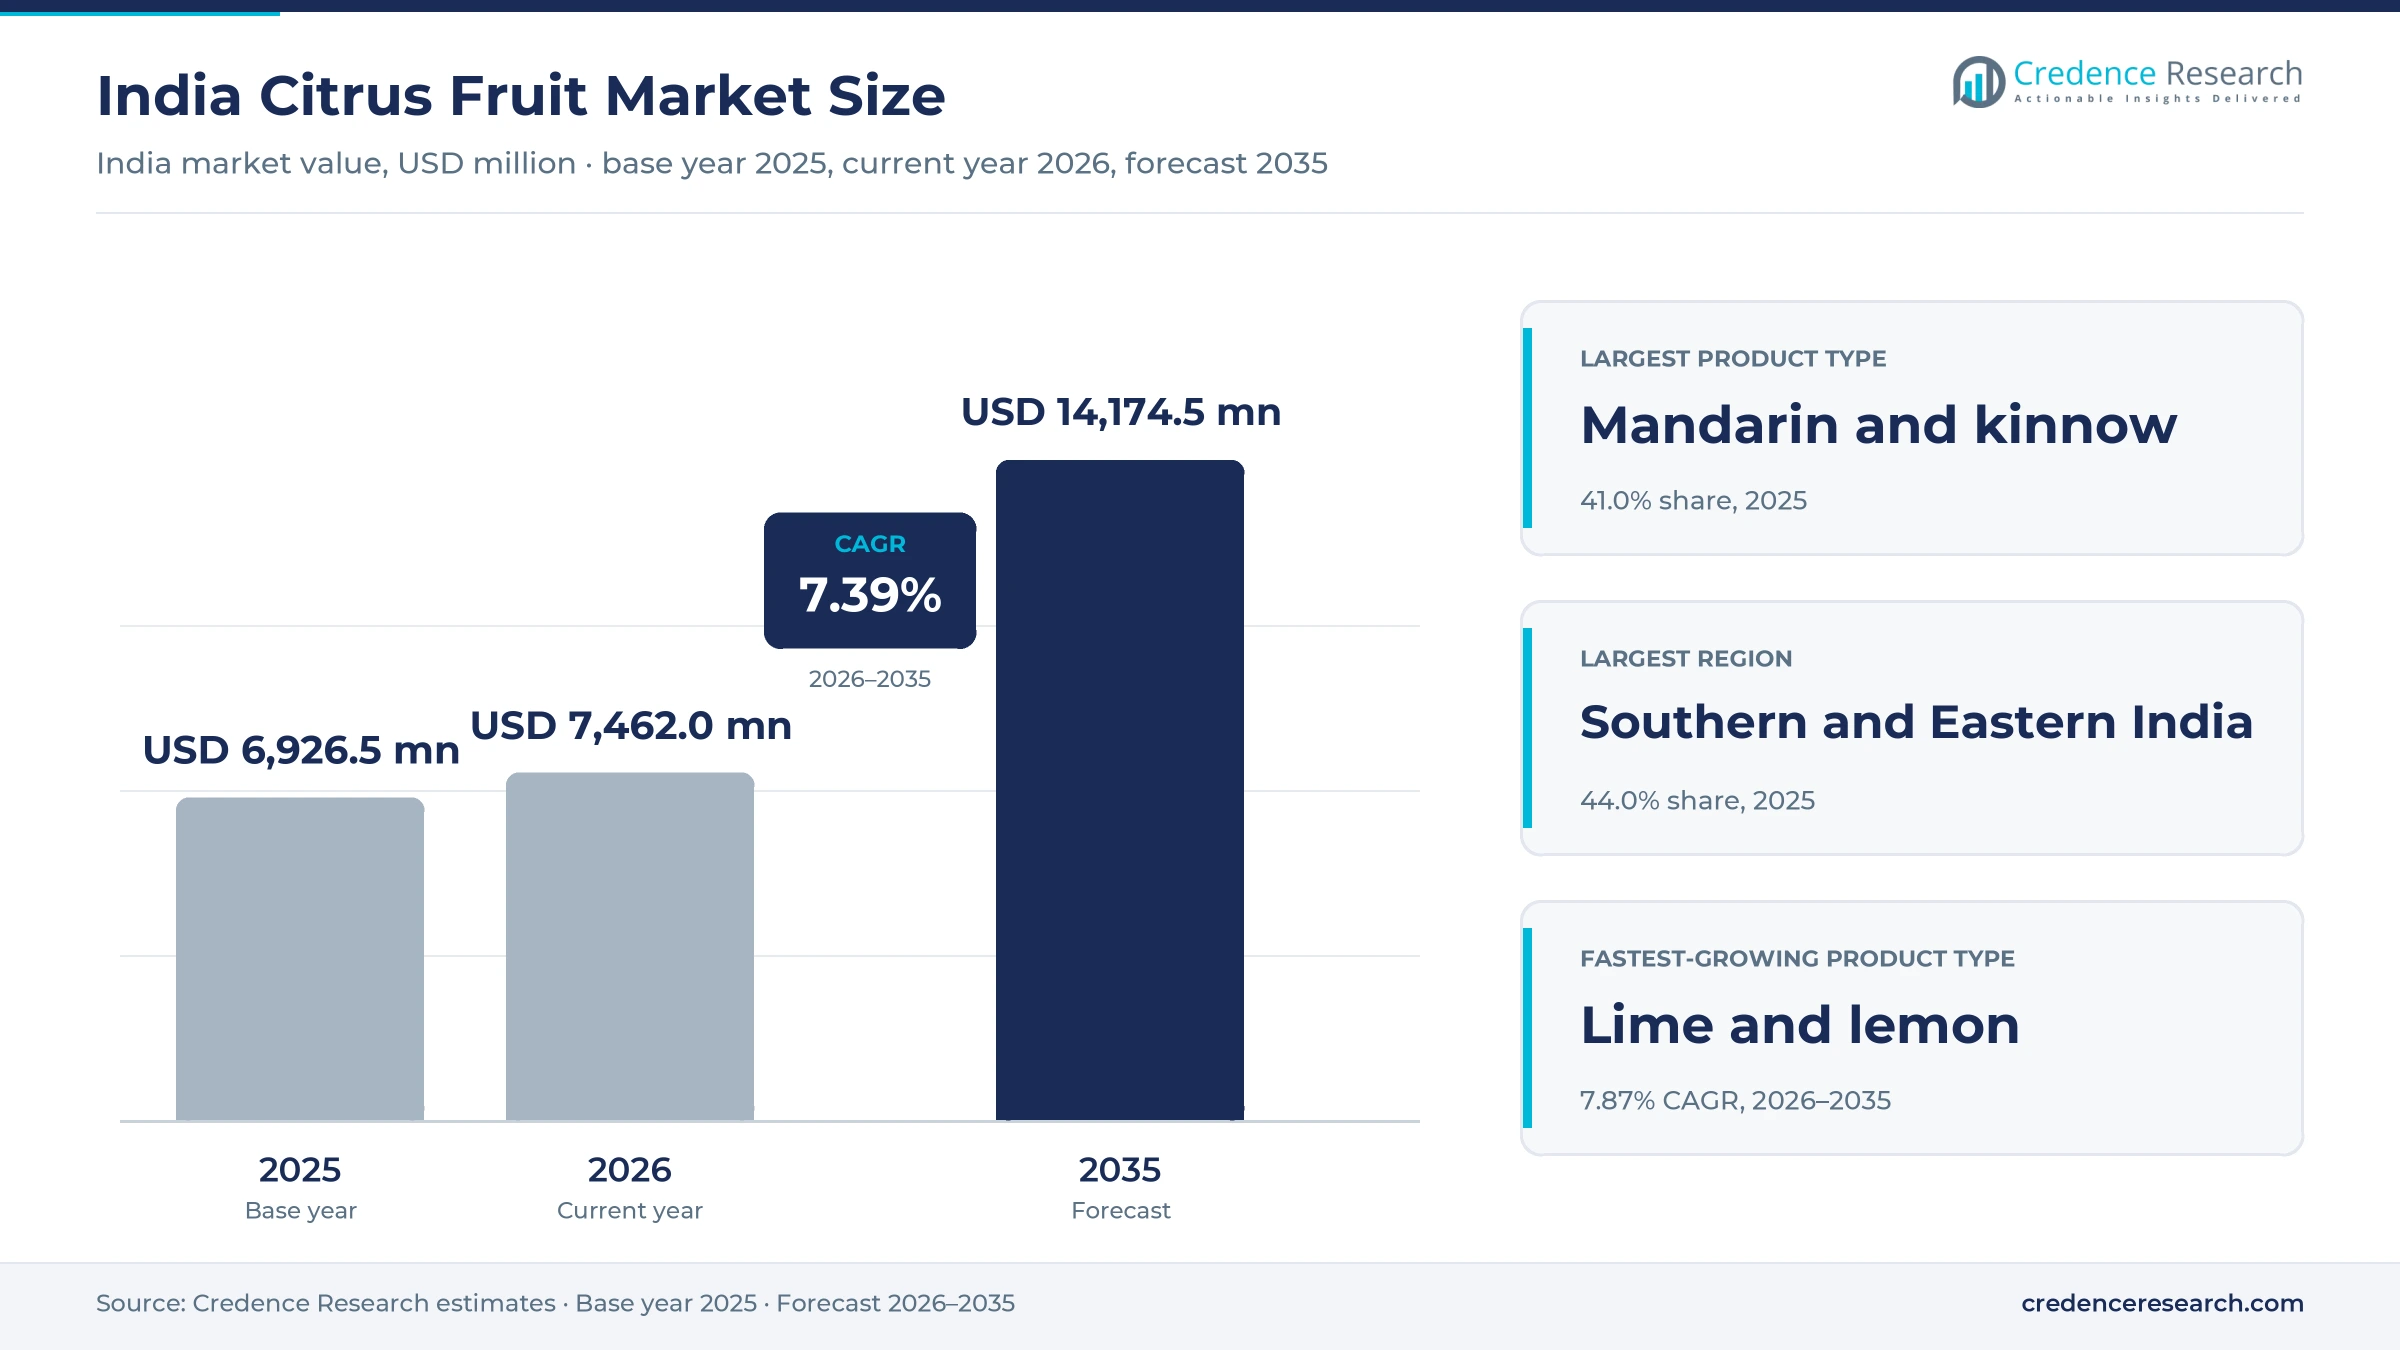
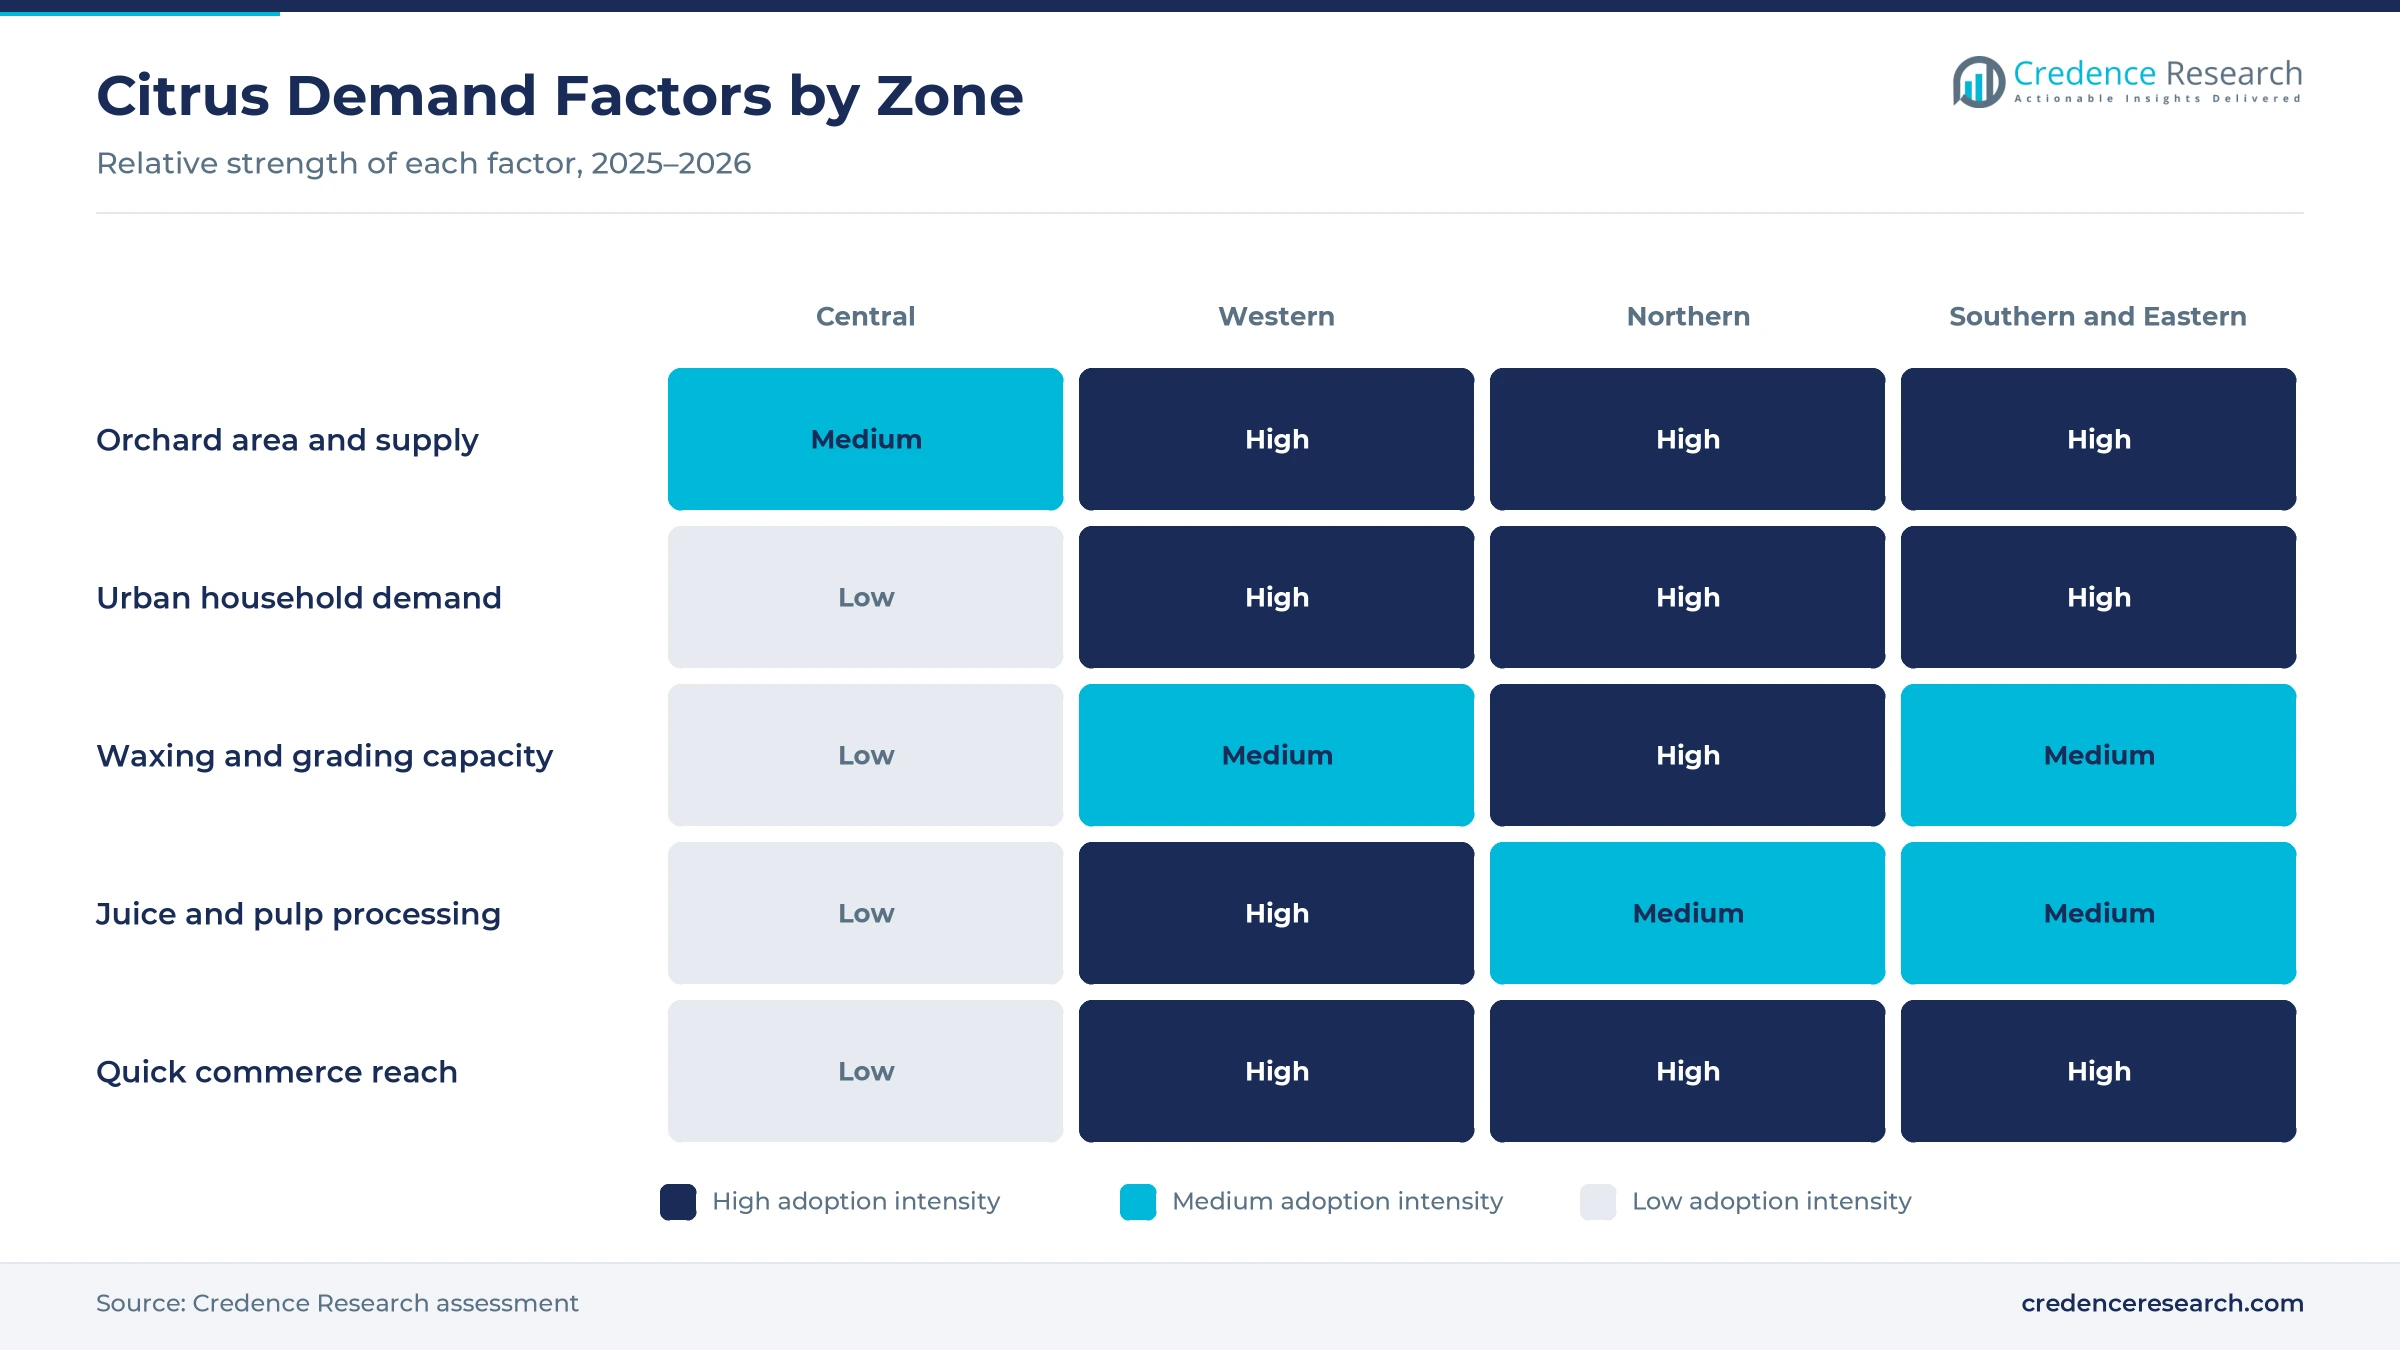
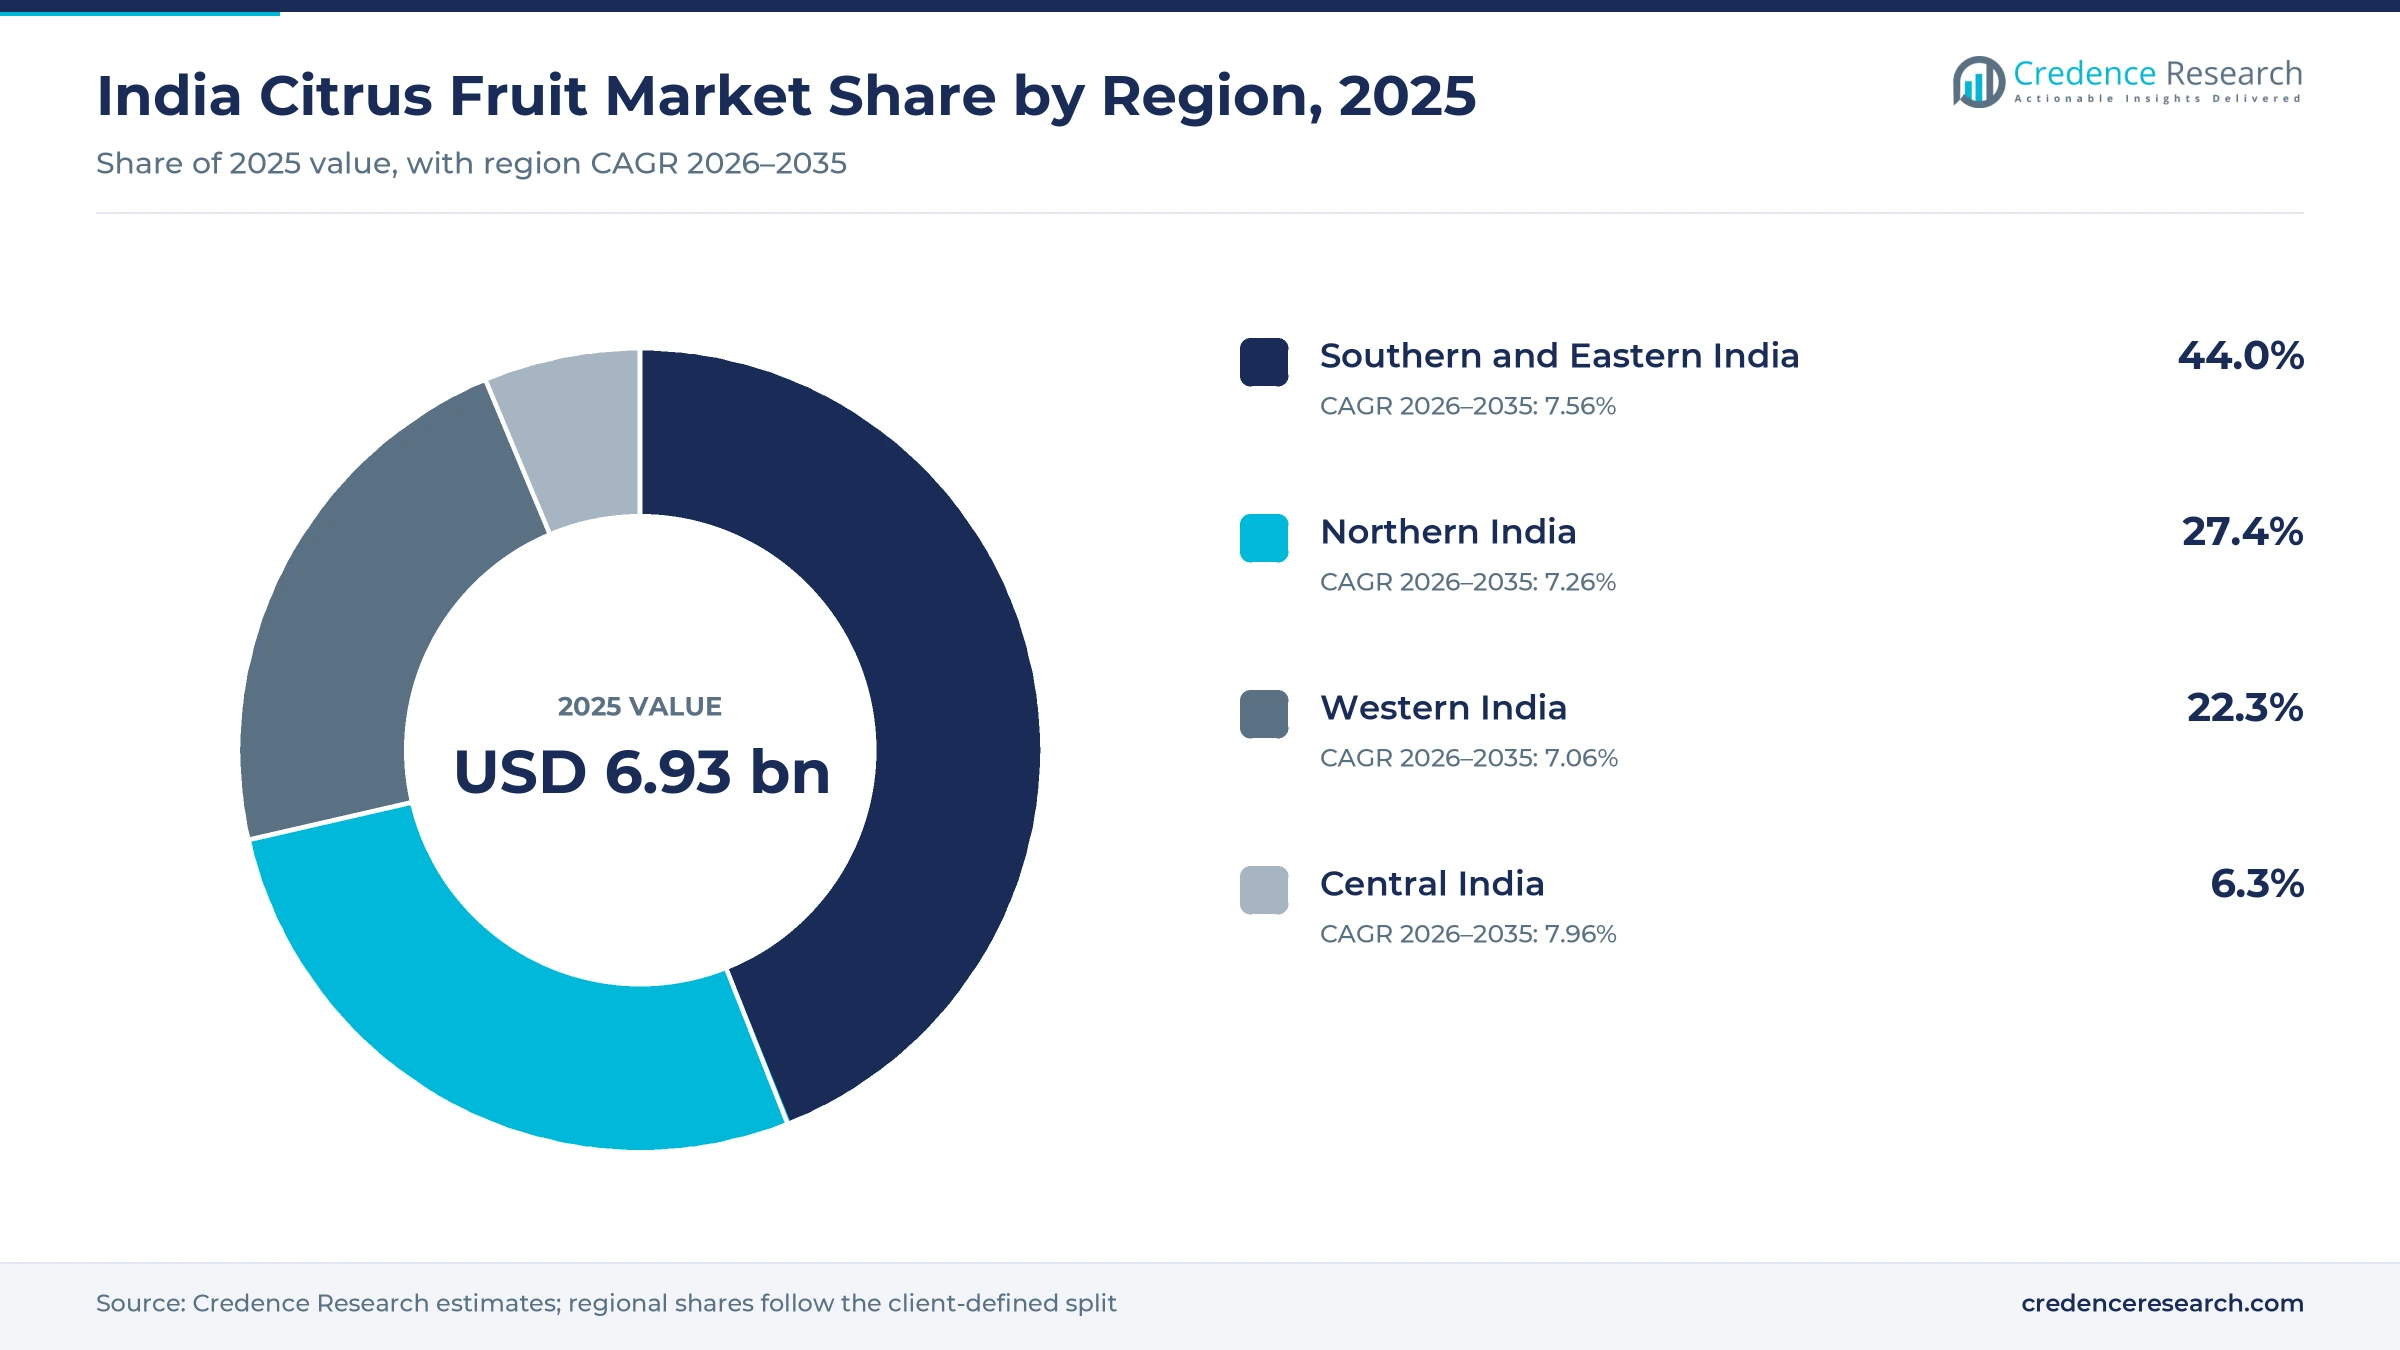
The India citrus fruit market was valued at USD 6.93 billion in 2025 and is projected to increase from USD 7.46 billion in 2026 to USD 14.17 billion by 2035, registering a CAGR of 7.39% during 2026–2035. Demand comes from households that buy mandarins, kinnow, mosambi and acid lime almost every week, from restaurants and street juice sellers, and from processors that make juice, pulp and squash. Southern and Eastern India held the largest regional share, 44.0% in 2025, because the zone combines large acid lime orchards with dense urban populations. Central India is the fastest-growing region at 7.96% a year, as Nagpur mandarin orchards spread across Madhya Pradesh districts. In turn, graded and waxed fruit, cold storage and quick delivery apps are changing how citrus moves from orchard to kitchen.
Which citrus fruit, buyers and channels does the estimate cover?
The estimate measures the value of fresh mandarins and kinnow, acid lime and lemon, sweet orange and mosambi, and grapefruit, pomelo and other citrus sold within India. It counts purchases by households, foodservice buyers, juice and beverage processors and institutional caterers through mandis, modern retail, online grocery and direct farm supply.
The estimate excludes exported fruit, processed juice and concentrate sold as finished goods, and citrus peel products. The value chain runs from orchard growers and farmer producer companies through commission agents, waxing and grading plants and wholesalers to retailers, apps and processors in every state.
India Citrus Fruit Market Insights
- The India citrus fruit market was valued at USD 6.93 billion in 2025 and is projected to reach USD 14.17 billion by 2035, registering a CAGR of 7.39% during 2026–2035.
- Southern and Eastern India held a 44.0% share of 2025 value, because the zone combines acid lime orchards with large city populations.
- Mandarin and kinnow led with a 41.0% share of 2025 value, because Nagpur mandarin and Punjab kinnow dominate winter fruit buying.
- India produces about 14 million metric tons of citrus a year on more than 1.08 million hectares, the third-largest output after China and Brazil.
- Online grocery and quick commerce grow fastest at 13.23% a year during 2026–2035, as delivery apps add stores across Indian cities.
Mandarin and kinnow lead while lime and lemon grow fastest
Why do mandarin and kinnow hold the largest share?
Based on product type, the market is categorized into mandarin and kinnow, lime and lemon, sweet orange and mosambi, and grapefruit, pomelo and other citrus. Mandarin and Kinnow led with a 41.0% share of 2025 value, because Nagpur mandarin and Punjab kinnow fill winter fruit stalls across the country. Lime and Lemon grow fastest at 7.87% a year, as acid lime is bought all year for cooking, drinks and restaurant use.
How do households and food businesses split demand?
Based on customer type, the market is categorized into household consumers, foodservice buyers, juice and beverage processors and institutional caterers. Household Consumers led with a 63.0% share of 2025 value, because citrus is a daily kitchen and snacking fruit in most homes. Foodservice Buyers grow fastest at 8.25% a year, as restaurants, cafes and juice bars use more lime, orange and mosambi.
How do mandis and delivery apps reach buyers?
Based on distribution channel, the market is categorized into traditional wholesale and mandis, modern grocery retail, online grocery and quick commerce, and direct farm and institutional supply. Traditional Wholesale and Mandis led with 69.0% of 2025 value, because most fruit still moves through commission agents. Online Grocery and Quick Commerce grows fastest at 13.23% a year, as delivery apps sell graded fruit in small packs.
Why does loose bulk fruit still dominate packing?
Based on packaging format, the market is categorized into loose bulk, plastic crates, corrugated cartons and consumer retail packs. Loose Bulk led with 47.0% of 2025 value, because wholesale trucks and mandi stalls handle unpacked fruit at the lowest cost. Consumer Retail Packs grow fastest at 10.32% a year, as supermarkets and apps sell weighed, branded nets and trays.
| Segment Group | Leading Sub-segment | Share, 2025 | Fastest-growing Sub-segment | CAGR, 2026–2035 |
|---|---|---|---|---|
| By Product Type | Mandarin and Kinnow | 41.0% | Lime and Lemon | 7.87% |
| By Customer Type | Household Consumers | 63.0% | Foodservice Buyers | 8.25% |
| By Distribution Channel | Traditional Wholesale and Mandis | 69.0% | Online Grocery and Quick Commerce | 13.23% |
| By Packaging Format | Loose Bulk | 47.0% | Consumer Retail Packs | 10.32% |
Request a Free Sample
Fill in your details and we'll send you a free sample report.
- Sample data tables & charts
- Research methodology
Big harvests, online grocery and cold storage lift sales
How does a large citrus harvest support domestic demand?
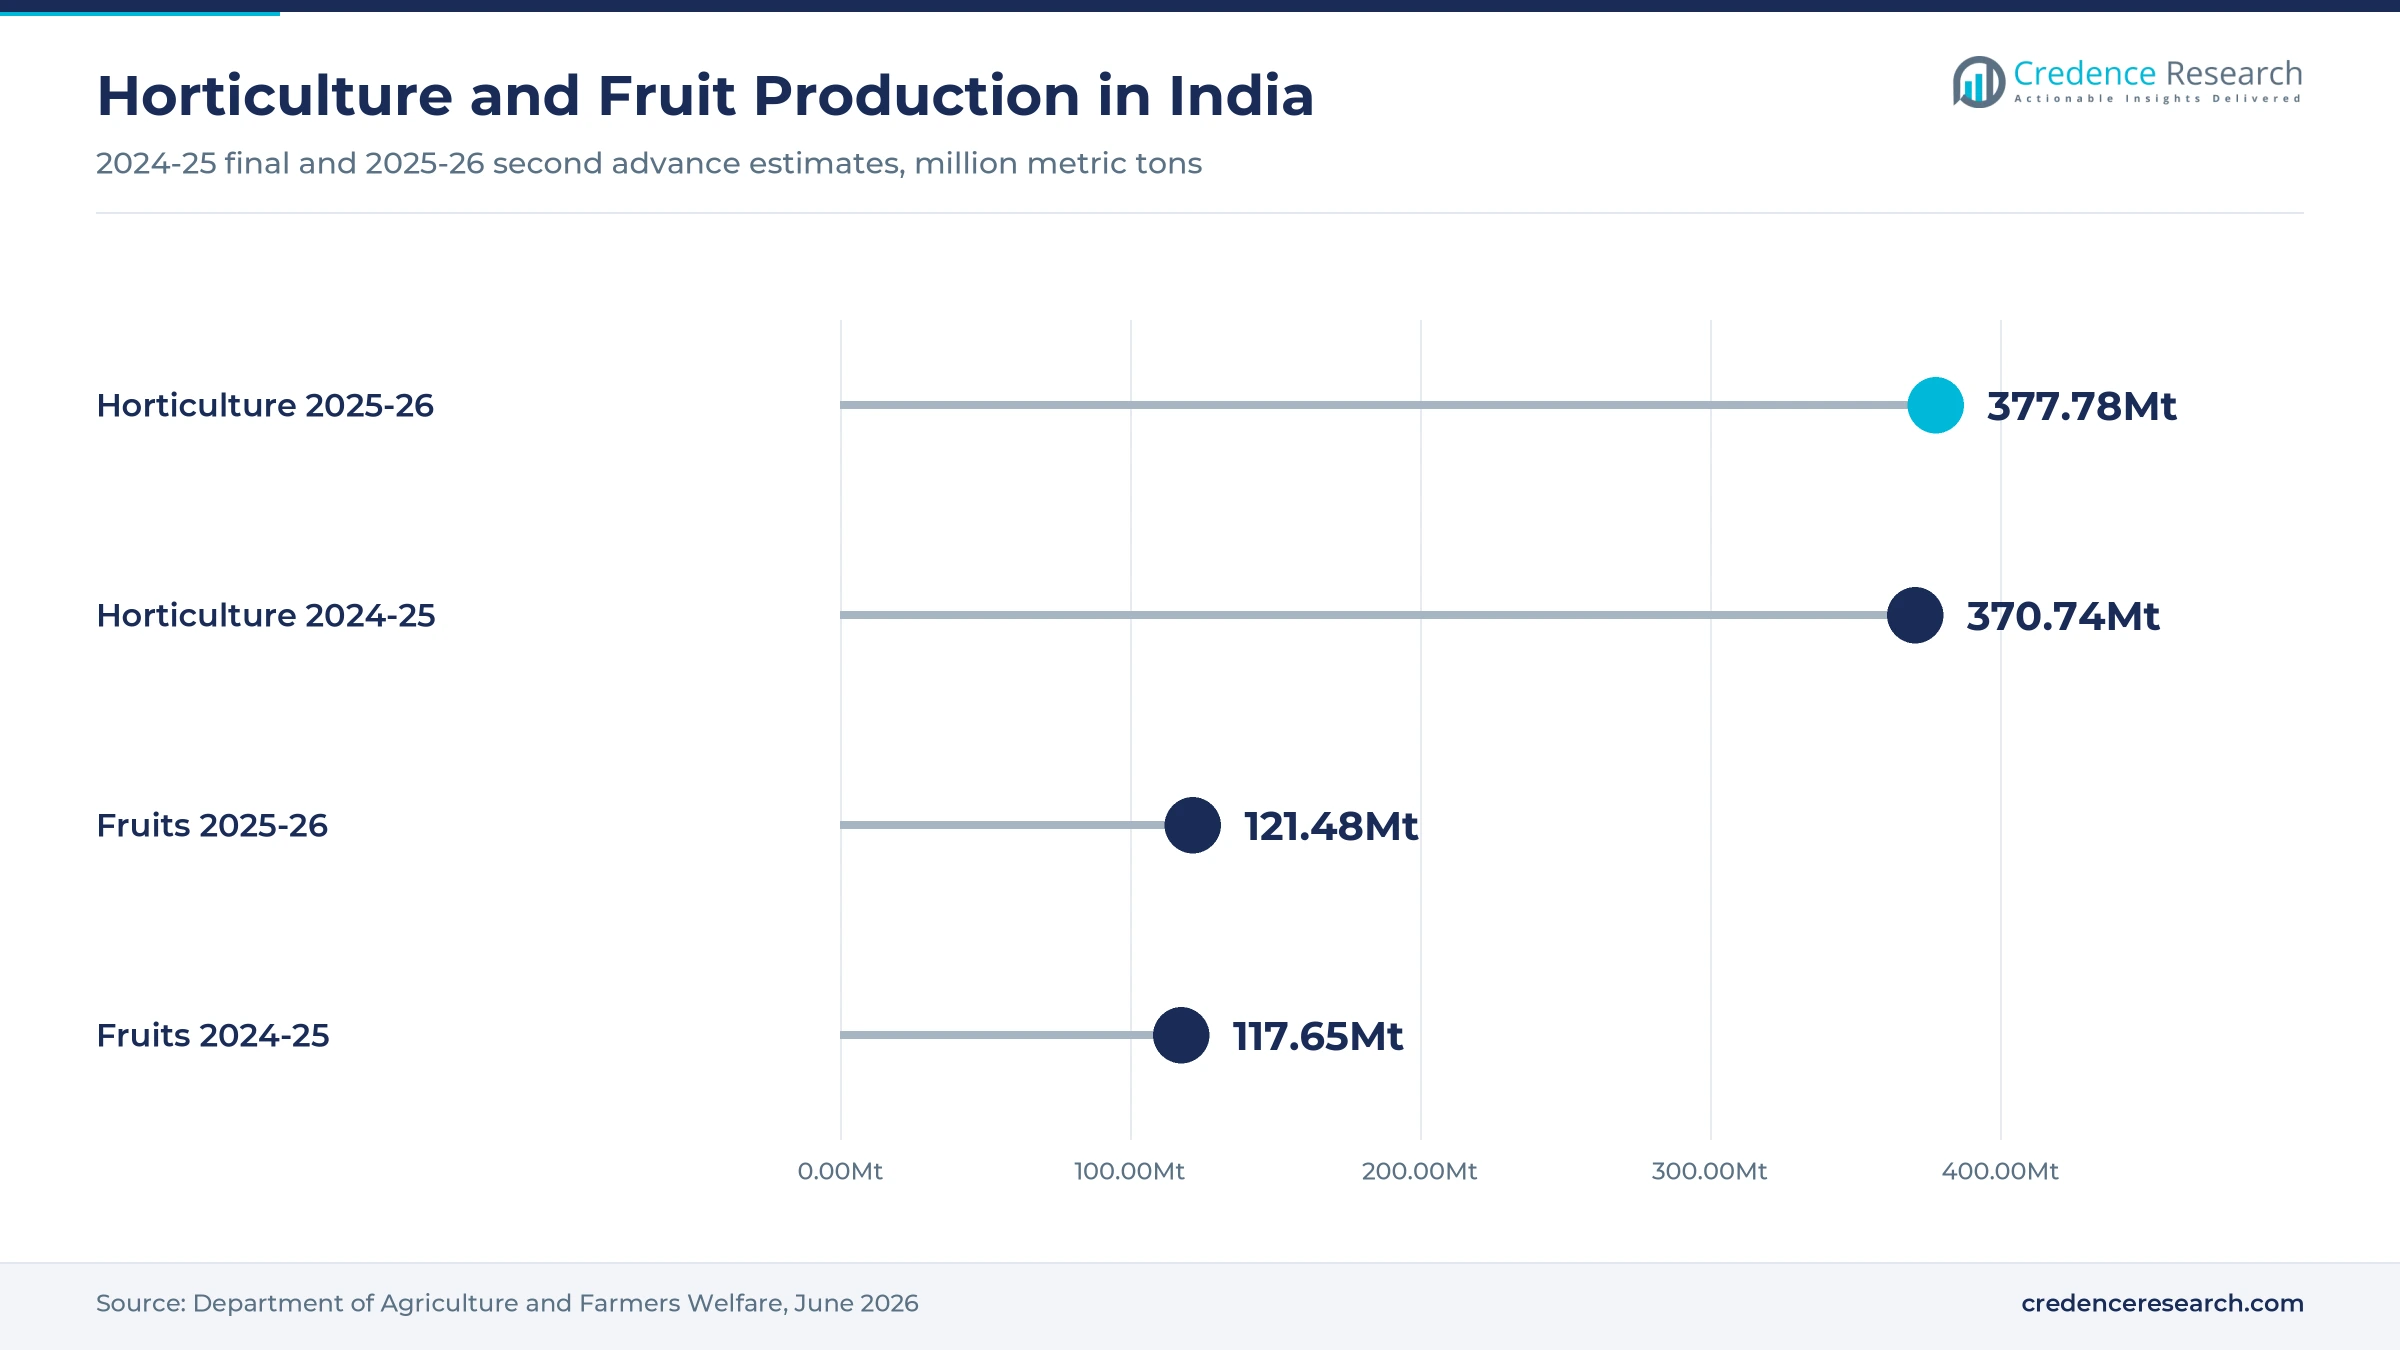
A large domestic citrus harvest supports demand, because abundant supply keeps fruit affordable for families across income groups. India produces roughly 14 million metric tons of citrus on more than 1.08 million hectares, the third-largest output after China and Brazil, while less than 3% of the crop is exported. Fruit production is estimated at 121.48 million metric tons in 2025-26, up 3.25% from 117.65 million metric tons, according to the second advance horticulture estimates. Maharashtra alone has more than 135,000 hectares under citrus and about 170,000 citrus farmers. As a result, mandarin and kinnow hold 41.0% of 2025 value, and most of the harvest is eaten within the country rather than shipped abroad.
Why do digital grocery and organized retail raise spending?
Digital grocery and organized retail raise spending, because graded, washed and packed fruit sells at higher prices than loose mandi fruit. Blinkit operated 2,443 stores in June 2026, up from 1,544 a year earlier, across more than 300 cities, according to Business Today. Urban residents made up about 35.7% of the national population in 2025, according to the World Bank, and this group shops most often through apps. The same quick delivery network stocks about 80,000 items in Delhi-NCR. In turn, online grocery and quick commerce grow at 13.23% a year, the fastest channel rate, while quick delivery platforms push packers toward uniform sizes.
How do cold-chain and post-harvest investments reduce waste?
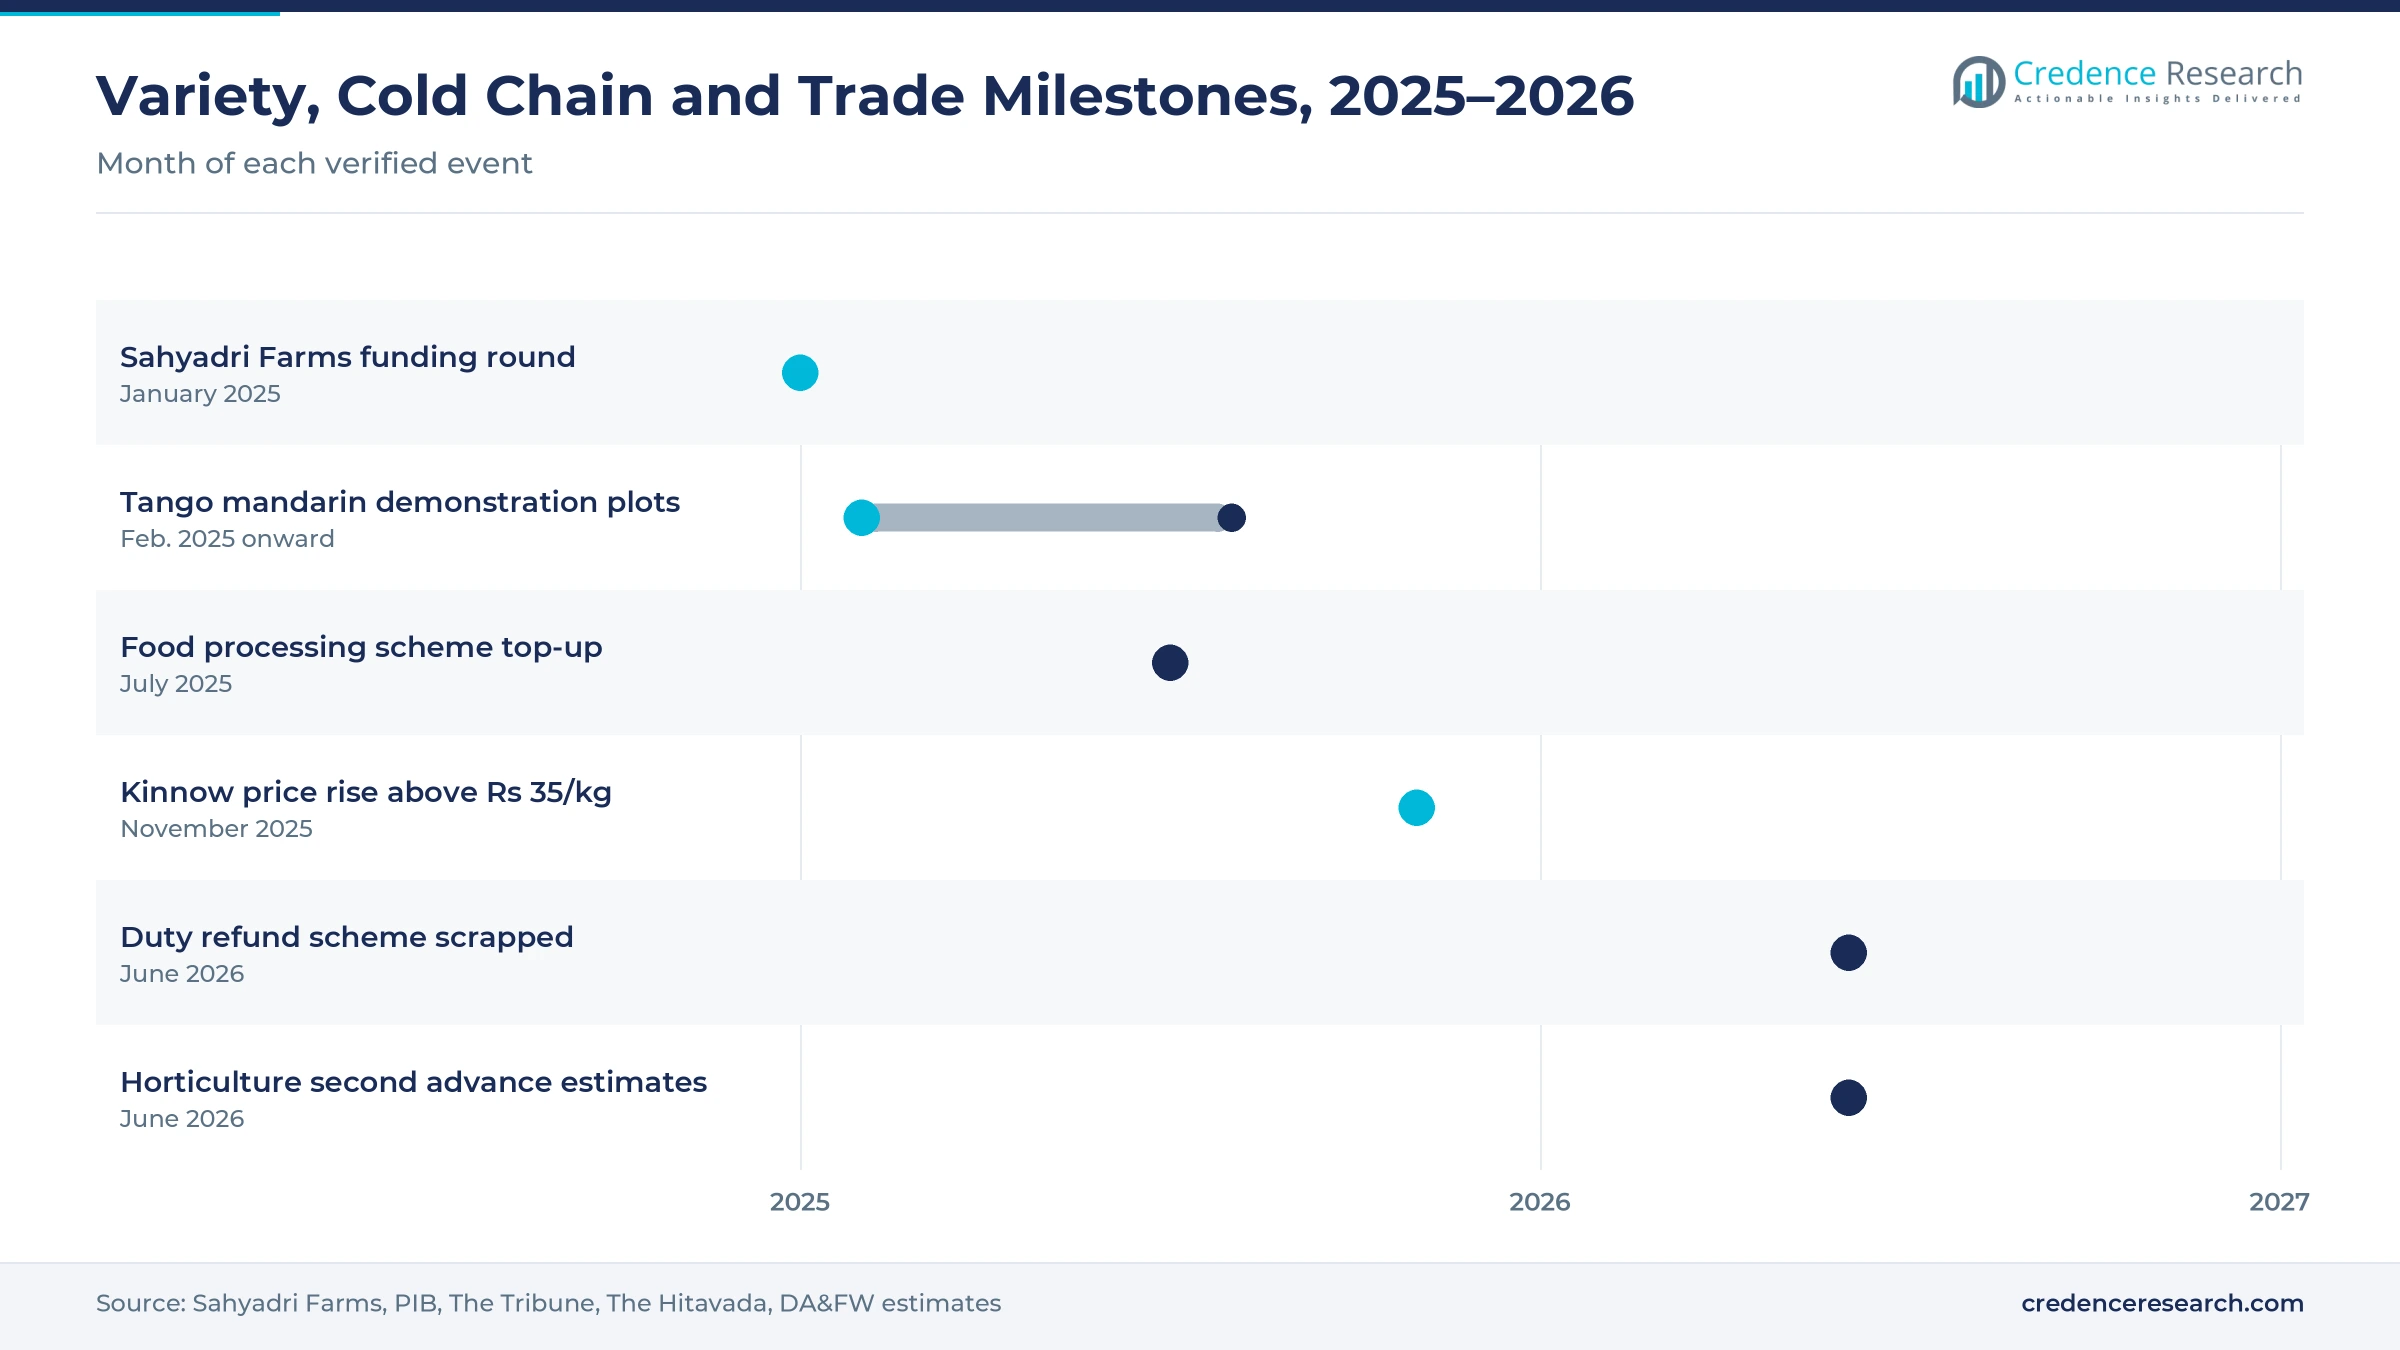
Cold-chain and post-harvest investments reduce waste, because citrus that reaches markets in good condition earns more and stays on shelves longer. The integrated cold chain scheme had 395 approved projects, with 291 completed and operational in June 2025, adding 25.52 lakh metric tons of preservation capacity a year, according to a government factsheet. The Cabinet added Rs 1,920 crore to the food processing scheme in July 2025, taking its outlay to Rs 6,520 crore. Losses of Indian oranges range from 8.3% to 30.7% of output, and waxing can add more than two weeks of shelf life. As a result, corrugated cartons grow faster than loose bulk as refrigerated storage networks expand.
Why do better planting material and new varieties lift output?
Better planting material and new varieties lift output, because old orchards with diseased trees give low yields and uneven fruit. The Central Citrus Research Institute signed an agreement with Sahyadri Farmers Producer Company on July 15, 2023, to license containerized nursery methods for disease-free plants. Sahyadri Farms then introduced the Tango mandarin under exclusive agreements, with 30 farmers running demonstration plots from February 2025, according to AgroSpectrum. The variety yields about 60 metric tons per hectare and carries about 0.2 seeds per 25 fruits. In turn, new orchards in Madhya Pradesh and Maharashtra can adopt it, while premium graded fruit gains space in city stores.
New varieties, processing and graded packs reshape trade
How is the rise of graded and waxed fruit changing trade?
The rise of graded and waxed fruit is changing trade, because city buyers pay more for bright, uniform fruit with longer shelf life. Waxing can extend the shelf life of oranges by more than two weeks, according to post-harvest guidance for Indian citrus. Kinnow prices rose above Rs 35 per kilogram in November 2025, up from about Rs 25 a year earlier, and a 10-kilogram box sold for Rs 450 to Rs 500 in Delhi. Abohar and Fazilka packing yards wax and grade kinnow before trucks leave for northern cities. As a result, consumer retail packs grow at 10.32% a year, the fastest packaging rate, while loose bulk slowly loses share.
Why is the shift of surplus oranges into processing notable?
The shift of surplus oranges into processing is notable, because lower grades that once went to waste now feed juice, pulp and squash lines. The Patanjali Mega Food Park in MIHAN, Nagpur, can process up to 800 metric tons of fruit a day on a zero-waste model. The NOGA factory at Hingna MIDC processes about 3,500 metric tons a year into squashes, juices, jams and purees. Grade 3 and grade 4 oranges are converted into juice and oil products, which lifts grower returns. In turn, juice and beverage processors grow at 8.25% a year, and makers of peel extracts gain more raw material.
Can foodservice and juice bars open new demand for lime?
Foodservice and juice bars can open new demand, because restaurants, cafes and street sellers use lime, orange and mosambi in drinks and dishes every day. Acid lime is grown widely in Andhra Pradesh, Telangana and Tamil Nadu, which keeps supply steady for southern cities. Urban residents reached about 35.7% of the national population in 2025, and eating out is most common in large cities. Sahyadri Farms is also expanding juice concentrate, aseptic and frozen products after raising about Rs 390 crore in January 2025. As a result, lime and lemon grow at 7.87% a year, the fastest product rate, and foodservice buyers gain share.
Is there room to supply online grocery with branded citrus?
Online grocery offers room to grow, because apps need steady supplies of sized, packed fruit that arrives without damage. Blinkit reached 2,443 stores in June 2026 and has built about 19 million square feet of stores and warehouses over four years. Sahyadri Farms serves more than 25,000 registered farmers and over 200 institutional clients, which gives it scale for packed supply. The national food processing scheme also supports packhouses and cold rooms with 35% to 50% capital subsidy. In turn, direct farm supply and online retail channels gain share from mandis as branded citrus reaches more homes in large and midsize cities.
Losses, price swings and export duties test growers
How do post-harvest losses cut grower income?
Post-harvest losses cut grower income, because citrus bruises and dries out during long truck journeys without cooling. A survey of fruit sent from Nagpur to Delhi found losses of 15.6% to 20.7% by truck. As a result, growers sell quickly at low farm-gate prices. Farmer companies respond with packhouses, precooling and waxing, which keep more fruit saleable and raise the share that reaches city buyers.
Why do price swings hurt kinnow and mandarin growers?
Price swings hurt growers, because bumper crops push wholesale rates below production costs in some seasons. Kinnow fetched only Rs 10 to Rs 12 per kilogram at the start of the 2025 season before prices recovered. In turn, some Punjab farmers have uprooted orchards and moved to other crops. Growers respond by selling orchards in advance, storing fruit longer and supplying processors that pay steadier prices.
How do Bangladesh import duties limit orange outlets?
Bangladesh import duties limit orange outlets, because the country is the main foreign buyer of Vidarbha oranges. Duties rose from Rs 20 to Rs 63 per kilogram and at one point exceeded Rs 100, while Maharashtra scrapped its 50% duty refund scheme in June 2026. As a result, more fruit stays in the domestic market and depresses prices. Growers respond by sending more fruit to processors and to distant Indian cities.
Why do climate stress and water shortages reduce yields?
Climate stress and water shortages reduce yields, because citrus trees need steady irrigation during flowering and fruit set. Waterlogging in Fazilka and canal closures in Abohar and Rajasthan lowered kinnow supply in 2025, while Nagpur oranges also yielded less. In turn, prices rise and many buyers shift between fruits for a while. Growers respond with drip irrigation, which the government subsidizes, and with disease-free planting material.
Southern and eastern states lead as central India rises
| Region | Value, 2025 (USD billion) | Share, 2025 | CAGR, 2026–2035 |
|---|---|---|---|
| Southern and Eastern India | 3.05 | 44.0% | 7.56% |
| Northern India | 1.90 | 27.4% | 7.26% |
| Western India | 1.54 | 22.3% | 7.06% |
| Central India | 0.44 | 6.3% | 7.96% |
Why do southern and eastern states hold the top share?
Southern and Eastern India held a 44.0% share of 2025 value and grows at 7.56% a year, because acid lime orchards in Andhra Pradesh, Telangana and Tamil Nadu supply large cities. Coorg mandarin grows in Karnataka and Kerala, while Khasi mandarin comes from the North-East and Darjeeling mandarin from Sikkim and West Bengal. As a result, the zone buys citrus all year from many local sources.
How does northern India depend on kinnow?
Northern India held a 27.4% share of 2025 value and grows at 7.26% a year, because Punjab, Haryana, Rajasthan and Himachal Pradesh grow kinnow for winter sale. Punjab had about 45,000 hectares under kinnow in 2025, with 32,000 hectares in Fazilka district alone. Delhi, Jammu and Kashmir and Haryana are strong buyers of the fruit. In turn, the zone leads national kinnow trade and waxing.
What shapes citrus demand in western India?
Western India held a 22.3% share of 2025 value and grows at 7.06% a year, because Maharashtra has more than 135,000 hectares under citrus and about 170,000 citrus farmers. Amravati district has about 78,000 hectares of oranges and Nagpur district about 45,000 hectares. Lower exports to Bangladesh have kept more fruit at home. As a result, the zone supplies both local buyers and processors.
Why are Madhya Pradesh mandarin belts adding supply fastest?
Central India held a 6.3% share of 2025 value and grows fastest at 7.96% a year, because Nagpur mandarin orchards have spread across Agar Malwa, Rajgarh, Shajapur, Chhindwara and Mandsaur in Madhya Pradesh. Many new orchards in these districts are now reaching bearing age. In turn, the zone adds supply and local trading volume faster than older growing belts.
Variety, cold chain and trade milestones, 2025–2026
| Development | Status and market relevance |
|---|---|
| In January 2025, Sahyadri Farms raised about Rs 390 crore to expand citrus and grape varieties, packhouses and processing. | Adds graded supply and processing capacity |
| In February 2025, Sahyadri Farms started Tango mandarin demonstration plots with 30 farmers from citrus-growing areas. | Introduces a high-yield, low-seed mandarin to India |
| In July 2025, the Cabinet added Rs 1,920 crore to the national food processing scheme, taking it to Rs 6,520 crore. | Supports cold chain and packhouse investment |
| In November 2025, kinnow prices in Punjab rose above Rs 35 per kilogram as supply fell after waterlogging. | Shows tight supply lifting fruit value |
| In June 2026, Maharashtra scrapped its 50% import duty refund scheme for orange exports to Bangladesh. | Keeps more Vidarbha oranges in the domestic market |
Nurseries, waxing and cold storage change fruit quality
- Containerized nurseries raise disease-free citrus plants in controlled conditions, which helps growers replant orchards with healthier trees and higher yields.
- Waxing and grading lines wash, coat and size kinnow and mandarins, which adds more than two weeks of shelf life and gives buyers uniform fruit.
- Cold storage and precooling hold oranges at 2 to 3 degrees Celsius for up to four months, which lets traders spread sales across the season.
Need a Custom Version of This Report?
Tailor the scope, geography, or segments to your exact requirements.
- Custom geography or segment scope
- Direct access to our analyst team
Farmer companies, packers and processors compete
Competition is spread across farmer producer companies, waxing and grading plants, commission agents and fruit processors rather than a few large brands. Sahyadri Farmers Producer Company works with the Central Citrus Research Institute on disease-free nursery plants and is introducing the Tango mandarin through its producer groups. SNS Waxing Plant in Abohar offers kinnow waxing, grading and packing services and also supplies plastic fruit crates. Pethe Orange Growers Private Limited runs an orange processing unit at Morshi in Amravati district and trades oranges and mosambi. Processors such as the Patanjali Mega Food Park and the NOGA factory buy lower grades for juice and squash. Rivals compete on fruit size, color, shelf life, reliable volumes and price. Because apps and supermarkets want steady supply, packers with cold storage and grading lines are gaining contracts.
Which organizations grow, pack and sell citrus in India?
| Company | Type | Role in the market |
|---|---|---|
| Sahyadri Farmers Producer Company Ltd | Farmer producer company | Licensed citrus nursery methods in 2023 and introduced Tango mandarin in 2025 |
| SNS Waxing Plant | Kinnow packer | Offers kinnow waxing, grading and packing services in Abohar, Punjab |
| Pethe Orange Growers Private Limited | Grower company and exporter | Runs an orange processing unit at Morshi, Amravati district |
| Central Citrus Research Institute | Public research institute | Develops varieties and disease-free planting material in Nagpur |
| Patanjali Mega Food Park | Fruit processor | Can process up to 800 metric tons of fruit a day in Nagpur |
| NOGA | Fruit processor | Processes about 3,500 metric tons a year into squash, juice and jam |
| Blinkit | Quick commerce platform | Operated 2,443 stores across more than 300 cities in June 2026 |
Credence Research view on graded citrus demand
Credence Research's view is that Indian citrus demand will grow steadily because the country grows large volumes and families buy the fruit throughout the year. Mandarin and kinnow remain the largest value pool, while lime and lemon add the fastest growth. Graded fruit, cold storage and quick delivery apps are lifting the price that buyers pay per kilogram. Growers and packers that combine better planting material with post-harvest handling should gain share fastest across the India citrus fruit base over the next decade.
How the national citrus fruit estimate was built
The report uses 2025 as the base year on a calendar basis, and market values come from the Credence Research model. That model combines national horticulture estimates, World Bank population data, state crop and price reports, government scheme documents and company announcements. Segment splits and zone growth rates are Credence Research estimates, while zone shares follow the client-defined split. Sources used are official statistics, government publications, trade press and company releases, and no interviews or surveys were used.
Graded fruit and digital channels carry growth to 2035
Citrus fruit value is expected to reach USD 14.17 billion by 2035, a 7.39% CAGR during 2026–2035, as households, restaurants and processors buy more graded fruit. Growth should come from lime and lemon, quick commerce and consumer retail packs. Good monsoons and new orchards would add supply, while heat, water shortages and export barriers could cause price swings. Packers with cold storage and branded packs are expected to gain the most as India citrus fruit demand shifts toward organized channels.
Frequently Asked Questions
How big is the India citrus fruit market?
Which citrus type leads Indian sales value?
Which region leads the Indian citrus market?
How much citrus does India produce each year?
Why does online grocery matter for citrus sales?
How does cold storage help citrus growers?
Which organizations are active in Indian citrus supply?
What are the main challenges for citrus growers?
Table of Content
Chapter 1 Market Segmentation
- 1.1 Segmentation Framework
- 1.1.1 Product and Service Classification
- 1.1.2 Application and End-Use Classification
- 1.1.3 Technology and Solution Classification
- 1.1.4 Customer and Distribution Channel Classification
- 1.1.5 Geographic Segmentation
- 1.1.6 Market Segment Definitions and Boundaries
- 1.2 By Product Type
- 1.2.1 Mandarin and Kinnow
- 1.2.2 Lime and Lemon
- 1.2.3 Sweet Orange and Mosambi
- 1.2.4 Grapefruit Pomelo and Other Citrus
- 1.3 By Customer Type
- 1.3.1 Household Consumers
- 1.3.2 Foodservice Buyers
- 1.3.3 Juice and Beverage Processors
- 1.3.4 Institutional Caterers
- 1.4 By Packaging Format
- 1.4.1 Loose Bulk
- 1.4.2 Plastic Crates
- 1.4.3 Corrugated Cartons
- 1.4.4 Consumer Retail Packs
Chapter 2 Introduction
- 2.1 Report Objectives and Scope
- 2.2 Product Definition and Industry Terminology
- 2.3 Market Inclusions and Exclusions
- 2.4 Research Process
- 2.4.1 Primary Research and Expert Interviews
- 2.4.2 Secondary Research and Source Review
- 2.4.3 Top-Down and Bottom-Up Estimation
- 2.4.4 Data Triangulation and Verification
- 2.5 Market Size Measurement Basis
- 2.5.1 2025: USD 6.93 billion → 2035: USD 14.17 billion
- 2.6 Historical and Forecast Reference Periods
- 2.6.1 Historical Period: 2018-2025
- 2.6.2 Base Year: 2025
- 2.6.3 Forecast Period: 2025-2035
- 2.7 Research Assumptions and Limitations
Chapter 3 Executive Summary
- 3.1 Market Snapshot and Key Findings
- 3.2 Base-Year Market Size, 2025
- 3.3 Forecast Market Size, 2035
- 3.4 Revenue and Volume Growth Outlook
- 3.5 Key Demand and Supply Indicators
- 3.6 Leading Market Segments
- 3.7 Fastest-Growing Market Opportunities
- 3.8 Regional Performance Highlights
- 3.9 Technology and Industry Transformation
- 3.10 Competitive Landscape Summary
- 3.11 Analyst View and Strategic Implications
Chapter 4 India Citrus Fruit Market Trends and Developments
- 4.1 Historical Industry Development, 2018-2025
- 4.2 Recent Market Trends and Developments
- 4.3 Demand and Customer Behavior Trends
- 4.4 Technology and Product Innovation
- 4.5 Artificial Intelligence, Automation and Digitalization
- 4.6 Local Manufacturing and Supply Chain Realignment
- 4.7 Industry Partnerships, Mergers and Acquisitions
- 4.8 Sustainability and Circular Economy Developments
- 4.9 Government and Private Sector Investment Trends
- 4.10 Emerging Business Models and Commercialization
- 4.11 Industry Developments and Announcements
Chapter 5 India Citrus Fruit Market Production, Supply and Demand Analysis
- 5.1 Demand Trend and Consumption Analysis, 2018-2025
- 5.2 Demand Forecast, 2025-2035
- 5.3 Production and Output Trend, 2018-2025
- 5.4 Production and Output Forecast, 2025-2035
- 5.5 Installed Capacity and Capacity Utilization
- 5.6 Company-Wise Production Plants and Statistics
- 5.6.1 Installed Production Capacity
- 5.6.2 Actual Production
- 5.6.3 Planned Capacity and Expansion Targets
- 5.7 Supply Chain Structure and Procurement Trends
- 5.8 Supply-Demand Gap and Bottlenecks
- 5.9 Import Dependence and Sourcing Structure
- 5.10 Contract Manufacturing and Outsourcing
- 5.11 Regional Supply and Demand Concentration
Chapter 6 India Citrus Fruit Market Pricing Analysis
- 6.1 Pricing Structure and Measurement
- 6.2 Historical Pricing Trends, 2018-2025
- 6.3 Pricing Outlook, 2025-2035
- 6.4 Average Selling Price and Unit Economics
- 6.5 Pricing by Product and Market Segment
- 6.6 Geographic Pricing Differences
- 6.7 Key Input, Energy, Labor and Logistics Costs
- 6.8 Contract Pricing and Purchasing Models
- 6.9 Pricing Sensitivity and Competitive Positioning
- 6.10 Price, Margin and Profitability Implications
Chapter 7 India Citrus Fruit Market Dynamics
- 7.1 Market Growth Drivers
- 7.1.1 Demand-Side Drivers
- 7.1.2 Technology and Innovation Drivers
- 7.1.3 Infrastructure and Investment Drivers
- 7.1.4 Regulatory and Policy Drivers
- 7.2 Market Restraints
- 7.2.1 Cost and Affordability Constraints
- 7.2.2 Technology and Adoption Barriers
- 7.2.3 Supply Chain and Operational Constraints
- 7.3 Market Challenges
- 7.3.1 Competitive Pressure and Margin Erosion
- 7.3.2 Skills, Infrastructure and Implementation Gaps
- 7.4 Emerging Market Opportunities
- 7.5 Market Dynamics Impact and Time-Horizon Assessment
Chapter 8 India Citrus Fruit Value Chain Analysis
- 8.1 Industry Value Chain Overview
- 8.2 Upstream Suppliers and Critical Inputs
- 8.3 Technology and Component Providers
- 8.4 Manufacturing or Service Delivery
- 8.5 Distribution, Channel Partners and Integrators
- 8.6 Downstream Applications and End Users
- 8.7 Value Addition and Profit Pools
- 8.8 Vertical Integration and Outsourcing
- 8.9 Supplier Concentration and Risk
- 8.10 Supply Chain Localization and Resilience
Chapter 9 India Citrus Fruit Market Regulations and Policies
- 9.1 Relevant Laws, Standards and Compliance Frameworks
- 9.2 Product, Service, Safety and Quality Requirements
- 9.3 Government Policies, Incentives and Subsidies
- 9.4 Imports, Exports and Trade Barriers
- 9.5 Public Procurement and Local Content Requirements
- 9.6 Environmental and Sustainability Compliance
- 9.7 Upcoming Policy Changes and Market Implications
Chapter 10 India Citrus Fruit Market Hotspots and Opportunities
- 10.1 Market Opportunity Mapping and Growth Hotspots
- 10.2 High-Growth Applications and Customer Groups
- 10.3 Underserved Markets and White-Space Opportunities
- 10.4 Emerging Technology and Product Opportunities
- 10.5 New Capacity and Investment Hotspots
- 10.6 Market Entry and Expansion Opportunities
- 10.7 Distribution and Partnership Opportunities
- 10.8 Near-Term and Long-Term Commercial Potential
- 10.9 Opportunity Attractiveness and Execution Risks
Chapter 11 India Citrus Fruit Market Outlook, 2025-2035
- 11.1 Market Size and Analysis
- 11.1.1 Revenue (Market Measurement: 2025: USD 6.93 billion → 2035: USD 14.17 billion)
- 11.1.2 Market Volume and Quantity Sold
- 11.1.3 Historical Market Size, 2018-2025
- 11.1.4 Base-Year Market Size, 2025
- 11.2 Market Forecast, 2025-2035
- 11.2.1 Revenue Forecast to 2035
- 11.2.2 Volume Forecast to 2035
- 11.2.3 CAGR and Year-on-Year Growth
- 11.2.4 Incremental Revenue Opportunity
- 11.3 Forecast Assumptions and Scenario Analysis
- 11.3.1 Base-Case Forecast
- 11.3.2 Optimistic and Conservative Scenarios
- 11.3.3 Technology, Pricing and Policy Sensitivities
- 11.4 Market Attractiveness and Growth Outlook
Chapter 12 India Citrus Fruit Market Segmentation and Outlook
- 12.1 Segmentation Summary and Market Shares, 2025
- 12.2 Largest and Fastest-Growing Segments
- 12.3 By Product Type - Market Size and Forecast, 2025-2035
- 12.3.1 Segment Definition and Scope
- 12.3.2 Historical Market Size, 2018-2025
- 12.3.3 Revenue Forecast, 2025-2035
- 12.3.4 Volume Forecast, 2025-2035
- 12.3.5 Base-Year Market Share, 2025
- 12.3.6 Segment CAGR and Growth Drivers
- 12.3.7 Subsegment Market Size and Forecast
- 12.3.7.1 Mandarin and Kinnow
- 12.3.7.2 Lime and Lemon
- 12.3.7.3 Sweet Orange and Mosambi
- 12.3.7.4 Grapefruit Pomelo and Other Citrus
- 12.3.8 Subsegment Pricing and Adoption Trends
- 12.3.9 Leading Suppliers and Competition
- 12.3.10 Regional Demand and Opportunities
- 12.4 By Customer Type - Market Size and Forecast, 2025-2035
- 12.4.1 Segment Definition and Scope
- 12.4.2 Historical Market Size, 2018-2025
- 12.4.3 Revenue Forecast, 2025-2035
- 12.4.4 Volume Forecast, 2025-2035
- 12.4.5 Base-Year Market Share, 2025
- 12.4.6 Segment CAGR and Growth Drivers
- 12.4.7 Subsegment Market Size and Forecast
- 12.4.7.1 Household Consumers
- 12.4.7.2 Foodservice Buyers
- 12.4.7.3 Juice and Beverage Processors
- 12.4.7.4 Institutional Caterers
- 12.4.8 Subsegment Pricing and Adoption Trends
- 12.4.9 Leading Suppliers and Competition
- 12.4.10 Regional Demand and Opportunities
- 12.5 By Packaging Format - Market Size and Forecast, 2025-2035
- 12.5.1 Segment Definition and Scope
- 12.5.2 Historical Market Size, 2018-2025
- 12.5.3 Revenue Forecast, 2025-2035
- 12.5.4 Volume Forecast, 2025-2035
- 12.5.5 Base-Year Market Share, 2025
- 12.5.6 Segment CAGR and Growth Drivers
- 12.5.7 Subsegment Market Size and Forecast
- 12.5.7.1 Loose Bulk
- 12.5.7.2 Plastic Crates
- 12.5.7.3 Corrugated Cartons
- 12.5.7.4 Consumer Retail Packs
- 12.5.8 Subsegment Pricing and Adoption Trends
- 12.5.9 Leading Suppliers and Competition
- 12.5.10 Regional Demand and Opportunities
- 12.6 Segment Growth Comparison
- 12.7 Segment Attractiveness and Priority Matrix
Chapter 13 India Citrus Fruit End-Use and Application Market Outlook
- 13.1 End-Use Industry and Customer Demand Structure
- 13.2 Leading Applications and Customer Groups
- 13.3 End-Use Market Size, Share and Forecast
- 13.4 Major End-Use Industry Deep Dives
- 13.4.1 Customer Requirements and Use Cases
- 13.4.2 Demand and Replacement Cycles
- 13.4.3 Technical and Regulatory Considerations
- 13.4.4 Purchasing and Procurement Models
- 13.4.5 Leading Vendors and Distribution Channels
- 13.4.6 Forecast and Commercial Opportunities
- 13.5 Emerging Applications and Cross-Segment Demand
- 13.6 End-Use Industry Investment Priorities
Chapter 14 India Citrus Fruit Geographic Market Outlook, 2025-2035
- 14.1 Domestic Market Distribution and Demand Clusters
- 14.2 State- or Province-Wise Market Size and Forecast, 2025-2035
- 14.3 City and Metropolitan Market Outlook
- 14.4 Industrial, Manufacturing and Commercial Clusters
- 14.5 Geographic Concentration of Key End Users
- 14.6 Local Pricing and Purchasing Differences
- 14.7 Domestic Production Facilities and Capacity Map
- 14.8 Local Infrastructure and Project Pipeline
- 14.9 State-Level Policy and Incentive Differences
- 14.10 Subnational Investment Hotspots and Opportunities
- 14.11 Distribution and Logistics Networks
- 14.12 Domestic Competitive Footprint
Chapter 15 India Citrus Fruit Technology, Innovation and Sustainability Outlook
- 15.1 Technology Landscape and Maturity
- 15.2 Product, Process and Service Innovation
- 15.3 AI, Automation and Digital Tools in the Industry
- 15.4 Technology Adoption and Performance Benchmarking
- 15.5 Innovation Pipeline and R&D Investment
- 15.6 Patent and Intellectual Property Trends
- 15.7 Energy Efficiency and Resource Management
- 15.8 Sustainability, Recycling and Circularity
- 15.9 Technology Roadmap, 2025-2035
- 15.10 Risks of Obsolescence and Technology Substitution
Chapter 16 India Citrus Fruit Market Key Strategic Imperatives
- 16.1 Growth and Market Entry Priorities
- 16.2 High-Return Products and Segments
- 16.3 Pricing, Profitability and Cost Optimization
- 16.4 Technology Investment and Product Differentiation
- 16.5 Supply Chain Localization and Resilience
- 16.6 Distribution and Customer Acquisition
- 16.7 Partnership, Acquisition and Capacity Strategy
- 16.8 Regional Expansion Priorities
- 16.9 Short-, Medium- and Long-Term Actions
Chapter 17 Competition Outlook
- 17.1 Industry Competition Characteristics
- 17.2 Market Structure and Concentration
- 17.3 Market Share and Competitive Positioning, 2025
- 17.4 Company-Wise Revenue and Product Benchmarking
- 17.5 Production and Service Capacity Benchmarking
- 17.6 Technology, Pricing and Differentiation
- 17.7 Regional Footprint and Distribution Strength
- 17.8 Mergers, Acquisitions and Strategic Alliances
- 17.9 New Entrants and Competitive Threats
- 17.10 Porter's Five Forces and Industry Attractiveness
- 17.11 Competitive Outlook, 2025-2035
Chapter 18 Company Profiles
- 18.1 Company Coverage and Selection Criteria
- 18.2 Sahyadri Farmers Producer Company Ltd
- 18.2.1 Business Description
- 18.2.2 Company Ownership and Geographic Presence
- 18.2.3 Product and Service Portfolio
- 18.2.4 Manufacturing and Operating Footprint
- 18.2.5 Production Capacity and Expansion Plans
- 18.2.6 Financial Performance and Investment
- 18.2.7 Market Share and Competitive Position
- 18.2.8 Technology and Innovation Capabilities
- 18.2.9 Strategic Alliances or Partnerships
- 18.2.10 Recent Developments
- 18.2.11 Growth Strategy and Outlook
- 18.3 Pethe Orange Growers Private Limited
- 18.4 Yari Farm Corporation
- 18.5 PAMS International
- 18.6 Avnitha Organics Private Limited
- 18.7 Taak Waxing Plant
- 18.8 SNS Waxing Plant
- 18.9 R.J. Taak Waxing Plant
- 18.10 Balaji Fruits Abohar
- 18.11 MP-86 Fresh Fruits
- 18.12 Other Relevant Market Participants
Note: Every listed company is profiled on the structure shown under the first company. The company list is preliminary and may change based on research findings, market developments, data availability and client requirements.
Chapter 19 Disclaimer
- 19.1 Research and Forecast Disclaimer
- 19.2 Data Source and Estimation Limitations
Note: The depth of individual sections depends on data availability for this market. Volume, capacity, trade and other unit-based metrics are included where applicable.

