
Yield protection and weed resistance keep input spending up
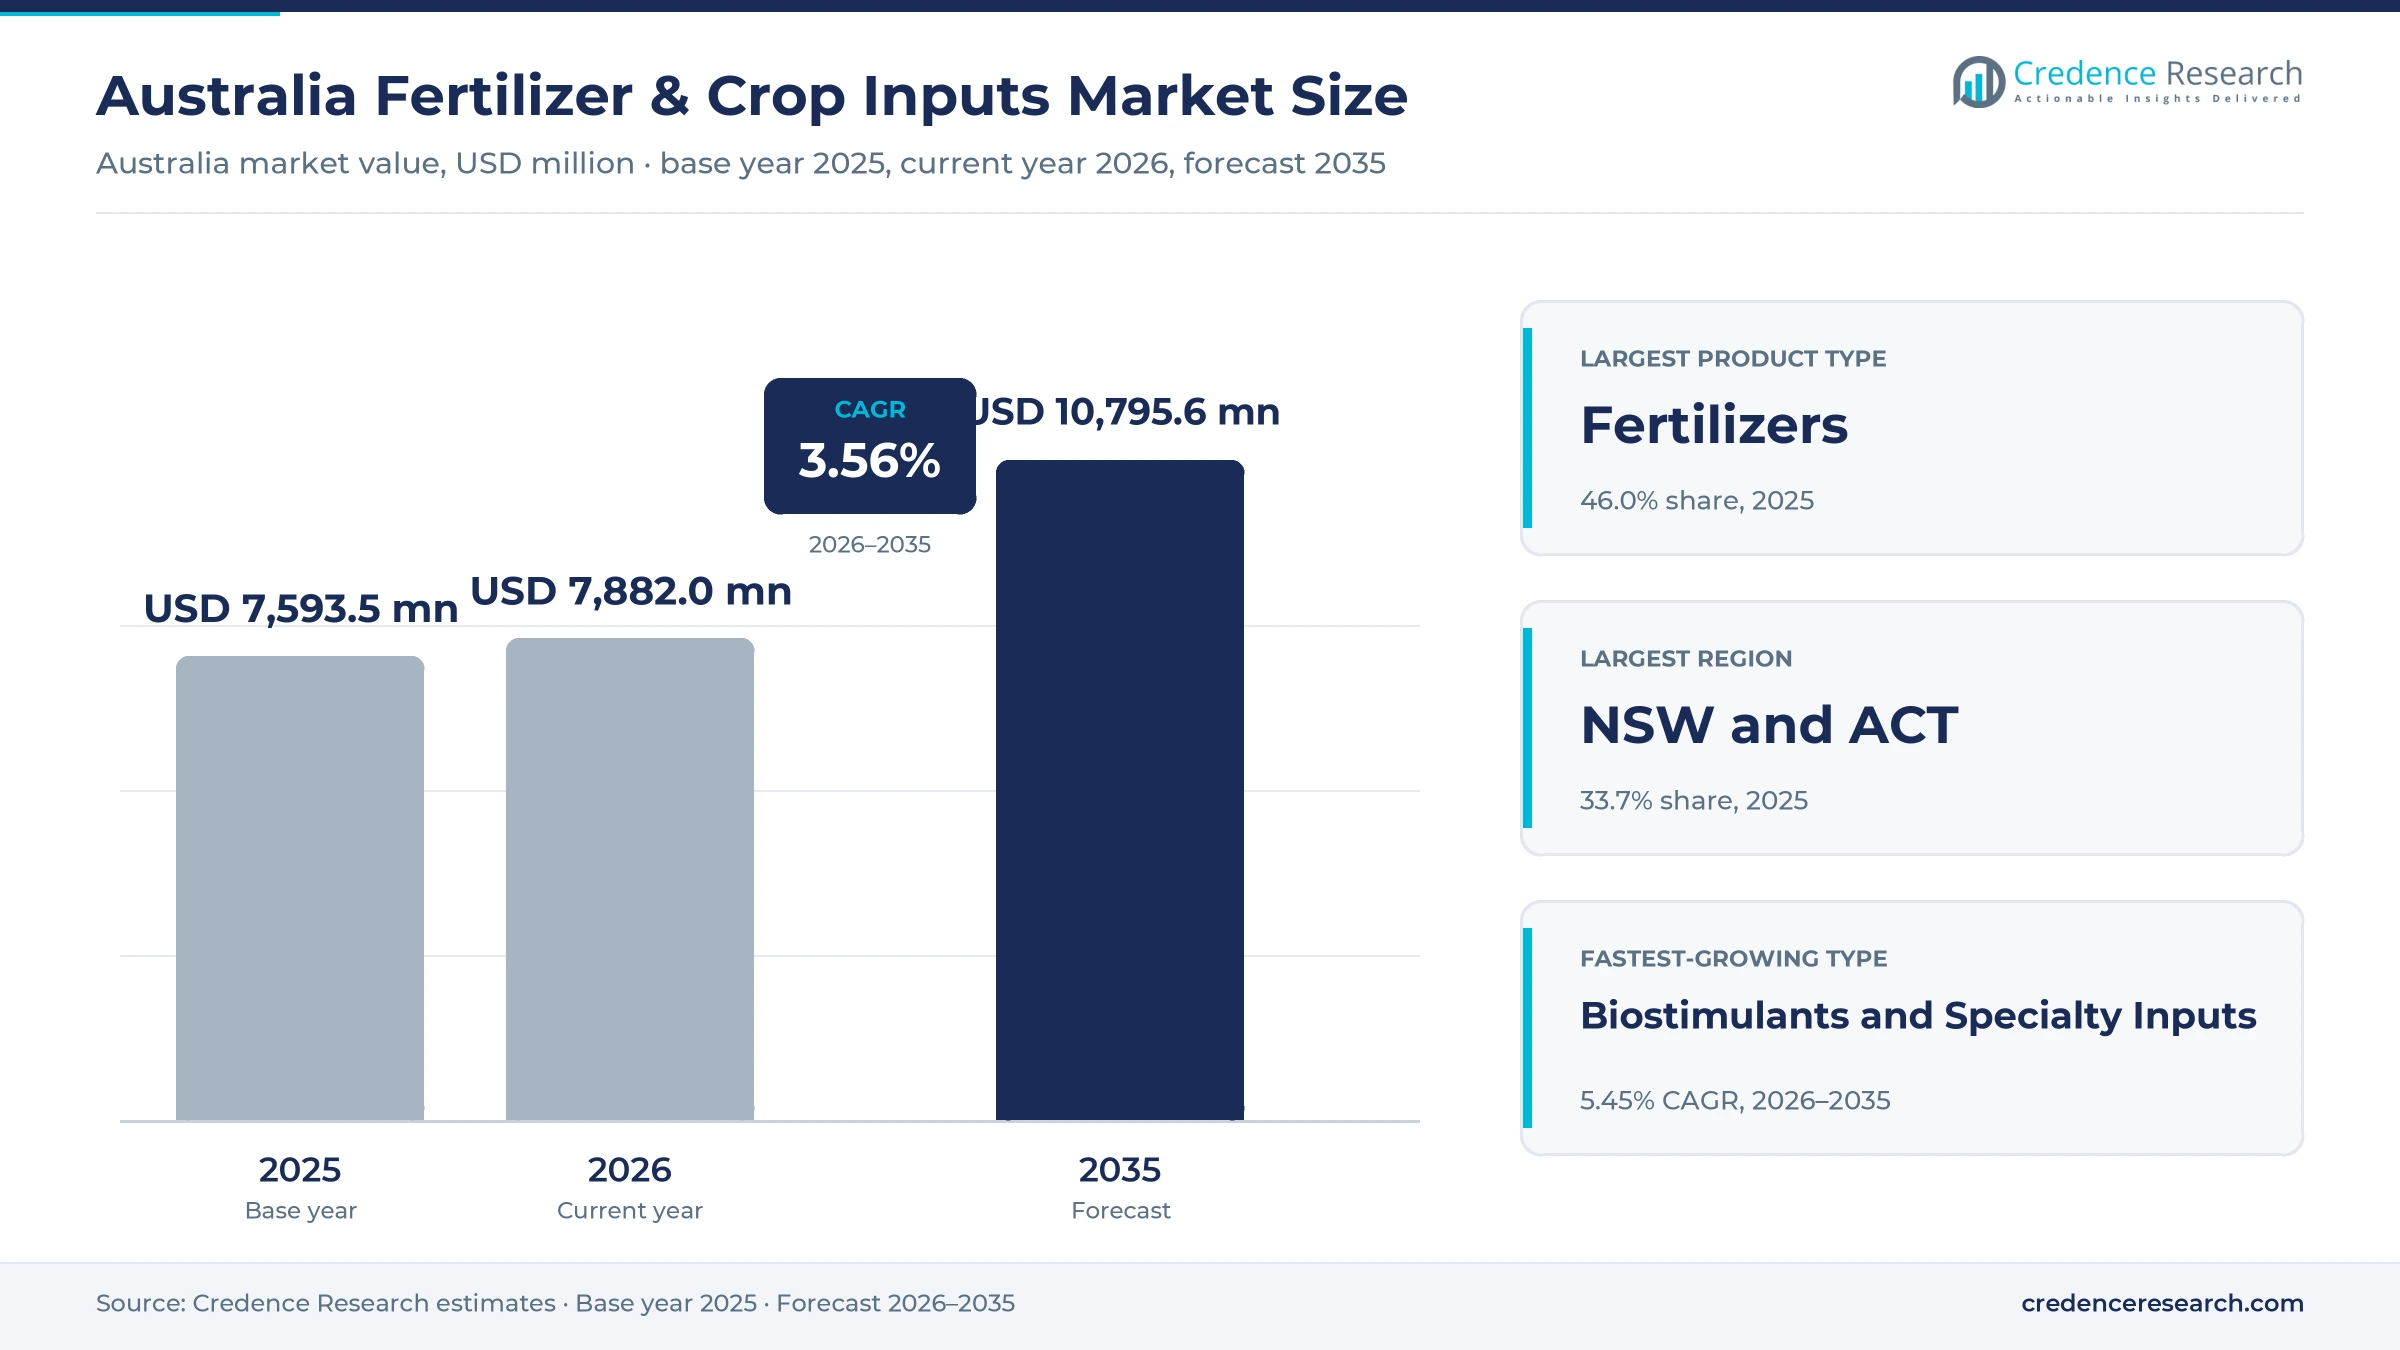
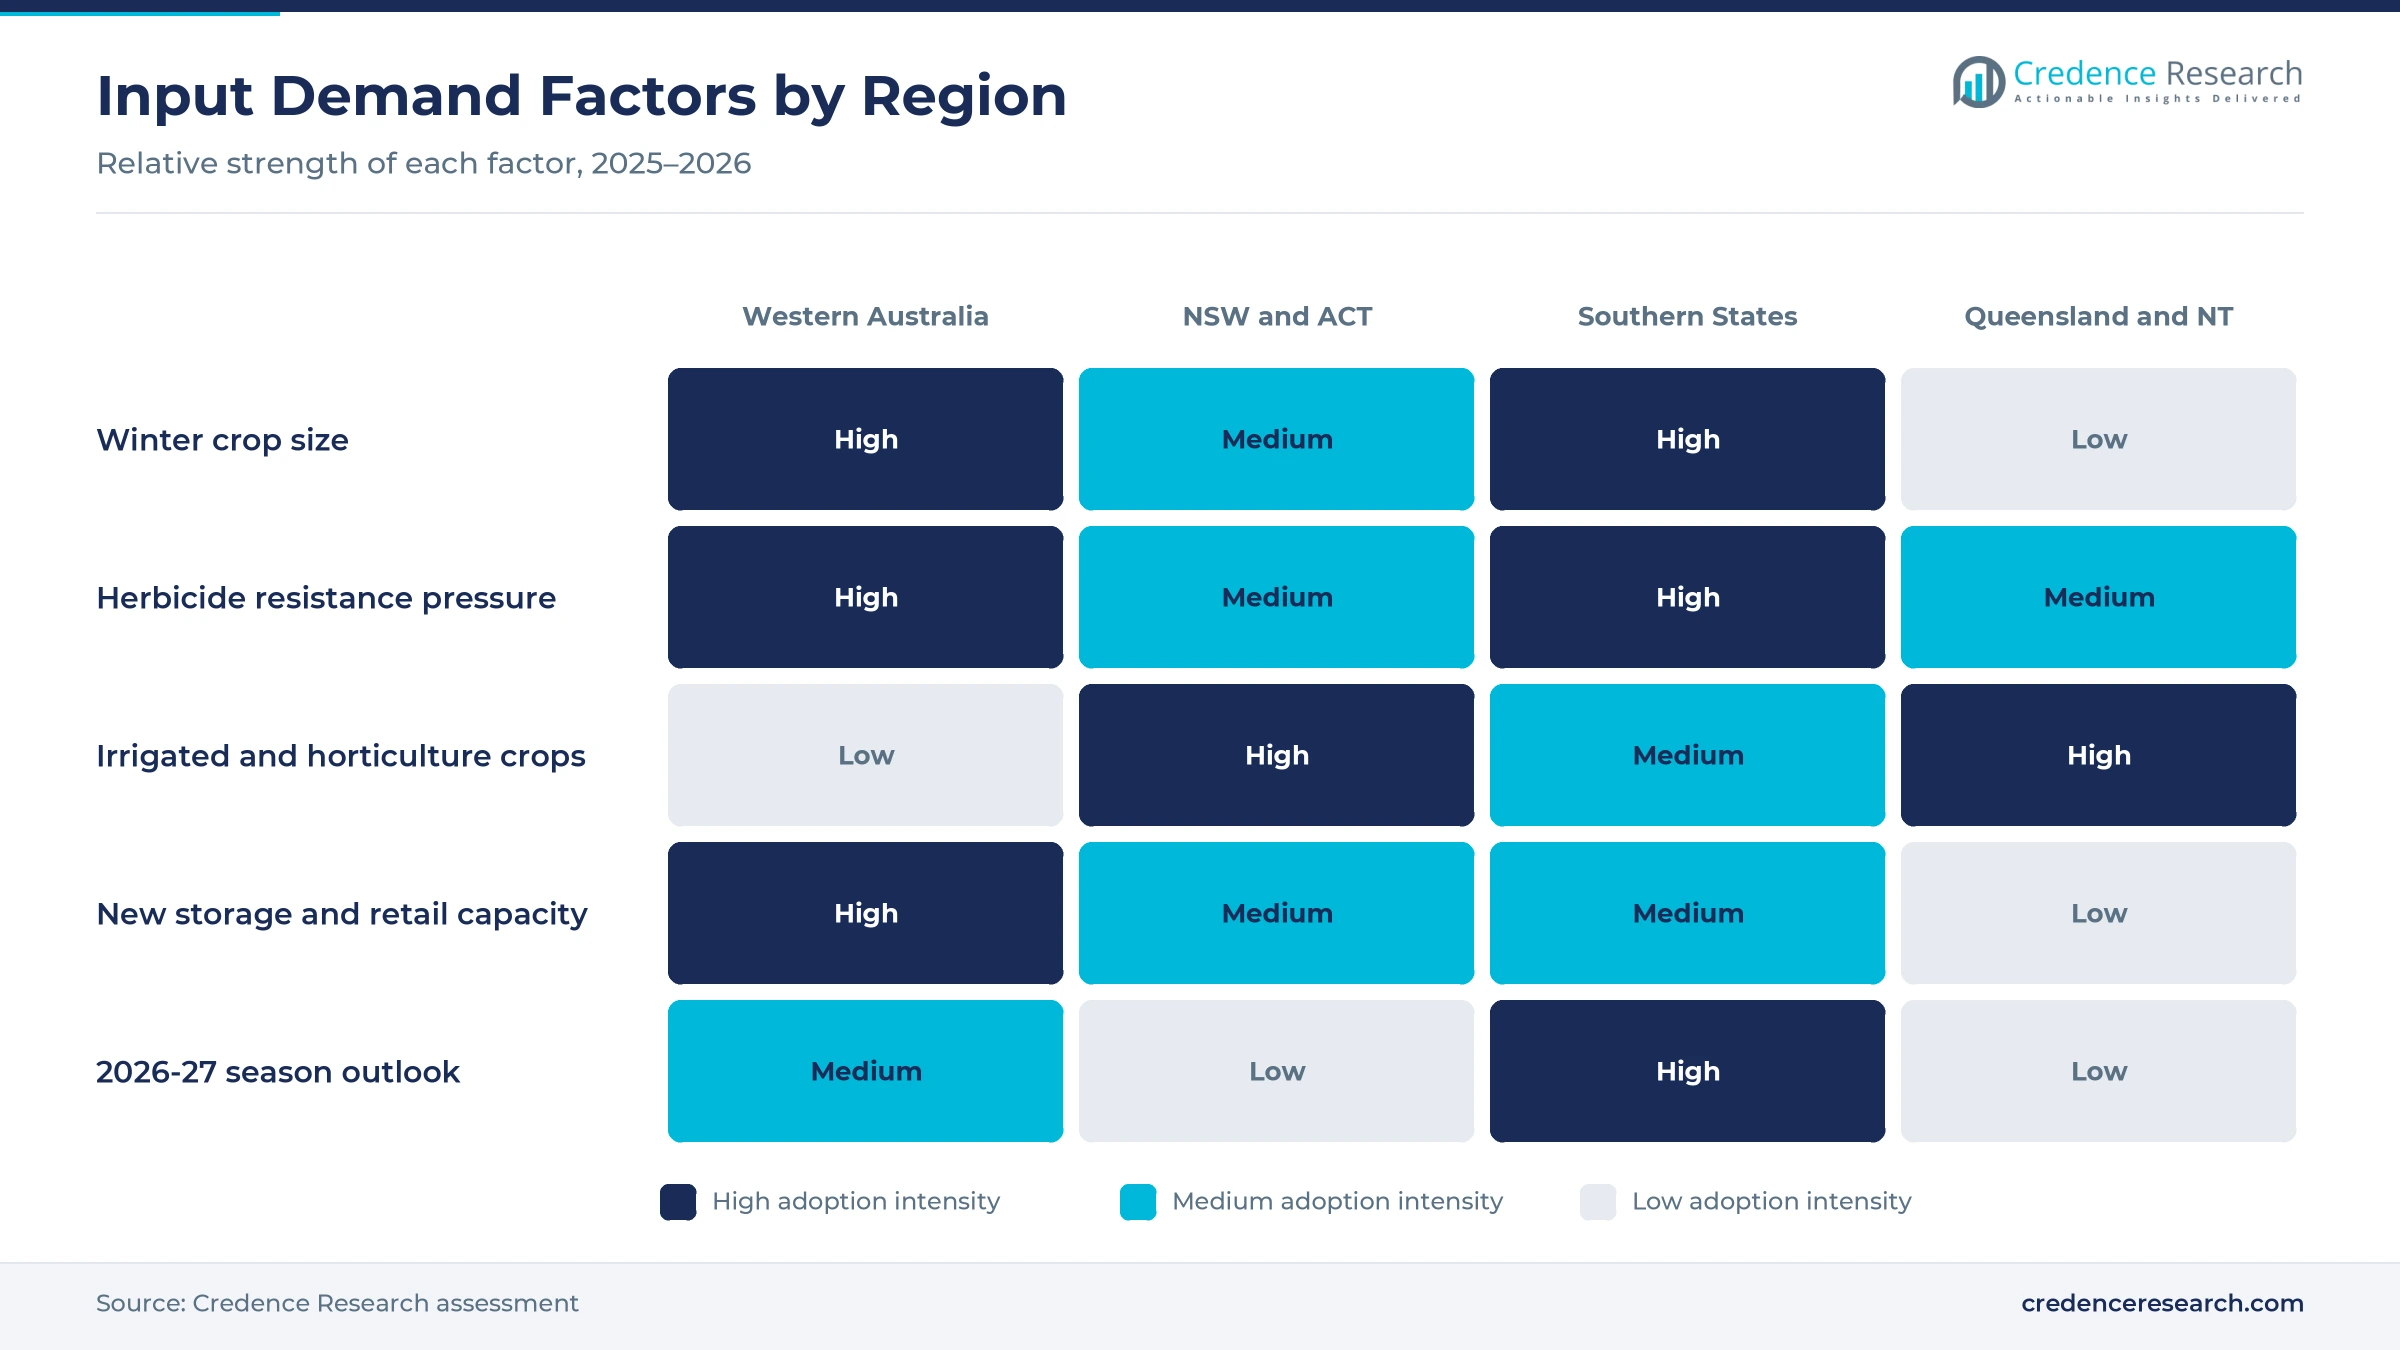
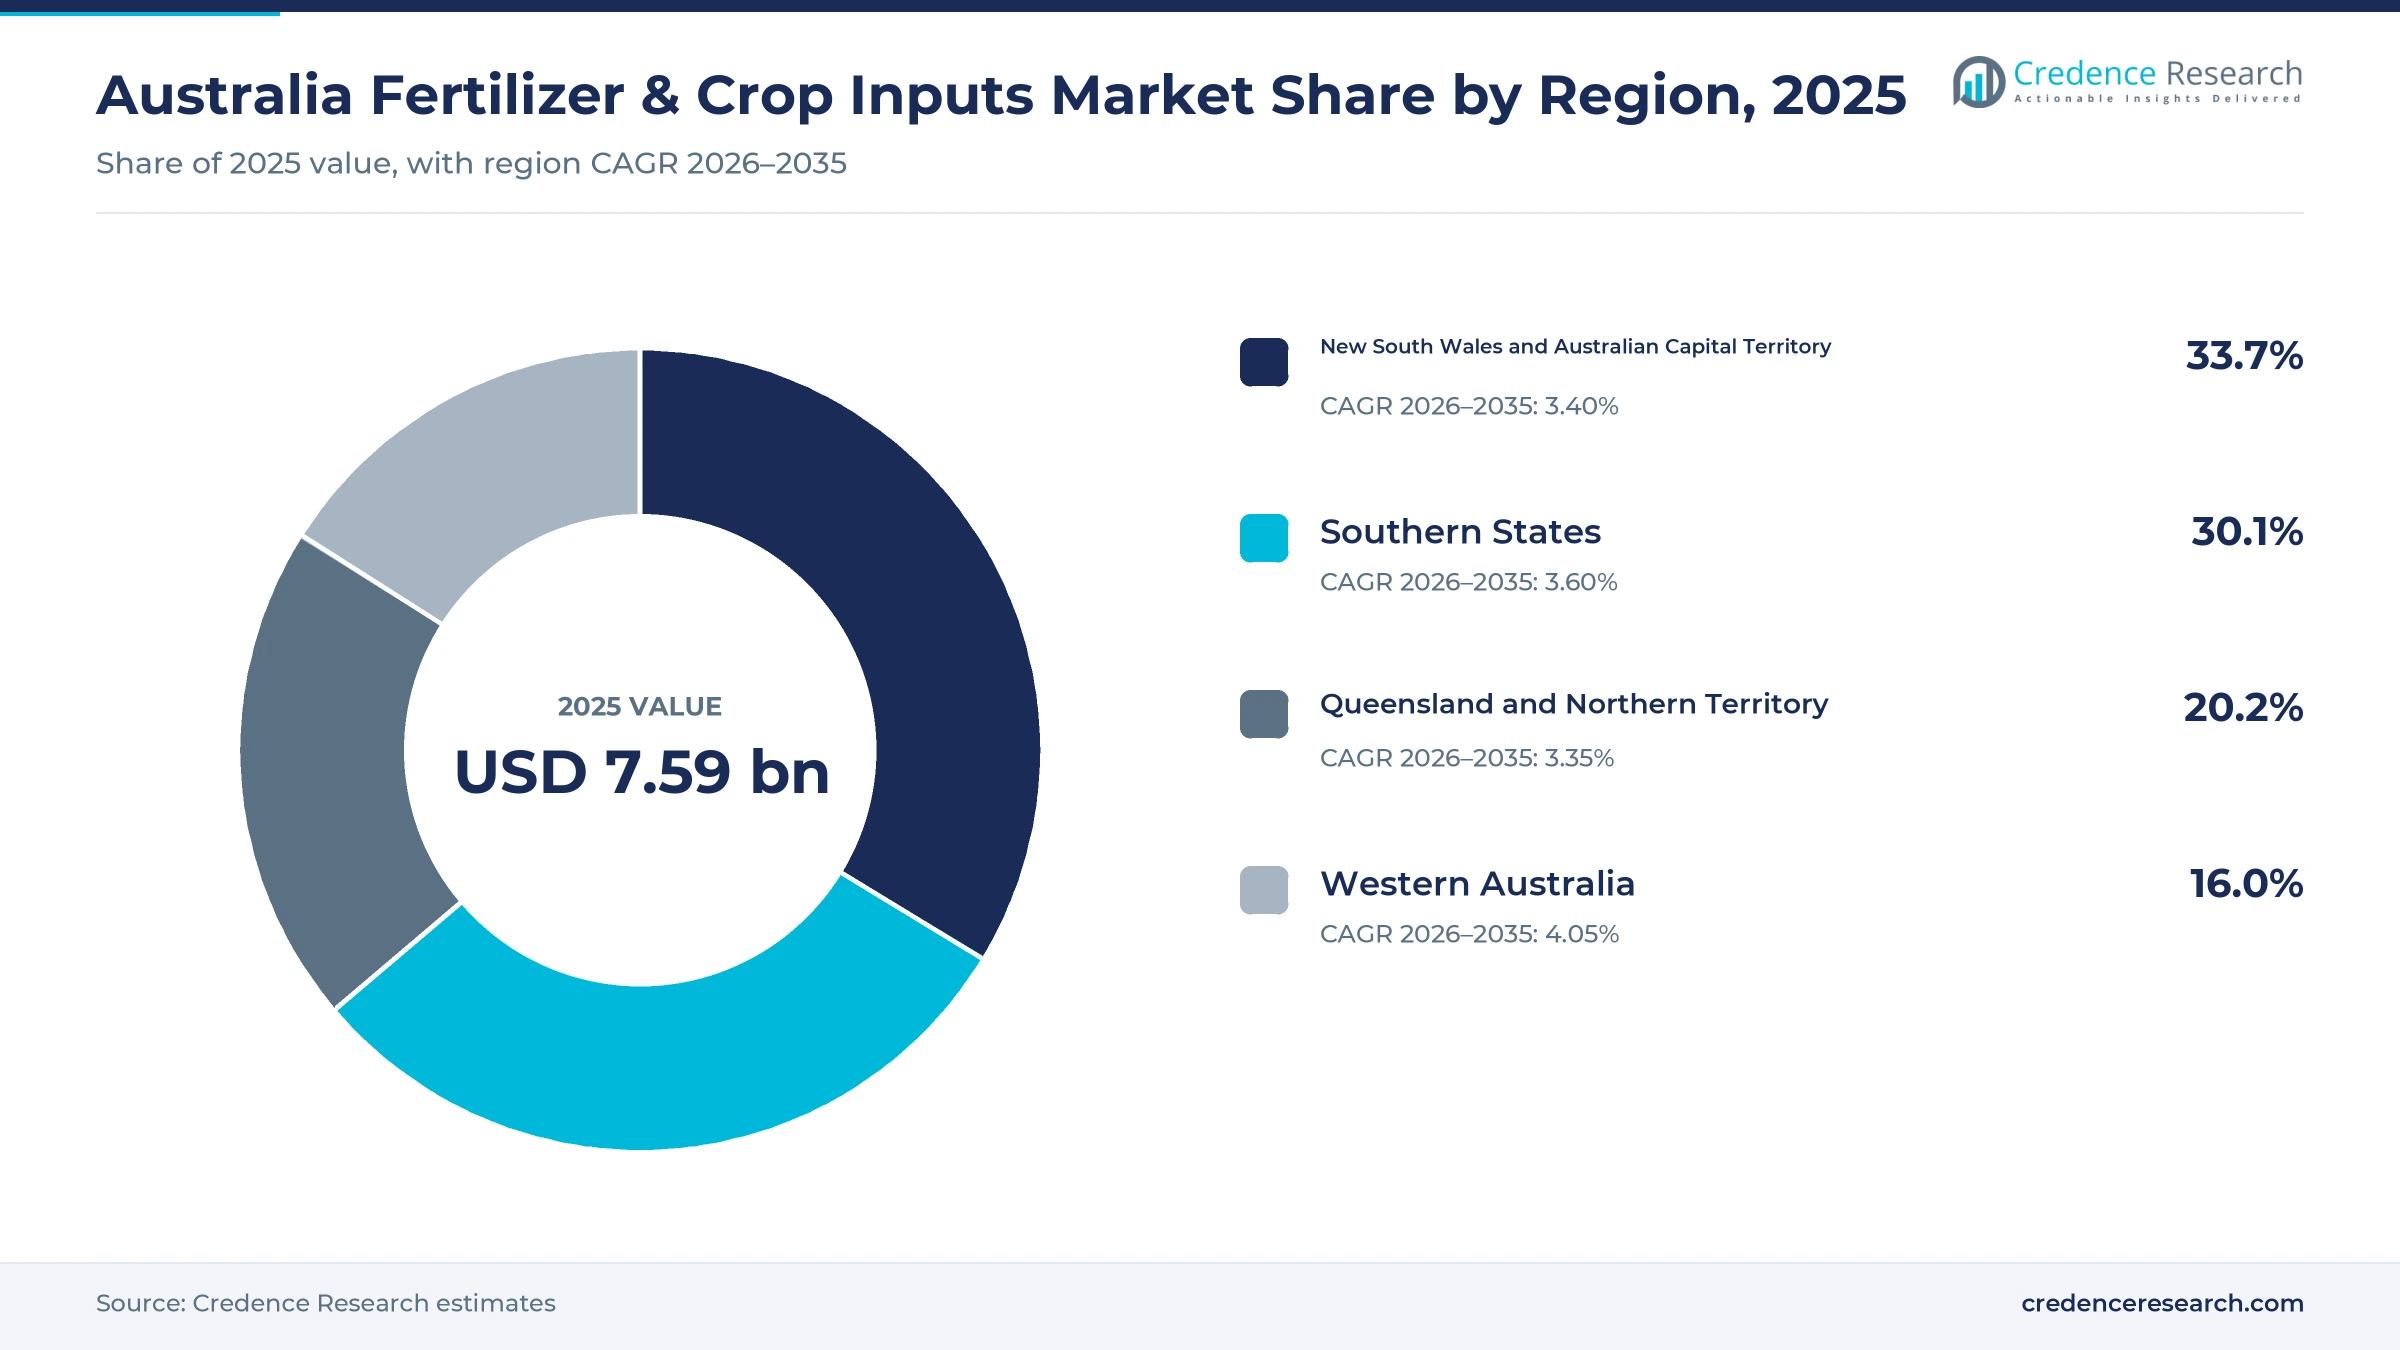
The Australia fertilizer and crop inputs market was valued at USD 7.59 billion in 2025 and is projected to increase from USD 7.88 billion in 2026 to USD 10.80 billion by 2035, registering a CAGR of 3.56% during 2026–2035. Demand comes from family farms, corporate farming groups, contract growers and research farms that buy fertilizers, herbicides, fungicides, insecticides, seed and specialty products before and during each season. New South Wales and the Australian Capital Territory held the largest regional share, 33.7% in 2025, because the zone combines broadacre grain, cotton and horticulture. Western Australia is the fastest-growing region at 4.05% a year, as the state grows the largest winter crop. In turn, rural retailers are consolidating and investing in storage, while growers rotate herbicide groups to manage resistant ryegrass.
Which farm inputs are counted in Australia?
The estimate measures spending in Australia on fertilizers, crop protection chemicals, commercial seeds, biostimulants and specialty inputs used on cereals, pulses, oilseeds, fiber crops, horticulture, vineyards and pasture. It covers pre-sowing, at-sowing, in-season and seed treatment uses bought through national rural networks, independent retailers, cooperatives, manufacturer direct sales and digital platforms. Values are stated in USD million at current prices and exclude goods and services tax.
The estimate excludes animal health products, fuel, machinery, irrigation water and agronomy fees sold separately. The value chain runs from global and local manufacturers and importers through port terminals, blending plants and rural retail branches to growers, contractors and research farms.
Australia Fertilizer & Crop Inputs Market Insights
- The Australia fertilizer and crop inputs market was valued at USD 7.59 billion in 2025 and is projected to reach USD 10.80 billion by 2035, at a 3.56% CAGR during 2026–2035.
- New South Wales and the Australian Capital Territory held 33.7% of 2025 value, because the zone combines grain, cotton and horticulture.
- Fertilizers led product types with 46.0% of 2025 value, as growers replace nutrients removed by large winter crops.
- Elders completed its acquisition of Delta Agribusiness on Nov. 4, 2025, adding a network of 68 locations to its rural products business.
- Biostimulants and specialty inputs grow fastest at 5.45% a year during 2026–2035, as growers add soil and plant health products to standard programs.
Fertilizers lead while specialty inputs grow fastest
Why do fertilizers lead farm input spending?
Based on product type, the market is categorized into fertilizers, crop protection, commercial seeds and biostimulants and specialty inputs. Fertilizers led with 46.0% of 2025 value, because growers must replace nitrogen and phosphorus removed by each crop. Biostimulants and Specialty Inputs grow fastest at 5.45% a year, as growers add soil and plant health products to standard programs.
Which crops account for most input purchases?
Based on crop type, the market is categorized into cereals and pulses, oilseeds and fibre crops, horticulture and viticulture, and pasture and forage. Cereals and Pulses led with 52.0% of 2025 value, because wheat, barley and pulses cover most cropped land. Oilseeds and Fibre Crops grow fastest at 4.06% a year, as canola and cotton growers use more seed traits and in-season protection.
When in the season do growers spend most?
Based on application, the market is categorized into pre-sowing soil application, at-sowing placement, in-season foliar application and seed treatment application. Pre-Sowing Soil Application led with 34.0% of 2025 value, because base nutrients and pre-emergent herbicides go on before seeding. Seed Treatment Application grows fastest at 4.19% a year, as growers protect seed and seedlings early.
How do Australian growers source inputs?
Based on distribution channel, the market is categorized into national rural networks, independent retailers and cooperatives, manufacturer direct and digital procurement platforms. National Rural Networks led with 51.0% of 2025 value, because they bundle agronomy, credit and delivery. Digital Procurement Platforms grow fastest at 5.68% a year, as large farms compare prices and order online.
| Segment Group | Leading Sub-segment | Share, 2025 | Fastest-growing Sub-segment | CAGR, 2026–2035 |
|---|---|---|---|---|
| By Product Type | Fertilizers | 46.0% | Biostimulants and Specialty Inputs | 5.45% |
| By Crop Type | Cereals and Pulses | 52.0% | Oilseeds and Fibre Crops | 4.06% |
| By Application | Pre-Sowing Soil Application | 34.0% | Seed Treatment Application | 4.19% |
| By Distribution Channel | National Rural Networks | 51.0% | Digital Procurement Platforms | 5.68% |
Request a Free Sample
Fill in your details and we'll send you a free sample report.
- Sample data tables & charts
- Research methodology
Yield economics, resistance and new varieties lift demand
How do yield protection economics lift input spending?
Yield protection economics lift input spending, because each metric ton of grain depends on timely nutrients and weed and disease control. Australia's 2026-27 winter crop is forecast at 60.9 million metric tons, below the previous season, according to the September 2026 national crop report. The same report notes that growers could still access inputs, albeit at a higher price. World Bank data show fertilizer use of 151.2 kilograms per hectare of arable land in 2024, up from 102.1 kilograms in 2023. Nutrien Ag Solutions also supplies more than 1.5 million metric tons of granular and liquid fertilizer a year to about 100,000 customers. As a result, fertilizers lead product types with 46.0% of 2025 value.
Why does resistance management sustain crop protection sales?
Resistance management sustains crop protection sales, because growers must rotate and stack herbicide groups to control weeds that survive older chemistry. A national survey found that 16% of annual ryegrass populations are now glyphosate-resistant, up from about 3% four years earlier, according to the grains research corporation. The same survey found 23% resistance to clethodim and 12% to trifluralin nationally, with 38% trifluralin resistance in South Australia. Nationally, 71% of samples were resistant to pinoxaden and 91% to iodosulfuron-methyl in the same survey. Consequently, growers spend more on pre-emergent mixes and agrochemicals with newer modes of action, which keeps crop protection the second-largest product group.
How does premium variety adoption raise seed and trait spending?
Premium variety adoption raises seed and trait spending, because new varieties carry better yield, quality and herbicide tolerance that growers pay for. Grains Australia classified eight new wheat varieties in its 2026-27 Wheat Variety Master List, effective Aug. 1, 2026, including six Australian Hard milling varieties. Breeder AGT launched Tomahawk CL Plus in September 2023 to close the yield gap seen in herbicide-tolerant wheat. Growers also buy commercial seeds with traits that let them use specific herbicides safely. As a result, seed treatment application grows fastest among application types at 4.19% a year, as growers protect higher-value seed from the first day.
Why does distribution investment widen grower access?
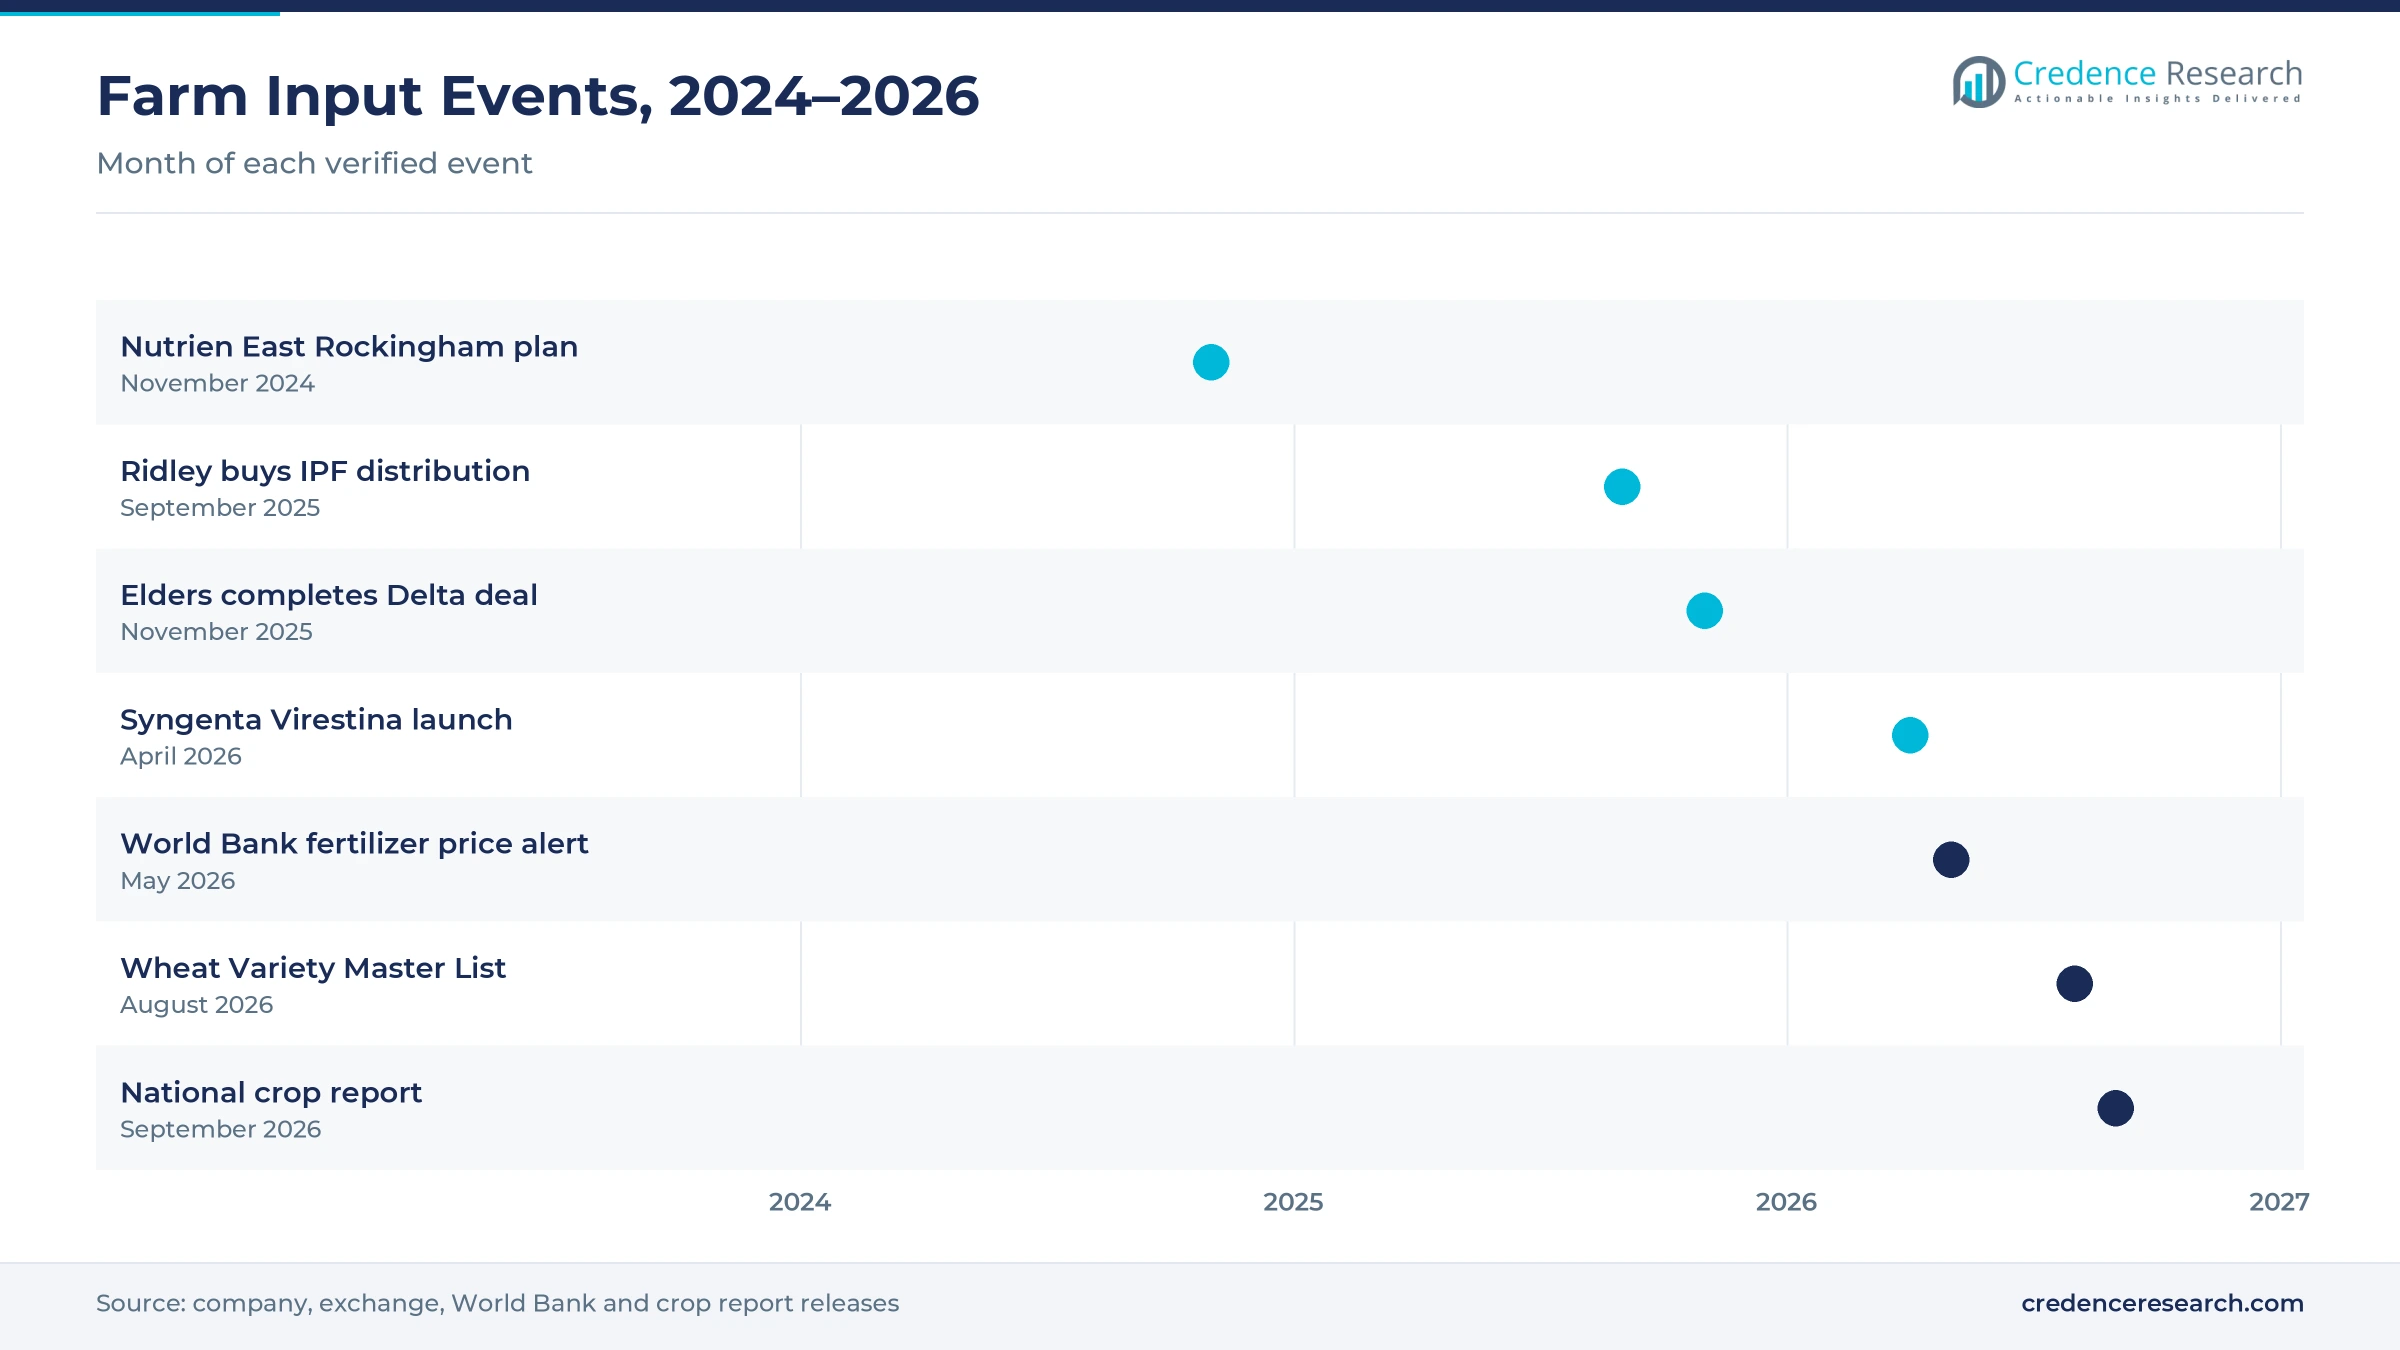
Distribution investment widens grower access, because larger rural networks can hold more stock, blend product locally and supply agronomy at scale. Elders completed its acquisition of Delta Agribusiness on Nov. 4, 2025, according to Elders, adding a network of 68 locations and 40 independent wholesaler customers. Ridley Corporation completed its purchase of the Incitec Pivot Fertilisers distribution business on Sept. 30, 2025, according to Dyno Nobel. Nutrien announced a AUD 70 million distribution center at East Rockingham in November 2024, lifting bulk granular storage by about 20% to 130,000 metric tons. Consequently, national rural networks lead channels with 51.0% of 2025 value.
Price swings, new herbicides and agronomy shape buying
How is the rise in fertilizer price swings changing buying?
The rise in fertilizer price swings is changing buying, because growers now time orders around global supply shocks. The World Bank fertilizer price index rose more than 12% in the first quarter of 2026, according to the World Bank. Urea prices climbed above USD 850 per metric ton in April 2026, up 80% since February, as Strait of Hormuz disruption hit a route that handles nearly a quarter of global urea exports. The World Bank projects urea prices to rise nearly 60% in 2026 before easing in 2027. As a result, growers buy earlier, store more on farm and split nitrogen between sowing and in-season top-ups.
Why is the shift toward new herbicide modes emerging?
The shift toward new herbicide modes of action is emerging, because older groups are losing effect on resistant weeds that already cost Australian grain producers about AUD 3.3 billion a year. Bayer plans a 2028 Australian rollout of icafolin-methyl, which it describes as the first new leaf-acting herbicide in more than 30 years, after field trials against glyphosate-resistant ryegrass. In April 2026, Syngenta launched Virestina, a grass herbicide for broadleaf crops, while Syngenta Australia continues to evaluate it for pulse crops. The national survey also found nil ryegrass resistance to pyroxasulfone and only 2% to prosulfocarb plus s-metolachlor. Consequently, pre-emergent and new-chemistry programs keep crop protection spending firm through 2035.
Can agronomy and precision services open new value?
Agronomy and precision services open a clear opportunity, because growers want advice that turns input spending into measurable yield. Elders stated in November 2025 that the Delta purchase strengthens its ag tech, precision agriculture and farm advisory capabilities. Nutrien Ag Solutions offers soil and tissue testing with farm-specific interpretation and claims the largest team of agronomists in Australia. Its 2026 season planning program also helps growers book product before sowing. Growers that use smart irrigation and farm sensors can apply inputs more precisely. As a result, digital procurement platforms grow fastest among channels at 5.68% a year, as large farms book product and advice online.
Is there room to grow in southern grain rebounds?
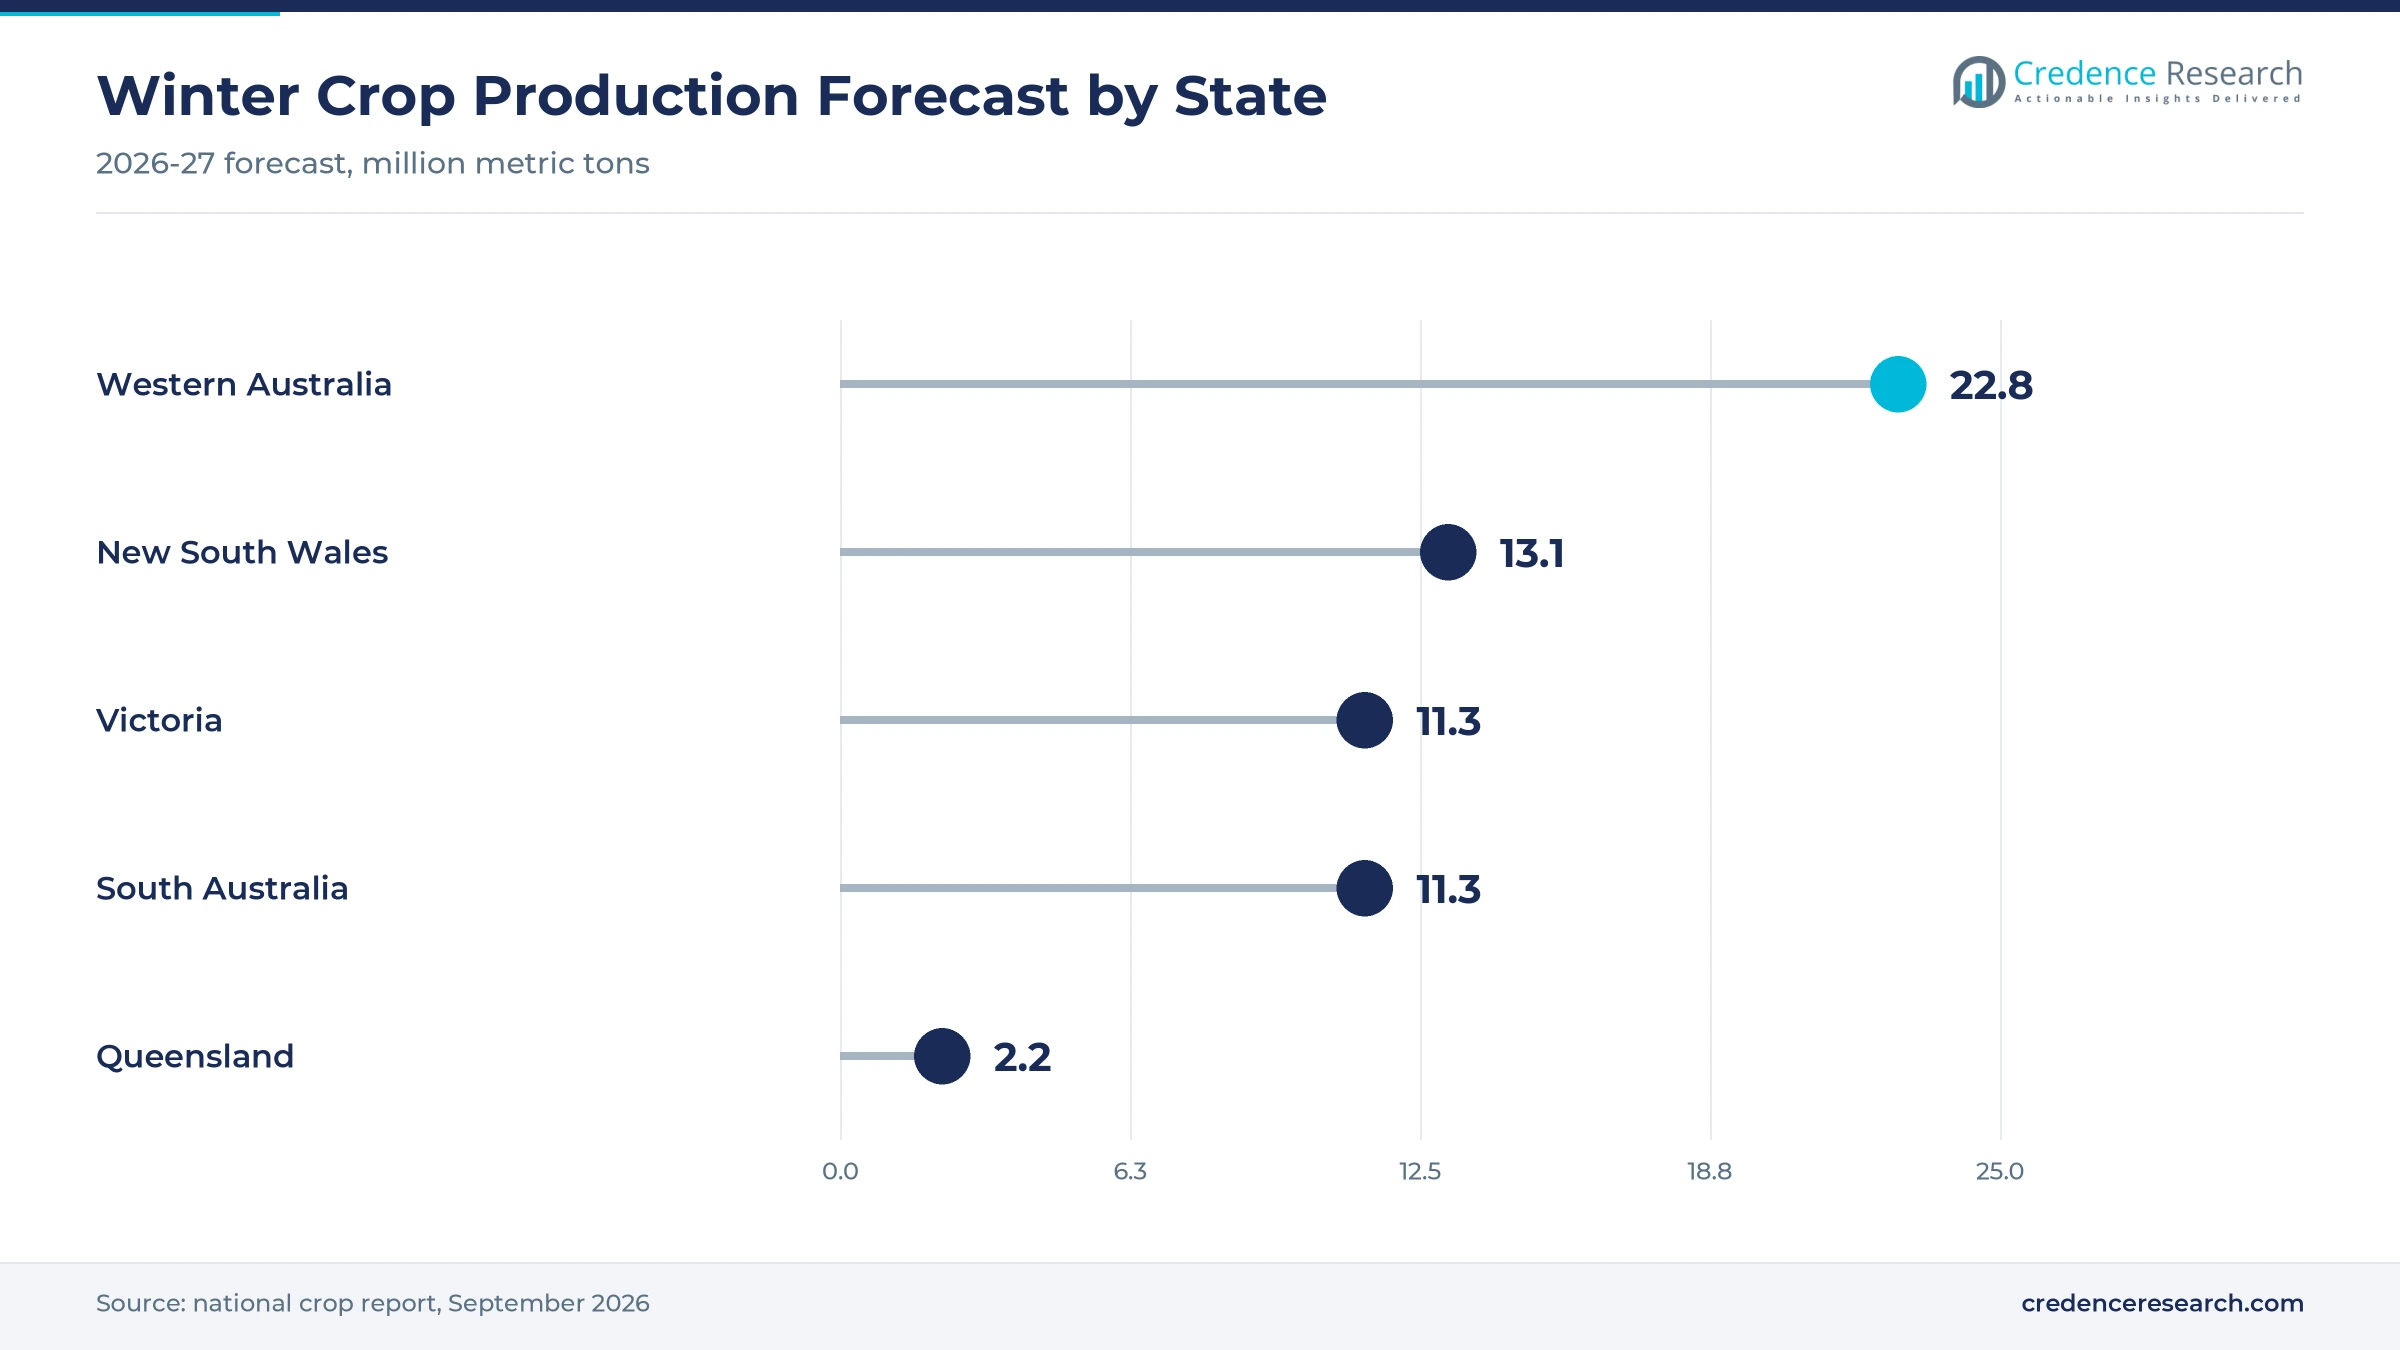
Southern grain rebounds offer a growth opening, because larger planted areas lift seed, fertilizer and herbicide orders in the same season. South Australia's winter crop is forecast at 11.3 million metric tons in 2026-27, up 24.3%, while Victoria is forecast at 11.3 million metric tons, up 12.0%. South Australian canola area also rose, with production forecast at 630,000 metric tons, up 15%. South Australian barley is forecast at 2.9 million metric tons, up 35%. Consequently, oilseeds and fibre crops grow fastest among crop types at 4.06% a year, while the Southern States hold 30.1% of 2025 value and remain a large buyer of seed treatment products.
Price spikes, seasons and supply limits strain growers
How do price spikes strain grower margins?
Price spikes are a major challenge, because fertilizer can be the largest cash cost for a grain grower. Urea climbed above USD 850 per metric ton in April 2026, up 80% since February, which raised the cost of each nitrogen application. As a result, some growers cut rates or delay purchases, which puts yield at risk in good seasons. Retailers respond with forward contracts, split applications and soil tests that target nutrients where returns are highest.
Why do seasonal swings limit input demand?
Seasonal swings limit input demand, because dry starts reduce planted area and in-season spending. Queensland's winter crop is forecast at 2.2 million metric tons in 2026-27, down 43.6%, while New South Wales is forecast down 29.9%, which cuts input demand in northern cropping districts for the 2026 season. Consequently, retailers in dry regions face lower sales and higher stock risk. Suppliers respond with flexible terms, smaller pack sizes and programs that let growers scale spending to soil moisture.
How do supply chain changes add uncertainty?
Supply chain changes add uncertainty, because local manufacturing and distribution assets are changing hands. Dyno Nobel completed the sale of its fertilizer distribution business on Sept. 30, 2025, which shifted a large share of eastern supply to a new owner. It is still running a sale process for Phosphate Hill. In turn, growers and retailers face questions about future local supply and import reliance. Distributors respond by adding port storage, blending capacity and import contracts that reduce the risk of shortages at sowing.
Will resistance and regulation narrow chemical choices?
Resistance and regulation can narrow chemical choices, because weeds adapt and new products need registration before sale. Syngenta's Virestina was still under evaluation in Australia in April 2026, while Bayer targets 2028 for icafolin, so demand for existing herbicide groups stays high for at least 2 more years. As a result, growers must stretch existing groups for several more seasons, which raises the pressure on rotation. Suppliers respond with stewardship programs, mixes and non-chemical weed control advice.
New South Wales leads as Western Australia grows fastest
| Region | Value, 2025 (USD billion) | Share, 2025 | CAGR, 2026–2035 |
|---|---|---|---|
| New South Wales and Australian Capital Territory | 2.56 | 33.7% | 3.40% |
| Southern States | 2.29 | 30.1% | 3.60% |
| Queensland and Northern Territory | 1.53 | 20.2% | 3.35% |
| Western Australia | 1.21 | 16.0% | 4.05% |
Why do New South Wales and the ACT lead input demand?
New South Wales and the Australian Capital Territory held 33.7% of 2025 value and grow at 3.40% a year. New South Wales combines winter grain, irrigated cotton and horticulture, which keeps spending high across seasons. Its 2026-27 winter crop is forecast at 13.1 million metric tons, down 29.9%, which tempers near-term demand. However, the zone keeps the largest share of input spending through 2035.
How do the Southern States add grain-led demand?
The Southern States held 30.1% of 2025 value and grow at 3.60% a year, because Victoria and South Australia both expect larger winter crops in 2026-27. South Australia is forecast at 11.3 million metric tons, up 24.3%, and Victoria at 11.3 million metric tons, up 12.0%. South Australia also has 38% trifluralin resistance in annual ryegrass, the highest rate in the national survey. Consequently, demand here leans toward fertilizer, canola seed and pre-emergent herbicides.
Why is Western Australia the fastest-growing zone?
Western Australia held 16.0% of 2025 value and grows fastest at 4.05% a year, because the state grows the largest winter crop, forecast at 22.8 million metric tons in 2026-27. Nutrien is building a AUD 70 million distribution center at East Rockingham, expected to operate in 2026. In turn, larger port storage and blending capacity support bigger orders from large broadacre farms.
What role do Queensland and the NT play?
Queensland and the Northern Territory held 20.2% of 2025 value and grow at 3.35% a year. Queensland's winter crop is forecast at 2.2 million metric tons in 2026-27, down 43.6%, after a dry start. As a result, demand here relies more on summer crops, cotton, sugar and horticulture, which use more in-season protection.
Retail deals, storage and herbicide news, 2024–2026
| Development | Status and market relevance |
|---|---|
| In November 2024, Nutrien announced a AUD 70 million fertilizer distribution center at East Rockingham, Western Australia, with 130,000 metric tons of storage. | Expected to operate in 2026 |
| In September 2025, Ridley Corporation completed its purchase of the Incitec Pivot Fertilisers distribution business from Dyno Nobel. | Changes eastern fertilizer distribution |
| In November 2025, Elders completed its acquisition of Delta Agribusiness, adding 68 locations after the competition regulator required six branch sales. | Widens agronomy and retail reach |
| In April 2026, Syngenta launched Virestina, a grass herbicide for broadleaf crops that remains under evaluation in Australia. | Adds a future resistance tool |
| In August 2026, Grains Australia's 2026-27 Wheat Variety Master List took effect with eight newly classified varieties. | Supports premium seed demand |
Placement, testing and new chemistry reshape inputs
- Variable-rate spreading matches fertilizer rates to soil zones, which cuts waste and raises returns on each metric ton.
- Soil and tissue testing shows which nutrients limit yield, which lets agronomists target spending before and during the season.
- New herbicide chemistry adds modes of action against resistant ryegrass, which extends the life of existing groups.
- Seed treatments protect seed and seedlings from pests and disease in the first weeks, which supports even crop establishment.
Need a Custom Version of This Report?
Tailor the scope, geography, or segments to your exact requirements.
- Custom geography or segment scope
- Direct access to our analyst team
Rural networks compete on agronomy, supply and reach
Competition is led by national rural networks, manufacturers and importers that combine product supply with agronomy. Nutrien Ag Solutions supplies more than 1.5 million metric tons of fertilizer a year and is building new storage in Western Australia. Elders widened its network with Delta Agribusiness in November 2025, while Incitec Pivot Fertilisers now sits within Ridley Corporation after a September 2025 sale. Bayer and Syngenta compete through crop protection and seed, with Bayer planning icafolin for 2028 and Syngenta launching Virestina in April 2026. Companies compete on agronomy depth, stock availability, credit terms, port and blending assets, and access to new chemistry. Nutrien Ag Solutions claims the largest team of agronomists in Australia, while Elders keeps Delta under its own brand. In the Australia fertilizer and crop inputs market, scale in storage and advice now matters as much as product price.
Companies profiled and their roles in this market
| Company | Type | Role in the market |
|---|---|---|
| Nutrien | National rural network | Supplies more than 1.5 million metric tons of fertilizer a year; East Rockingham center |
| Elders | National rural network | Completed Delta Agribusiness acquisition in November 2025 |
| Incitec Pivot Fertilisers | Fertilizer distributor | Distribution business sold to Ridley Corporation in September 2025 |
| Bayer | Crop protection and seed | Icafolin-methyl herbicide targeted for 2028 Australian rollout |
| Syngenta | Crop protection and seed | Virestina grass herbicide launched April 2026, under evaluation locally |
Credence Research sees agronomy setting the pace
Credence Research's view is that Australian farm input spending will grow steadily through 2035, as growers protect yield and manage resistant weeds. Fertilizers should keep the largest product share, while specialty inputs and seed treatments gain most from targeted agronomy. New South Wales and the ACT will remain the largest zone, although Western Australia adds demand fastest. However, fertilizer price swings and dry seasons will reward suppliers with storage, agronomy and flexible credit. Retailers that pair fertilizer and crop inputs with soil testing should gain share.
Crop area and input rates anchor the farm input model
The report uses 2025 as the base year, with values in USD million at current prices. Market values come from the Credence Research model, which combines crop area, production, input rates and price levels. Regional shares follow the client data set, while regional growth and segment splits by product type, crop type, application and distribution channel are Credence Research estimates. Sources used are official crop reports, World Bank data, grains research publications, company releases and stock exchange filings, and no interviews or surveys were used.
Resistance and yield goals shape input demand to 2035
The market is expected to reach USD 10.80 billion by 2035, a 3.56% CAGR during 2026–2035, as yield goals and resistance management keep input spending rising. Growth should be strongest in specialty inputs, seed treatments and Western Australia, while New South Wales and the ACT keep the largest share. New herbicide chemistry and larger rural networks will shape buying after 2026. In contrast, fertilizer price spikes or dry seasons could slow spending in some years.
Frequently Asked Questions
How big is the Australia fertilizer and crop inputs market?
Which region leads input demand?
Which region grows fastest?
Which product type holds the largest share?
Why does herbicide resistance matter?
Which product type grows fastest?
Who are the leading companies in this market?
What are the main risks to growth?
Table of Content
Chapter 1 Market Segmentation
- 1.1 Segmentation Framework
- 1.1.1 Product and Service Classification
- 1.1.2 Application and End-Use Classification
- 1.1.3 Technology and Solution Classification
- 1.1.4 Customer and Distribution Channel Classification
- 1.1.5 Geographic Segmentation
- 1.1.6 Market Segment Definitions and Boundaries
- 1.2 By Product Type
- 1.2.1 Fertilizers
- 1.2.2 Crop Protection
- 1.2.3 Commercial Seeds
- 1.2.4 Biostimulants and Specialty Inputs
- 1.3 By Crop Type
- 1.3.1 Cereals and Pulses
- 1.3.2 Oilseeds and Fibre Crops
- 1.3.3 Horticulture and Viticulture
- 1.3.4 Pasture and Forage
- 1.4 By Application
- 1.4.1 Pre-Sowing Soil Application
- 1.4.2 At-Sowing Placement
- 1.4.3 In-Season Foliar Application
- 1.4.4 Seed Treatment Application
Chapter 2 Introduction
- 2.1 Report Objectives and Scope
- 2.2 Product Definition and Industry Terminology
- 2.3 Market Inclusions and Exclusions
- 2.4 Research Process
- 2.4.1 Primary Research and Expert Interviews
- 2.4.2 Secondary Research and Source Review
- 2.4.3 Top-Down and Bottom-Up Estimation
- 2.4.4 Data Triangulation and Verification
- 2.5 Market Size Measurement Basis
- 2.5.1 2025: USD 7.59 billion → 2035: USD 10.80 billion
- 2.6 Historical and Forecast Reference Periods
- 2.6.1 Historical Period: 2018-2025
- 2.6.2 Base Year: 2025
- 2.6.3 Forecast Period: 2025-2035
- 2.7 Research Assumptions and Limitations
Chapter 3 Executive Summary
- 3.1 Market Snapshot and Key Findings
- 3.2 Base-Year Market Size, 2025
- 3.3 Forecast Market Size, 2035
- 3.4 Revenue and Volume Growth Outlook
- 3.5 Key Demand and Supply Indicators
- 3.6 Leading Market Segments
- 3.7 Fastest-Growing Market Opportunities
- 3.8 Regional Performance Highlights
- 3.9 Technology and Industry Transformation
- 3.10 Competitive Landscape Summary
- 3.11 Analyst View and Strategic Implications
Chapter 4 Australia Fertilizer & Crop Inputs Market Trends and Developments
- 4.1 Historical Industry Development, 2018-2025
- 4.2 Recent Market Trends and Developments
- 4.3 Demand and Customer Behavior Trends
- 4.4 Technology and Product Innovation
- 4.5 Artificial Intelligence, Automation and Digitalization
- 4.6 Local Manufacturing and Supply Chain Realignment
- 4.7 Industry Partnerships, Mergers and Acquisitions
- 4.8 Sustainability and Circular Economy Developments
- 4.9 Government and Private Sector Investment Trends
- 4.10 Emerging Business Models and Commercialization
- 4.11 Industry Developments and Announcements
Chapter 5 Australia Fertilizer & Crop Inputs Market Production, Supply and Demand Analysis
- 5.1 Demand Trend and Consumption Analysis, 2018-2025
- 5.2 Demand Forecast, 2025-2035
- 5.3 Production and Output Trend, 2018-2025
- 5.4 Production and Output Forecast, 2025-2035
- 5.5 Installed Capacity and Capacity Utilization
- 5.6 Company-Wise Production Plants and Statistics
- 5.6.1 Installed Production Capacity
- 5.6.2 Actual Production
- 5.6.3 Planned Capacity and Expansion Targets
- 5.7 Supply Chain Structure and Procurement Trends
- 5.8 Supply-Demand Gap and Bottlenecks
- 5.9 Import Dependence and Sourcing Structure
- 5.10 Contract Manufacturing and Outsourcing
- 5.11 Regional Supply and Demand Concentration
Chapter 6 Australia Fertilizer & Crop Inputs Market Pricing Analysis
- 6.1 Pricing Structure and Measurement
- 6.2 Historical Pricing Trends, 2018-2025
- 6.3 Pricing Outlook, 2025-2035
- 6.4 Average Selling Price and Unit Economics
- 6.5 Pricing by Product and Market Segment
- 6.6 Geographic Pricing Differences
- 6.7 Key Input, Energy, Labor and Logistics Costs
- 6.8 Contract Pricing and Purchasing Models
- 6.9 Pricing Sensitivity and Competitive Positioning
- 6.10 Price, Margin and Profitability Implications
Chapter 7 Australia Fertilizer & Crop Inputs Market Dynamics
- 7.1 Market Growth Drivers
- 7.1.1 Demand-Side Drivers
- 7.1.2 Technology and Innovation Drivers
- 7.1.3 Infrastructure and Investment Drivers
- 7.1.4 Regulatory and Policy Drivers
- 7.2 Market Restraints
- 7.2.1 Cost and Affordability Constraints
- 7.2.2 Technology and Adoption Barriers
- 7.2.3 Supply Chain and Operational Constraints
- 7.3 Market Challenges
- 7.3.1 Competitive Pressure and Margin Erosion
- 7.3.2 Skills, Infrastructure and Implementation Gaps
- 7.4 Emerging Market Opportunities
- 7.5 Market Dynamics Impact and Time-Horizon Assessment
Chapter 8 Australia Fertilizer & Crop Inputs Value Chain Analysis
- 8.1 Industry Value Chain Overview
- 8.2 Upstream Suppliers and Critical Inputs
- 8.3 Technology and Component Providers
- 8.4 Manufacturing or Service Delivery
- 8.5 Distribution, Channel Partners and Integrators
- 8.6 Downstream Applications and End Users
- 8.7 Value Addition and Profit Pools
- 8.8 Vertical Integration and Outsourcing
- 8.9 Supplier Concentration and Risk
- 8.10 Supply Chain Localization and Resilience
Chapter 9 Australia Fertilizer & Crop Inputs Market Regulations and Policies
- 9.1 Relevant Laws, Standards and Compliance Frameworks
- 9.2 Product, Service, Safety and Quality Requirements
- 9.3 Government Policies, Incentives and Subsidies
- 9.4 Imports, Exports and Trade Barriers
- 9.5 Public Procurement and Local Content Requirements
- 9.6 Environmental and Sustainability Compliance
- 9.7 Upcoming Policy Changes and Market Implications
Chapter 10 Australia Fertilizer & Crop Inputs Market Hotspots and Opportunities
- 10.1 Market Opportunity Mapping and Growth Hotspots
- 10.2 High-Growth Applications and Customer Groups
- 10.3 Underserved Markets and White-Space Opportunities
- 10.4 Emerging Technology and Product Opportunities
- 10.5 New Capacity and Investment Hotspots
- 10.6 Market Entry and Expansion Opportunities
- 10.7 Distribution and Partnership Opportunities
- 10.8 Near-Term and Long-Term Commercial Potential
- 10.9 Opportunity Attractiveness and Execution Risks
Chapter 11 Australia Fertilizer & Crop Inputs Market Outlook, 2025-2035
- 11.1 Market Size and Analysis
- 11.1.1 Revenue (Market Measurement: 2025: USD 7.59 billion → 2035: USD 10.80 billion)
- 11.1.2 Market Volume and Quantity Sold
- 11.1.3 Historical Market Size, 2018-2025
- 11.1.4 Base-Year Market Size, 2025
- 11.2 Market Forecast, 2025-2035
- 11.2.1 Revenue Forecast to 2035
- 11.2.2 Volume Forecast to 2035
- 11.2.3 CAGR and Year-on-Year Growth
- 11.2.4 Incremental Revenue Opportunity
- 11.3 Forecast Assumptions and Scenario Analysis
- 11.3.1 Base-Case Forecast
- 11.3.2 Optimistic and Conservative Scenarios
- 11.3.3 Technology, Pricing and Policy Sensitivities
- 11.4 Market Attractiveness and Growth Outlook
Chapter 12 Australia Fertilizer & Crop Inputs Market Segmentation and Outlook
- 12.1 Segmentation Summary and Market Shares, 2025
- 12.2 Largest and Fastest-Growing Segments
- 12.3 By Product Type - Market Size and Forecast, 2025-2035
- 12.3.1 Segment Definition and Scope
- 12.3.2 Historical Market Size, 2018-2025
- 12.3.3 Revenue Forecast, 2025-2035
- 12.3.4 Volume Forecast, 2025-2035
- 12.3.5 Base-Year Market Share, 2025
- 12.3.6 Segment CAGR and Growth Drivers
- 12.3.7 Subsegment Market Size and Forecast
- 12.3.7.1 Fertilizers
- 12.3.7.2 Crop Protection
- 12.3.7.3 Commercial Seeds
- 12.3.7.4 Biostimulants and Specialty Inputs
- 12.3.8 Subsegment Pricing and Adoption Trends
- 12.3.9 Leading Suppliers and Competition
- 12.3.10 Regional Demand and Opportunities
- 12.4 By Crop Type - Market Size and Forecast, 2025-2035
- 12.4.1 Segment Definition and Scope
- 12.4.2 Historical Market Size, 2018-2025
- 12.4.3 Revenue Forecast, 2025-2035
- 12.4.4 Volume Forecast, 2025-2035
- 12.4.5 Base-Year Market Share, 2025
- 12.4.6 Segment CAGR and Growth Drivers
- 12.4.7 Subsegment Market Size and Forecast
- 12.4.7.1 Cereals and Pulses
- 12.4.7.2 Oilseeds and Fibre Crops
- 12.4.7.3 Horticulture and Viticulture
- 12.4.7.4 Pasture and Forage
- 12.4.8 Subsegment Pricing and Adoption Trends
- 12.4.9 Leading Suppliers and Competition
- 12.4.10 Regional Demand and Opportunities
- 12.5 By Application - Market Size and Forecast, 2025-2035
- 12.5.1 Segment Definition and Scope
- 12.5.2 Historical Market Size, 2018-2025
- 12.5.3 Revenue Forecast, 2025-2035
- 12.5.4 Volume Forecast, 2025-2035
- 12.5.5 Base-Year Market Share, 2025
- 12.5.6 Segment CAGR and Growth Drivers
- 12.5.7 Subsegment Market Size and Forecast
- 12.5.7.1 Pre-Sowing Soil Application
- 12.5.7.2 At-Sowing Placement
- 12.5.7.3 In-Season Foliar Application
- 12.5.7.4 Seed Treatment Application
- 12.5.8 Subsegment Pricing and Adoption Trends
- 12.5.9 Leading Suppliers and Competition
- 12.5.10 Regional Demand and Opportunities
- 12.6 Segment Growth Comparison
- 12.7 Segment Attractiveness and Priority Matrix
Chapter 13 Australia Fertilizer & Crop Inputs End-Use and Application Market Outlook
- 13.1 End-Use Industry and Customer Demand Structure
- 13.2 Leading Applications and Customer Groups
- 13.3 End-Use Market Size, Share and Forecast
- 13.4 Major End-Use Industry Deep Dives
- 13.4.1 Customer Requirements and Use Cases
- 13.4.2 Demand and Replacement Cycles
- 13.4.3 Technical and Regulatory Considerations
- 13.4.4 Purchasing and Procurement Models
- 13.4.5 Leading Vendors and Distribution Channels
- 13.4.6 Forecast and Commercial Opportunities
- 13.5 Emerging Applications and Cross-Segment Demand
- 13.6 End-Use Industry Investment Priorities
Chapter 14 Australia Fertilizer & Crop Inputs Geographic Market Outlook, 2025-2035
- 14.1 Domestic Market Distribution and Demand Clusters
- 14.2 State- or Province-Wise Market Size and Forecast, 2025-2035
- 14.3 City and Metropolitan Market Outlook
- 14.4 Industrial, Manufacturing and Commercial Clusters
- 14.5 Geographic Concentration of Key End Users
- 14.6 Local Pricing and Purchasing Differences
- 14.7 Domestic Production Facilities and Capacity Map
- 14.8 Local Infrastructure and Project Pipeline
- 14.9 State-Level Policy and Incentive Differences
- 14.10 Subnational Investment Hotspots and Opportunities
- 14.11 Distribution and Logistics Networks
- 14.12 Domestic Competitive Footprint
Chapter 15 Australia Fertilizer & Crop Inputs Technology, Innovation and Sustainability Outlook
- 15.1 Technology Landscape and Maturity
- 15.2 Product, Process and Service Innovation
- 15.3 AI, Automation and Digital Tools in the Industry
- 15.4 Technology Adoption and Performance Benchmarking
- 15.5 Innovation Pipeline and R&D Investment
- 15.6 Patent and Intellectual Property Trends
- 15.7 Energy Efficiency and Resource Management
- 15.8 Sustainability, Recycling and Circularity
- 15.9 Technology Roadmap, 2025-2035
- 15.10 Risks of Obsolescence and Technology Substitution
Chapter 16 Australia Fertilizer & Crop Inputs Market Key Strategic Imperatives
- 16.1 Growth and Market Entry Priorities
- 16.2 High-Return Products and Segments
- 16.3 Pricing, Profitability and Cost Optimization
- 16.4 Technology Investment and Product Differentiation
- 16.5 Supply Chain Localization and Resilience
- 16.6 Distribution and Customer Acquisition
- 16.7 Partnership, Acquisition and Capacity Strategy
- 16.8 Regional Expansion Priorities
- 16.9 Short-, Medium- and Long-Term Actions
Chapter 17 Competition Outlook
- 17.1 Industry Competition Characteristics
- 17.2 Market Structure and Concentration
- 17.3 Market Share and Competitive Positioning, 2025
- 17.4 Company-Wise Revenue and Product Benchmarking
- 17.5 Production and Service Capacity Benchmarking
- 17.6 Technology, Pricing and Differentiation
- 17.7 Regional Footprint and Distribution Strength
- 17.8 Mergers, Acquisitions and Strategic Alliances
- 17.9 New Entrants and Competitive Threats
- 17.10 Porter's Five Forces and Industry Attractiveness
- 17.11 Competitive Outlook, 2025-2035
Chapter 18 Company Profiles
- 18.1 Company Coverage and Selection Criteria
- 18.2 Nutrien
- 18.2.1 Business Description
- 18.2.2 Company Ownership and Geographic Presence
- 18.2.3 Product and Service Portfolio
- 18.2.4 Manufacturing and Operating Footprint
- 18.2.5 Production Capacity and Expansion Plans
- 18.2.6 Financial Performance and Investment
- 18.2.7 Market Share and Competitive Position
- 18.2.8 Technology and Innovation Capabilities
- 18.2.9 Strategic Alliances or Partnerships
- 18.2.10 Recent Developments
- 18.2.11 Growth Strategy and Outlook
- 18.3 Elders
- 18.4 Incitec Pivot Fertilisers
- 18.5 Bayer
- 18.6 Syngenta
- 18.7 Other Relevant Market Participants
Note: Every listed company is profiled on the structure shown under the first company. The company list is preliminary and may change based on research findings, market developments, data availability and client requirements.
Chapter 19 Disclaimer
- 19.1 Research and Forecast Disclaimer
- 19.2 Data Source and Estimation Limitations
Note: The depth of individual sections depends on data availability for this market. Volume, capacity, trade and other unit-based metrics are included where applicable.

