
Commercial livestock and fish farming lift nutrient blends
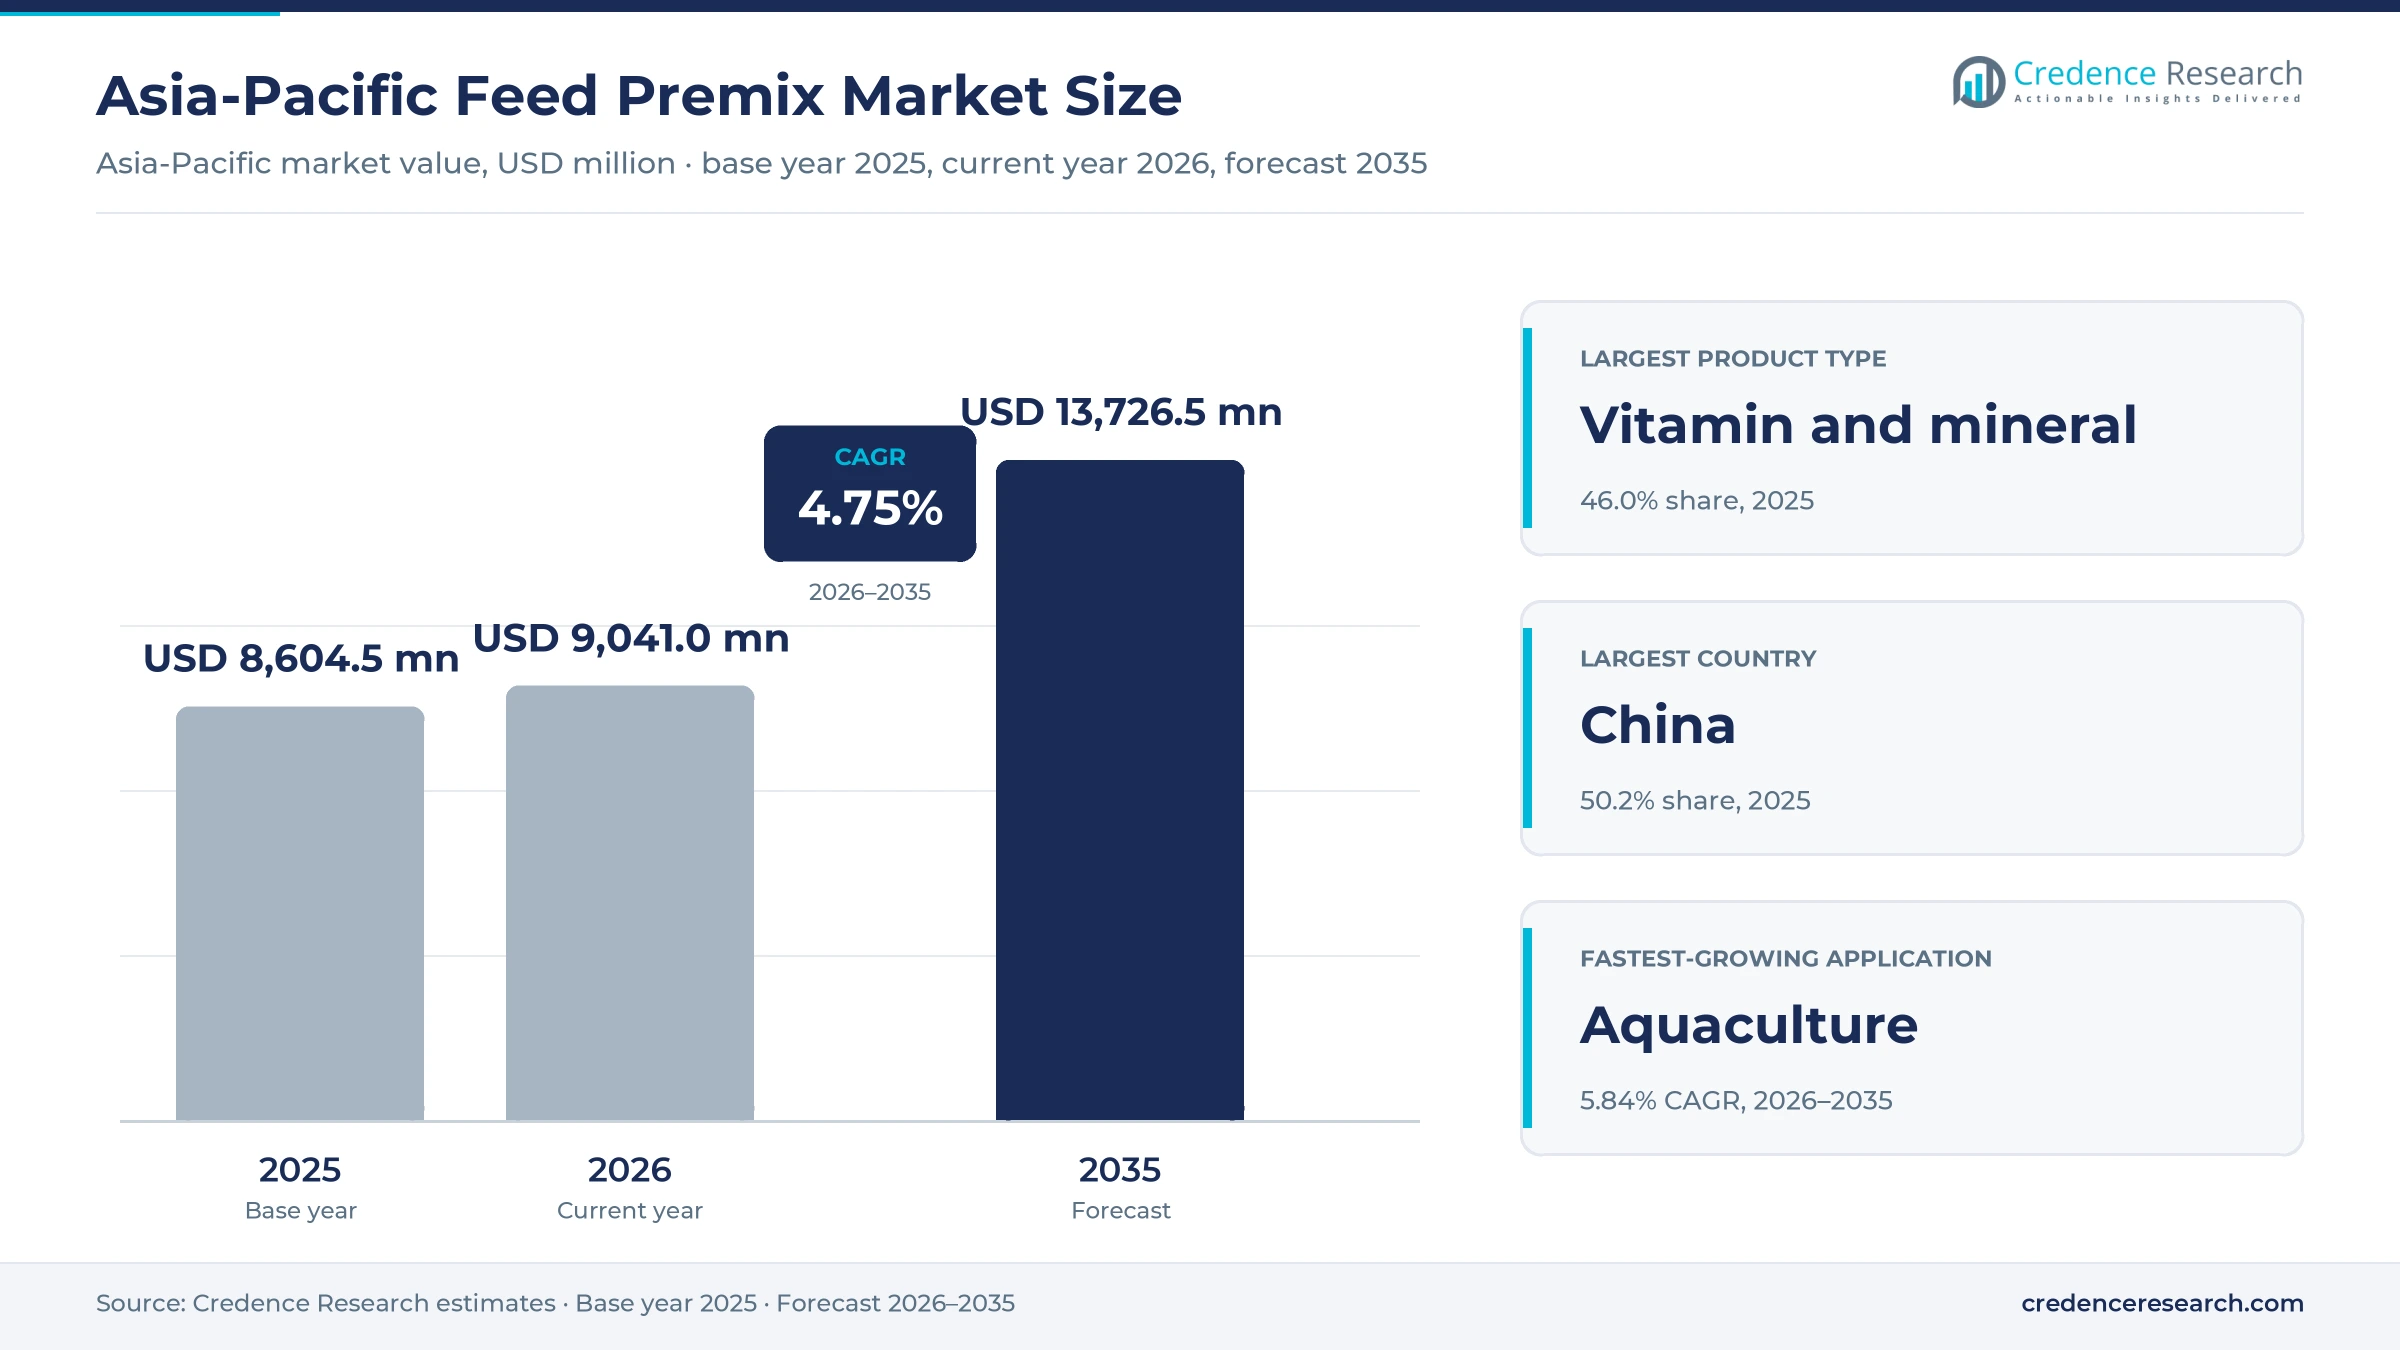
The Asia-Pacific feed premix market was valued at USD 8.60 billion in 2025 and is projected to increase from USD 9.04 billion in 2026 to USD 13.73 billion by 2035, registering a CAGR of 4.75% during 2026–2035. Demand comes from feed mills that add vitamins, minerals and amino acids to poultry and swine rations, from integrated producers that blend their own diets, and from fish and shrimp farms that need specialized nutrition. China held the largest regional share, 50.2% in 2025, because it produces more compound feed than any other country. India is the fastest-growing country at 6.27% a year, as dairy and poultry farms move to commercial rations. In turn, China's push to cut soybean meal in rations is raising demand for amino acid blends, while large ownership changes, including the planned sale of the dsm-firmenich animal nutrition business, are reshaping supply across the region.
Which nutrient blends and concentrates does the estimate cover?
The estimate measures the value of vitamin, mineral, amino acid and functional premixes and the complete premixes and concentrates that feed mills, integrated producers and farms add to animal and fish rations in Asia-Pacific. It covers dry blends, protected nutrient formulations and liquid formulations sold for poultry, swine, aquaculture, ruminants and other livestock.
The estimate excludes single feed additives sold on their own, finished compound feed and pet food. The value chain runs from vitamin, trace mineral and amino acid producers through premix blenders and distributors to independent feed mills, integrated livestock companies, commercial farms and cooperatives in China, India, Southeast Asia and the rest of the region.
Asia-Pacific Feed Premix Market Insights
- The Asia-Pacific feed premix market was valued at USD 8.60 billion in 2025 and is projected to reach USD 13.73 billion by 2035, registering a CAGR of 4.75% during 2026–2035.
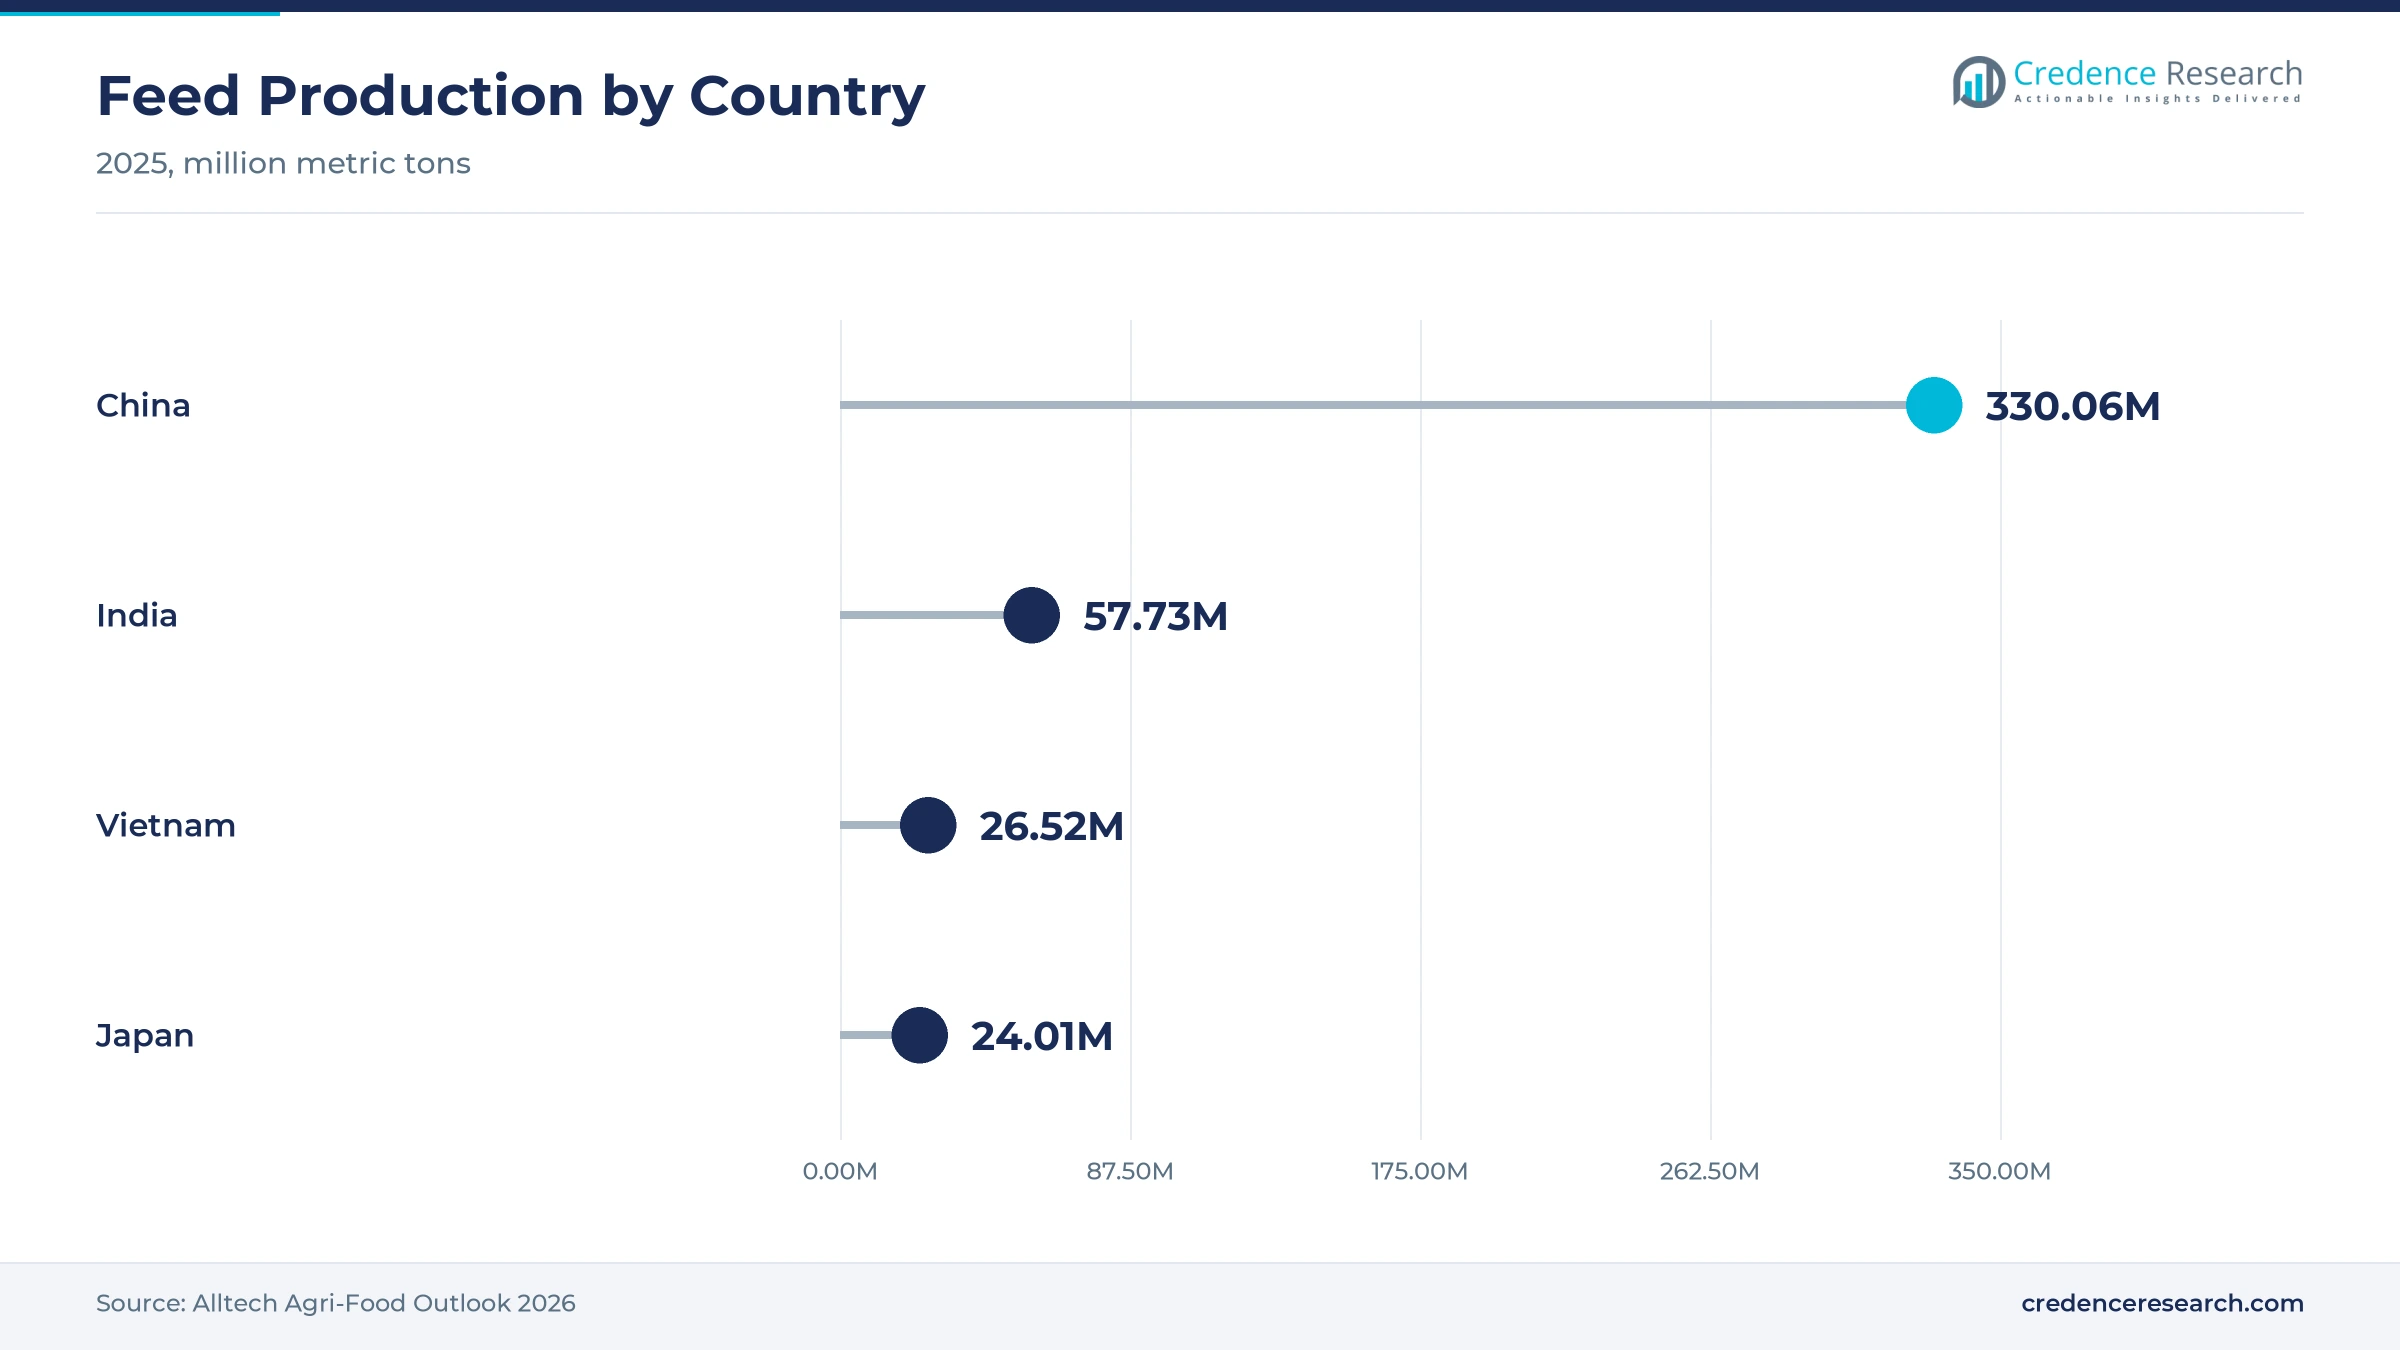
- China held a 50.2% share of 2025 value, because it produced 330.063 million metric tons of feed in 2025, the most of any country.
- Vitamin and mineral premixes led with a 46.0% share of 2025 value, because every commercial poultry and swine ration needs them.
- Asia contributed 91.4% of world aquaculture production in 2022, which makes fish and shrimp nutrition a major source of new premix demand.
- Royal De Heus agreed on Oct. 1, 2025, to acquire CJ Feed & Care operations with 17 feed mills across five Asian countries.
Vitamin and mineral blends lead while functional lines rise
Why do vitamin and mineral blends lead product demand?
Based on product type, the market is categorized into vitamin and mineral premixes, amino acid premixes, functional premixes and complete premixes and concentrates. Vitamin and Mineral Premixes led with a 46.0% share of 2025 value, because every commercial poultry and swine ration needs them. Functional Premixes grow fastest at 5.60% a year, as producers add gut health and immunity ingredients after cutting antibiotics.
How do poultry and aquaculture split species demand?
Based on application, the market is categorized into poultry, swine, aquaculture and ruminants and other livestock. Poultry led with a 42.0% share of 2025 value, because broiler and layer production is the largest user of compound feed in the region. Aquaculture grows fastest at 5.84% a year, as fish and shrimp farms in China, India and Southeast Asia move to formulated diets.
Why do independent feed mills lead customer demand?
Based on customer type, the market is categorized into independent feed manufacturers, integrated livestock producers, commercial farms and cooperative feed buyers. Independent Feed Manufacturers led with a 44.0% share of 2025 value, because most compound feed is still made by commercial mills. Integrated Livestock Producers grow fastest at 5.06% a year, as large pig and poultry groups blend more of their own rations.
How do technical sales and distributors reach buyers?
Based on sales channel, the market is categorized into direct technical sales, specialist distributors and dealers and cooperative outlets. Direct Technical Sales led with 55.0% of 2025 value, because large mills buy custom formulas with nutritionist support. Specialist Distributors grow fastest at 5.03% a year, as smaller mills and farms in India and Southeast Asia buy through regional partners.
| Segment Group | Leading Sub-segment | Share, 2025 | Fastest-growing Sub-segment | CAGR, 2026–2035 |
|---|---|---|---|---|
| By Product Type | Vitamin and Mineral Premixes | 46.0% | Functional Premixes | 5.60% |
| By Application | Poultry | 42.0% | Aquaculture | 5.84% |
| By Customer Type | Independent Feed Manufacturers | 44.0% | Integrated Livestock Producers | 5.06% |
| By Sales Channel | Direct Technical Sales | 55.0% | Specialist Distributors | 5.03% |
Request a Free Sample
Fill in your details and we'll send you a free sample report.
- Sample data tables & charts
- Research methodology
Dairy, aquaculture and local blending lift demand
How does dairy productivity and commercial nutrition lift demand?
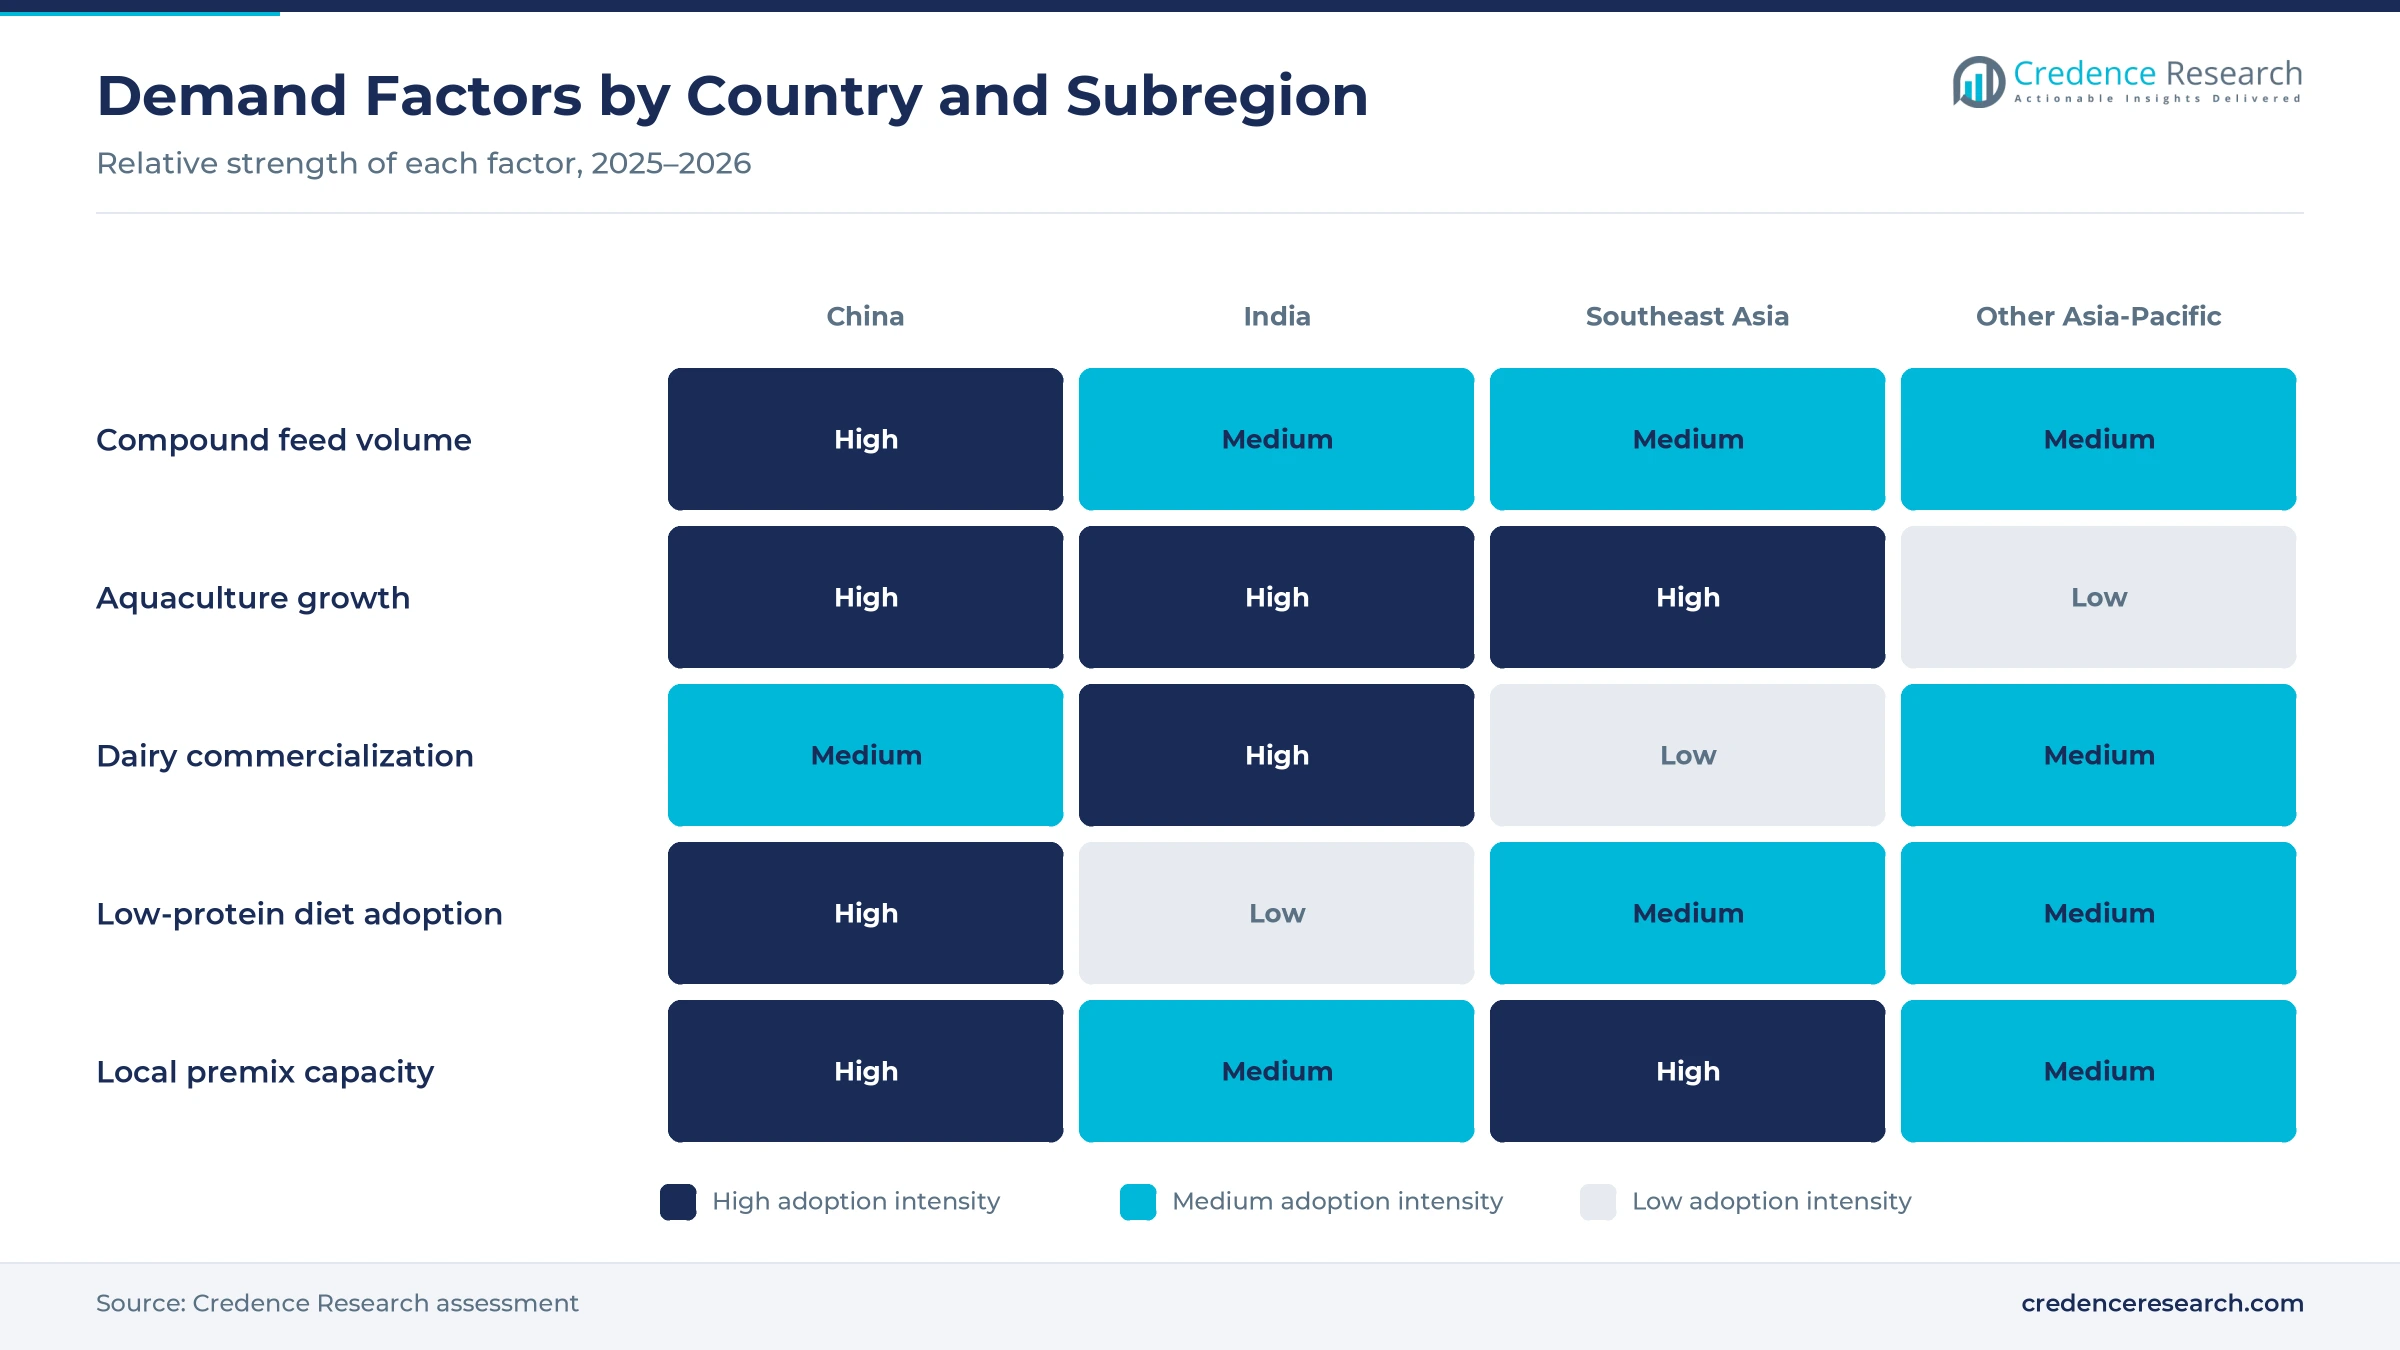
Dairy productivity and commercial nutrition lift demand, because farms that move from grazing and home-mixed rations to balanced diets need vitamin and mineral premixes. India produced over 247 million metric tons of milk in 2024-25, up from 146 million in 2014-15, according to All India Radio. That rise of over 69.4% across the decade equals a compound growth rate of around 6% a year. World dairy feed output also reached 170.294 million metric tons in 2025, up 2.6% from 2024. As a result, ruminants and other livestock gain share across the region, as dairy cooperatives and commercial farms buy mineral mixtures and complete concentrates.
Why does aquaculture nutrition specialization raise value?
Aquaculture nutrition specialization raises value, because fish and shrimp diets need precise vitamin, mineral and amino acid levels that farms cannot mix on site. Farmed aquatic animals reached 94.4 million metric tons in 2022, and aquaculture overtook capture fisheries for the first time with a 51% share, according to the Food and Agriculture Organization. Asia contributed 91.4% of total aquaculture production in that same year. World aquafeed output then rose 4.7% to 55.470 million metric tons in 2025. In turn, aquaculture grows at 5.84% a year, the fastest application rate, as farms buy premixes alongside aquaculture additives for shrimp and fish diets.
How do localization and formulation services win business?
Localization and formulation services win business, because feed mills want premixes made close to them and adjusted to local raw materials. Cargill inaugurated a USD 28 million Provimi premix plant in Dong Nai, Vietnam, in September 2023, with capacity of 40,000 metric tons a year, double the plant it replaced. De Heus opened its first Asian premix factory in Dong Nai in November 2022 with capacity of 60,000 metric tons. Trouw Nutrition also opened a premix plant in Telangana, India, in December 2020 with capacity of 20,000 metric tons a year. As a result, direct technical sales keep 55.0% of 2025 value, as nutritionists tailor formulas for each mill.
Why do soybean meal reduction goals favor amino acid blends?
Soybean meal reduction goals favor amino acid blends, because low-protein diets need added lysine, methionine and other amino acids to keep growth on target. China aimed to cut soybean meal to below 13% of feed by 2025, from 14.5% in 2022, and to about 10% by 2030, according to Qatar Tribune. The ratio stayed at 13.4% in 2025, which shows how much reformulation remains. Muyuan Foods has already cut its soybean meal share to 7.3% using synthetic amino acids. In turn, amino acid premixes gain share across the region, as mills buy commercial amino acids in pre-blended form for low-protein pig and poultry rations.
Ownership changes and lower soymeal diets reshape supply
How is the shift in global nutrition ownership changing supply?
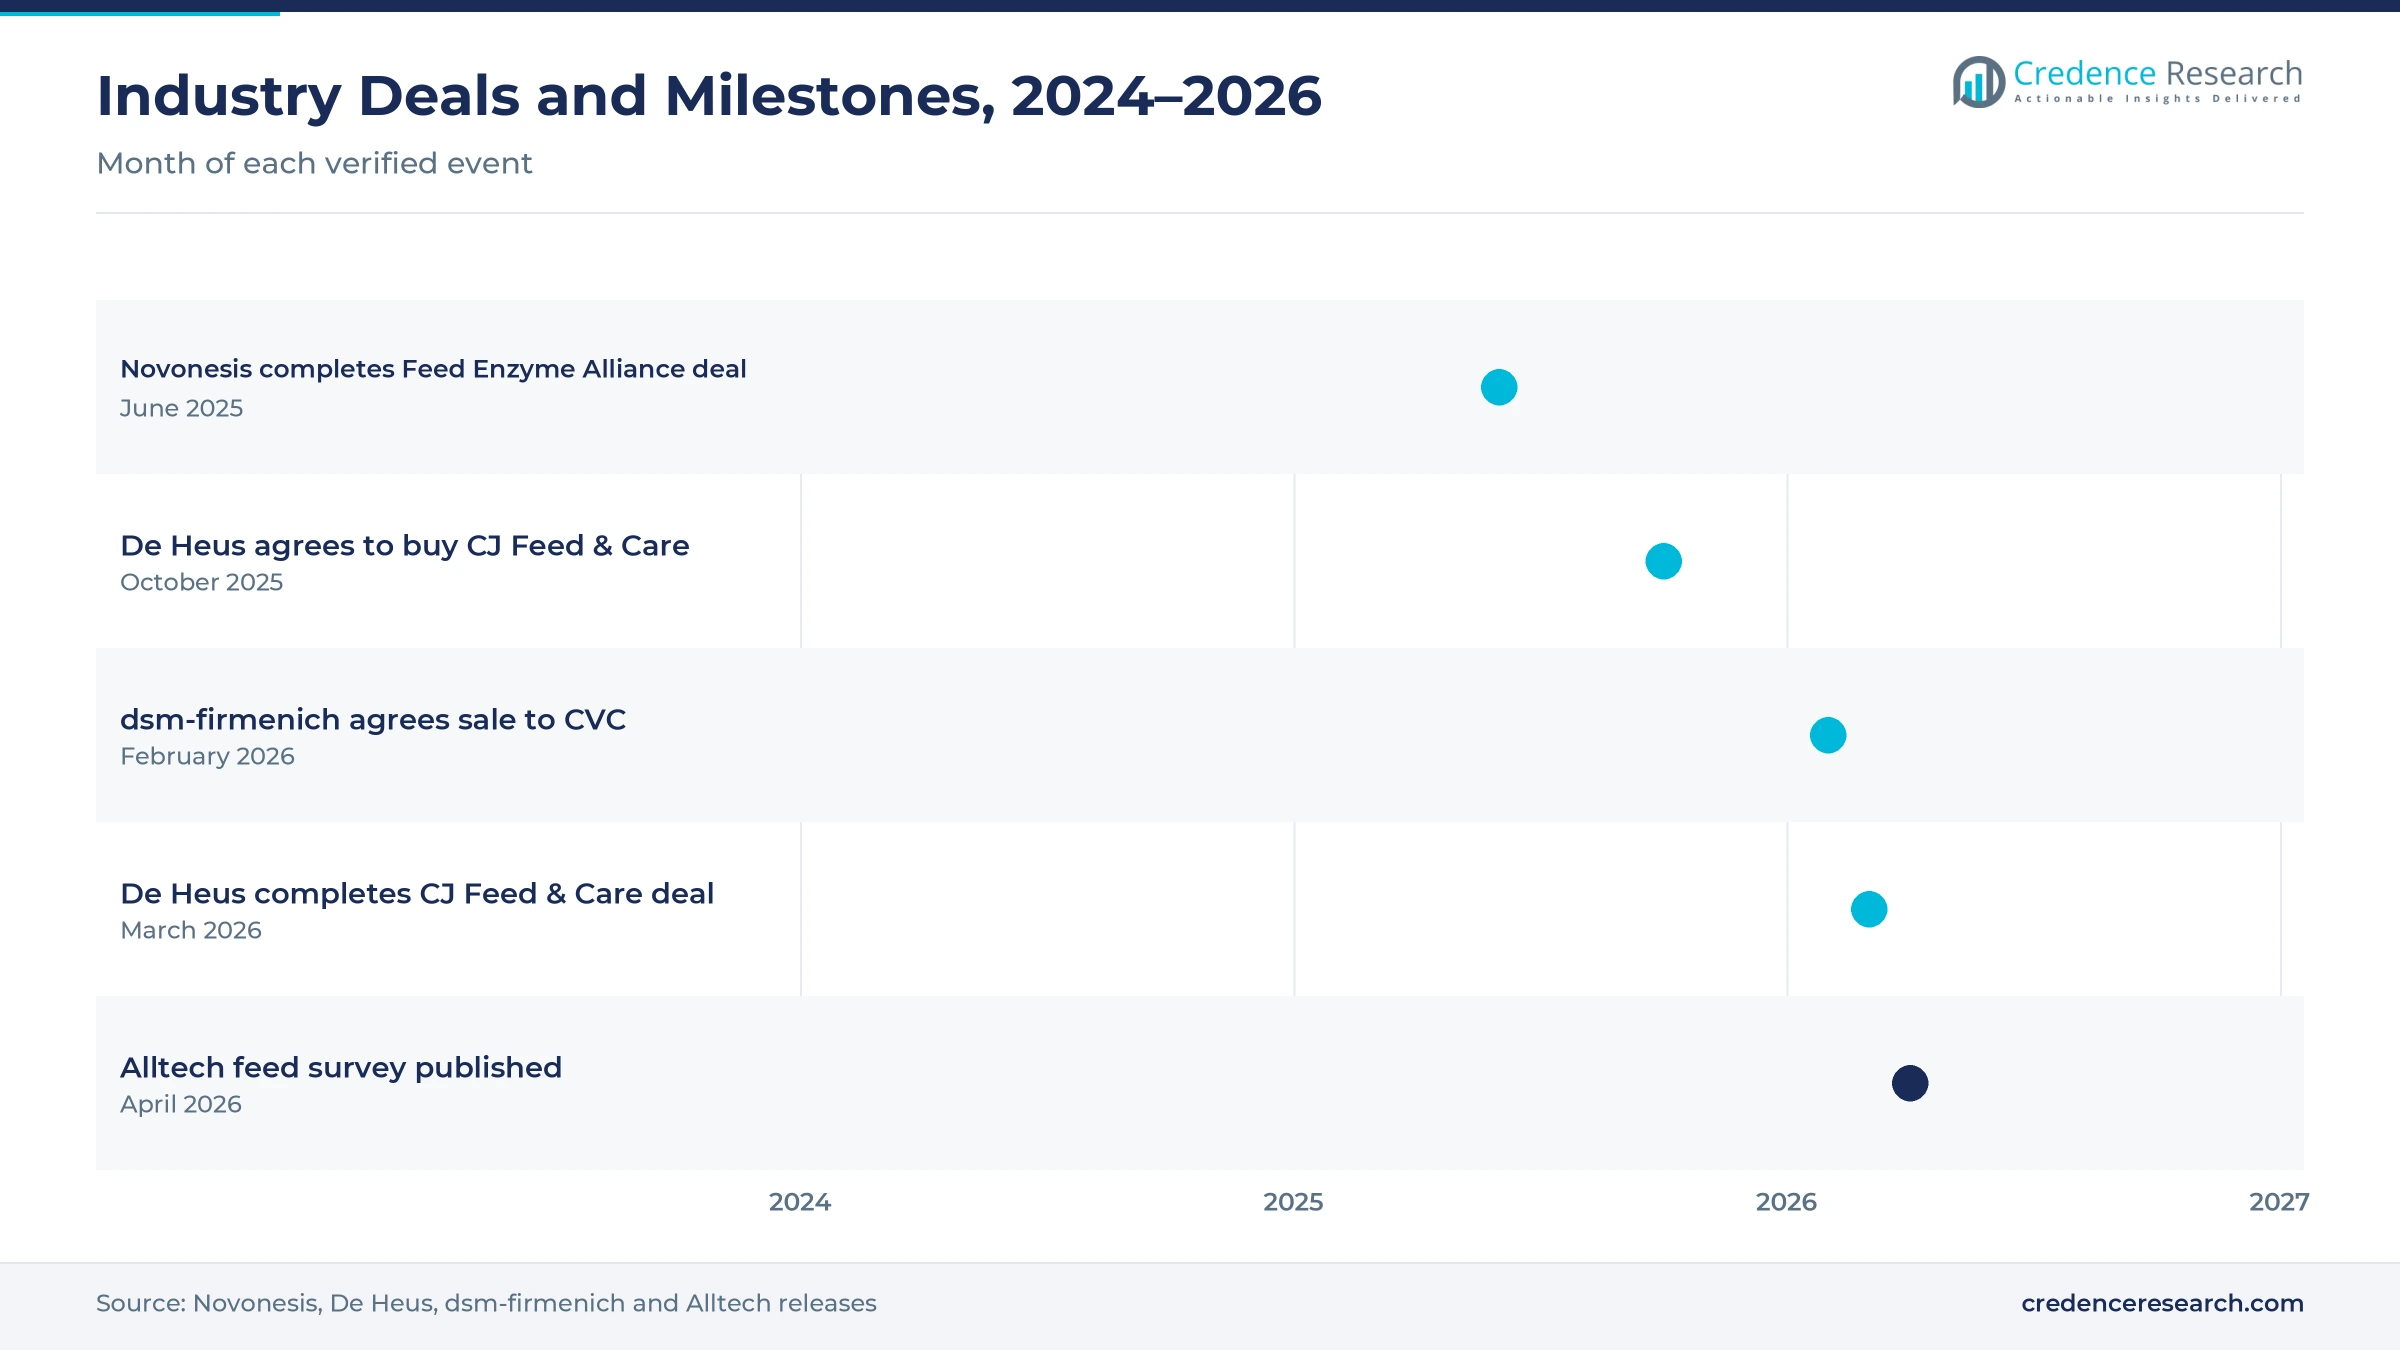
The shift in global nutrition ownership is changing supply, because two of the largest premix businesses are changing hands. Novonesis completed its acquisition of the dsm-firmenich share of the Feed Enzyme Alliance on June 2, 2025, after it received regulatory approvals. Then, on Feb. 9, 2026, dsm-firmenich announced an agreement to sell its whole animal nutrition and health business, including premix, to CVC Capital Partners. The business will split into two standalone companies, and dsm-firmenich will keep a 20% stake in each, with closing expected at the end of 2026. As a result, buyers in China, India and Southeast Asia may see new pricing and service strategies from these suppliers.
Why is the rise of regional consolidation in Southeast Asia notable?
The rise of regional consolidation in Southeast Asia is notable, because larger feed groups gain buying power and in-house premix capacity. Royal De Heus signed an agreement on Oct. 1, 2025, to acquire 100% of CJ Feed & Care operations in Vietnam, Indonesia, South Korea, Cambodia and the Philippines. The deal includes 17 feed mills and numerous livestock operations, and De Heus listed it as completed on March 3, 2026. Vietnam alone produced 26.524 million metric tons of feed in 2025, up 2.6%. In turn, Southeast Asia grows at 5.67% a year, as integrated feed groups expand across the region.
Can functional premixes open a new revenue path?
Functional premixes open a revenue path, because producers want gut health, immunity and stress support in the same blend as vitamins and minerals. Functional premixes grow at 5.60% a year, the fastest product rate, as mills replace antibiotic growth promoters. Asia produced 559.297 million metric tons of feed in 2025, according to Alltech survey data, and China alone produced 330.063 million metric tons, up 4.8%. World pig feed output also rose 3.0% to 380.907 million metric tons. As a result, suppliers that pair functional ingredients with formulation advice can sell more value into compound rations across the region.
Is there room to grow specialist distribution in India?
Specialist distribution in India has room to grow, because thousands of small mills and farms need premixes but cannot buy directly from global suppliers. India produced 57.729 million metric tons of feed in 2025, up 4.5% from 2024. Trouw Nutrition expected its 20,000 metric ton plant in Telangana to reach full use by 2025, serving poultry, dairy, aqua and pet markets in South Asia. Zagro also renamed its Chennai-based business ZAGRO India, which makes organic and inorganic mineral premixes. In turn, specialist distributors grow at 5.03% a year, the fastest channel rate, as regional partners carry technical support to rural buyers.
Ingredient costs, disease and price pressure test suppliers
How do volatile ingredient costs squeeze blender margins?
Volatile ingredient costs squeeze blender margins, because vitamins, trace minerals and amino acids are traded worldwide and their prices can swing sharply. Supply outages at a few large producers can lift prices for methionine, lysine and key vitamins within weeks. As a result, premix makers struggle to hold contract prices with feed mills. Many respond with dual sourcing, larger safety stocks and price review clauses in supply contracts.
Why do animal disease outbreaks disrupt premix demand?
Animal disease outbreaks disrupt premix demand, because outbreaks in pig and poultry herds can cut feed volumes quickly. Producers that lose animals reduce feed orders, which leaves premix plants with spare capacity. In turn, suppliers face uneven demand across countries and seasons. Many respond by spreading sales across species and markets and by offering immunity and biosecurity support to help farms recover output faster.
How does price pressure from local blenders limit premium sales?
Price pressure from local blenders limits premium sales, because many small mills choose basic vitamin and mineral mixes on price alone. Local blenders in China, India and Southeast Asia often sell simple formulas with little technical service. As a result, global suppliers find it harder to win small accounts with premium blends. Many respond with tiered product ranges, regional plants and distributor partnerships that lower delivered costs.
Why do differing feed rules slow regional expansion?
Differing feed rules slow regional expansion, because each country sets its own registration, labeling and additive approval requirements. Suppliers must register formulas separately in China, India and each Southeast Asian market, which adds time and cost before launch. In turn, new products reach some countries years after others. Suppliers respond with local regulatory teams and formulas built from ingredients already approved in several markets.
Chinese feed scale leads as Indian dairy lifts growth
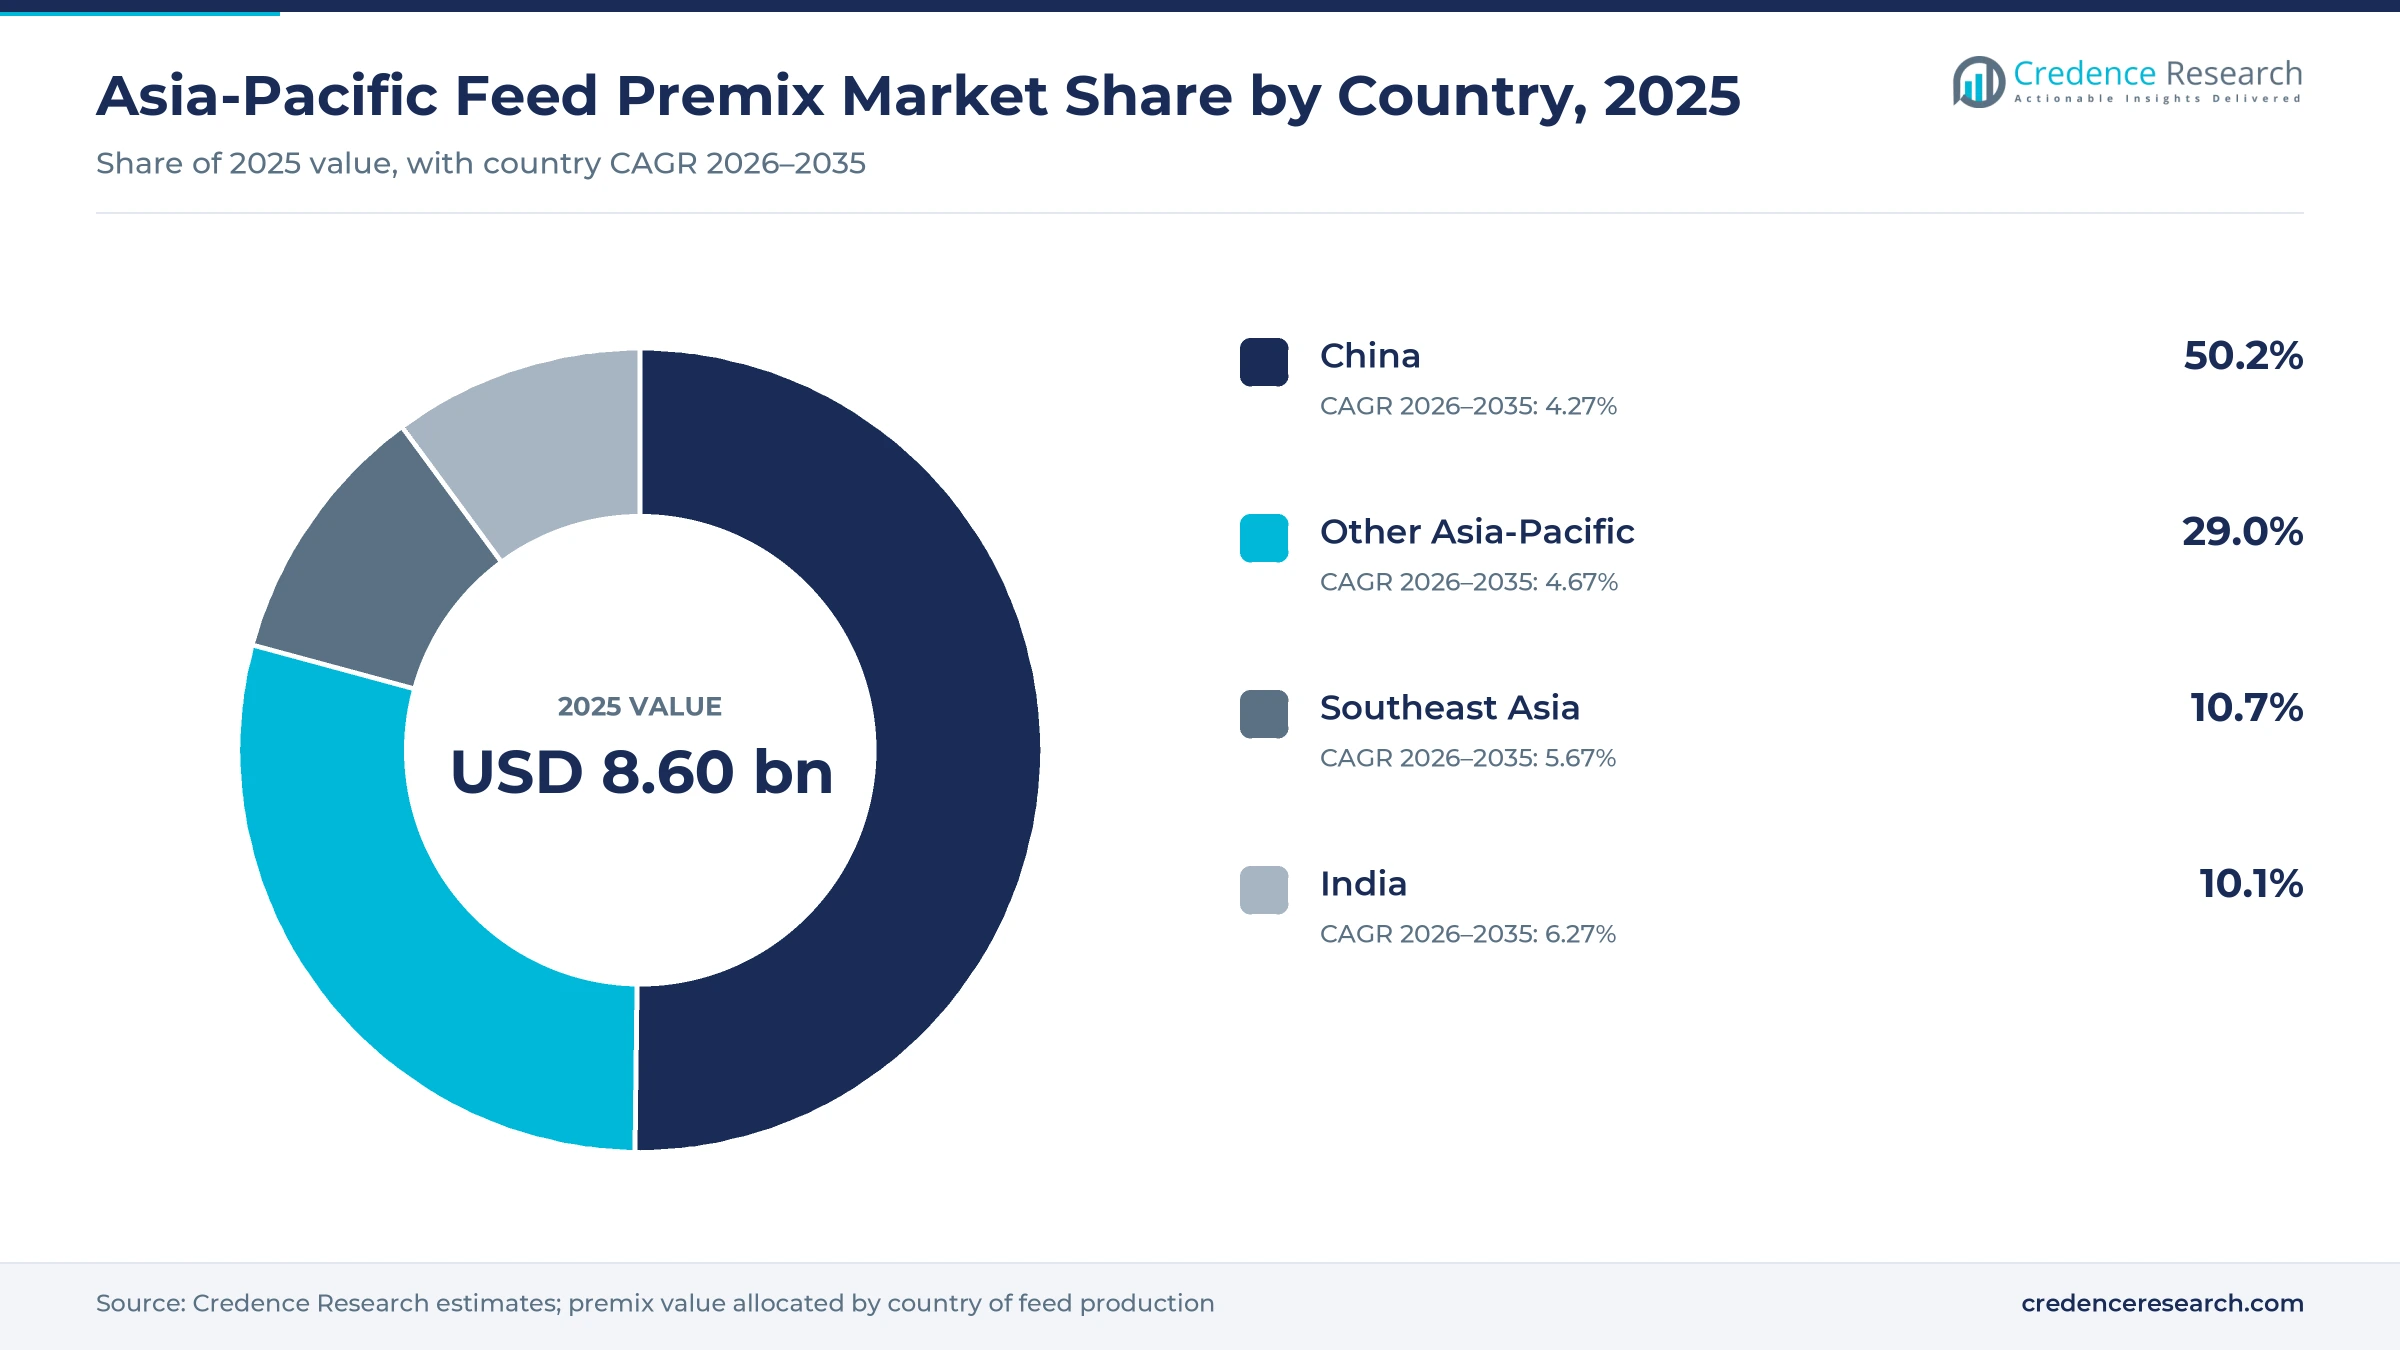
| Country | Value, 2025 (USD billion) | Share, 2025 | CAGR, 2026–2035 |
|---|---|---|---|
| China | 4.32 | 50.2% | 4.27% |
| Other Asia-Pacific | 2.50 | 29.0% | 4.67% |
| Southeast Asia | 0.92 | 10.7% | 5.67% |
| India | 0.87 | 10.1% | 6.27% |
Why does Chinese compound feed scale keep the top share?
China held a 50.2% share of 2025 value and grows at 4.27% a year, because it is the largest feed producer in the world. The country made 330.063 million metric tons of feed in 2025, up 4.8% from 2024. However, growth is slower than in India and Southeast Asia, because the pig sector is mature and policy is pushing mills to lower protein levels in rations rather than raise volumes.
Why is India the fastest-growing country?
India held a 10.1% share of 2025 value and grows fastest at 6.27% a year, because dairy and poultry farms are moving quickly to commercial rations. The country produced 57.729 million metric tons of feed in 2025 and over 247 million metric tons of milk in 2024-25. Global suppliers and local blenders are also adding plants in Telangana and Tamil Nadu, which brings premix production closer to buyers.
How does Southeast Asia support premix demand?
Southeast Asia held a 10.7% share of 2025 value and grows at 5.67% a year, because Vietnam, Indonesia and the Philippines have large poultry, pig and shrimp sectors. Vietnam produced 26.524 million metric tons of feed in 2025. Cargill, De Heus and Nutreco all run premix plants in Vietnam or Indonesia, which shortens delivery times for feed mills and lets nutritionists adjust formulas to local corn, cassava and fish meal supplies.
What drives demand in the rest of Asia-Pacific?
The rest of Asia-Pacific held a 29.0% share of 2025 value and grows at 4.67% a year, because Japan, South Korea, Thailand and Oceania have mature feed industries. Japan produced 24.006 million metric tons of feed in 2025, down 1.3%, while Oceania rose 3.4% to 11.104 million metric tons.
Deals and plant milestones from 2024 to 2026
| Development | Status and market relevance |
|---|---|
| In June 2025, Novonesis completed its acquisition of the dsm-firmenich share of the Feed Enzyme Alliance. | Closed after all regulatory approvals were received |
| In October 2025, Royal De Heus agreed to acquire CJ Feed & Care operations in five Asian countries. | Covers 17 feed mills and livestock operations |
| In February 2026, dsm-firmenich announced an agreement to sell its animal nutrition and health business to CVC. | Includes the premix business; closing expected at the end of 2026 |
| In March 2026, De Heus listed its acquisition of CJ Feed & Care as completed. | Added South Korea and the Philippines to its markets |
| In April 2026, Alltech published its survey showing Asia feed output of 559.297 million metric tons in 2025. | Confirmed rising feed volumes in China, India and Vietnam |
Protected and liquid formulations widen nutrient delivery
- Conventional dry blending mixes vitamins, minerals and carriers into a uniform powder, which suits most commercial feed mills and remains the largest format.
- Protected nutrient formulation coats vitamins, amino acids and enzymes so they survive pelleting heat and reach the animal gut, which suits aquaculture and high-value diets.
- Liquid formulation delivers nutrients through drinking water or post-pellet spraying, which suits farms that need fast dosing during stress or disease.
Need a Custom Version of This Report?
Tailor the scope, geography, or segments to your exact requirements.
- Custom geography or segment scope
- Direct access to our analyst team
Global nutrition groups and regional blenders compete
Competition is split between global nutrition groups that run premix plants across the region and regional blenders that sell simpler formulas at lower prices. Cargill runs a Provimi premix plant in Dong Nai, Vietnam, that opened in September 2023. De Heus runs a premix factory in Vietnam and expanded across Southeast Asia and South Korea through its CJ Feed & Care acquisition. Nutreco, through Trouw Nutrition, runs premix plants in India, Indonesia and China. The dsm-firmenich premix business is being sold to CVC Capital Partners, while Zagro makes mineral premixes in Chennai. ADM (Wisium), AB Agri (Pumeixin), Vilofoss, Alltech and Avitech Nutrition also compete for business. Rivals compete on formulation skill, local plants, ingredient sourcing, technical service and price. Because feed rules and raw materials differ by country, suppliers with local plants and nutritionists win more mill accounts, while distributors carry premixes to smaller farms.
Companies profiled and their roles in this market
| Company | Type | Role in the market |
|---|---|---|
| Cargill (Provimi) | Global nutrition group | Runs a 40,000 metric ton premix plant in Dong Nai, Vietnam |
| De Heus | Global feed group | Premix factory in Vietnam and CJ Feed & Care mills across Asia |
| Nutreco (Trouw Nutrition) | Global nutrition group | Premix plants in Telangana, East Java and Hunan |
| dsm-firmenich Animal Nutrition & Health | Global nutrition group | Premix business being sold to CVC Capital Partners |
| Zagro | Regional animal health and nutrition group | Makes mineral premixes at its Chennai plant in India |
Credence Research view on regional nutrient blending
Credence Research's view is that Asia-Pacific demand for premixes will grow steadily because commercial livestock and fish farming keep expanding across the region. Vitamin and mineral blends remain the core of the market, while amino acid and functional premixes add faster growth as producers cut soybean meal and antibiotics. India and Southeast Asia will add most new volume, while China shifts toward higher-value formulas. Suppliers that combine local plants, nutritionist support and reliable ingredient sourcing should gain share fastest.
How the regional nutrient blend estimate was built
The report uses 2025 as the base year on a calendar basis, and market values come from the Credence Research model. That model combines feed production survey data, FAO aquaculture statistics, national dairy output data, feed policy targets and company announcements on premix plants and acquisitions. Segment splits and country growth rates are Credence Research estimates, while country shares follow the client-defined split. Sources used are public reports, official statistics, trade press and company releases, and no interviews or surveys were used.
Aquaculture and dairy carry blend growth to 2035
Premix value is expected to reach USD 13.73 billion by 2035, a 4.75% CAGR during 2026–2035, as aquaculture, dairy and commercial poultry lift demand for balanced rations. Growth should stay steady through 2030 while India and Southeast Asia expand feed output. After that, low-protein diets, functional ingredients and protected nutrients will carry more growth. Stable ingredient prices would support margins, while disease outbreaks would slow volumes. Suppliers with local plants and strong technical service are expected to gain the most.
Frequently Asked Questions
How big is the Asia-Pacific feed premix market?
Which product type leads Asia-Pacific premix demand?
Which country leads the Asia-Pacific feed premix market?
How large is aquaculture in Asia?
How does China's soybean meal policy affect premix demand?
Which application is growing fastest?
Who are the leading companies in Asia-Pacific premixes?
What are the main challenges for suppliers?
Table of Content
Chapter 1 Market Segmentation
- 1.1 Segmentation Framework
- 1.1.1 Product and Service Classification
- 1.1.2 Application and End-Use Classification
- 1.1.3 Technology and Solution Classification
- 1.1.4 Customer and Distribution Channel Classification
- 1.1.5 Geographic Segmentation
- 1.1.6 Market Segment Definitions and Boundaries
- 1.2 By Product Type
- 1.2.1 Vitamin and Mineral Premixes
- 1.2.2 Amino Acid Premixes
- 1.2.3 Functional Premixes
- 1.2.4 Complete Premixes and Concentrates
- 1.3 By Application
- 1.3.1 Poultry
- 1.3.2 Swine
- 1.3.3 Aquaculture
- 1.3.4 Ruminants and Other Livestock
- 1.4 By Customer Type
- 1.4.1 Independent Feed Manufacturers
- 1.4.2 Integrated Livestock Producers
- 1.4.3 Commercial Farms
- 1.4.4 Cooperative Feed Buyers
- 1.5 By Sales Channel
- 1.5.1 Direct Technical Sales
- 1.5.2 Specialist Distributors
- 1.5.3 Dealers and Cooperative Outlets
- 1.6 By Country
- 1.6.1 China
- 1.6.2 India
- 1.6.3 Southeast Asia
- 1.6.4 Other Asia-Pacific
Chapter 2 Introduction
- 2.1 Report Objectives and Scope
- 2.2 Product Definition and Industry Terminology
- 2.3 Market Inclusions and Exclusions
- 2.4 Research Process
- 2.4.1 Primary Research and Expert Interviews
- 2.4.2 Secondary Research and Source Review
- 2.4.3 Top-Down and Bottom-Up Estimation
- 2.4.4 Data Triangulation and Verification
- 2.5 Market Size Measurement Basis
- 2.5.1 2025: USD 8.60 billion → 2035: USD 13.73 billion
- 2.6 Historical and Forecast Reference Periods
- 2.6.1 Historical Period: 2018-2025
- 2.6.2 Base Year: 2025
- 2.6.3 Forecast Period: 2025-2035
- 2.7 Research Assumptions and Limitations
Chapter 3 Executive Summary
- 3.1 Market Snapshot and Key Findings
- 3.2 Base-Year Market Size, 2025
- 3.3 Forecast Market Size, 2035
- 3.4 Revenue and Volume Growth Outlook
- 3.5 Key Demand and Supply Indicators
- 3.6 Leading Market Segments
- 3.7 Fastest-Growing Market Opportunities
- 3.8 Regional Performance Highlights
- 3.9 Technology and Industry Transformation
- 3.10 Competitive Landscape Summary
- 3.11 Analyst View and Strategic Implications
Chapter 4 Asia-Pacific Feed Premix Market Trends and Developments
- 4.1 Historical Industry Development, 2018-2025
- 4.2 Recent Market Trends and Developments
- 4.3 Demand and Customer Behavior Trends
- 4.4 Technology and Product Innovation
- 4.5 Artificial Intelligence, Automation and Digitalization
- 4.6 Local Manufacturing and Supply Chain Realignment
- 4.7 Industry Partnerships, Mergers and Acquisitions
- 4.8 Sustainability and Circular Economy Developments
- 4.9 Government and Private Sector Investment Trends
- 4.10 Emerging Business Models and Commercialization
- 4.11 Industry Developments and Announcements
Chapter 5 Asia-Pacific Feed Premix Market Production, Supply and Demand Analysis
- 5.1 Demand Trend and Consumption Analysis, 2018-2025
- 5.2 Demand Forecast, 2025-2035
- 5.3 Production and Output Trend, 2018-2025
- 5.4 Production and Output Forecast, 2025-2035
- 5.5 Installed Capacity and Capacity Utilization
- 5.6 Company-Wise Production Plants and Statistics
- 5.6.1 Installed Production Capacity
- 5.6.2 Actual Production
- 5.6.3 Planned Capacity and Expansion Targets
- 5.7 Supply Chain Structure and Procurement Trends
- 5.8 Supply-Demand Gap and Bottlenecks
- 5.9 Import Dependence and Sourcing Structure
- 5.10 Contract Manufacturing and Outsourcing
- 5.11 Regional Supply and Demand Concentration
Chapter 6 Asia-Pacific Feed Premix Market Pricing Analysis
- 6.1 Pricing Structure and Measurement
- 6.2 Historical Pricing Trends, 2018-2025
- 6.3 Pricing Outlook, 2025-2035
- 6.4 Average Selling Price and Unit Economics
- 6.5 Pricing by Product and Market Segment
- 6.6 Geographic Pricing Differences
- 6.7 Key Input, Energy, Labor and Logistics Costs
- 6.8 Contract Pricing and Purchasing Models
- 6.9 Pricing Sensitivity and Competitive Positioning
- 6.10 Price, Margin and Profitability Implications
Chapter 7 Asia-Pacific Feed Premix Market Dynamics
- 7.1 Market Growth Drivers
- 7.1.1 Demand-Side Drivers
- 7.1.2 Technology and Innovation Drivers
- 7.1.3 Infrastructure and Investment Drivers
- 7.1.4 Regulatory and Policy Drivers
- 7.2 Market Restraints
- 7.2.1 Cost and Affordability Constraints
- 7.2.2 Technology and Adoption Barriers
- 7.2.3 Supply Chain and Operational Constraints
- 7.3 Market Challenges
- 7.3.1 Competitive Pressure and Margin Erosion
- 7.3.2 Skills, Infrastructure and Implementation Gaps
- 7.4 Emerging Market Opportunities
- 7.5 Market Dynamics Impact and Time-Horizon Assessment
Chapter 8 Asia-Pacific Feed Premix Value Chain Analysis
- 8.1 Industry Value Chain Overview
- 8.2 Upstream Suppliers and Critical Inputs
- 8.3 Technology and Component Providers
- 8.4 Manufacturing or Service Delivery
- 8.5 Distribution, Channel Partners and Integrators
- 8.6 Downstream Applications and End Users
- 8.7 Value Addition and Profit Pools
- 8.8 Vertical Integration and Outsourcing
- 8.9 Supplier Concentration and Risk
- 8.10 Supply Chain Localization and Resilience
Chapter 9 Asia-Pacific Feed Premix Market Regulations and Policies
- 9.1 Relevant Laws, Standards and Compliance Frameworks
- 9.2 Product, Service, Safety and Quality Requirements
- 9.3 Government Policies, Incentives and Subsidies
- 9.4 Imports, Exports and Trade Barriers
- 9.5 Public Procurement and Local Content Requirements
- 9.6 Environmental and Sustainability Compliance
- 9.7 Upcoming Policy Changes and Market Implications
Chapter 10 Asia-Pacific Feed Premix Market Hotspots and Opportunities
- 10.1 Market Opportunity Mapping and Growth Hotspots
- 10.2 High-Growth Applications and Customer Groups
- 10.3 Underserved Markets and White-Space Opportunities
- 10.4 Emerging Technology and Product Opportunities
- 10.5 New Capacity and Investment Hotspots
- 10.6 Market Entry and Expansion Opportunities
- 10.7 Distribution and Partnership Opportunities
- 10.8 Near-Term and Long-Term Commercial Potential
- 10.9 Opportunity Attractiveness and Execution Risks
Chapter 11 Asia-Pacific Feed Premix Market Outlook, 2025-2035
- 11.1 Market Size and Analysis
- 11.1.1 Revenue (Market Measurement: 2025: USD 8.60 billion → 2035: USD 13.73 billion)
- 11.1.2 Market Volume and Quantity Sold
- 11.1.3 Historical Market Size, 2018-2025
- 11.1.4 Base-Year Market Size, 2025
- 11.2 Market Forecast, 2025-2035
- 11.2.1 Revenue Forecast to 2035
- 11.2.2 Volume Forecast to 2035
- 11.2.3 CAGR and Year-on-Year Growth
- 11.2.4 Incremental Revenue Opportunity
- 11.3 Forecast Assumptions and Scenario Analysis
- 11.3.1 Base-Case Forecast
- 11.3.2 Optimistic and Conservative Scenarios
- 11.3.3 Technology, Pricing and Policy Sensitivities
- 11.4 Market Attractiveness and Growth Outlook
Chapter 12 Asia-Pacific Feed Premix Market Segmentation and Outlook
- 12.1 Segmentation Summary and Market Shares, 2025
- 12.2 Largest and Fastest-Growing Segments
- 12.3 By Product Type - Market Size and Forecast, 2025-2035
- 12.3.1 Segment Definition and Scope
- 12.3.2 Historical Market Size, 2018-2025
- 12.3.3 Revenue Forecast, 2025-2035
- 12.3.4 Volume Forecast, 2025-2035
- 12.3.5 Base-Year Market Share, 2025
- 12.3.6 Segment CAGR and Growth Drivers
- 12.3.7 Subsegment Market Size and Forecast
- 12.3.7.1 Vitamin and Mineral Premixes
- 12.3.7.2 Amino Acid Premixes
- 12.3.7.3 Functional Premixes
- 12.3.7.4 Complete Premixes and Concentrates
- 12.3.8 Subsegment Pricing and Adoption Trends
- 12.3.9 Leading Suppliers and Competition
- 12.3.10 Regional Demand and Opportunities
- 12.4 By Application - Market Size and Forecast, 2025-2035
- 12.4.1 Segment Definition and Scope
- 12.4.2 Historical Market Size, 2018-2025
- 12.4.3 Revenue Forecast, 2025-2035
- 12.4.4 Volume Forecast, 2025-2035
- 12.4.5 Base-Year Market Share, 2025
- 12.4.6 Segment CAGR and Growth Drivers
- 12.4.7 Subsegment Market Size and Forecast
- 12.4.7.1 Poultry
- 12.4.7.2 Swine
- 12.4.7.3 Aquaculture
- 12.4.7.4 Ruminants and Other Livestock
- 12.4.8 Subsegment Pricing and Adoption Trends
- 12.4.9 Leading Suppliers and Competition
- 12.4.10 Regional Demand and Opportunities
- 12.5 By Customer Type - Market Size and Forecast, 2025-2035
- 12.5.1 Segment Definition and Scope
- 12.5.2 Historical Market Size, 2018-2025
- 12.5.3 Revenue Forecast, 2025-2035
- 12.5.4 Volume Forecast, 2025-2035
- 12.5.5 Base-Year Market Share, 2025
- 12.5.6 Segment CAGR and Growth Drivers
- 12.5.7 Subsegment Market Size and Forecast
- 12.5.7.1 Independent Feed Manufacturers
- 12.5.7.2 Integrated Livestock Producers
- 12.5.7.3 Commercial Farms
- 12.5.7.4 Cooperative Feed Buyers
- 12.5.8 Subsegment Pricing and Adoption Trends
- 12.5.9 Leading Suppliers and Competition
- 12.5.10 Regional Demand and Opportunities
- 12.6 By Sales Channel - Market Size and Forecast, 2025-2035
- 12.6.1 Segment Definition and Scope
- 12.6.2 Historical Market Size, 2018-2025
- 12.6.3 Revenue Forecast, 2025-2035
- 12.6.4 Volume Forecast, 2025-2035
- 12.6.5 Base-Year Market Share, 2025
- 12.6.6 Segment CAGR and Growth Drivers
- 12.6.7 Subsegment Market Size and Forecast
- 12.6.7.1 Direct Technical Sales
- 12.6.7.2 Specialist Distributors
- 12.6.7.3 Dealers and Cooperative Outlets
- 12.6.8 Subsegment Pricing and Adoption Trends
- 12.6.9 Leading Suppliers and Competition
- 12.6.10 Regional Demand and Opportunities
- 12.7 By Country - Market Size and Forecast, 2025-2035
- 12.7.1 Segment Definition and Scope
- 12.7.2 Historical Market Size, 2018-2025
- 12.7.3 Revenue Forecast, 2025-2035
- 12.7.4 Volume Forecast, 2025-2035
- 12.7.5 Base-Year Market Share, 2025
- 12.7.6 Segment CAGR and Growth Drivers
- 12.7.7 Subsegment Market Size and Forecast
- 12.7.7.1 China
- 12.7.7.2 India
- 12.7.7.3 Southeast Asia
- 12.7.7.4 Other Asia-Pacific
- 12.7.8 Subsegment Pricing and Adoption Trends
- 12.7.9 Leading Suppliers and Competition
- 12.7.10 Regional Demand and Opportunities
- 12.8 Segment Growth Comparison
- 12.9 Segment Attractiveness and Priority Matrix
Chapter 13 Asia-Pacific Feed Premix End-Use and Application Market Outlook
- 13.1 End-Use Industry and Customer Demand Structure
- 13.2 Leading Applications and Customer Groups
- 13.3 End-Use Market Size, Share and Forecast
- 13.4 Major End-Use Industry Deep Dives
- 13.4.1 Customer Requirements and Use Cases
- 13.4.2 Demand and Replacement Cycles
- 13.4.3 Technical and Regulatory Considerations
- 13.4.4 Purchasing and Procurement Models
- 13.4.5 Leading Vendors and Distribution Channels
- 13.4.6 Forecast and Commercial Opportunities
- 13.5 Emerging Applications and Cross-Segment Demand
- 13.6 End-Use Industry Investment Priorities
Chapter 14 Asia-Pacific Feed Premix Geographic Market Outlook, 2025-2035
- 14.1 Regional Market Size and Country-Level Shares, 2025
- 14.2 Country Market Size Comparison, 2025
- 14.3 Country Market Forecasts, 2025-2035
- 14.4 Subregional Industrial and Demand Clusters
- 14.5 Intra-Regional Pricing and Cost Differences
- 14.6 Cross-Border Trade and Supply Networks
- 14.7 Regional Supply and Demand Balances
- 14.8 Country Opportunity Comparison and Prioritization
Note: Every listed country is covered on the structure shown under the first country.
Chapter 15 Asia-Pacific Feed Premix Technology, Innovation and Sustainability Outlook
- 15.1 Technology Landscape and Maturity
- 15.2 Product, Process and Service Innovation
- 15.3 AI, Automation and Digital Tools in the Industry
- 15.4 Technology Adoption and Performance Benchmarking
- 15.5 Innovation Pipeline and R&D Investment
- 15.6 Patent and Intellectual Property Trends
- 15.7 Energy Efficiency and Resource Management
- 15.8 Sustainability, Recycling and Circularity
- 15.9 Technology Roadmap, 2025-2035
- 15.10 Risks of Obsolescence and Technology Substitution
Chapter 16 Asia-Pacific Feed Premix Market Key Strategic Imperatives
- 16.1 Growth and Market Entry Priorities
- 16.2 High-Return Products and Segments
- 16.3 Pricing, Profitability and Cost Optimization
- 16.4 Technology Investment and Product Differentiation
- 16.5 Supply Chain Localization and Resilience
- 16.6 Distribution and Customer Acquisition
- 16.7 Partnership, Acquisition and Capacity Strategy
- 16.8 Regional Expansion Priorities
- 16.9 Short-, Medium- and Long-Term Actions
Chapter 17 Competition Outlook
- 17.1 Industry Competition Characteristics
- 17.2 Market Structure and Concentration
- 17.3 Market Share and Competitive Positioning, 2025
- 17.4 Company-Wise Revenue and Product Benchmarking
- 17.5 Production and Service Capacity Benchmarking
- 17.6 Technology, Pricing and Differentiation
- 17.7 Regional Footprint and Distribution Strength
- 17.8 Mergers, Acquisitions and Strategic Alliances
- 17.9 New Entrants and Competitive Threats
- 17.10 Porter's Five Forces and Industry Attractiveness
- 17.11 Competitive Outlook, 2025-2035
Chapter 18 Company Profiles
- 18.1 Company Coverage and Selection Criteria
- 18.2 Cargill (Provimi)
- 18.2.1 Business Description
- 18.2.2 Company Ownership and Geographic Presence
- 18.2.3 Product and Service Portfolio
- 18.2.4 Manufacturing and Operating Footprint
- 18.2.5 Production Capacity and Expansion Plans
- 18.2.6 Financial Performance and Investment
- 18.2.7 Market Share and Competitive Position
- 18.2.8 Technology and Innovation Capabilities
- 18.2.9 Strategic Alliances or Partnerships
- 18.2.10 Recent Developments
- 18.2.11 Growth Strategy and Outlook
- 18.3 dsm-firmenich Animal Nutrition & Health
- 18.4 ADM (Wisium)
- 18.5 Nutreco (Trouw Nutrition)
- 18.6 De Heus
- 18.7 Alltech
- 18.8 AB Agri (Pumeixin)
- 18.9 Vilofoss
- 18.10 Zagro
- 18.11 Avitech Nutrition
- 18.12 Other Relevant Market Participants
Note: Every listed company is profiled on the structure shown under the first company. The company list is preliminary and may change based on research findings, market developments, data availability and client requirements.
Chapter 19 Disclaimer
- 19.1 Research and Forecast Disclaimer
- 19.2 Data Source and Estimation Limitations
Note: The depth of individual sections depends on data availability for this market. Volume, capacity, trade and other unit-based metrics are included where applicable.

