
Wi-Fi 7 refresh pulls wireless into recurring contracts
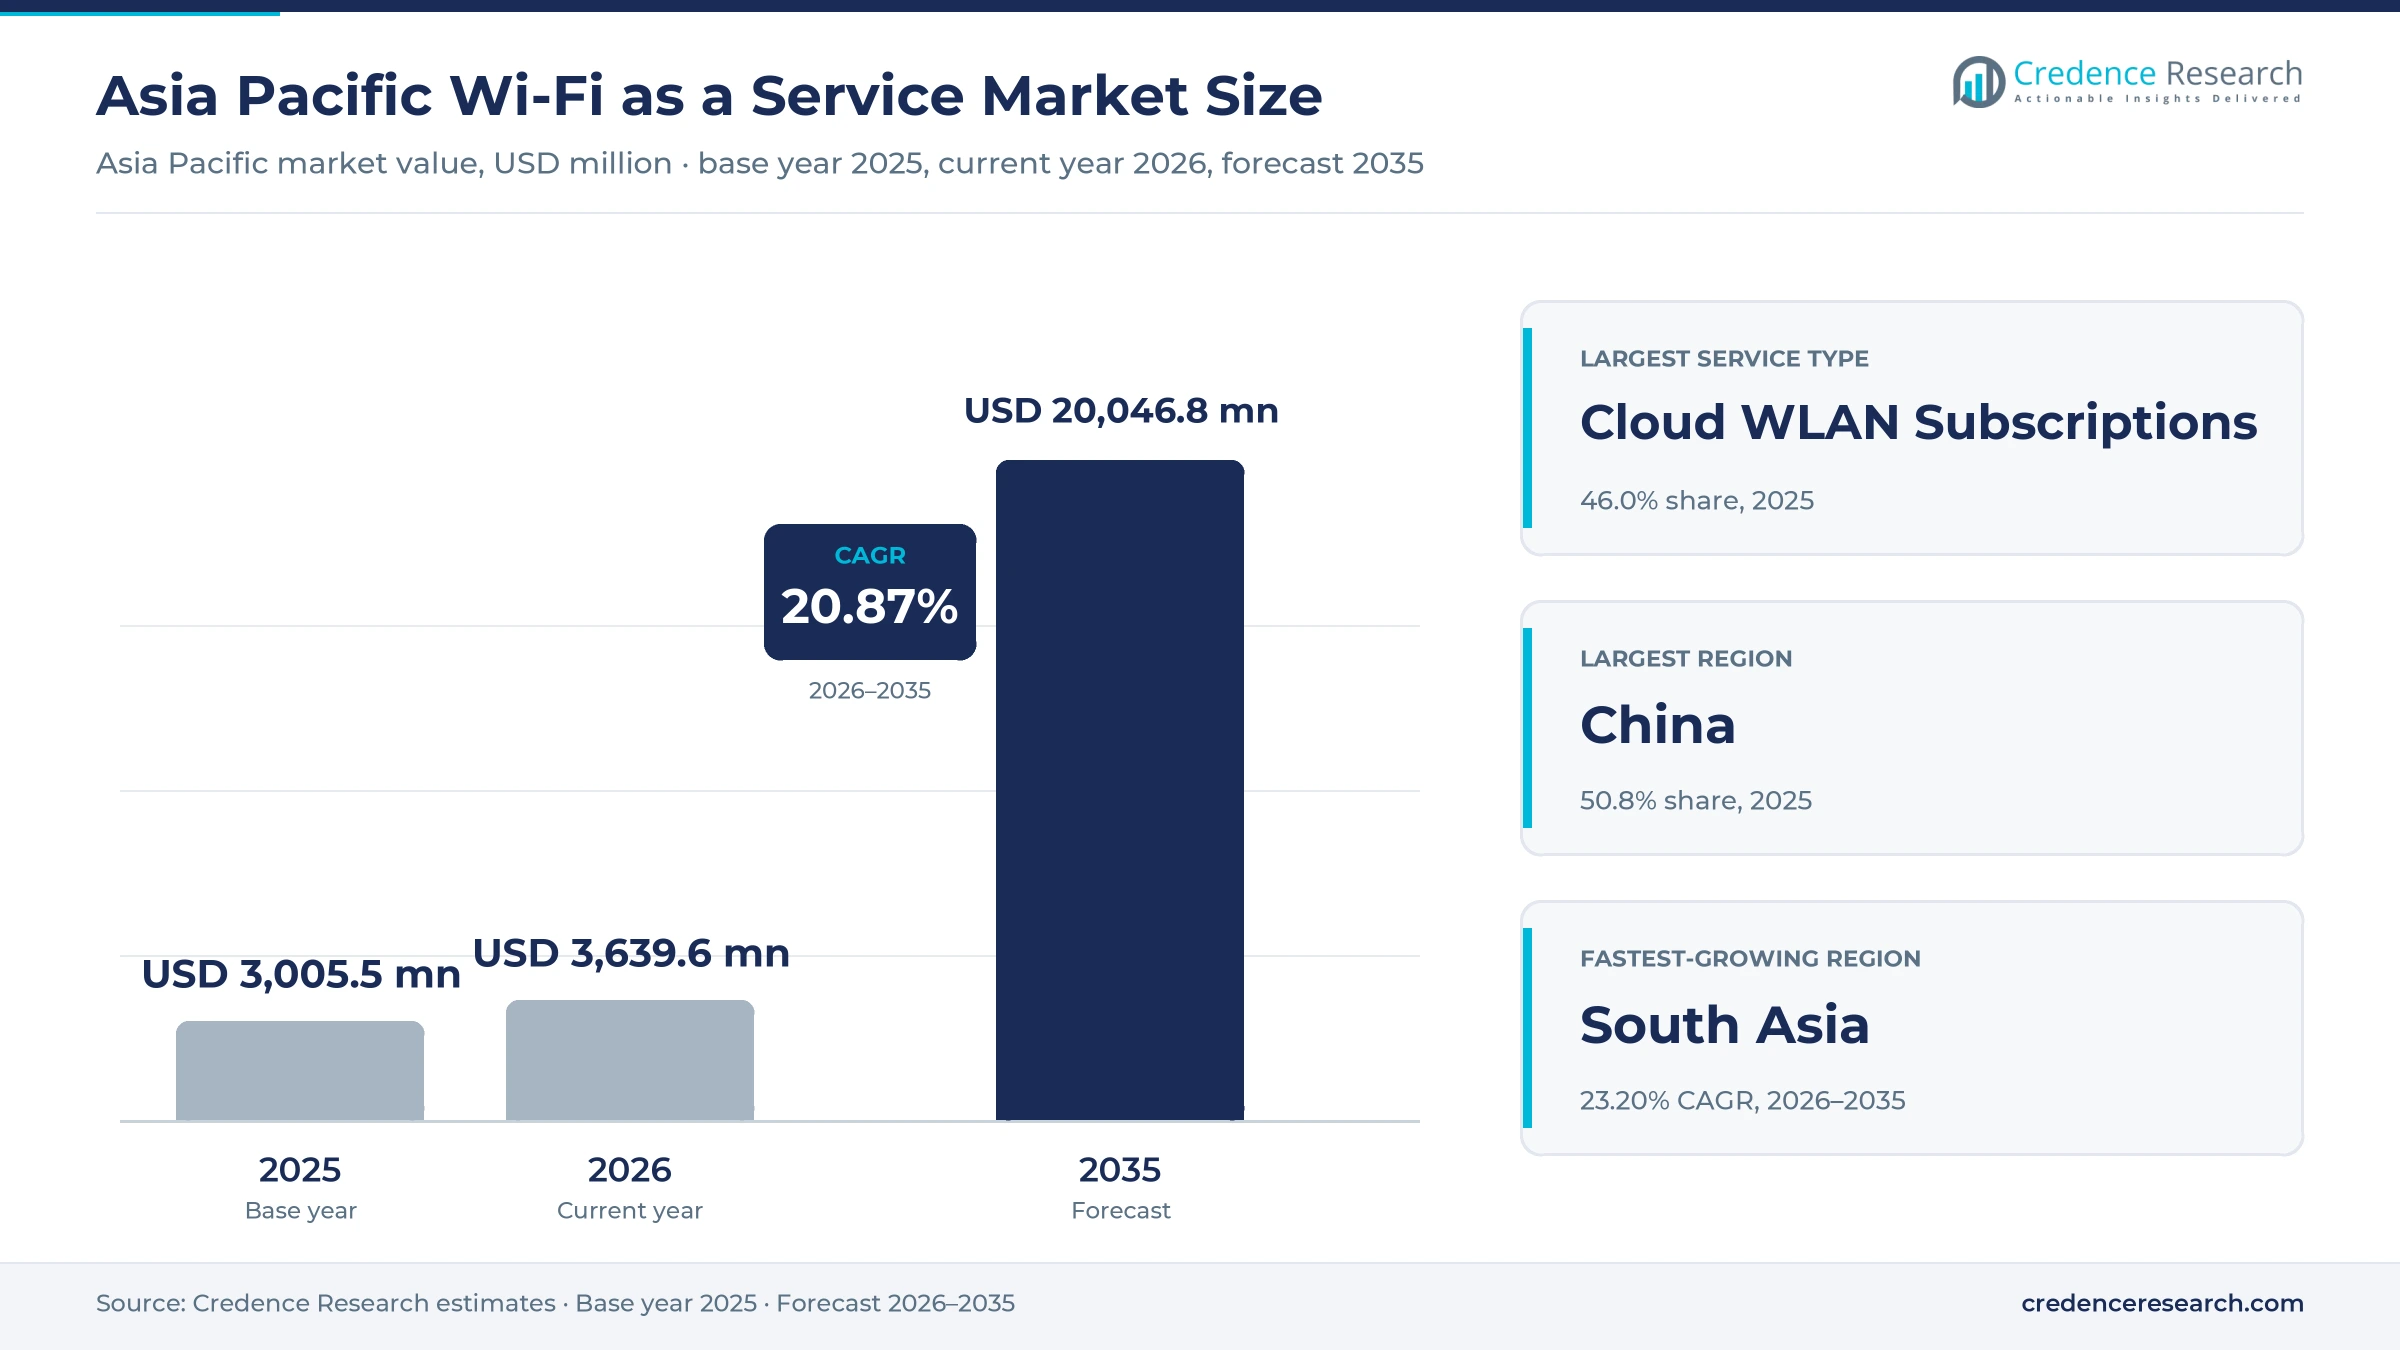
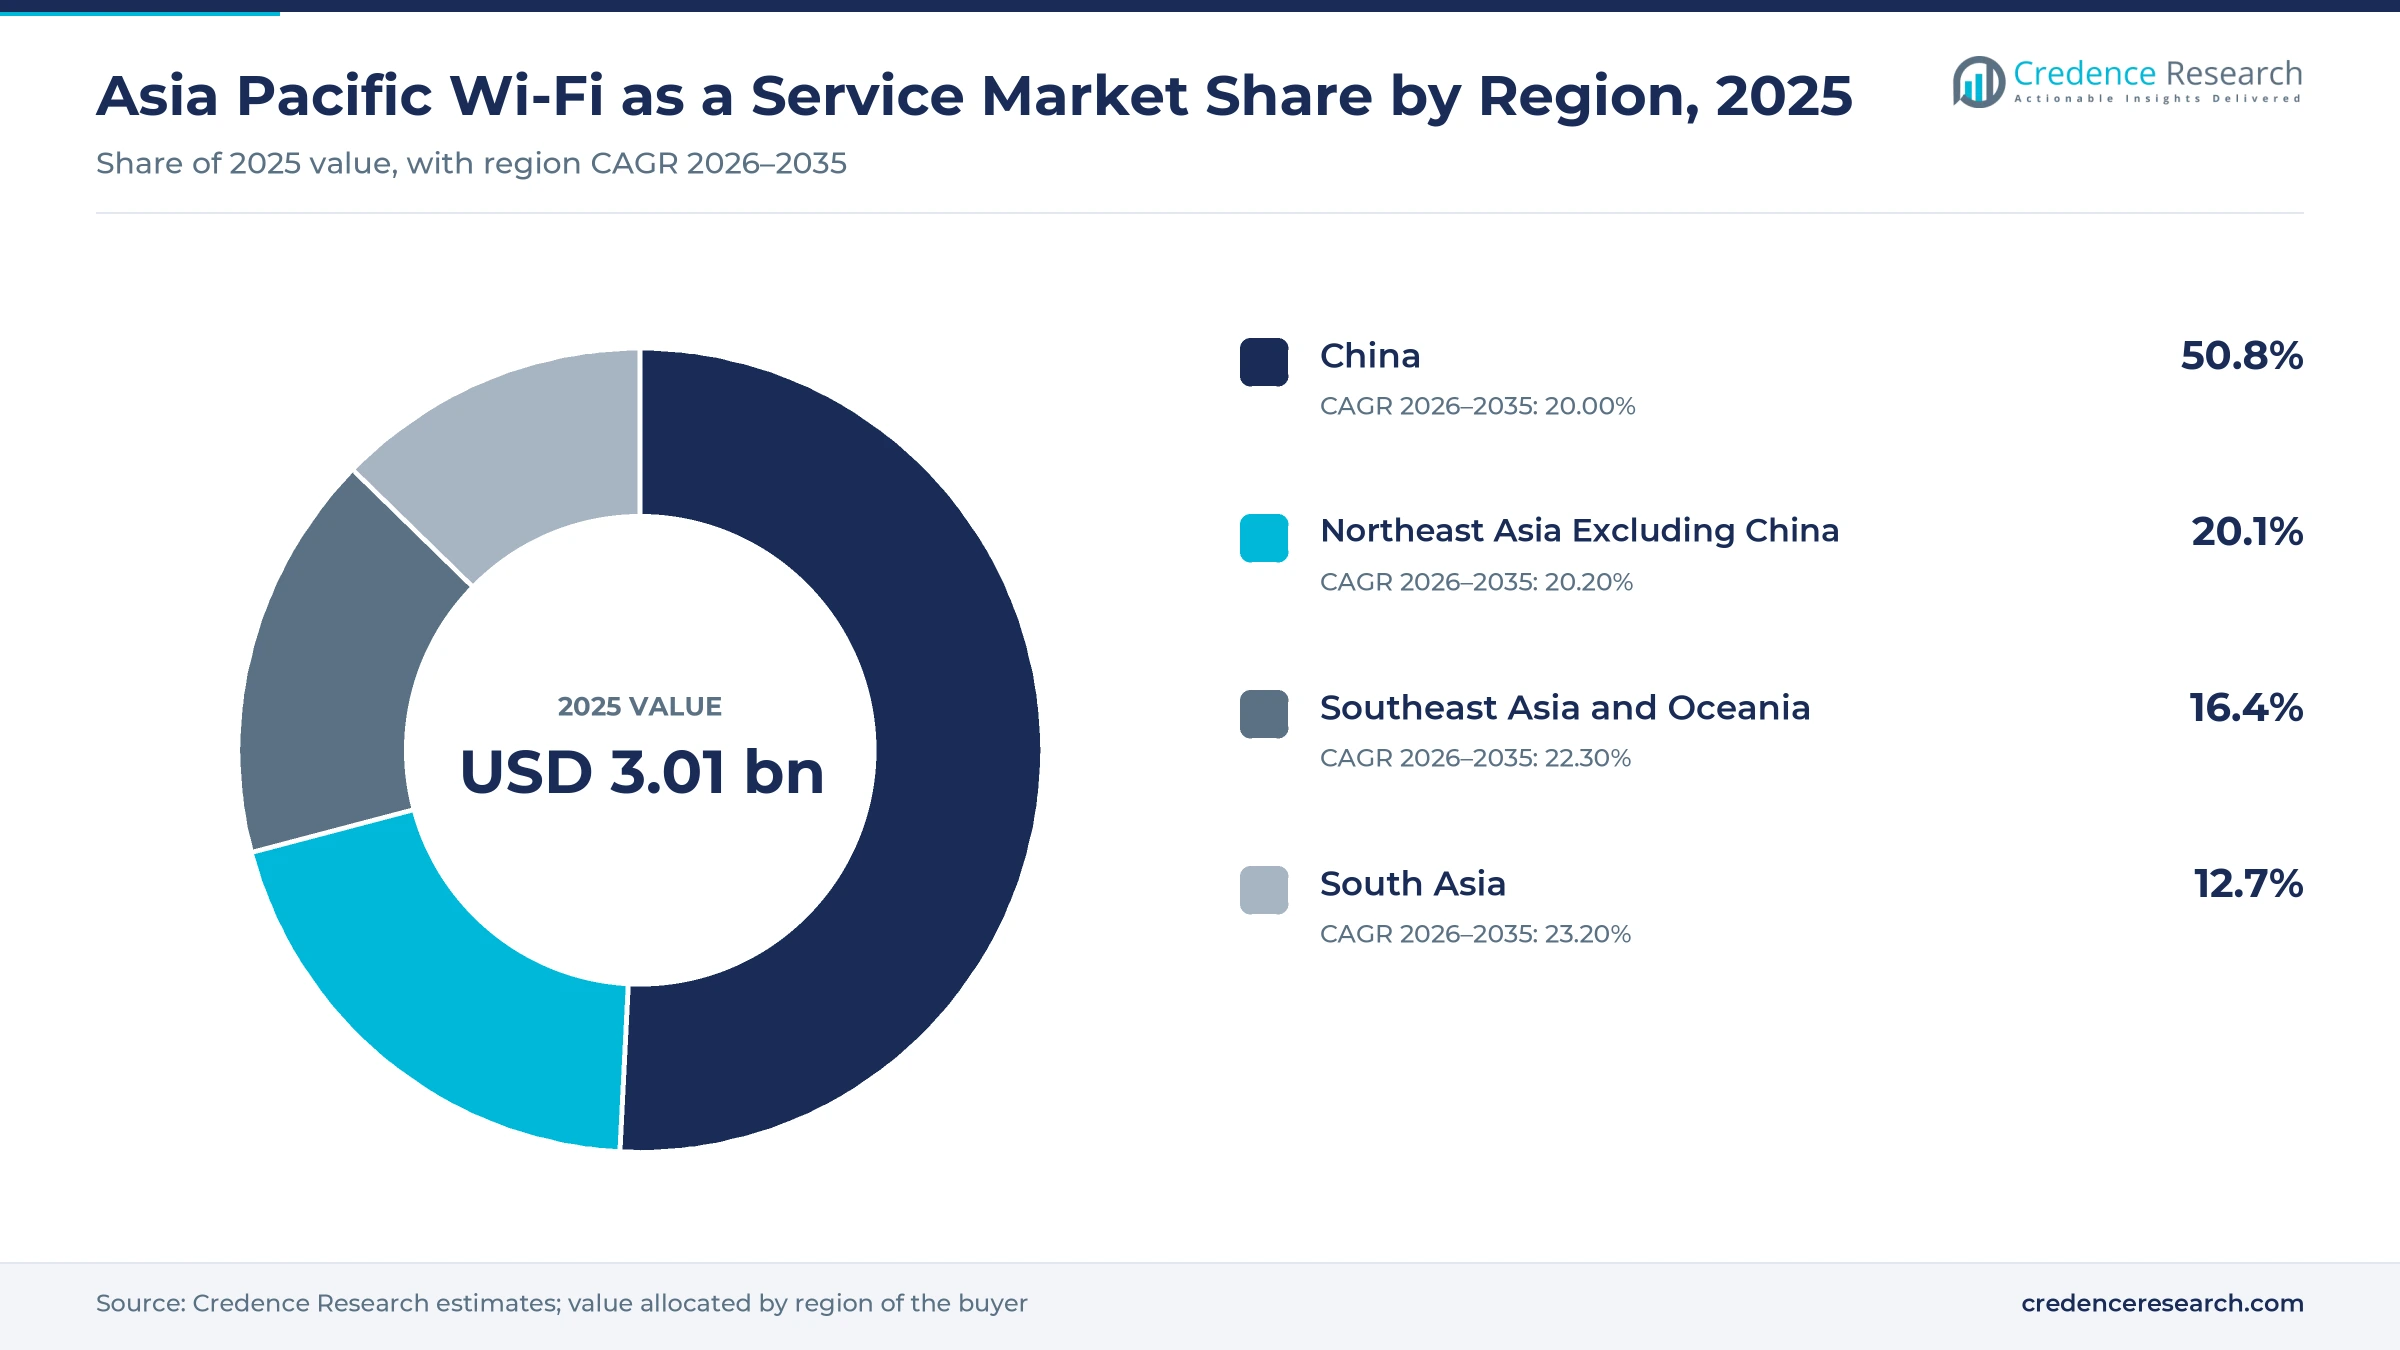
The Asia Pacific Wi-Fi as a Service market was valued at USD 2.00 billion in 2025 and is projected to increase from USD 2.42 billion in 2026 to USD 13.31 billion by 2035, registering a CAGR of 20.87% during 2026–2035. Demand comes from enterprises replacing older access points with Wi-Fi 7 and moving network operations to outside providers under monthly contracts. China held the largest share, 50.8% in 2025, because hotel, campus and factory estates there run at very large scale. South Asia is the fastest-growing region at 23.20% a year, helped by India opening the lower 6 GHz band for license-free indoor use in January 2026. Vendors are also shifting value from hardware toward paid assurance, with analytics and AI-based radio tuning sold as higher license tiers, and that change is lifting the amount buyers spend on each site.
What does Wi-Fi as a service cover for Asia Pacific enterprises?
The market counts recurring spending on wireless networks that a vendor, carrier or managed provider runs for the customer, including cloud WLAN licenses, operations contracts and security or analytics add-ons. Buyers usually purchase through multi-year subscriptions or monthly operating contracts, and those contracts often cover site surveys, installation and hardware refresh.
One-off purchases of access points without a service contract fall outside the count, as do home broadband gateways and consumer public hotspots sold to individuals. The value chain runs from chipset and access point makers through cloud platform owners to carriers and integrators, which hold the customer relationship and the service-level commitment.
Asia Pacific Wi-Fi as a Service Market Insights
- The market grows from USD 2.00 billion in 2025 to USD 13.31 billion by 2035 at a 20.87% CAGR, as Wi-Fi 7 refresh cycles move installed campus networks into recurring contracts.
- China held 50.8% of regional value in 2025, while South Asia grows fastest at 23.20% a year after India freed the lower 6 GHz band.
- Cloud WLAN subscriptions led service types with 46.0% of 2025 value, while large enterprises accounted for 52.0% of customer spending in the same year.
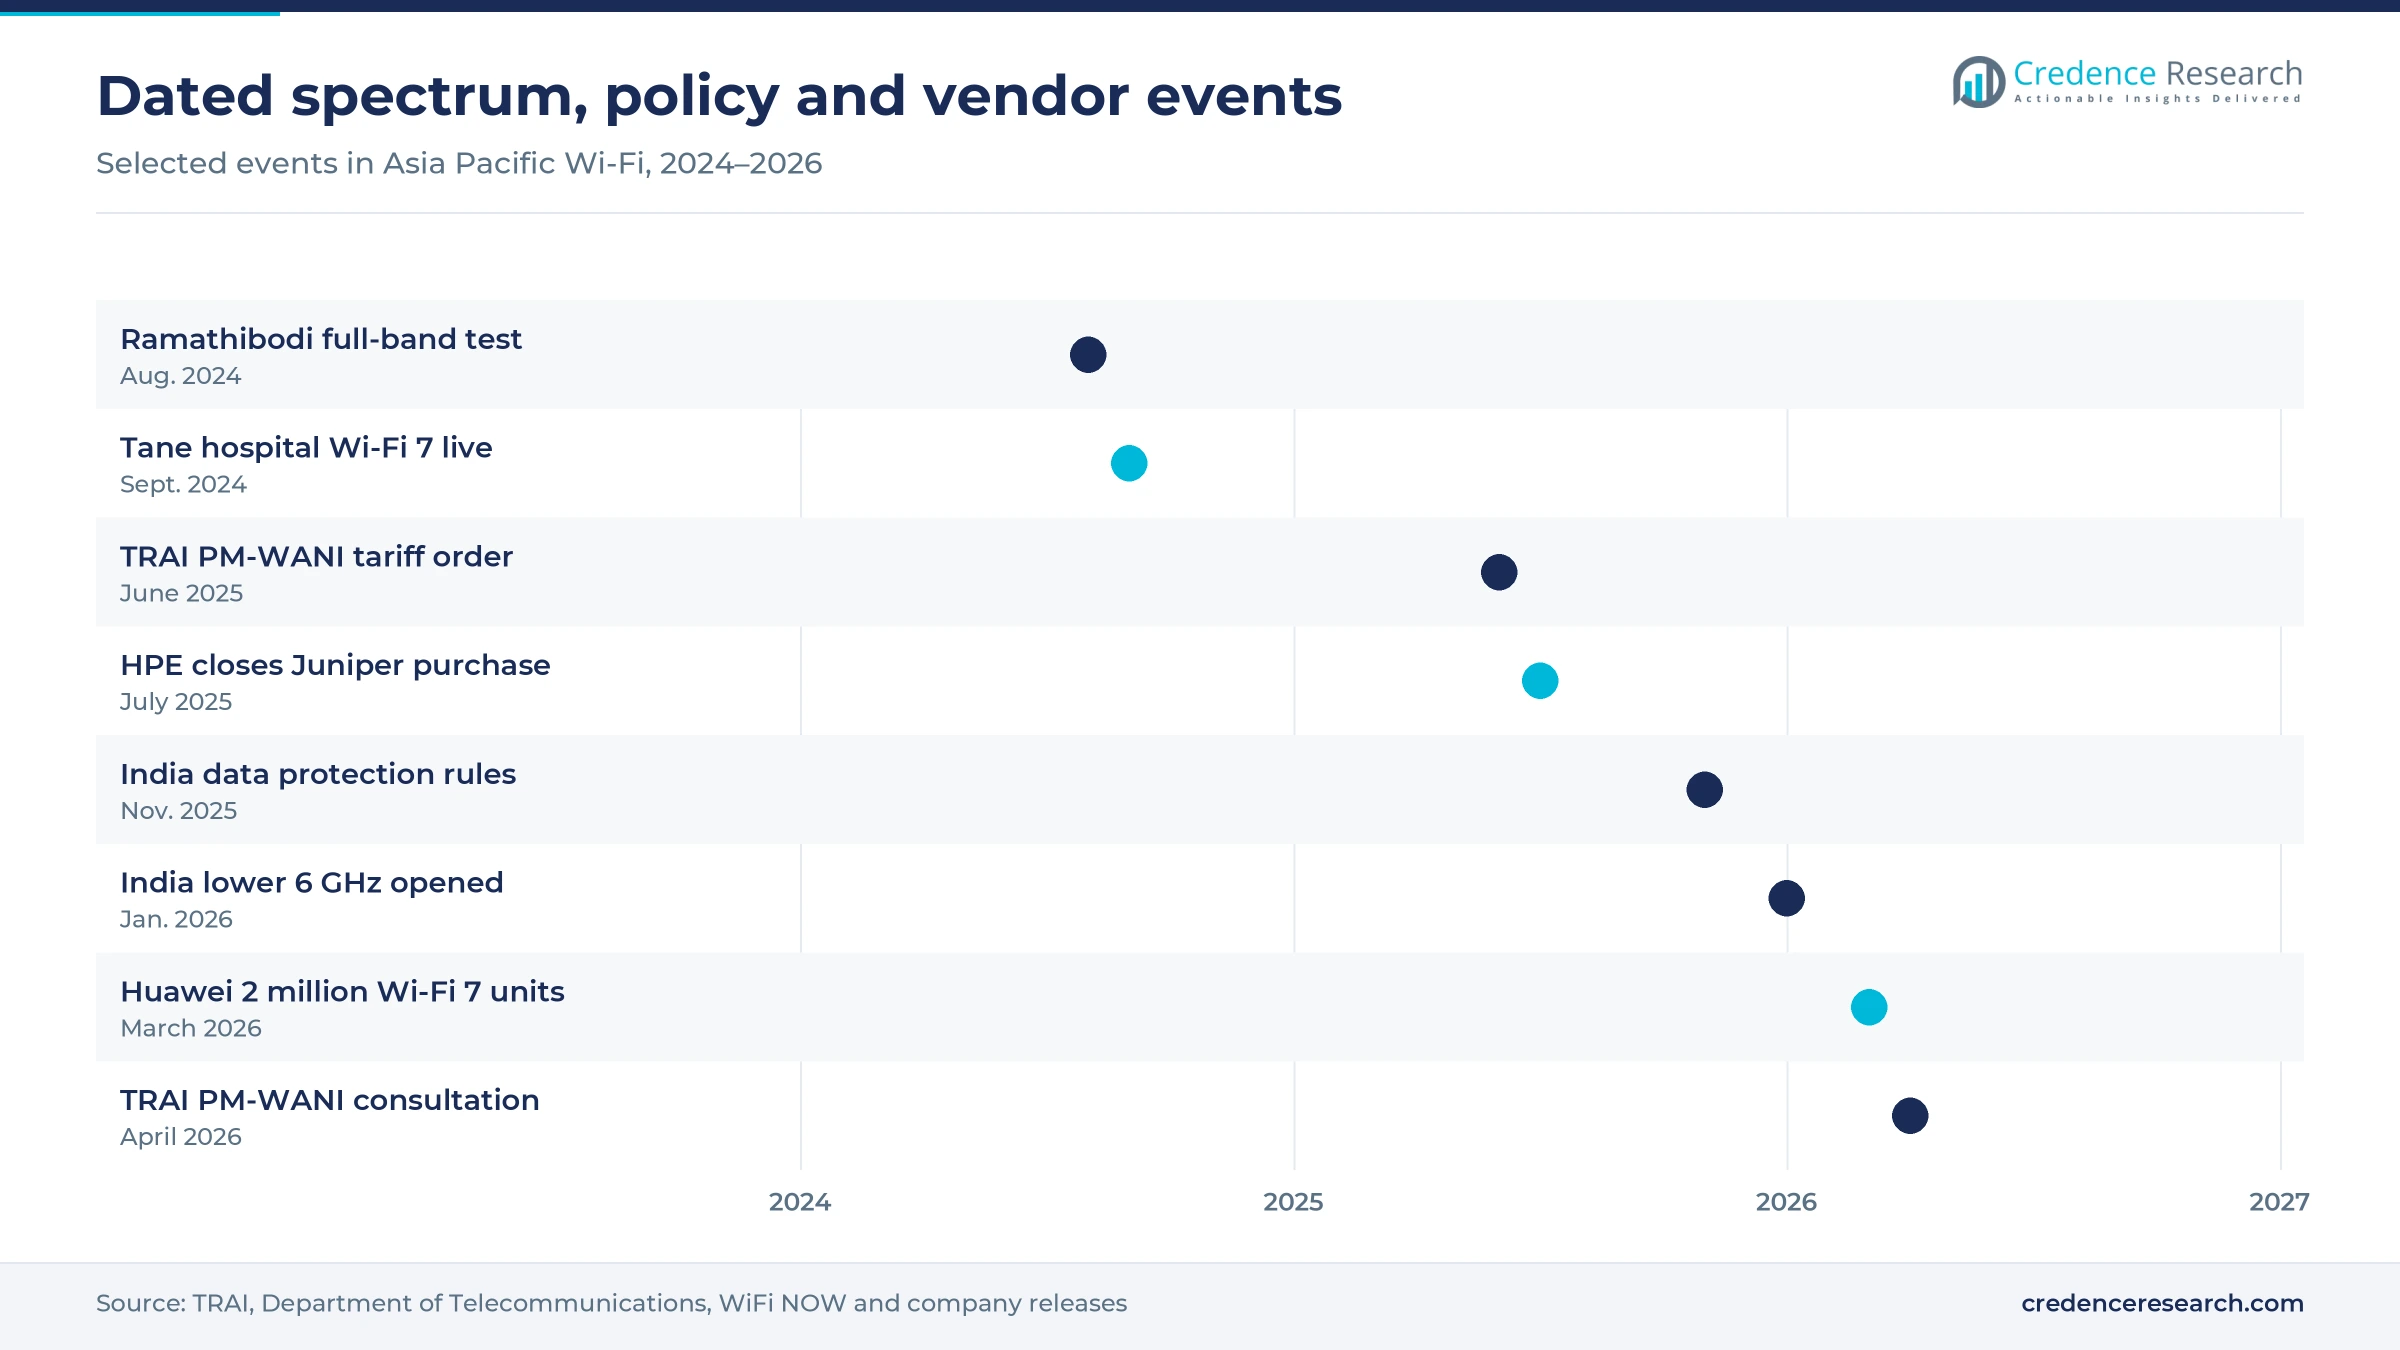
- Huawei said on March 17, 2026, that it had shipped more than 2 million enterprise-class Wi-Fi 7 products, which widens the base that buyers can place under service contracts.
- HPE closed its Juniper Networks purchase on July 2, 2025, combining two cloud networking portfolios and raising the competitive stakes for carriers that resell vendor platforms across the region.
Cloud subscriptions and large estates anchor spending
Why do cloud WLAN subscriptions lead service types?
Based on service type, the market is categorized into cloud WLAN subscriptions, managed Wi-Fi operations and security and experience add-ons. Cloud WLAN subscriptions led with 46.0% of 2025 value because vendor licensing now ties Wi-Fi 7 hardware to recurring terms, and the Cisco Networking Subscription data sheet, updated Sept. 1, 2026, sets a 36-month standard minimum term. Security and experience add-ons grow fastest at 22.96% a year as Cisco Meraki documentation places AI-RRM, Adaptive Policy and proactive packet capture in its Advantage license rather than its Essential tier, which gives buyers a paid step up.
Why do large enterprises hold the biggest customer share?
Based on customer type, the market is categorized into large enterprises, medium enterprises and small enterprises. Large enterprises led with 52.0% of 2025 value because multi-site buyers carry the biggest estates, and a Ruijie case study published March 25, 2025 counts 10,845 H World hotels and more than 1,000,000 wall access points installed since 2015. Small enterprises grow fastest at 22.45% a year as entry costs fall, with the Reyee line advertising lifetime free core cloud management in August 2026 and Singtel selling a pay-as-you-grow model.
Why do retail and hospitality networks lead end-use spending?
Based on end-use industry, the market is categorized into retail and hospitality, banking and financial services, healthcare, education and government, manufacturing and logistics and business services. Retail and hospitality led with 27.0% of 2025 value because guest and store networks repeat across many locations, and a Tele.net profile dated Dec. 4, 2024 quotes the Starbucks India CTO on one dashboard covering stores from Guwahati to Trivandrum. Healthcare grows fastest at 22.59% a year as clinical voice moves to wireless, with Japan's 304-bed Tane General Hospital running Wi-Fi 7 from September 2024, according to Huawei.
Why do direct vendor sales lead the channel mix?
Based on channel, the market is categorized into direct vendor sales, telecom operator sales and MSP and integrator sales. Direct vendor sales led with 41.0% of 2025 value because China's large estates often buy from the platform owner, and Ruijie said it has supplied H World since 2011 and provided 80% of the group's networking devices in 2024. Telecom operator sales grow fastest at 21.82% a year as carriers package access and operations together, with Telstra's Adapt Assured Meraki bundling installation and 24x7 monitoring and Tata Communications offering a monthly contract on a fully OPEX model.
| Segment Group | Leading Sub-segment | Share, 2025 | Fastest-growing Sub-segment | CAGR, 2026–2035 |
|---|---|---|---|---|
| By Service Type | Cloud WLAN Subscriptions | 46.0% | Security and Experience Add-Ons | 22.96% |
| By Customer Type | Large Enterprises | 52.0% | Small Enterprises | 22.45% |
| By End-Use Industry | Retail and Hospitality | 27.0% | Healthcare | 22.59% |
| By Channel | Direct Vendor Sales | 41.0% | Telecom Operator Sales | 21.82% |
Request a Free Sample
Fill in your details and we'll send you a free sample report.
- Sample data tables & charts
- Research methodology
Refresh, outsourcing and assurance tiers lift contracts
Wireless refresh converts installed networks
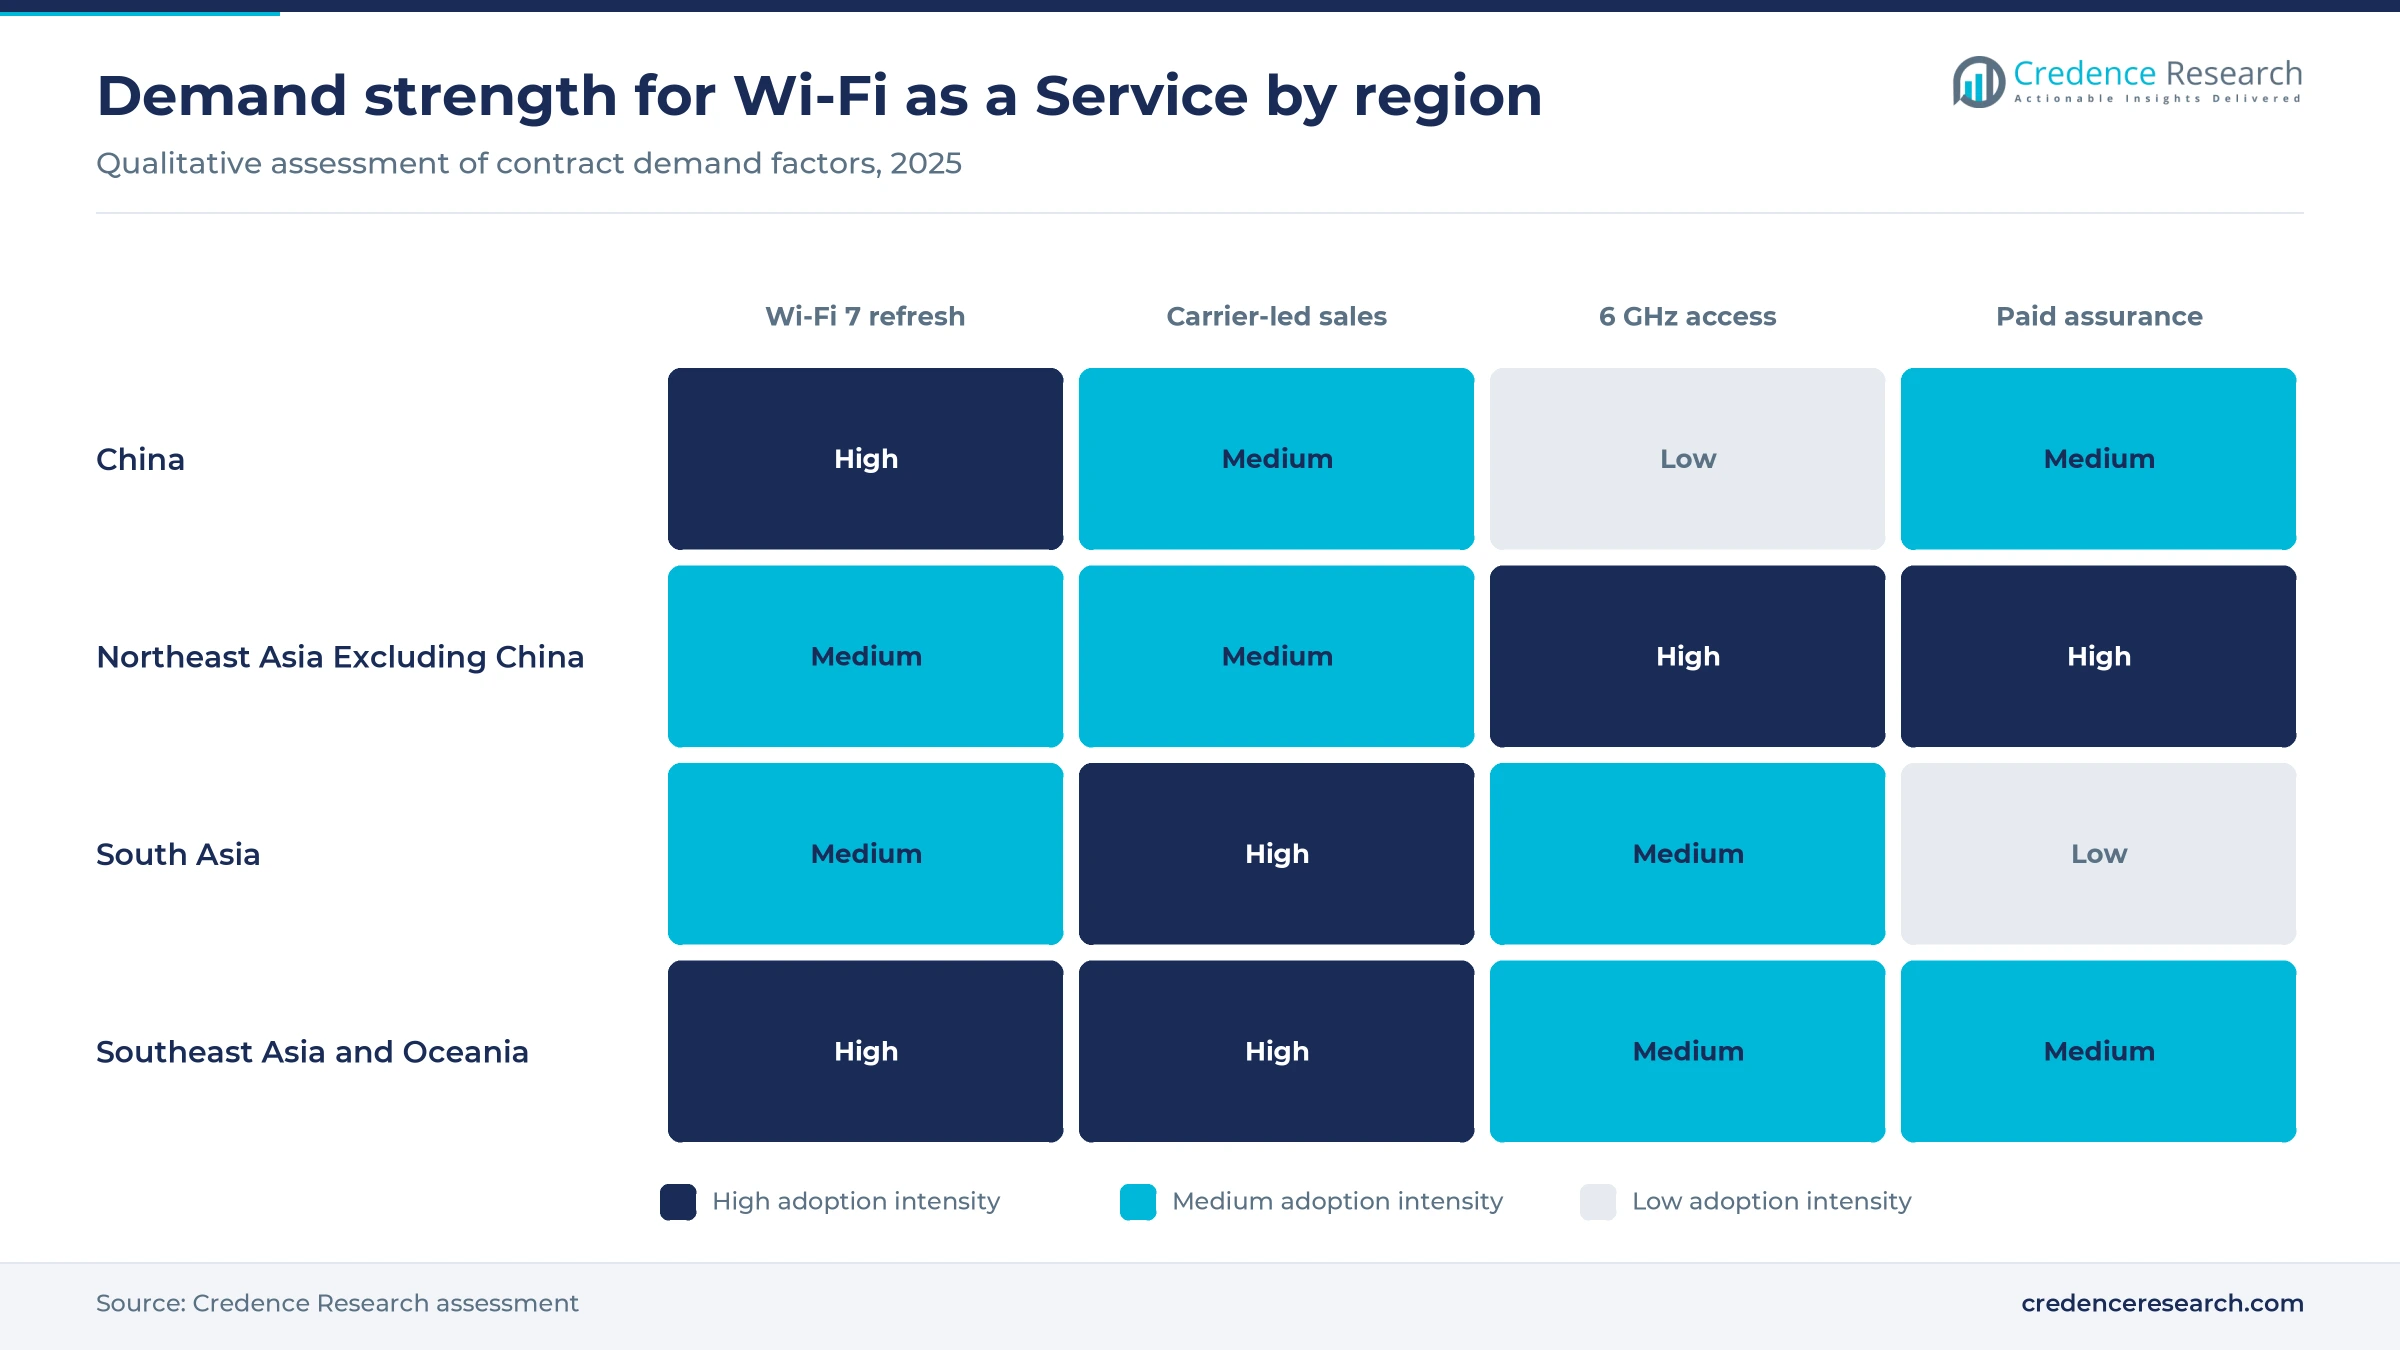
Each Wi-Fi 7 upgrade gives a provider a natural moment to place the new estate under a service contract, because buyers are already paying for surveys and migration. Huawei said on March 17, 2026, that it had shipped more than 2 million enterprise-class Wi-Fi 7 products, which shows the scale of the conversion base available to providers. Ookla data reported by TelecomLead on June 8, 2026, put Wi-Fi 7 at 25.1% of users in Singapore and 7.5% in China, against 4.1% in both Japan and South Korea, so much of the upgrade is still ahead. Spending on enterprise wireless LAN equipment therefore feeds subscription revenue, and each migrated site adds a renewable contract for its provider.
Enterprise outsourcing expands service attachment
Multi-site companies are handing day-to-day network operations to carriers because thin local teams struggle to run many locations from one office. Tata Communications sells a managed service that runs from site survey through remote field support, and Tele.net reported on Dec. 4, 2024, that it cites a 30% commercial benefit for buyers. Singtel's WiFi as a Service likewise covers WLAN configuration, implementation and hardware and software management on a cloud platform. Telstra markets Adapt Assured Meraki to retailers, healthcare providers and financial firms, citing Hanes Australasia stores in five countries. As a result, managed Wi-Fi operations rank as the second-largest service line in this market.
Assurance tiers increase monetizable functionality
Vendors now reserve their most useful diagnostics for higher license tiers, which lets providers raise the value of a site without adding access points. Cisco Meraki documentation places AI-RRM, Adaptive Policy and up to 5GB of cloud packet storage per network in its Advantage license for Wi-Fi 7 access points. Cisco also lists predictive disruption analysis and restoration commitments under its Signature support level in the Networking Subscription data sheet. Huawei's Tane General Hospital case study in Osaka shows the same logic in practice, because iMaster NCE-CampusInsight was added alongside Wi-Fi 7 to adjust signal strength automatically and diagnose faults. This layered selling explains why Security and Experience Add-Ons show the fastest growth among service types, at 22.96% a year.
New 6 GHz access in India widens the addressable base
Spectrum decisions determine how much of the Wi-Fi 7 upgrade buyers can actually use, and India's ruling removed a long-standing limit in the region's most populous market. The Department of Telecommunications opened 5,925–6,425 MHz for license-free indoor use in January 2026, according to Drishti IAS. Before the final rule, Bharat Bhatia told WiFi NOW in May 2025 that better connectivity could reach perhaps 150 million homes and businesses over the next few years. Singapore had already allocated 500 MHz of the same band in May 2023, according to iTnews Asia, so regional suppliers can reuse designs and service templates. These decisions underpin the faster South Asian growth assumed in this forecast through 2035.
Vendor mergers and hotel platforms reshape the offer
Vendor consolidation is shifting who owns the cloud platform
The supply side is moving toward fewer, larger cloud platforms and that shift changes what carriers can resell in the region. HPE completed its purchase of Juniper Networks on July 2, 2025, and the company said the deal doubles the size of its networking business under former Juniper chief Rami Rahim. The former CommScope and Ruckus business now trades as Vistance Networks, so buyers will see a new corporate name on their renewals. Cisco has also simplified Wi-Fi 7 licensing, with Meraki documentation describing one LIC-CW license family covering models from the CW9171I to the CW9179F. Buyers of enterprise network equipment therefore face fewer platform choices but simpler renewals.
Hotel-specific cloud platforms are rising across guest estates
Hospitality buyers are moving to platforms built around chain operations instead of general enterprise dashboards, because a hotel group needs one view across thousands of properties. Ruijie says more than 10,000 H World housekeeping staff use its cloud app to check Wi-Fi faults, and its remote optimization tool supports more than 3,300 Huazhu hotels. RUCKUS Networks answered on June 16, 2025, with a RUCKUS One Hospitality Edition, a Brand 360 Dashboard for multi-property visibility and new H670 and R370 Wi-Fi 7 access points. These releases help explain why retail and hospitality hold 27.0% of 2025 spending, and they make brand-wide contracts easier to price per property.
India's public Wi-Fi aggregators offer a new wholesale opening
India's PM-WANI program gives managed providers an opening, since aggregators need back-end platforms but lack large engineering teams. A written reply to the Rajya Sabha reported by TelecomTalk counted 409,403 public data offices, 207 aggregators and 24.47 million users as of Feb. 28, 2026. A TRAI tariff order dated June 16, 2025, caps fiber plans of up to 200 Mbps for these offices at twice the consumer rate, which lowers backhaul cost. Existing home and business networks can also join the scheme, and the government plans to let users move between aggregators' networks without losing their connection. Providers of gigabit hotspot equipment and cloud control could therefore sell to this group as it scales.
Southeast Asian hospitals and campuses present an untapped opening
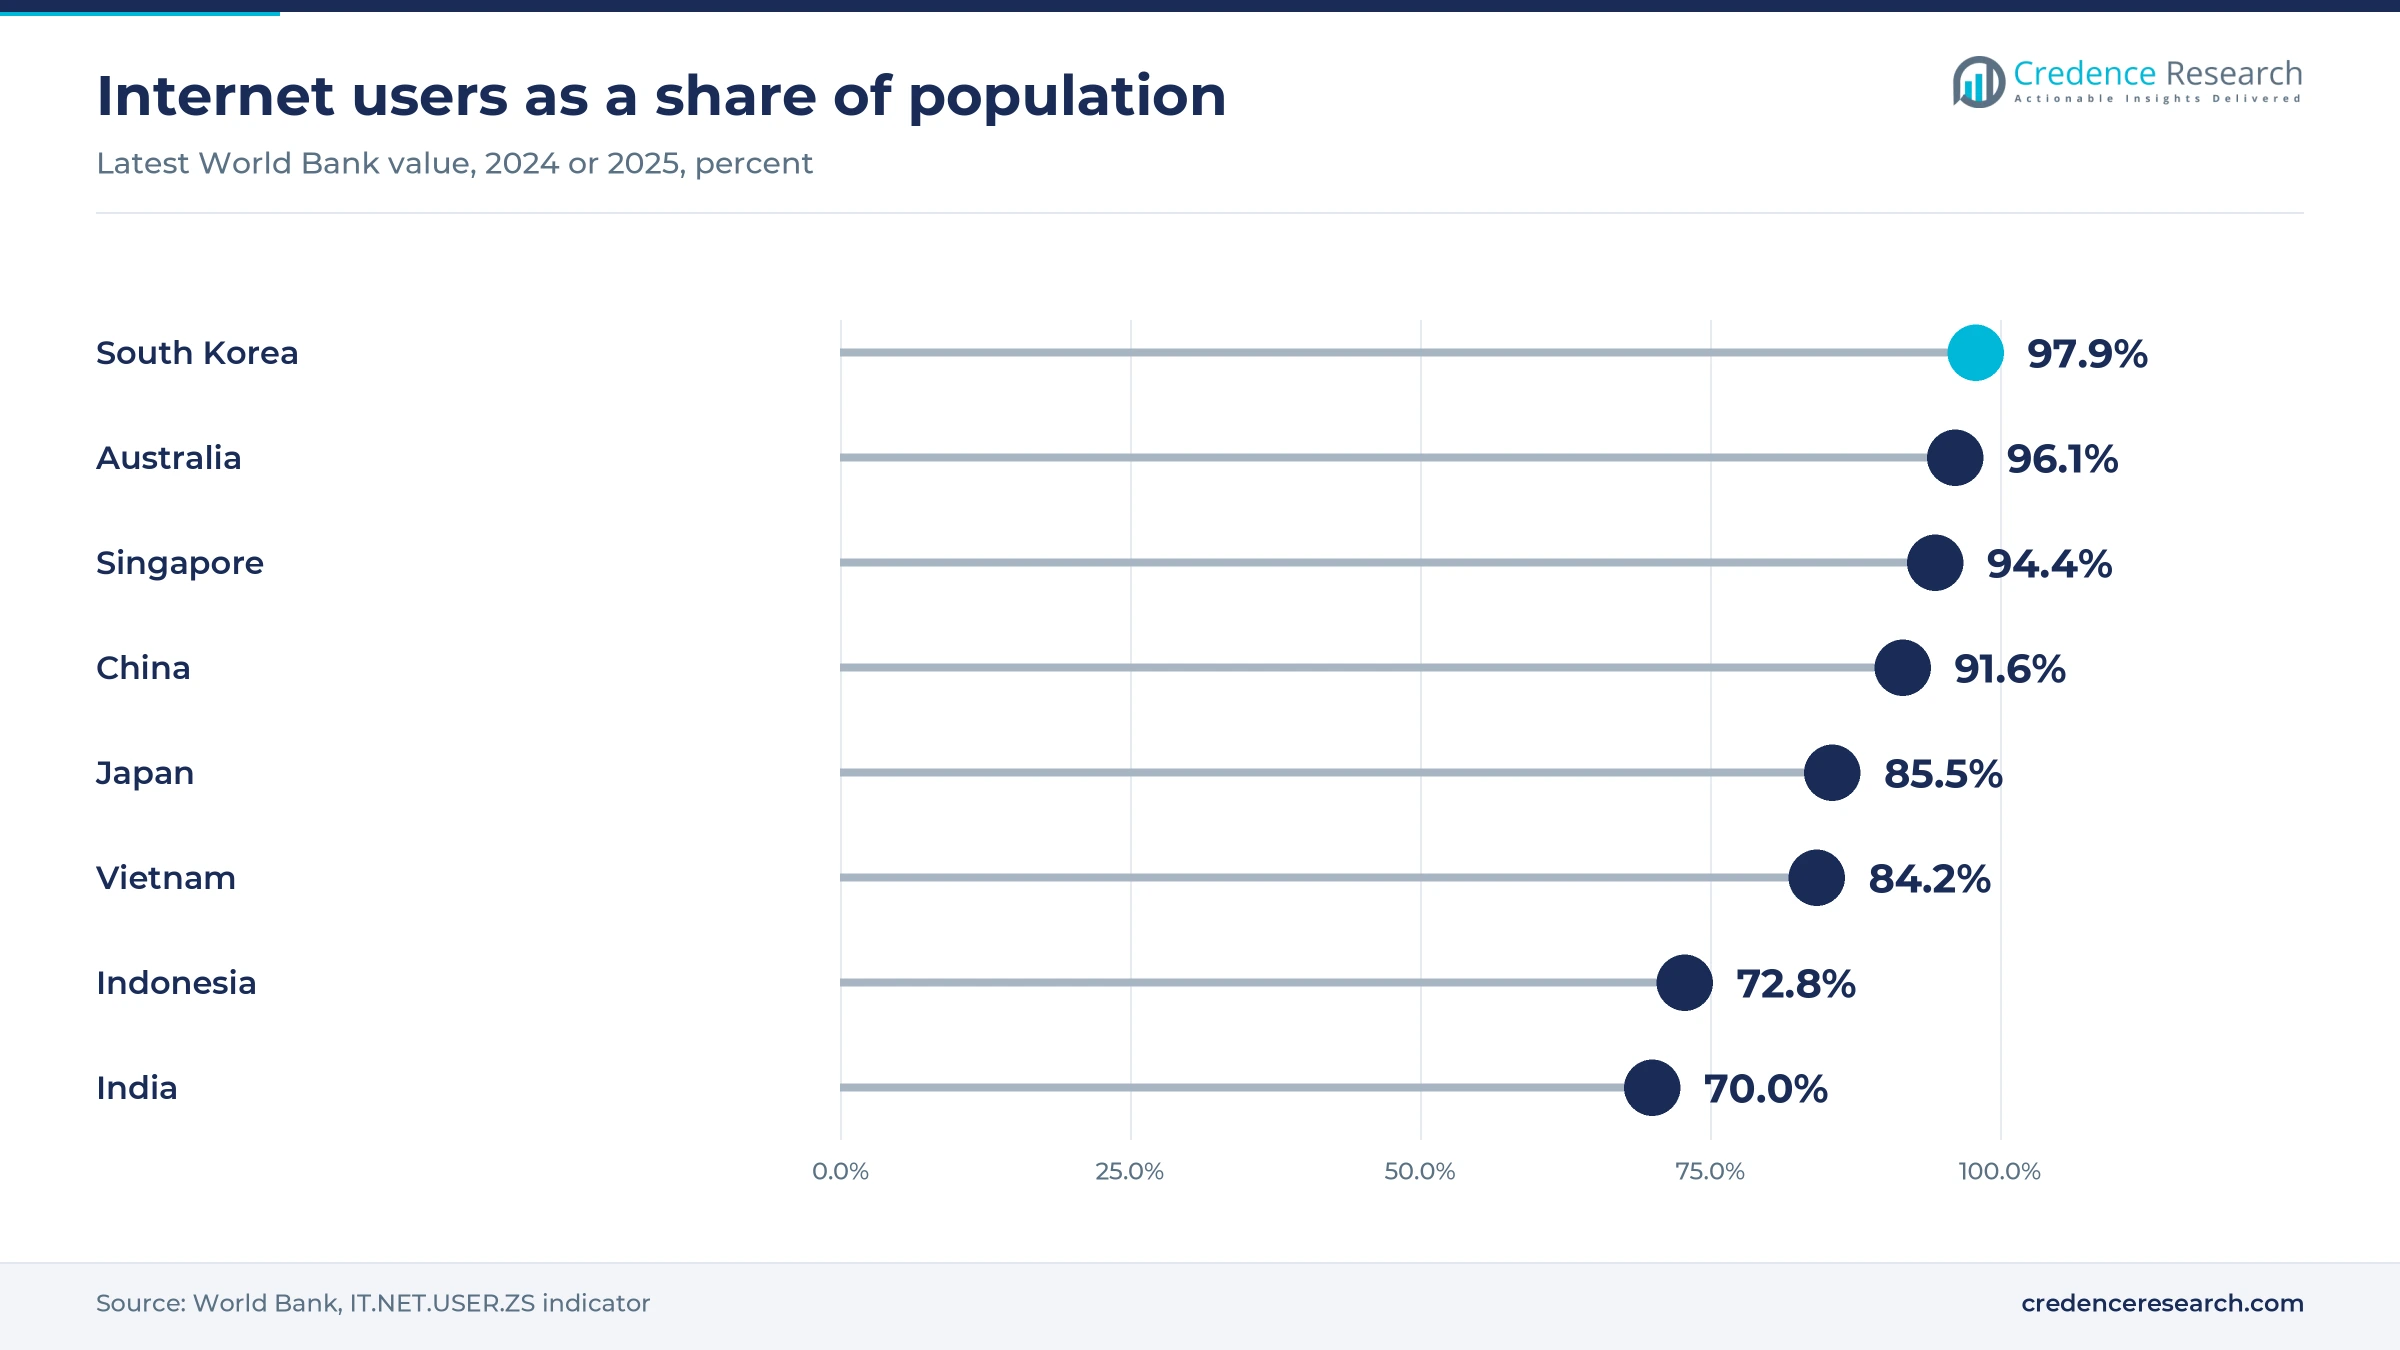
Hospitals and universities in Southeast Asia present a clear opening, because their dense sites expose the limits of older networks. Thailand's NBTC gave Ramathibodi Hospital's CNMI institute two years of special permission to test the full 1200 MHz band, according to WiFi NOW in August 2024, with HPE Aruba Networks and the Wi-Fi Alliance among the participants. The same report said the lower band is already open in Malaysia, Thailand and the Philippines. World Bank data also show internet use of 72.8% in Indonesia and 84.2% in Vietnam in 2024, against 94.4% in Singapore, which leaves room for institutional networks to grow. That headroom supports 22.30% annual growth for Southeast Asia and Oceania.
Spectrum splits and memory costs strain service margins
Fragmented 6 GHz rules limit one regional service design
Spectrum rules vary so much that a provider cannot deploy one design across the region. China's MIIT awarded 5.925–6.125 GHz to aircraft maker COMAC for private 5G in late November 2022, while South Korea has opened the full band for Wi-Fi. India's January 2026 rule then limited use to indoor sites and barred vehicles and oil rigs. As a result, carriers serving multinational retailers must maintain several hardware and channel plans, and that extra engineering has to be priced into cross-border contracts.
Memory costs squeeze fixed-fee service contracts
Component inflation hits providers that promised a fixed monthly fee with hardware included. Cisco chief executive Chuck Robbins said on Feb. 11, 2026, that the company had already announced price increases, and Channel Dive reported that it was revising contract terms with partners and customers. Carriers holding multi-year agreements carry this cost until renewal, which narrows margin on recently signed estates. Providers can respond with hardware adjustment clauses, shorter quote validity and staged refresh schedules for customers that accept later delivery.
Free cloud tiers and cheap mobile data cap pricing
Price expectations remain low in many markets, which limits what smaller buyers will pay each month. Ruijie's Reyee line advertised lifetime free core cloud management with no mandatory subscription fee in August 2026, and that undercuts entry licenses. In India, TRAI noted mobile data averaging Rs 7.87 per GB in December 2025, while PM-WANI reached about 410,000 hotspots against a 10 million target. Small venues and freemium operators therefore resist paid tiers, so providers must prove value through support commitments and security.
New privacy duties raise guest network compliance costs
Guest networks collect identity and location data, so privacy rules add cost to analytics add-ons that providers want to sell. India notified its Digital Personal Data Protection Rules in November 2025, and YourStory reported a staggered rollout over 12 to 18 months with fines of up to Rs 250 crore per breach. Fiduciaries must also tell affected people and the Data Protection Board about breaches. Retail and hotel operators are therefore reviewing captive portal consent, and providers need clearer contract language on data handling.
China holds half of value while South Asia grows fastest
| Region | Value, 2025 (USD billion) | Share, 2025 | CAGR, 2026–2035 |
|---|---|---|---|
| China | 1.02 | 50.8% | 20.00% |
| Northeast Asia Excluding China | 0.40 | 20.1% | 20.20% |
| Southeast Asia and Oceania | 0.33 | 16.4% | 22.30% |
| South Asia | 0.25 | 12.7% | 23.20% |
China leads through very large hotel, campus and factory estates
China held 50.8% of 2025 value and grows at 20.00% a year, the slowest rate in the region because the base is already large. Ruijie's estate at H World shows the scale, while state-reported telecom data for end-2025 show gigabit optical access in every county and cloud, big data, IoT and data center work at 25.7% of telecom business revenue, according to China Services Info. Domestic vendors hold a strong position, although Wi-Fi 7 users stood at only 7.5% in Ookla's 2026 data, which leaves a long refresh runway.
Northeast Asia pairs early Wi-Fi 7 approval with slow user uptake
Northeast Asia Excluding China held 20.1% of 2025 value and grows at 20.20% a year. Japan approved Wi-Fi 7 in December 2023, according to Huawei's Tane General Hospital case study, and Otani University became the first in Japan to introduce the standard using RUCKUS R770 access points, according to RUCKUS. South Korea stands out as the Asian market that WiFi NOW credits with opening the full 6 GHz band. Even so, Ookla data put Wi-Fi 7 use at 4.1% in both countries, so service growth depends on refresh timing.
Southeast Asia and Oceania rely on carrier-led managed offers
Southeast Asia and Oceania held 16.4% of 2025 value and grow at 22.30% a year, led by carrier-sold contracts. Singtel handles consultation through hardware upkeep for its venue-owner customers in Singapore. Telstra sells a combined Meraki and network offer in Australia, where 6 GHz carried 3.6% of Wi-Fi traffic in Ookla's first-quarter 2026 data against 13.3% in Singapore. Optus also won a five-year, $20 million contract for 81 Vicinity shopping centers in August 2016, according to eCommerceNews Asia, an early template for this model.
South Asia grows fastest after India opened the lower 6 GHz band
South Asia held 12.7% of 2025 value and grows fastest at 23.20% a year from the smallest regional base. India's January 2026 spectrum ruling, the PM-WANI network of 409,403 hotspots and Tata Communications' monthly OPEX contract all point to wider demand. World Bank data show internet use at 70% of India's population in 2025, compared with 91.6% in China, so connected workplaces and venues still have room to expand. Telecom operators and aggregators are therefore likely to lead sales in this region over the forecast period.
Spectrum rulings and vendor moves set the 2025–2026 pace
| Development | Status and market relevance |
|---|---|
| In January 2026, India's Department of Telecommunications opened 5,925–6,425 MHz for license-free indoor Wi-Fi use. | In force; it opens Wi-Fi 7 upgrades in South Asia's largest market |
| In March 2026, Huawei said it had shipped more than 2 million enterprise-class Wi-Fi 7 products worldwide. | Company statement; it widens the convertible installed base |
| In July 2025, HPE completed its purchase of Juniper Networks, doubling the size of its networking business. | Closed; it combines two cloud networking portfolios |
| In June 2025, RUCKUS Networks launched its Hospitality Edition and new H670 and R370 Wi-Fi 7 access points. | Commercial launch; it targets hotel chains with multi-property dashboards |
| In April 2026, TRAI opened consultation on low PM-WANI deployment, with comments due May 25, 2026. | Consultation stage; the outcome could reshape public Wi-Fi economics |
AI assurance and tri-band access points add paid layers
- AI-RRM requires firmware 30.x or newer and a CW-ADV license on Wi-Fi 7 access points, according to Cisco Meraki documentation.
- Proactive packet capture runs only on cloud-managed access points, with up to 5GB of cloud packet storage per network under the same license.
- iMaster NCE-CampusInsight monitors signal and traffic and helps diagnose faults, as Huawei described at Tane General Hospital in Osaka.
- OpenRoaming lets users log in automatically across participating venues, and Telstra includes it within Adapt Assured Meraki for multi-site customers.
Need a Custom Version of This Report?
Tailor the scope, geography, or segments to your exact requirements.
- Custom geography or segment scope
- Direct access to our analyst team
Vendors and carriers compete for the operating contract
Competition turns on who holds the operating contract rather than who ships the most access points. Platform owners such as Huawei, Ruijie, Cisco and HPE sell cloud management directly and through partners, with Huawei and Ruijie strongest in China and Cisco strong through carrier partners elsewhere. Carriers such as Singtel, Telstra and Tata Communications bundle those platforms with access links, monitoring and field support, which makes switching harder once a contract starts. HPE gained a wider portfolio by closing the Juniper purchase in July 2025, and it has also taken part in spectrum testing in Bangkok. RUCKUS competes for hotel and campus accounts with sector-specific software. Price pressure comes from free cloud tiers, so larger providers are competing on uptime targets, compliance support and security add-ons rather than on the base license alone.
Named providers active in the region
| Company | Type | Role in the market |
|---|---|---|
| Huawei Technologies | Platform vendor | AirEngine Wi-Fi 7 and CampusInsight, deployed at Tane General Hospital in Osaka |
| Cisco Systems | Platform vendor | Meraki cloud licensing, resold by Telstra in Adapt Assured Meraki |
| HPE Aruba Networking | Platform vendor | Took part in the Ramathibodi 6 GHz demonstration in Bangkok; now owns Juniper and Mist AI |
| Singtel / NCS | Telecom operator | WiFi as a Service and Wireless@SG venue offers in Singapore |
| Tata Communications | Telecom operator | Managed Wi-Fi and LAN on a monthly OPEX contract, including Starbucks India |
| Ruijie Networks | Platform vendor | Main network supplier to H World, plus Reyee cloud for small sites |
| CommScope / Ruckus Networks | Platform vendor | R770 at Otani University in Japan; hospitality cloud edition |
| Telstra | Telecom operator | Adapt Assured Meraki for multi-site Australian customers |
Service attachment matters more than access point count
Credence Research's view is that access point counts will understate this market, because the commercial gain now lies in attachment and tier rather than in hardware. Providers that win Wi-Fi 7 migrations in 2026 and 2027 hold those estates through at least a 36-month term, as Cisco's standard subscription minimum shows. China will stay the largest base, yet the better margin opportunity is likely in Southeast Asia and India, where carriers sell full operations. The most uncertain input is how quickly smaller venues accept paid tiers when free cloud management is available.
How Credence Research built this regional estimate
The report uses 2025 as the base year and 2035 as the forecast year, with the 2026–2035 growth rate applied to the 2026 value. Market values come from the Credence Research model, and regional, segment and channel splits are Credence Research estimates informed by public data. Sources include regulator and ministry statements, World Bank indicators, company product documentation, case studies, press releases and trade press opened during research. No primary interviews or surveys were conducted for this edition, and company roles are described only where regional activity could be verified from public documents.
Recurring wireless spending widens beyond China by 2035
The market should reach USD 13.31 billion by 2035, and growth should broaden as South Asia and Southeast Asia and Oceania gain share from China. Wi-Fi 7 replacement drives the near-term contract pipeline, and a further cycle should follow as buyers renew 36-month terms around 2029 and later. Security and analytics tiers should take a larger part of each contract, provided privacy rules such as India's phased data protection regime stay workable. Spectrum alignment in 6 GHz remains the main swing factor, and any wider opening in China or Southeast Asia would lift the forecast.
Frequently Asked Questions
How big is the Asia Pacific Wi-Fi as a Service market?
Which region leads the Asia Pacific Wi-Fi as a Service market?
Which region is growing fastest?
Which service type holds the largest share?
Why are security and experience add-ons growing fastest?
Which companies operate in this market?
What are the main challenges for providers?
Which end-use industry spends the most?
Table of Content
Chapter 1 Market Segmentation
- 1.1 Segmentation Framework
- 1.1.1 Product and Service Classification
- 1.1.2 Application and End-Use Classification
- 1.1.3 Technology and Solution Classification
- 1.1.4 Customer and Distribution Channel Classification
- 1.1.5 Geographic Segmentation
- 1.1.6 Market Segment Definitions and Boundaries
- 1.2 By Service Type
- 1.2.1 Cloud WLAN Subscriptions
- 1.2.2 Managed Wi-Fi Operations
- 1.2.3 Security and Experience Add-Ons
- 1.3 By Customer Type
- 1.3.1 Large Enterprises
- 1.3.2 Medium Enterprises
- 1.3.3 Small Enterprises
- 1.4 By End-Use Industry
- 1.4.1 Retail and Hospitality
- 1.4.2 Banking and Financial Services
- 1.4.3 Healthcare
- 1.4.4 Education and Government
- 1.4.5 Manufacturing
- 1.4.6 Logistics and Business Services
- 1.5 By Channel
- 1.5.1 Direct Vendor Sales
- 1.5.2 Telecom Operator Sales
- 1.5.3 MSP and Integrator Sales
Chapter 2 Introduction
- 2.1 Report Objectives and Scope
- 2.2 Product Definition and Industry Terminology
- 2.3 Market Inclusions and Exclusions
- 2.4 Research Process
- 2.4.1 Primary Research and Expert Interviews
- 2.4.2 Secondary Research and Source Review
- 2.4.3 Top-Down and Bottom-Up Estimation
- 2.4.4 Data Triangulation and Verification
- 2.5 Market Size Measurement Basis
- 2.5.1 2025: USD 2.00 billion → 2035: USD 13.31 billion
- 2.6 Historical and Forecast Reference Periods
- 2.6.1 Historical Period: 2018-2025
- 2.6.2 Base Year: 2025
- 2.6.3 Forecast Period: 2025-2035
- 2.7 Research Assumptions and Limitations
Chapter 3 Executive Summary
- 3.1 Market Snapshot and Key Findings
- 3.2 Base-Year Market Size, 2025
- 3.3 Forecast Market Size, 2035
- 3.4 Revenue and Volume Growth Outlook
- 3.5 Key Demand and Supply Indicators
- 3.6 Leading Market Segments
- 3.7 Fastest-Growing Market Opportunities
- 3.8 Regional Performance Highlights
- 3.9 Technology and Industry Transformation
- 3.10 Competitive Landscape Summary
- 3.11 Analyst View and Strategic Implications
Chapter 4 Asia Pacific Wi-Fi as a Service Market Trends and Developments
- 4.1 Historical Industry Development, 2018-2025
- 4.2 Recent Market Trends and Developments
- 4.3 Demand and Customer Behavior Trends
- 4.4 Technology and Product Innovation
- 4.5 Artificial Intelligence, Automation and Digitalization
- 4.6 Local Manufacturing and Supply Chain Realignment
- 4.7 Industry Partnerships, Mergers and Acquisitions
- 4.8 Sustainability and Circular Economy Developments
- 4.9 Government and Private Sector Investment Trends
- 4.10 Emerging Business Models and Commercialization
- 4.11 Industry Developments and Announcements
Chapter 5 Asia Pacific Wi-Fi as a Service Market Supply and Demand Analysis
- 5.1 Demand Trend and Consumption Analysis, 2018-2025
- 5.2 Demand Forecast, 2025-2035
- 5.3 Supply Chain Structure and Procurement Trends
- 5.4 Supply-Demand Gap and Bottlenecks
- 5.5 Import Dependence and Sourcing Structure
- 5.6 Regional Supply and Demand Concentration
Chapter 6 Asia Pacific Wi-Fi as a Service Market Pricing Analysis
- 6.1 Pricing Structure and Measurement
- 6.2 Historical Pricing Trends, 2018-2025
- 6.3 Pricing Outlook, 2025-2035
- 6.4 Pricing by Product and Market Segment
- 6.5 Geographic Pricing Differences
- 6.6 Key Input, Energy, Labor and Logistics Costs
- 6.7 Contract Pricing and Purchasing Models
- 6.8 Pricing Sensitivity and Competitive Positioning
- 6.9 Price, Margin and Profitability Implications
Chapter 7 Asia Pacific Wi-Fi as a Service Market Dynamics
- 7.1 Market Growth Drivers
- 7.1.1 Demand-Side Drivers
- 7.1.2 Technology and Innovation Drivers
- 7.1.3 Infrastructure and Investment Drivers
- 7.1.4 Regulatory and Policy Drivers
- 7.2 Market Restraints
- 7.2.1 Cost and Affordability Constraints
- 7.2.2 Technology and Adoption Barriers
- 7.2.3 Supply Chain and Operational Constraints
- 7.3 Market Challenges
- 7.3.1 Competitive Pressure and Margin Erosion
- 7.3.2 Skills, Infrastructure and Implementation Gaps
- 7.4 Emerging Market Opportunities
- 7.5 Market Dynamics Impact and Time-Horizon Assessment
Chapter 8 Asia Pacific Wi-Fi as a Service Value Chain Analysis
- 8.1 Industry Value Chain Overview
- 8.2 Upstream Suppliers and Critical Inputs
- 8.3 Technology and Component Providers
- 8.4 Manufacturing or Service Delivery
- 8.5 Distribution, Channel Partners and Integrators
- 8.6 Downstream Applications and End Users
- 8.7 Value Addition and Profit Pools
- 8.8 Vertical Integration and Outsourcing
- 8.9 Supplier Concentration and Risk
- 8.10 Supply Chain Localization and Resilience
Chapter 9 Asia Pacific Wi-Fi as a Service Market Regulations and Policies
- 9.1 Relevant Laws, Standards and Compliance Frameworks
- 9.2 Product, Service, Safety and Quality Requirements
- 9.3 Government Policies, Incentives and Subsidies
- 9.4 Imports, Exports and Trade Barriers
- 9.5 Public Procurement and Local Content Requirements
- 9.6 Data Protection, AI and Cybersecurity Compliance
- 9.7 Upcoming Policy Changes and Market Implications
Chapter 10 Asia Pacific Wi-Fi as a Service Market Hotspots and Opportunities
- 10.1 Market Opportunity Mapping and Growth Hotspots
- 10.2 High-Growth Applications and Customer Groups
- 10.3 Underserved Markets and White-Space Opportunities
- 10.4 Emerging Technology and Product Opportunities
- 10.5 New Capacity and Investment Hotspots
- 10.6 Market Entry and Expansion Opportunities
- 10.7 Distribution and Partnership Opportunities
- 10.8 Near-Term and Long-Term Commercial Potential
- 10.9 Opportunity Attractiveness and Execution Risks
Chapter 11 Asia Pacific Wi-Fi as a Service Market Outlook, 2025-2035
- 11.1 Market Size and Analysis
- 11.1.1 Revenue (Market Measurement: 2025: USD 2.00 billion → 2035: USD 13.31 billion)
- 11.1.2 Historical Market Size, 2018-2025
- 11.1.3 Base-Year Market Size, 2025
- 11.2 Market Forecast, 2025-2035
- 11.2.1 Revenue Forecast to 2035
- 11.2.2 CAGR and Year-on-Year Growth
- 11.2.3 Incremental Revenue Opportunity
- 11.3 Forecast Assumptions and Scenario Analysis
- 11.3.1 Base-Case Forecast
- 11.3.2 Optimistic and Conservative Scenarios
- 11.3.3 Technology, Pricing and Policy Sensitivities
- 11.4 Market Attractiveness and Growth Outlook
Chapter 12 Asia Pacific Wi-Fi as a Service Market Segmentation and Outlook
- 12.1 Segmentation Summary and Market Shares, 2025
- 12.2 Largest and Fastest-Growing Segments
- 12.3 By Service Type - Market Size and Forecast, 2025-2035
- 12.3.1 Segment Definition and Scope
- 12.3.2 Historical Market Size, 2018-2025
- 12.3.3 Revenue Forecast, 2025-2035
- 12.3.4 Base-Year Market Share, 2025
- 12.3.5 Segment CAGR and Growth Drivers
- 12.3.6 Subsegment Market Size and Forecast
- 12.3.6.1 Cloud WLAN Subscriptions
- 12.3.6.2 Managed Wi-Fi Operations
- 12.3.6.3 Security and Experience Add-Ons
- 12.3.7 Subsegment Pricing and Adoption Trends
- 12.3.8 Leading Suppliers and Competition
- 12.3.9 Regional Demand and Opportunities
- 12.4 By Customer Type - Market Size and Forecast, 2025-2035
- 12.4.1 Segment Definition and Scope
- 12.4.2 Historical Market Size, 2018-2025
- 12.4.3 Revenue Forecast, 2025-2035
- 12.4.4 Base-Year Market Share, 2025
- 12.4.5 Segment CAGR and Growth Drivers
- 12.4.6 Subsegment Market Size and Forecast
- 12.4.6.1 Large Enterprises
- 12.4.6.2 Medium Enterprises
- 12.4.6.3 Small Enterprises
- 12.4.7 Subsegment Pricing and Adoption Trends
- 12.4.8 Leading Suppliers and Competition
- 12.4.9 Regional Demand and Opportunities
- 12.5 By End-Use Industry - Market Size and Forecast, 2025-2035
- 12.5.1 Segment Definition and Scope
- 12.5.2 Historical Market Size, 2018-2025
- 12.5.3 Revenue Forecast, 2025-2035
- 12.5.4 Base-Year Market Share, 2025
- 12.5.5 Segment CAGR and Growth Drivers
- 12.5.6 Subsegment Market Size and Forecast
- 12.5.6.1 Retail and Hospitality
- 12.5.6.2 Banking and Financial Services
- 12.5.6.3 Healthcare
- 12.5.6.4 Education and Government
- 12.5.6.5 Manufacturing
- 12.5.6.6 Logistics and Business Services
- 12.5.7 Subsegment Pricing and Adoption Trends
- 12.5.8 Leading Suppliers and Competition
- 12.5.9 Regional Demand and Opportunities
- 12.6 By Channel - Market Size and Forecast, 2025-2035
- 12.6.1 Segment Definition and Scope
- 12.6.2 Historical Market Size, 2018-2025
- 12.6.3 Revenue Forecast, 2025-2035
- 12.6.4 Base-Year Market Share, 2025
- 12.6.5 Segment CAGR and Growth Drivers
- 12.6.6 Subsegment Market Size and Forecast
- 12.6.6.1 Direct Vendor Sales
- 12.6.6.2 Telecom Operator Sales
- 12.6.6.3 MSP and Integrator Sales
- 12.6.7 Subsegment Pricing and Adoption Trends
- 12.6.8 Leading Suppliers and Competition
- 12.6.9 Regional Demand and Opportunities
- 12.7 Segment Growth Comparison
- 12.8 Segment Attractiveness and Priority Matrix
Chapter 13 Asia Pacific Wi-Fi as a Service End-Use and Application Market Outlook
- 13.1 End-Use Industry and Customer Demand Structure
- 13.2 Leading Applications and Customer Groups
- 13.3 End-Use Market Size, Share and Forecast
- 13.4 Major End-Use Industry Deep Dives
- 13.4.1 Customer Requirements and Use Cases
- 13.4.2 Demand and Replacement Cycles
- 13.4.3 Technical and Regulatory Considerations
- 13.4.4 Purchasing and Procurement Models
- 13.4.5 Leading Vendors and Distribution Channels
- 13.4.6 Forecast and Commercial Opportunities
- 13.5 Emerging Applications and Cross-Segment Demand
- 13.6 End-Use Industry Investment Priorities
Chapter 14 Asia Pacific Wi-Fi as a Service Geographic Market Outlook, 2025-2035
- 14.1 Regional Market Size and Country-Level Shares, 2025
- 14.2 Country Market Size Comparison, 2025
- 14.3 Country Market Forecasts, 2025-2035
- 14.4 Subregional Industrial and Demand Clusters
- 14.5 Intra-Regional Pricing and Cost Differences
- 14.6 Cross-Border Trade and Supply Networks
- 14.7 Regional Supply and Demand Balances
- 14.8 Country Opportunity Comparison and Prioritization
Note: Every listed country is covered on the structure shown under the first country.
Chapter 15 Asia Pacific Wi-Fi as a Service Technology, Innovation and Sustainability Outlook
- 15.1 Technology Landscape and Maturity
- 15.2 Product, Process and Service Innovation
- 15.3 AI, Automation and Digital Tools in the Industry
- 15.4 Technology Adoption and Performance Benchmarking
- 15.5 Innovation Pipeline and R&D Investment
- 15.6 Energy Efficiency and Resource Management
- 15.7 Sustainability, Recycling and Circularity
- 15.8 Technology Roadmap, 2025-2035
- 15.9 Risks of Obsolescence and Technology Substitution
Chapter 16 Asia Pacific Wi-Fi as a Service Market Key Strategic Imperatives
- 16.1 Growth and Market Entry Priorities
- 16.2 High-Return Products and Segments
- 16.3 Pricing, Profitability and Cost Optimization
- 16.4 Technology Investment and Product Differentiation
- 16.5 Supply Chain Localization and Resilience
- 16.6 Distribution and Customer Acquisition
- 16.7 Partnership, Acquisition and Capacity Strategy
- 16.8 Regional Expansion Priorities
- 16.9 Short-, Medium- and Long-Term Actions
Chapter 17 Competition Outlook
- 17.1 Industry Competition Characteristics
- 17.2 Market Structure and Concentration
- 17.3 Market Share and Competitive Positioning, 2025
- 17.4 Company-Wise Revenue and Product Benchmarking
- 17.5 Production and Service Capacity Benchmarking
- 17.6 Technology, Pricing and Differentiation
- 17.7 Regional Footprint and Distribution Strength
- 17.8 Mergers, Acquisitions and Strategic Alliances
- 17.9 New Entrants and Competitive Threats
- 17.10 Porter's Five Forces and Industry Attractiveness
- 17.11 Competitive Outlook, 2025-2035
Chapter 18 Company Profiles
- 18.1 Company Coverage and Selection Criteria
- 18.2 Huawei Technologies
- 18.2.1 Business Description
- 18.2.2 Company Ownership and Geographic Presence
- 18.2.3 Product and Service Portfolio
- 18.2.4 Manufacturing and Operating Footprint
- 18.2.5 Financial Performance and Investment
- 18.2.6 Market Share and Competitive Position
- 18.2.7 Technology and Innovation Capabilities
- 18.2.8 Strategic Alliances or Partnerships
- 18.2.9 Recent Developments
- 18.2.10 Growth Strategy and Outlook
- 18.3 Cisco Systems
- 18.4 HPE Aruba Networking
- 18.5 Singtel / NCS
- 18.6 Juniper Networks / Mist AI
- 18.7 Tata Communications
- 18.8 Extreme Networks
- 18.9 Ruijie Networks
- 18.10 CommScope / Ruckus Networks
- 18.11 Telstra
- 18.12 Other Relevant Market Participants
Note: Every listed company is profiled on the structure shown under the first company. The company list is preliminary and may change based on research findings, market developments, data availability and client requirements.
Chapter 19 Disclaimer
- 19.1 Research and Forecast Disclaimer
- 19.2 Data Source and Estimation Limitations
Note: The depth of individual sections depends on data availability for this market. Volume, capacity, trade and other unit-based metrics are included where applicable.

