
Carrier 5G and fiber upgrades anchor local test demand
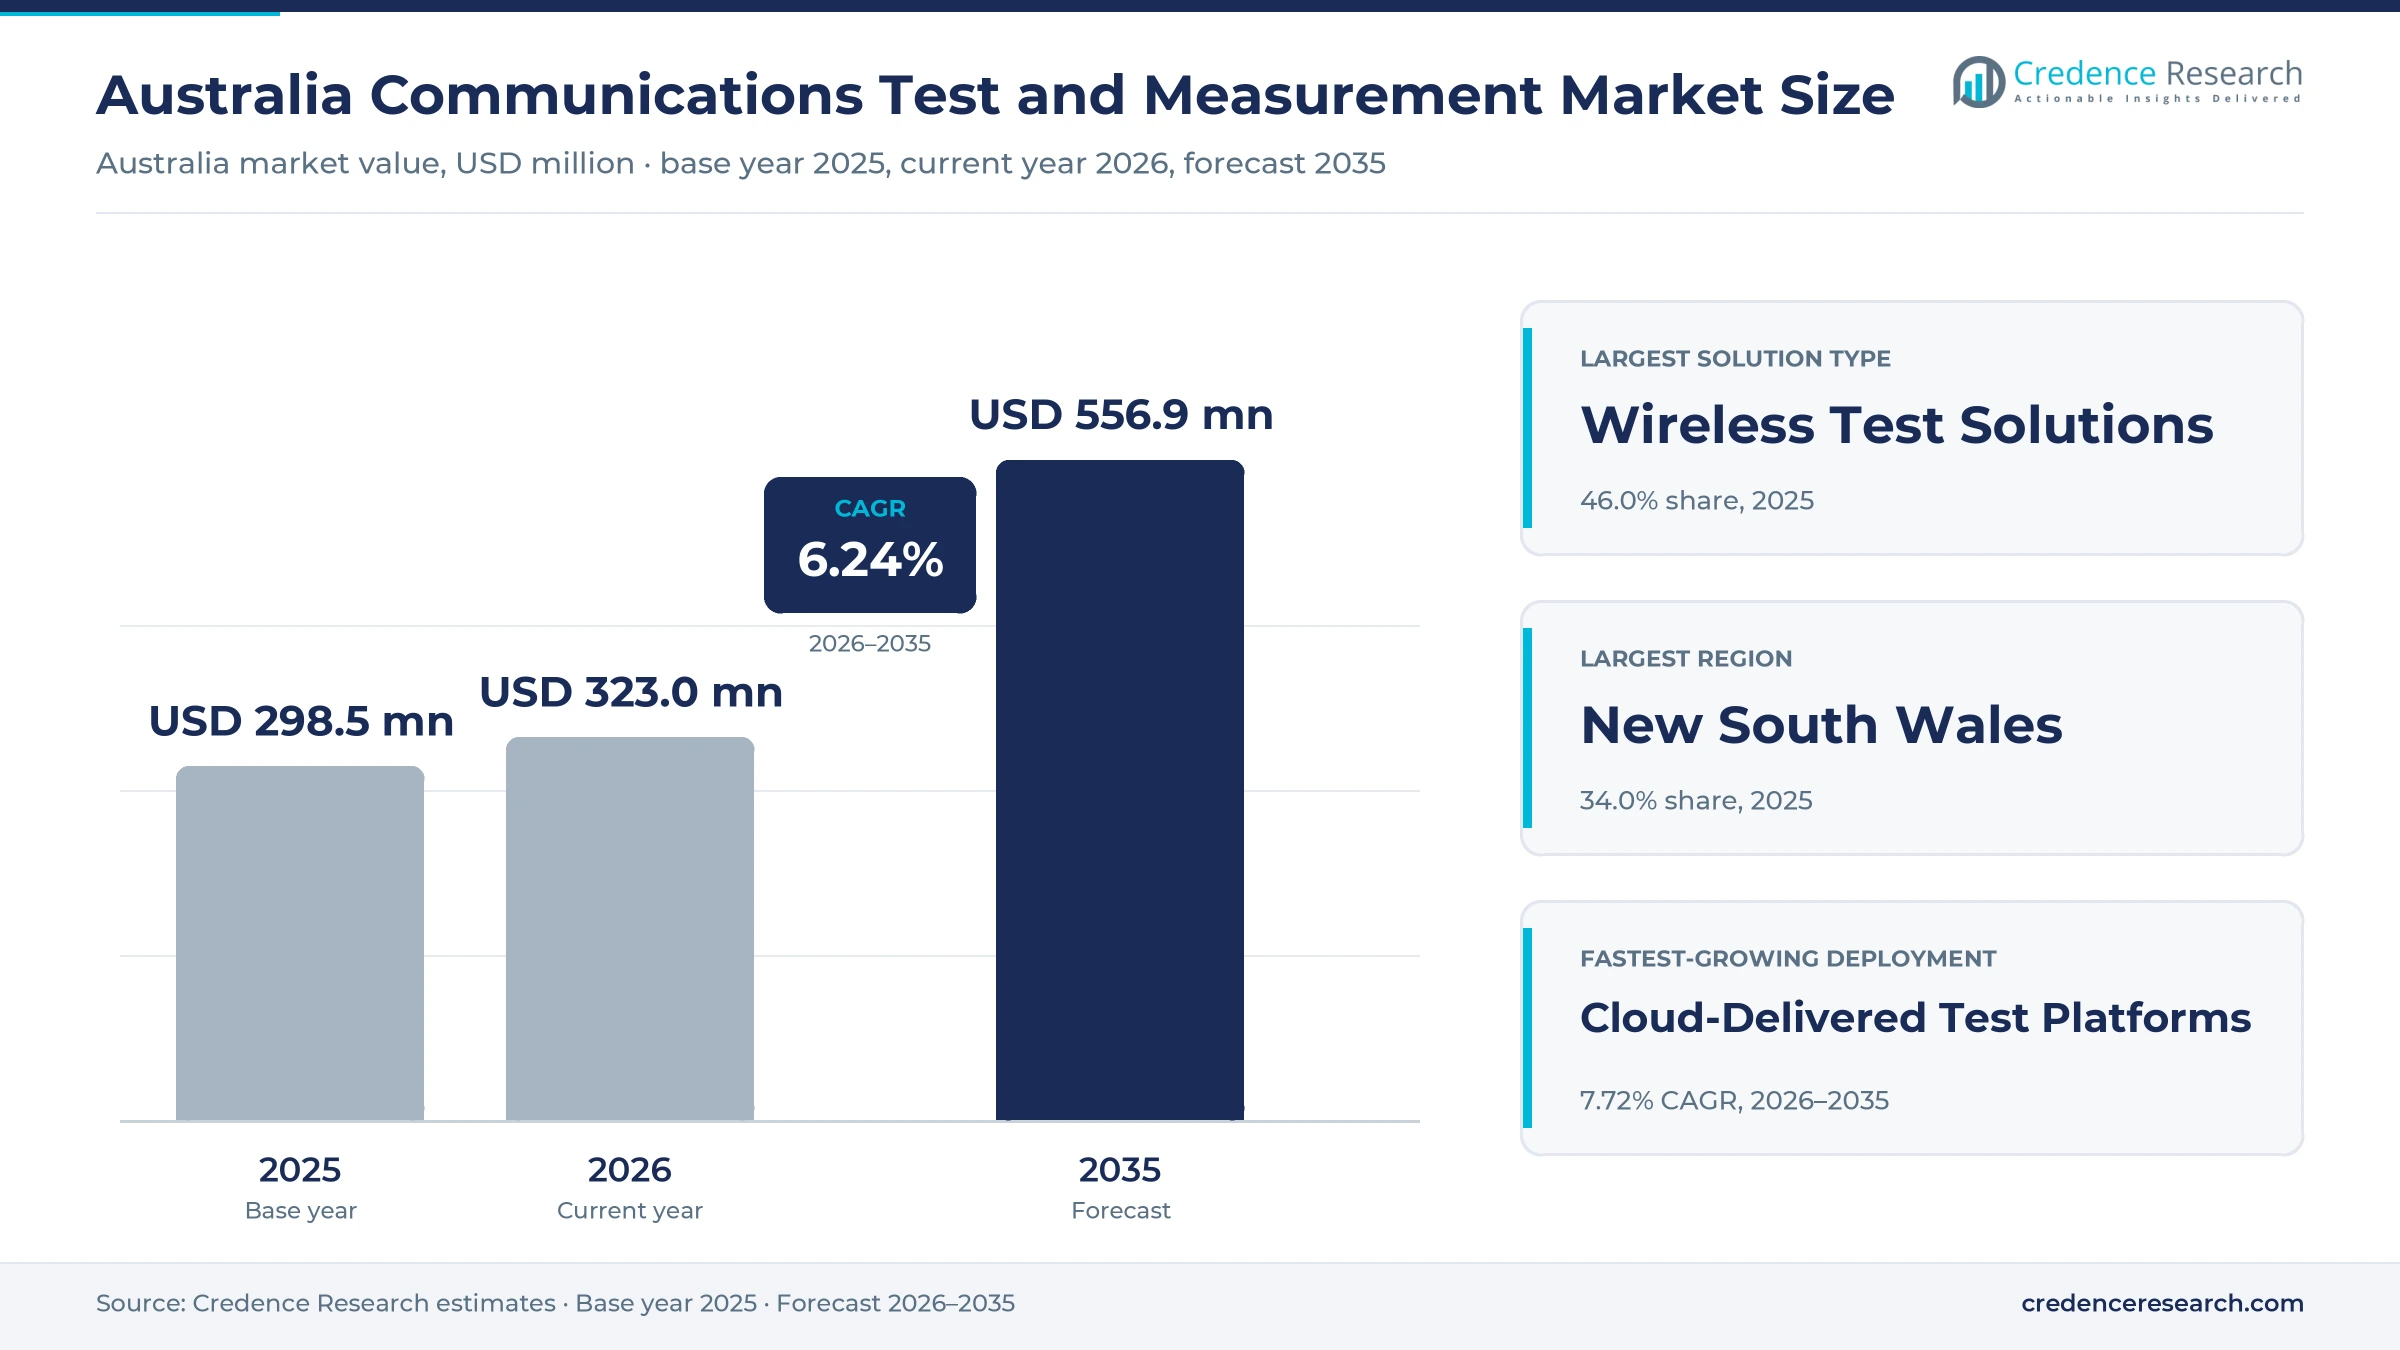
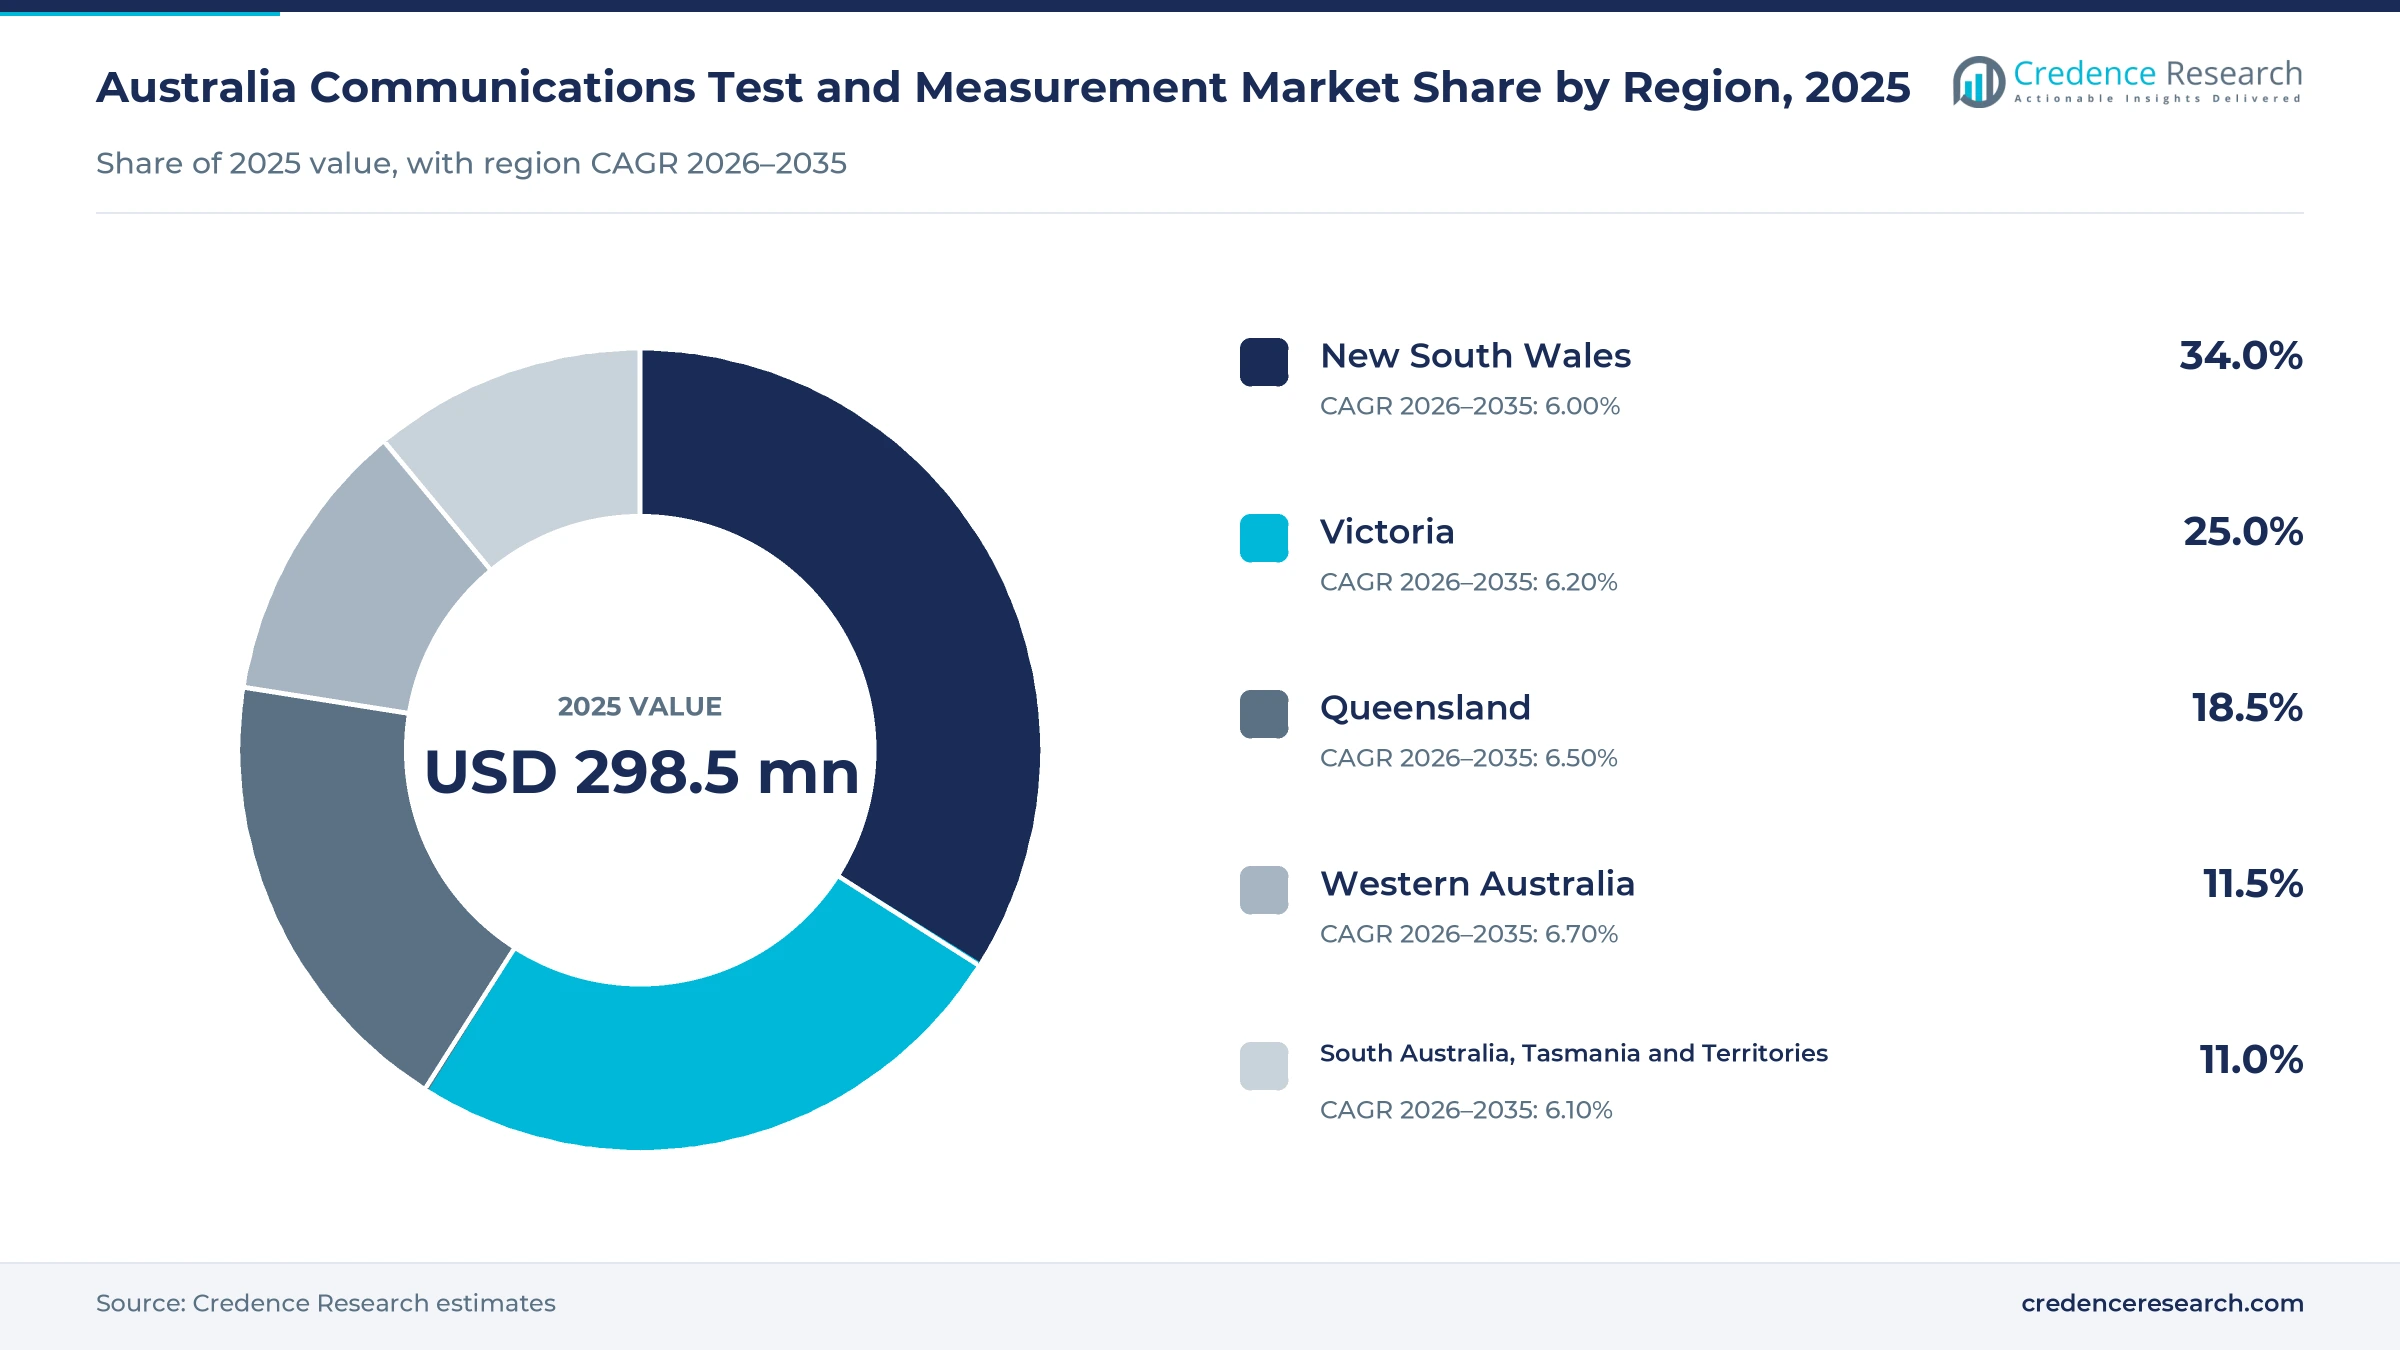
The Australia communications test and measurement market was valued at USD 298.5 million in 2025 and is projected to increase from USD 323.0 million in 2026 to USD 556.9 million by 2035, registering a CAGR of 6.24% during 2026–2035. Demand comes from mobile carriers that validate 5G radio and core networks, from fiber builders that certify new links before handover, from Defence programs that maintain radio and satellite systems, and from enterprises and labs that check equipment before deployment. New South Wales held the largest regional share, 34.0% in 2025, because the state has the largest fiber footprint, a major instrument maker's national base and a national telecom resilience lab. Western Australia is the fastest-growing region at 6.70% a year, as population growth and long fiber routes widen field work. At the same time, a mandatory testing code is set to require the three mobile network operators to run device and end-to-end emergency call tests every six months.
Which instruments and test services does the estimate count?
The estimate counts spending in Australia on wireless, wireline and optical test instruments, on network probes and assurance software, and on calibration, repair and contracted testing services bought for communications networks and equipment. Buyers include mobile and fixed carriers, wholesale fiber builders, Defence and other government agencies, enterprise IT teams, universities and equipment makers, who buy through capital purchases, subscriptions, rentals and project fees.
The estimate excludes general electronics test gear used outside communications, consumer speed apps and the value of the network equipment being tested. The value chain links global instrument makers, local distributors and calibration labs, carriers and their field contractors, Defence prime contractors and the regulators that set spectrum, emergency call and coverage rules.
Australia Communications Test and Measurement Market Insights
- The Australia communications test and measurement market was valued at USD 298.5 million in 2025 and is projected to reach USD 556.9 million by 2035, registering a CAGR of 6.24% during 2026–2035.
- New South Wales held 34.0% of 2025 value, because the state has the largest fiber footprint, instrument maker bases and a national resilience test lab.
- Wireless Test Solutions led solution types with a 46.0% share of 2025 value, because carriers keep validating 5G radio sites, spectrum and devices.
- NBN Co completed 806,000 fiber upgrades in the 2024-25 financial year, up 115%, and began the final stage of its FTTN upgrade program in September 2025.
- Cloud-delivered test platforms grow fastest at 7.72% a year during 2026–2035, as carriers move assurance and test control to remote software.
Wireless tools lead while cloud test platforms grow fastest
Why do wireless test solutions hold the largest share?
Based on solution type, the market is categorized into wireless test solutions, wireline and optical test solutions, and dedicated testing services. Wireless Test Solutions led with a 46.0% share of 2025 value, because carriers keep validating 5G radios, spectrum and handsets after the 3G closure. Dedicated Testing Services grow fastest at 6.61% a year, as Defence, carriers and regulators buy outsourced calibration, sustainment and compliance testing.
How fast are test platforms moving to the cloud?
Based on deployment model, the market is categorized into portable field platforms, fixed laboratory platforms, embedded assurance platforms and cloud-delivered test platforms. Portable Field Platforms led with a 38.0% share of 2025 value, because technicians still certify radio sites and fiber links on site. Cloud-Delivered Test Platforms grow fastest at 7.72% a year, as carriers control probes and test results from central software.
Which buyers spend the most on network testing?
Based on end-use industry, the market is categorized into Telecom Service Providers, Government and Defence, Enterprise IT and Communications Research and Manufacturing. Telecom Service Providers led with a 52.0% share of 2025 value, because mobile carriers and NBN Co run the largest field and lab programs. Government and Defence grows fastest at 6.74% a year, as Defence upgrades its radio, satellite and electronic warfare systems.
Where does assurance testing stand against field work?
Based on application, the market is categorized into field network test, lab and manufacturing test, network assurance test and enterprise test. Field Network Test led with a 36.0% share of 2025 value, because fiber upgrades and radio site work need technicians with handheld tools. Network Assurance Test grows fastest at 7.02% a year, as emergency call rules push carriers toward continuous monitoring and regular end-to-end tests.
| Segment Group | Leading Sub-segment | Share, 2025 | Fastest-growing Sub-segment | CAGR, 2026–2035 |
|---|---|---|---|---|
| By Solution Type | Wireless Test Solutions | 46.0% | Dedicated Testing Services | 6.61% |
| By Deployment Model | Portable Field Platforms | 38.0% | Cloud-Delivered Test Platforms | 7.72% |
| By End-Use Industry | Telecom Service Providers | 52.0% | Government and Defence | 6.74% |
| By Application | Field Network Test | 36.0% | Network Assurance Test | 7.02% |
Request a Free Sample
Fill in your details and we'll send you a free sample report.
- Sample data tables & charts
- Research methodology
5G validation, fiber upgrades and Defence radios lift spend
How does standalone 5G work raise wireless validation spend?
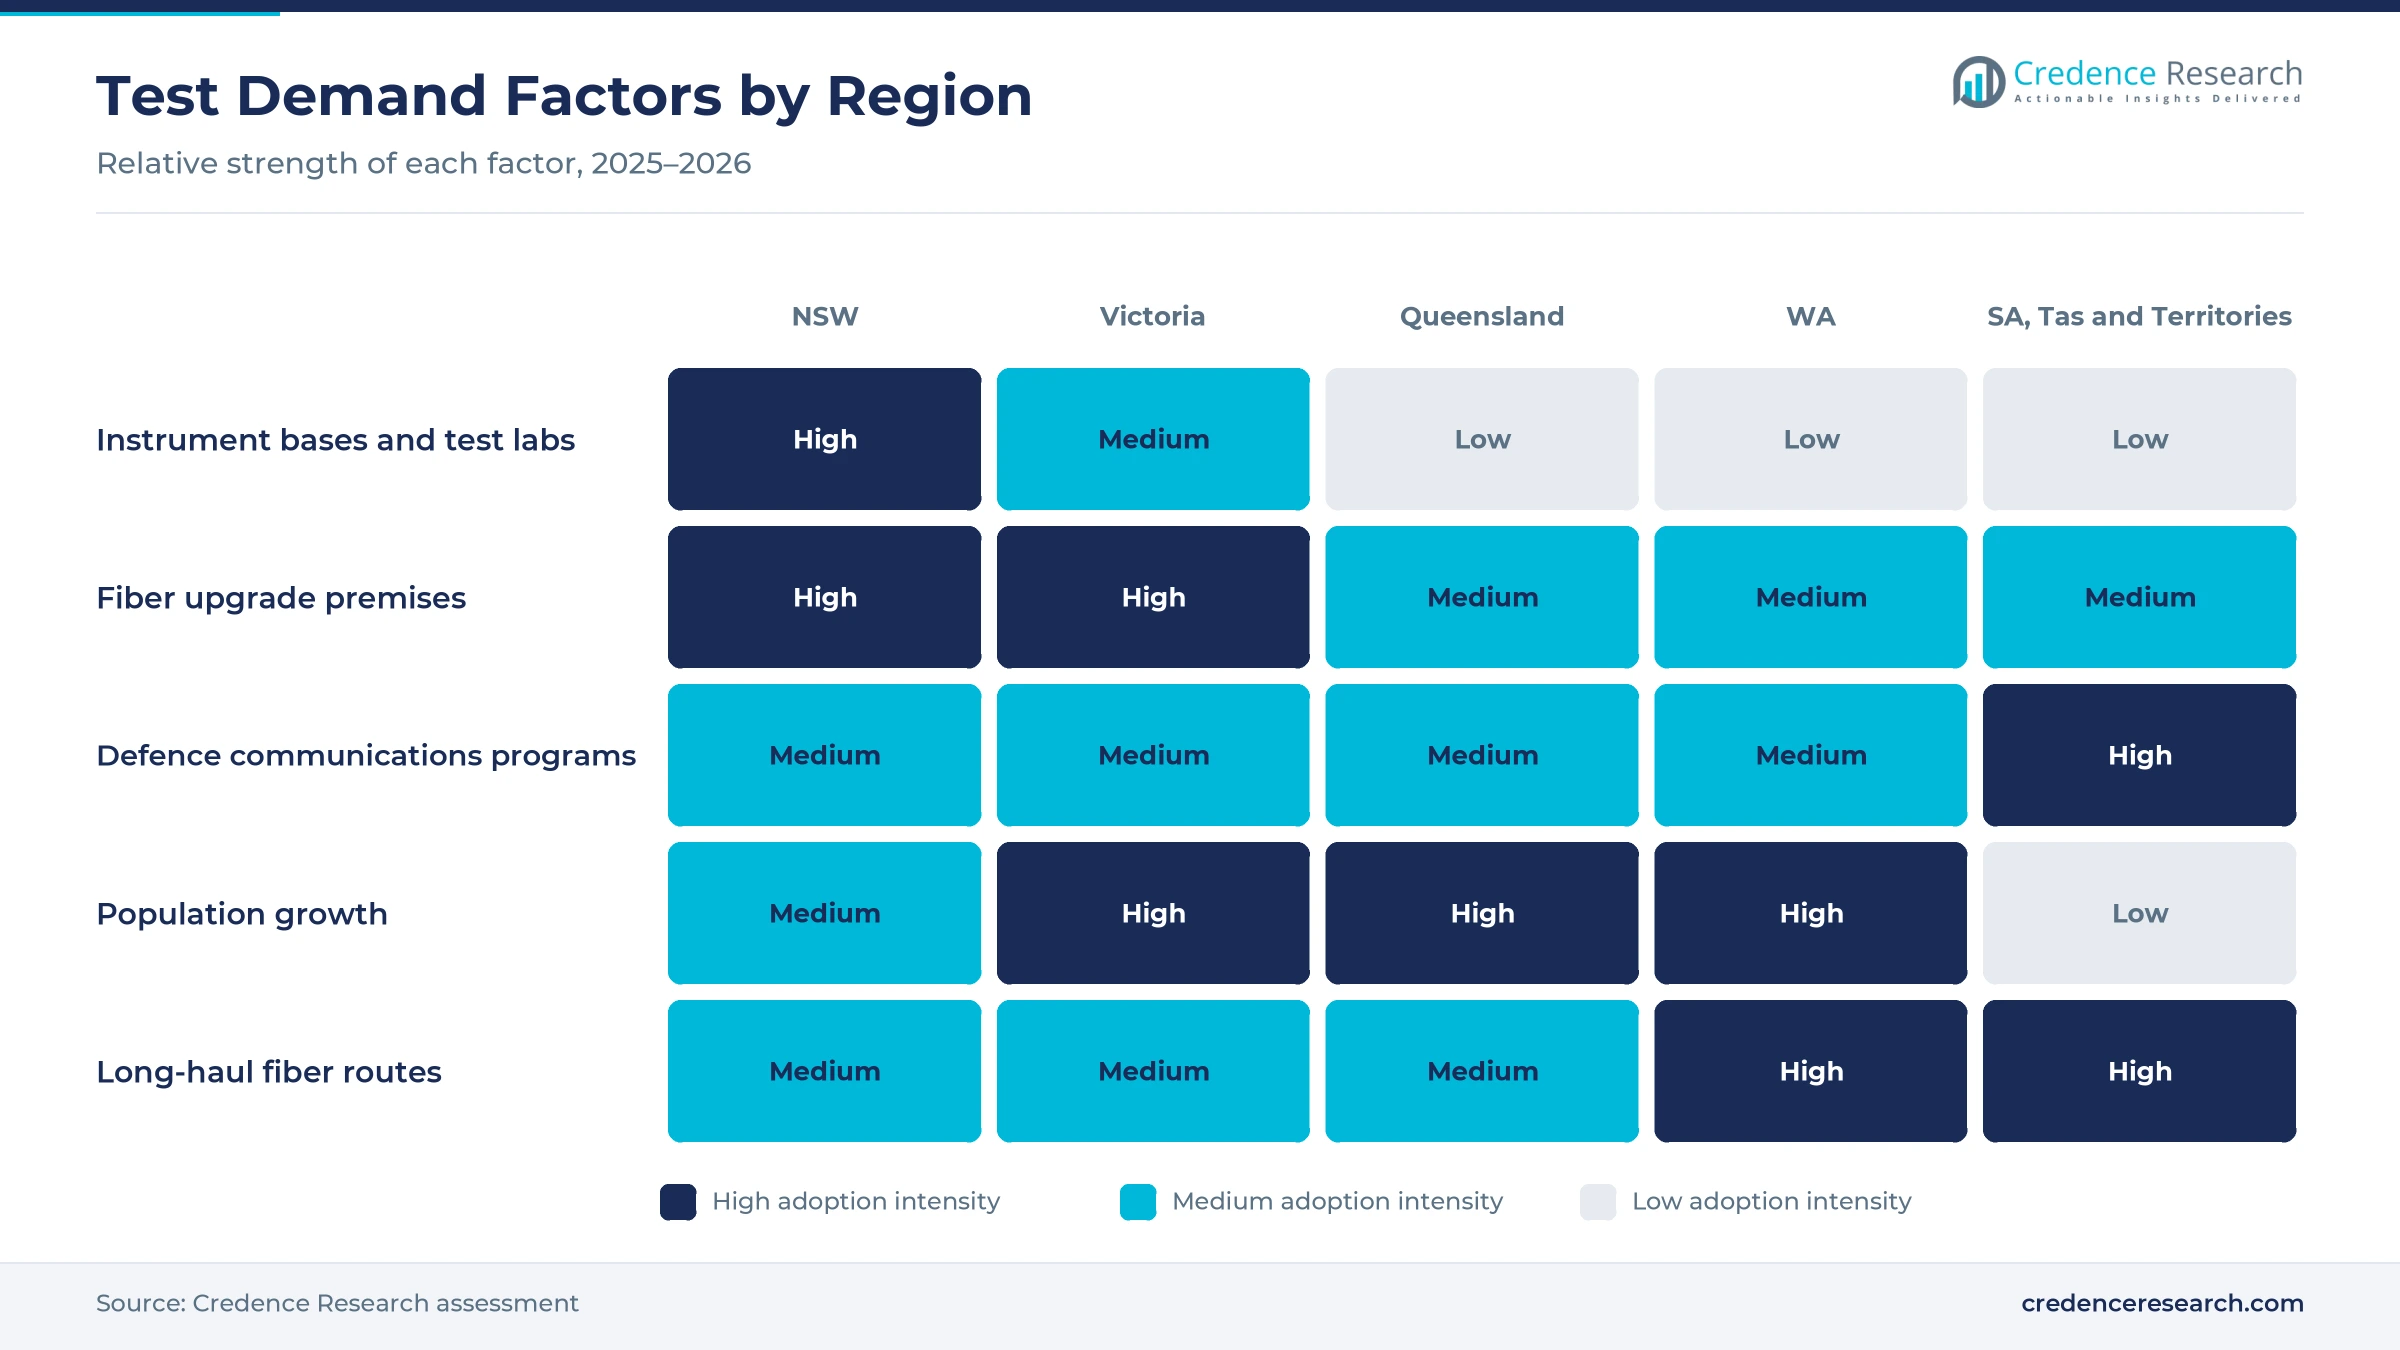
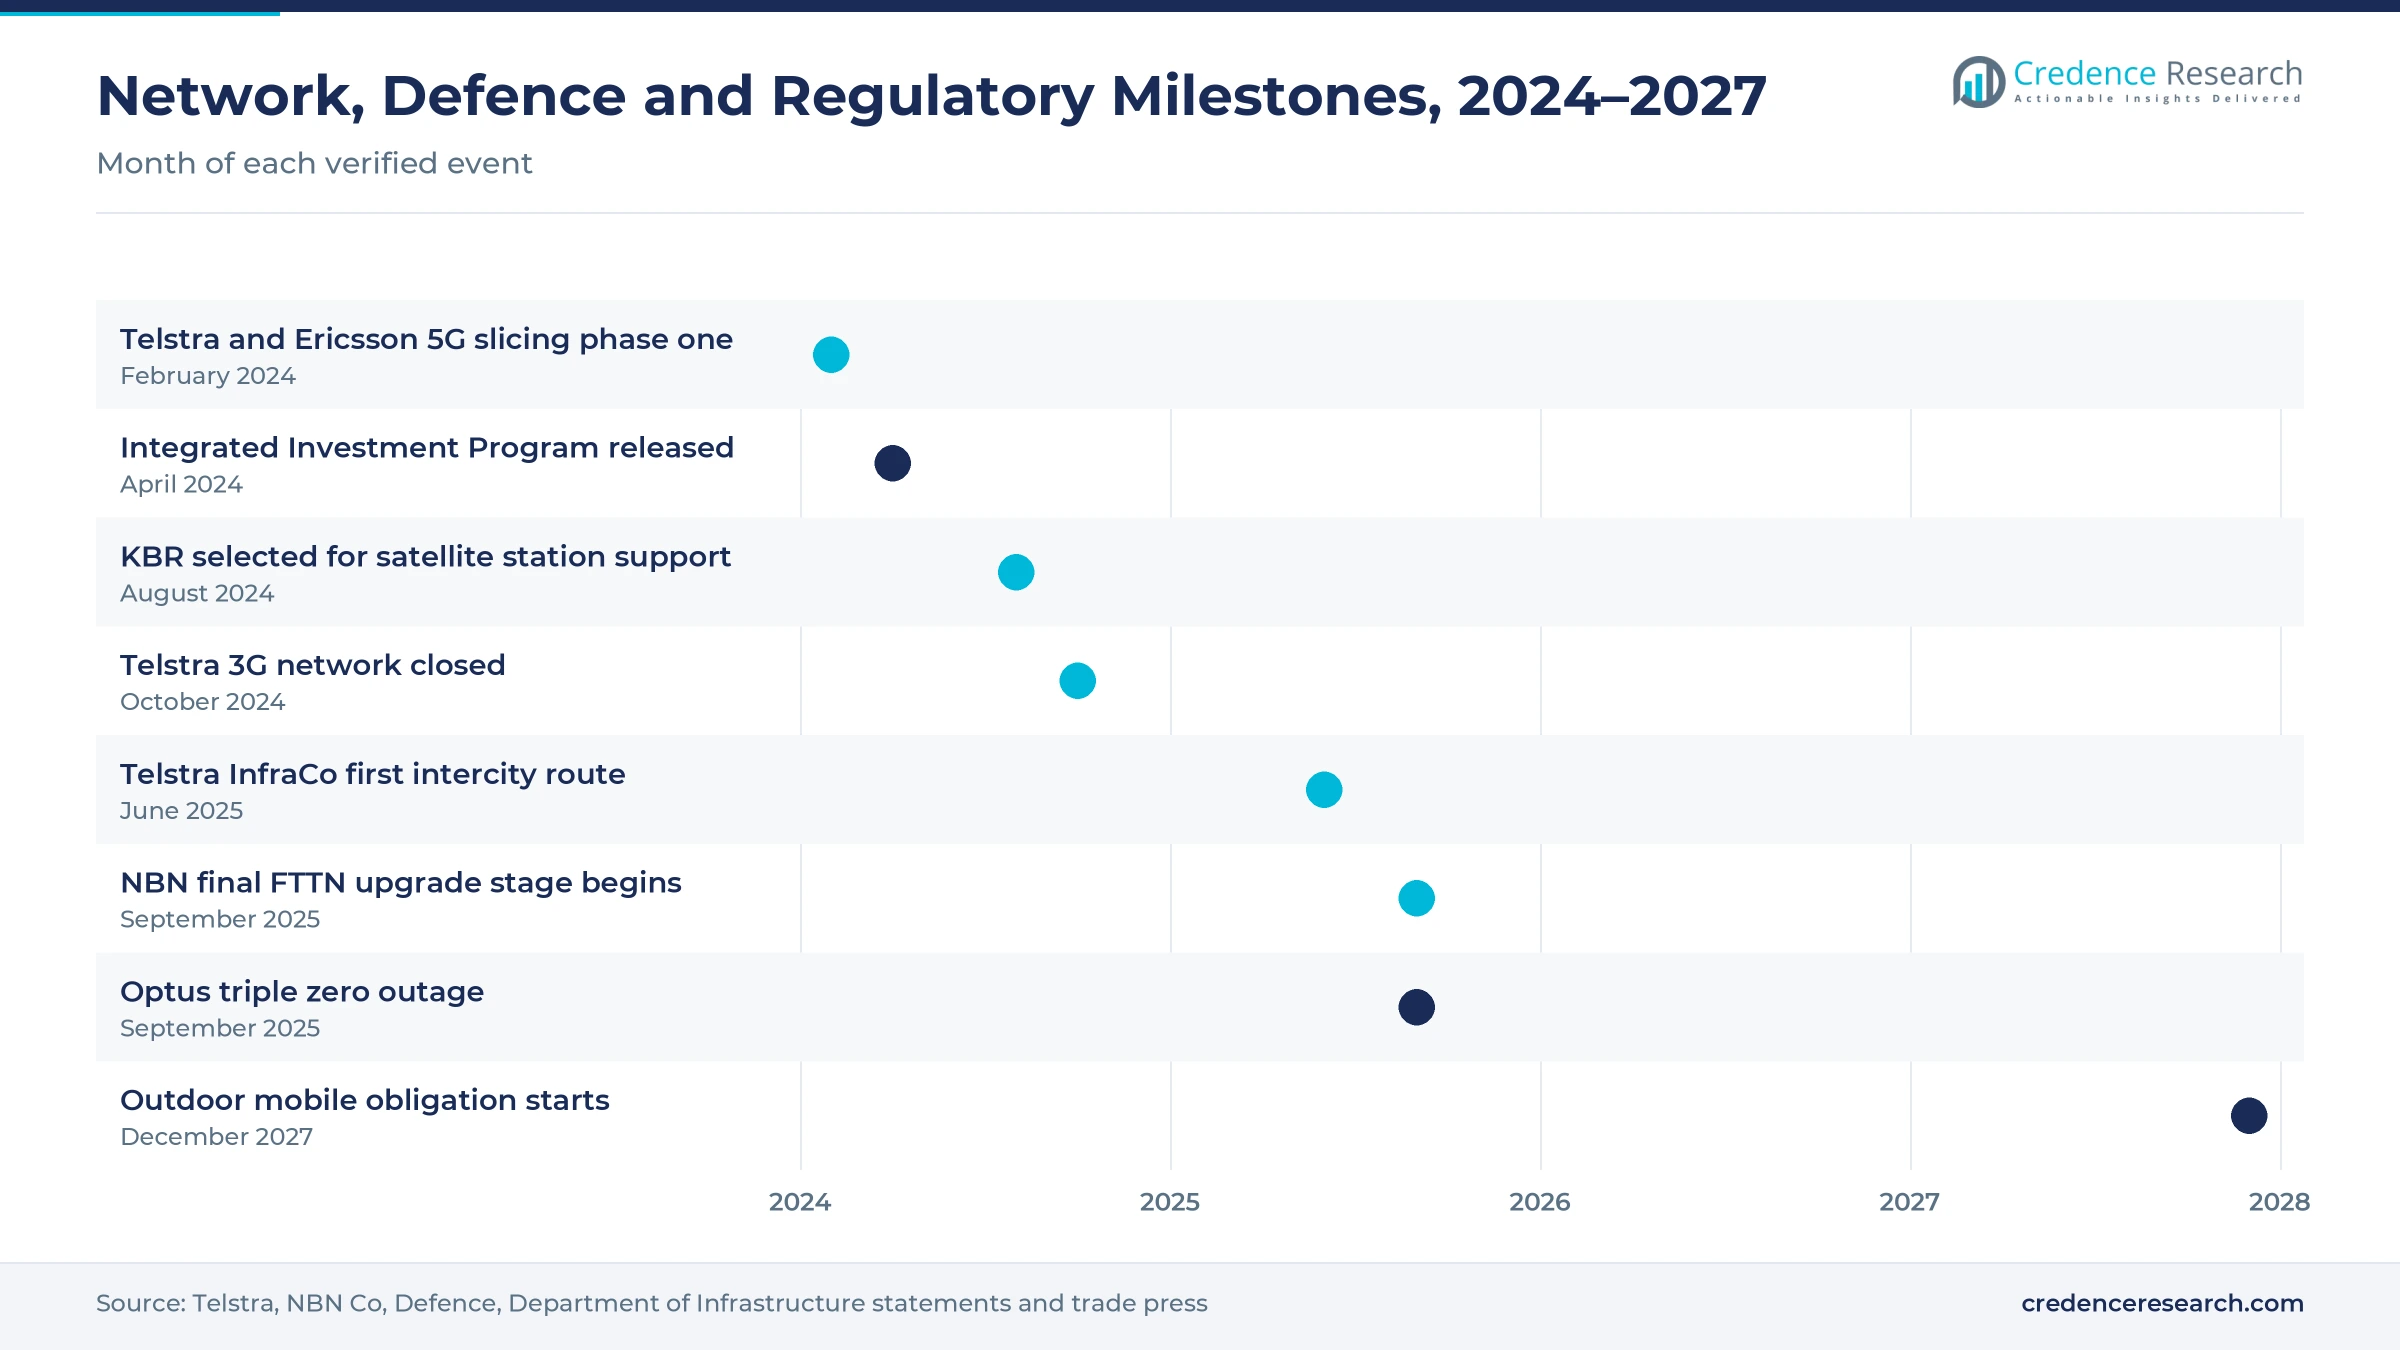
Carriers that move from shared 4G cores to standalone 5G must validate new radios, cores, slices and devices, which lifts spending on wireless analyzers and network emulators. Telstra, TPG, Optus and NBN Co won licenses in the 3.4 GHz and 3.7 GHz bands in an auction that raised A$721.8 million, according to the communications minister. Telstra closed its 3G network from Oct. 28, 2024, after upgrading 99% of 3G sites with 4G and 5G equipment. Ericsson and Telstra announced on Feb. 19, 2024, that they had completed the first phase of 5G network slicing. Australia recorded 112.6 mobile subscriptions per 100 people in 2024, according to the World Bank. As a result, carriers building 5G infrastructure keep wireless test solutions at 46.0% of 2025 value.
Why do fiber upgrades keep acceptance testing busy?
Every new fiber connection must be certified for loss, reflections and throughput before handover, so large upgrade programs keep field technicians and optical test sets busy. NBN Co began the final stage of its FTTN upgrade program in September 2025, covering about 622,000 remaining homes and businesses, more than half of them in regional areas, according to NBN Co. The company said fiber upgrades grew 115% to 806,000 in the 2024-25 financial year, while the FTTN program is backed by a federal equity investment of up to A$3 billion. Telstra InfraCo also opened its first intercity route between Sydney and Canberra in June 2025, after laying more than 4,000 km of fiber. In turn, demand for single-mode optical fiber and field certification rises together.
How does Defence radio sustainment widen test demand?
Defence must keep long-range radio, satellite and electronic warfare systems ready for decades, which creates steady work for calibration labs, repair centers and specialized test engineers. The 2024 Integrated Investment Program sets aside A$9 billion to A$12 billion for space, including resilient communications and A$2.7 billion to A$3.7 billion for electronic warfare over the decade, according to Defence. Babcock won an A$877 million, 10-year contract from October 2023 to run and upgrade the Defence High Frequency Communications System, according to Asian Military Review. KBR announced in August 2024 that it had been selected to sustain monitoring and control of satellite earth stations. As a result, Government and Defence grows at 6.74% a year, alongside wider defense MRO work.
Why do emergency call failures push carriers to retest?
Emergency call failures have turned regular end-to-end testing from good practice into a regulatory duty, which raises spending on assurance probes and device test labs. A firewall upgrade on the Optus network on Sept. 18, 2025, left more than 600 triple zero calls unconnected across several states, according to the department's Senate estimates statement. The same statement says a mandatory code will require the three mobile network operators to run device and end-to-end tests every six months. New emergency call rules on outage reporting and call transfer between networks also took effect on Nov. 1, 2025. In turn, carriers invest more in network monitoring, and network assurance test grows at 7.02% a year.
Satellite coverage, remote monitoring and resilience rules
How is the shift to satellite mobile coverage changing tests?
Direct-to-device satellite links are joining the mobile network, which shifts test work toward satellite links and handset checks. Parliament passed a law requiring Telstra, Optus and TPG Telecom to provide baseline outdoor voice and SMS services nationwide, starting Dec. 1, 2027, according to Light Reading. The same report says only about a third of the landmass now has terrestrial mobile coverage. Internet use reached 96.1% of Australians in 2024, according to World Bank data. The minister can adjust or defer the requirements until 2030, which gives carriers time to test satellite handsets and coverage before the rules apply. As a result, wireless test solutions gain device and coverage work, especially in Western Australia, where population rose 2.1% in the year to March 2026.
Why is the rise of remote fiber monitoring reshaping field work?
Remote monitoring systems watch fiber continuously from central sites, which shifts work from truck rolls to software alarms and targeted repairs. NBN Co uses an EXFO remote fiber testing and monitoring system on a backbone of more than 70,000 km, covering more than 90% of its transit network in real time, according to EXFO. The same case study says NBN Co built about 280,000 km of fiber in just over a decade. Telstra InfraCo plans to connect all mainland capital cities with its new intercity network by the end of fiscal 2027, according to Telstra. In turn, embedded assurance and cloud-delivered platforms grow faster than portable tools, with the cloud model at 7.72% a year.
Can gigabit home upgrades open new test openings?
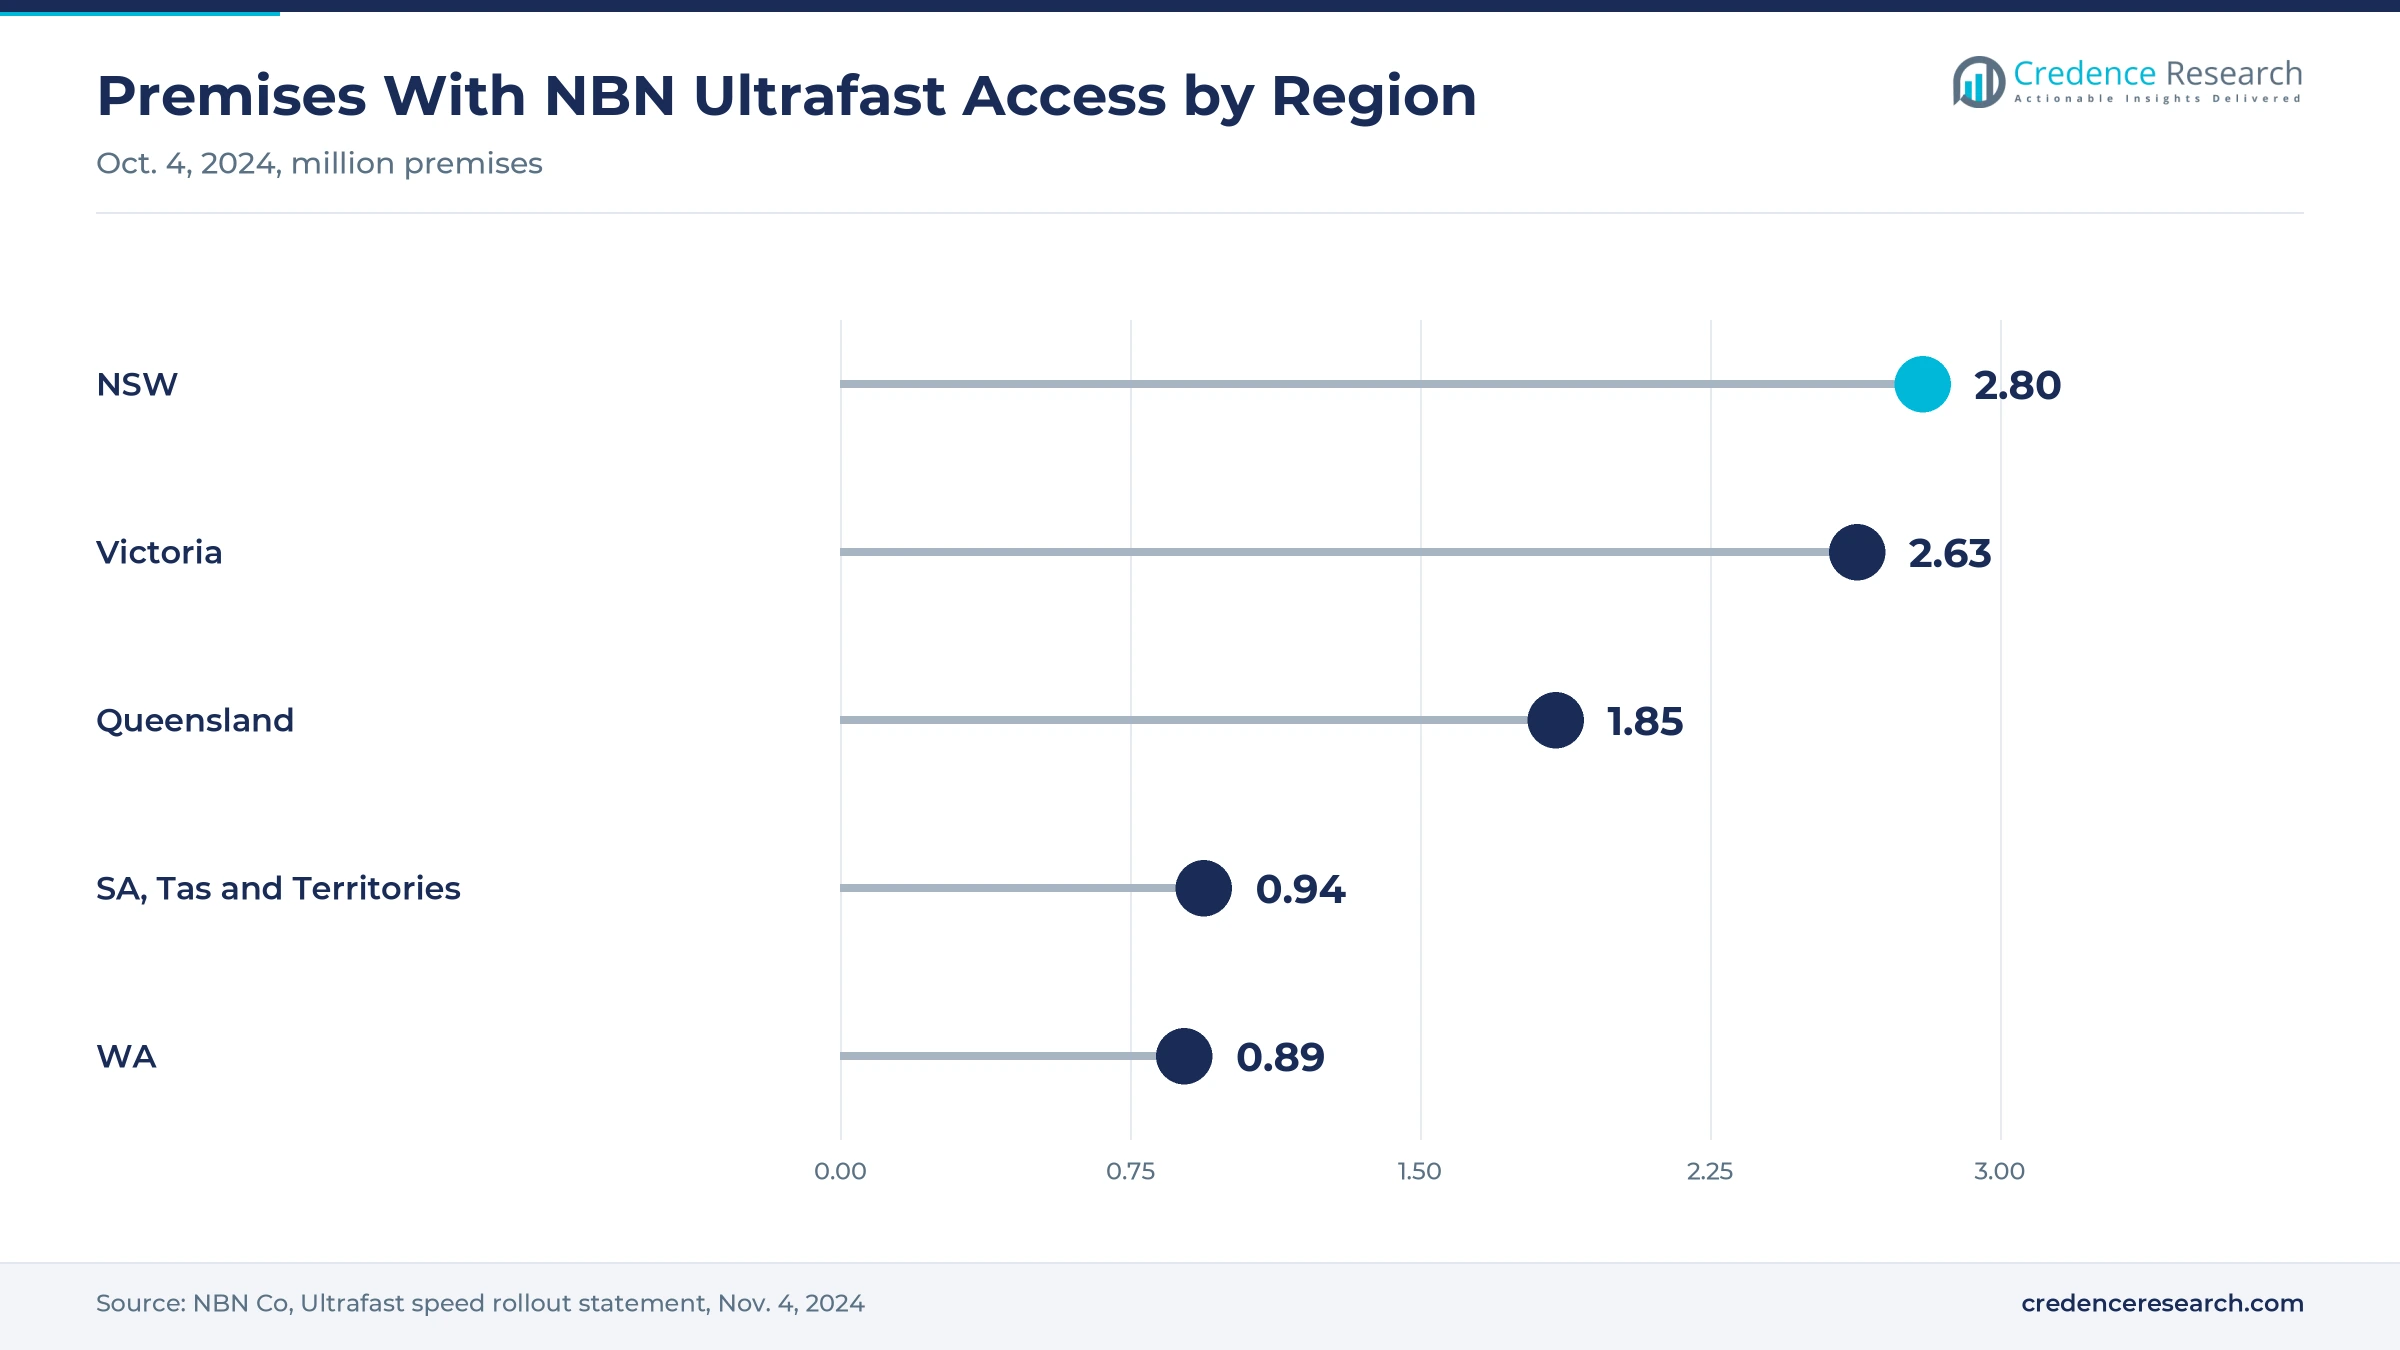
Faster home and business plans open demand for testing optical terminals, Wi-Fi gear and wholesale speed tiers before carriers sell them. NBN Co said on Nov. 4, 2024, that more than 9 million homes and businesses could access its Ultrafast speeds, with about 2.8 million of those premises in New South Wales. The company also expects about 11 million premises, roughly 94% of its fixed line footprint, to reach the fastest wholesale tiers by 2030. Households averaged 22 connected devices and 443 GB of data a month, according to the same NBN Co statement. As a result, lab and enterprise test teams gain steady work as retailers launch faster plans and equipment makers certify new home gateways.
Is there an opening in onshore calibration and repair?
Defence and carriers prefer to calibrate and repair instruments inside Australia, which opens room for local service labs and longer support contracts. Rohde & Schwarz Australia runs a NATA-accredited repair and calibration center at North Ryde and is an Authorized Engineering Organization for the Royal Australian Air Force, according to Australian Defence Magazine. Keysight acquired Thales Calibration Services in Melbourne in 2018, which RCR Wireless said made it the largest calibration and support provider in Australia. Babcock's 10-year HF contract began in October 2023, and Ventia won about A$64 million of work over five years from January 2023 to install antennas for the Defence HF upgrade. In turn, dedicated testing services grow at 6.61% a year, the fastest solution type.
Carrier capex limits, skills gaps and imports test buyers
How do carrier spending limits slow instrument orders?
Mobile carriers buy most instruments, so a slowdown in their network budgets quickly delays new analyzer and emulator orders. Once national 5G coverage reaches its targets, carriers move spending from new sites to maintenance, which lowers demand for expensive lab gear. As a result, vendors face lumpy orders tied to a few large buyers. Many respond with rentals, subscriptions and managed test services that spread costs over several years and keep tools in use across more projects.
Why do skills gaps limit test capacity?
Radio, fiber and Defence test work needs certified technicians and engineers, and the same people are sought by carriers, builders and prime contractors at once. In turn, field programs slow when several large upgrades run in parallel across regional areas. Vendors and contractors respond with training, remote expert support and automated test scripts that let less experienced staff finish routine jobs safely, while senior engineers focus on complex radio and Defence work.
How do imported instruments raise costs for buyers?
Most high-end analyzers, emulators and optical test sets are designed and built overseas and priced in foreign currencies, which makes them expensive when the Australian dollar weakens. As a result, smaller contractors and enterprise teams delay upgrades or keep older tools in service longer. Rental pools and local distributors ease this pressure, although they add ongoing service charges that smaller buyers must budget for carefully over several years.
Why do long distances strain field test programs?
Remote mines, towns and Defence sites sit far from major cities, so each field test visit costs more in travel time and vehicles than in dense urban areas. In turn, carriers and builders bundle tests into larger trips and accept longer gaps between checks. Remote monitoring and satellite backhaul reduce this burden, but they need up-front investment that smaller carriers and contractors often struggle to fund on their own.
Sydney fiber scale leads as Perth population lifts growth
| Region | Value, 2025 (USD million) | Share, 2025 | CAGR, 2026–2035 |
|---|---|---|---|
| New South Wales | 101.5 | 34.0% | 6.00% |
| Victoria | 74.6 | 25.0% | 6.20% |
| Queensland | 55.2 | 18.5% | 6.50% |
| Western Australia | 34.3 | 11.5% | 6.70% |
| South Australia, Tasmania and Territories | 32.8 | 11.0% | 6.10% |
New South Wales leads on fiber scale and test labs
New South Wales held 34.0% of 2025 value and grows at 6.00% a year, because the state has the largest fiber footprint, instrument maker bases and a national resilience lab. Rohde & Schwarz Australia runs its headquarters and accredited calibration center at North Ryde. The University of Technology Sydney hosts the National Telecom Resilience Centre, where Telstra, Optus and TPG supply cell site equipment for twice-yearly device tests. The state also had about 8.67 million residents in March 2026, according to the Australian Bureau of Statistics.
How do Melbourne labs support Victoria?
Victoria held 25.0% of 2025 value and grows at 6.20% a year, because Melbourne combines a large fiber footprint with calibration and instrument businesses. Keysight bought Thales Calibration Services in Melbourne in 2018, and Anritsu runs its Australian business from Victoria. About 2.63 million homes and businesses in the state could access NBN Ultrafast speeds in October 2024. The state population grew 1.6% in the year to March 2026, which keeps new connection work steady.
Why does Queensland add strong field test demand?
Queensland held 18.5% of 2025 value and grows at 6.50% a year, because long coastal and inland networks need frequent field testing. About 1.85 million homes and businesses in the state could access NBN Ultrafast speeds in October 2024. Rohde & Schwarz Australia also keeps an office in Brisbane, which places local support close to field teams. The state population rose 1.6% in the year to March 2026, which adds new sites, links and upgrade work.
How do long Perth routes lift western test demand?
Western Australia held 11.5% of 2025 value and grows fastest at 6.70% a year, because population growth and long fiber routes widen field test work. The state population rose 2.1% in the year to March 2026, the fastest of any state, according to the Australian Bureau of Statistics. Telstra InfraCo is building intercity routes from Perth to Adelaide and Sydney. As a result, field technicians and remote monitoring tools see rising demand across the state.
How do Defence sites shape the remaining states and territories?
South Australia, Tasmania and Territories held 11.0% of 2025 value and grows at 6.10% a year, because Defence programs and remote links add specialized work. Rohde & Schwarz Australia has offices in Canberra and Adelaide and is a partner on the Hunter Class frigate communications system. Telstra InfraCo is also building an Adelaide to Darwin route. These zones had about 3.26 million residents in March 2026.
Network, Defence and regulatory moves mark 2024 to 2026
| Development | Status and market relevance |
|---|---|
| In February 2024, Ericsson and Telstra completed the first phase of 5G network slicing for Australian enterprises. | Added standalone 5G validation work |
| In August 2024, KBR was selected to sustain monitoring and control of Defence satellite earth stations. | Extended Defence satellite sustainment |
| In October 2024, Telstra closed its 3G network after upgrading 99% of 3G sites with 4G and 5G equipment. | Shifted testing to 4G and 5G |
| In June 2025, Telstra InfraCo opened the Sydney to Canberra route, the first of its new intercity fiber network. | Started long-haul acceptance testing |
| In September 2025, NBN Co began the final stage of its FTTN upgrade program for about 622,000 premises. | Extended fiber certification work |
Handheld analyzers and remote probes shape test work
- Handheld radio analyzers measure signal strength, interference and 5G beam performance at sites, which lets field teams find faults before a site goes live.
- Optical time domain reflectometers trace loss and breaks along a fiber, which lets technicians certify links and locate faults in a single visit.
- Remote fiber monitoring systems watch backbone fibers continuously from a central site, which lets operators send crews only where a fault has occurred.
- Network and device emulators reproduce cores, cells and failure scenarios in the lab, which lets carriers and makers test handsets and emergency calls before release.
Need a Custom Version of This Report?
Tailor the scope, geography, or segments to your exact requirements.
- Custom geography or segment scope
- Direct access to our analyst team
Global instrument makers compete on local support
Competition is led by global instrument makers that rely on local offices, distributors and calibration labs to support Australian buyers. Rohde & Schwarz Australia, established in 1981, runs its headquarters and an accredited calibration center at North Ryde and supports Defence radio and frigate programs. Keysight Technologies sells through Rapid-Tech Equipment and Leda Electronics, which together cover the whole country, and runs a calibration business in Melbourne. EXFO supplies remote fiber monitoring on the NBN Co backbone, while VIAVI Solutions supplied Telstra with handheld 100G testers for installation and maintenance work. Anritsu runs its Australian business from Victoria and sells wireless and optical test tools. Rivals compete on accuracy, local calibration, field support, software features and flexible pricing.
Which instrument makers shape Australian network testing?
| Company | Type | Role in the market |
|---|---|---|
| Rohde & Schwarz Australia | Instrument maker and integrator | Runs North Ryde calibration center and supports Defence radio programs |
| Keysight Technologies | Instrument maker | Sells through national distributors and runs Melbourne calibration work |
| EXFO | Optical test vendor | Supplies remote fiber monitoring for the NBN Co backbone |
| VIAVI Solutions | Network test vendor | Supplied handheld 100G testers to Telstra |
| Anritsu | Instrument maker | Runs its Australian business from Victoria |
Credence Research view on Australian network testing
Credence Research's view is that Australian demand for communications test tools and services will keep rising because carriers, NBN Co and Defence are all in long upgrade cycles at once. Wireless tools remain the largest spending pool, yet growth increasingly comes from services, remote assurance and cloud-delivered testing that meet new emergency call and coverage rules. Vendors that combine local calibration, field support and software subscriptions should gain share as buyers move from one-off purchases to ongoing contracts.
How the instrument and services estimate was built
The report uses 2025 as the base year on a calendar basis, and market values come from the Credence Research model. That model combines network rollout figures, spectrum and Defence program data, population statistics, regulatory rules and company releases. Region shares and growth rates and segment splits are Credence Research estimates built from state population, fiber premises by state and the location of carriers, Defence sites and test labs. Sources used are government, statistical agency, international organization, trade press and company publications, and no interviews or surveys were used.
Resilience rules and satellite links drive growth to 2035
The Australia communications test and measurement market is expected to reach USD 556.9 million by 2035, a 6.24% CAGR during 2026–2035, as 5G, fiber, satellite and Defence programs keep test teams busy. Growth should be strongest in dedicated testing services, cloud-delivered platforms, network assurance and Western Australia, because these groups gain most from resilience rules, remote monitoring and long new routes. Demand for 5G fixed wireless access will also add radio test work in regional areas.
Frequently Asked Questions
How big is the Australia communications test and measurement market?
Which solution type leads spending?
Which region leads the market?
How many fiber upgrades did NBN Co complete?
How do emergency call rules affect testing?
How does Defence spending affect the market?
Who are the leading companies in the market?
What are the main challenges for the market?
Table of Content
Chapter 1 Market Segmentation
- 1.1 Segmentation Framework
- 1.1.1 Product and Service Classification
- 1.1.2 Application and End-Use Classification
- 1.1.3 Technology and Solution Classification
- 1.1.4 Customer and Distribution Channel Classification
- 1.1.5 Geographic Segmentation
- 1.1.6 Market Segment Definitions and Boundaries
- 1.2 By Solution Type
- 1.2.1 Wireless Test Solutions
- 1.2.2 Wireline and Optical Test Solutions
- 1.2.3 Dedicated Testing Services
- 1.3 By Deployment Model
- 1.3.1 Portable Field Platforms
- 1.3.2 Fixed Laboratory Platforms
- 1.3.3 Embedded Assurance Platforms
- 1.3.4 Cloud-Delivered Test Platforms
- 1.4 By End-Use Industry
- 1.4.1 Telecom Service Providers
- 1.4.2 Government and Defence
- 1.4.3 Enterprise IT
- 1.4.4 Communications Research and Manufacturing
- 1.5 By Application
- 1.5.1 Field Network Test
- 1.5.2 Lab and Manufacturing Test
- 1.5.3 Network Assurance Test
- 1.5.4 Enterprise Test
Chapter 2 Introduction
- 2.1 Report Objectives and Scope
- 2.2 Product Definition and Industry Terminology
- 2.3 Market Inclusions and Exclusions
- 2.4 Research Process
- 2.4.1 Primary Research and Expert Interviews
- 2.4.2 Secondary Research and Source Review
- 2.4.3 Top-Down and Bottom-Up Estimation
- 2.4.4 Data Triangulation and Verification
- 2.5 Market Size Measurement Basis
- 2.5.1 2025: USD 298.5 million → 2035: USD 556.9 million
- 2.6 Historical and Forecast Reference Periods
- 2.6.1 Historical Period: 2018-2025
- 2.6.2 Base Year: 2025
- 2.6.3 Forecast Period: 2025-2035
- 2.7 Research Assumptions and Limitations
Chapter 3 Executive Summary
- 3.1 Market Snapshot and Key Findings
- 3.2 Base-Year Market Size, 2025
- 3.3 Forecast Market Size, 2035
- 3.4 Revenue and Volume Growth Outlook
- 3.5 Key Demand and Supply Indicators
- 3.6 Leading Market Segments
- 3.7 Fastest-Growing Market Opportunities
- 3.8 Regional Performance Highlights
- 3.9 Technology and Industry Transformation
- 3.10 Competitive Landscape Summary
- 3.11 Analyst View and Strategic Implications
Chapter 4 Australia Communications Test and Measurement Market Trends and Developments
- 4.1 Historical Industry Development, 2018-2025
- 4.2 Recent Market Trends and Developments
- 4.3 Demand and Customer Behavior Trends
- 4.4 Technology and Product Innovation
- 4.5 Artificial Intelligence, Automation and Digitalization
- 4.6 Local Manufacturing and Supply Chain Realignment
- 4.7 Industry Partnerships, Mergers and Acquisitions
- 4.8 Sustainability and Circular Economy Developments
- 4.9 Government and Private Sector Investment Trends
- 4.10 Emerging Business Models and Commercialization
- 4.11 Industry Developments and Announcements
Chapter 5 Australia Communications Test and Measurement Market Production, Supply and Demand Analysis
- 5.1 Demand Trend and Consumption Analysis, 2018-2025
- 5.2 Demand Forecast, 2025-2035
- 5.3 Production and Output Trend, 2018-2025
- 5.4 Production and Output Forecast, 2025-2035
- 5.5 Installed Capacity and Capacity Utilization
- 5.6 Company-Wise Production Plants and Statistics
- 5.6.1 Installed Production Capacity
- 5.6.2 Actual Production
- 5.6.3 Planned Capacity and Expansion Targets
- 5.7 Supply Chain Structure and Procurement Trends
- 5.8 Supply-Demand Gap and Bottlenecks
- 5.9 Import Dependence and Sourcing Structure
- 5.10 Contract Manufacturing and Outsourcing
- 5.11 Regional Supply and Demand Concentration
Chapter 6 Australia Communications Test and Measurement Market Pricing Analysis
- 6.1 Pricing Structure and Measurement
- 6.2 Historical Pricing Trends, 2018-2025
- 6.3 Pricing Outlook, 2025-2035
- 6.4 Average Selling Price and Unit Economics
- 6.5 Pricing by Product and Market Segment
- 6.6 Geographic Pricing Differences
- 6.7 Key Input, Energy, Labor and Logistics Costs
- 6.8 Contract Pricing and Purchasing Models
- 6.9 Pricing Sensitivity and Competitive Positioning
- 6.10 Price, Margin and Profitability Implications
Chapter 7 Australia Communications Test and Measurement Market Dynamics
- 7.1 Market Growth Drivers
- 7.1.1 Demand-Side Drivers
- 7.1.2 Technology and Innovation Drivers
- 7.1.3 Infrastructure and Investment Drivers
- 7.1.4 Regulatory and Policy Drivers
- 7.2 Market Restraints
- 7.2.1 Cost and Affordability Constraints
- 7.2.2 Technology and Adoption Barriers
- 7.2.3 Supply Chain and Operational Constraints
- 7.3 Market Challenges
- 7.3.1 Competitive Pressure and Margin Erosion
- 7.3.2 Skills, Infrastructure and Implementation Gaps
- 7.4 Emerging Market Opportunities
- 7.5 Market Dynamics Impact and Time-Horizon Assessment
Chapter 8 Australia Communications Test and Measurement Value Chain Analysis
- 8.1 Industry Value Chain Overview
- 8.2 Upstream Suppliers and Critical Inputs
- 8.3 Technology and Component Providers
- 8.4 Manufacturing or Service Delivery
- 8.5 Distribution, Channel Partners and Integrators
- 8.6 Downstream Applications and End Users
- 8.7 Value Addition and Profit Pools
- 8.8 Vertical Integration and Outsourcing
- 8.9 Supplier Concentration and Risk
- 8.10 Supply Chain Localization and Resilience
Chapter 9 Australia Communications Test and Measurement Market Regulations and Policies
- 9.1 Relevant Laws, Standards and Compliance Frameworks
- 9.2 Product, Service, Safety and Quality Requirements
- 9.3 Government Policies, Incentives and Subsidies
- 9.4 Imports, Exports and Trade Barriers
- 9.5 Public Procurement and Local Content Requirements
- 9.6 Environmental and Sustainability Compliance
- 9.7 Data Protection, AI and Cybersecurity Compliance
- 9.8 Upcoming Policy Changes and Market Implications
Chapter 10 Australia Communications Test and Measurement Market Hotspots and Opportunities
- 10.1 Market Opportunity Mapping and Growth Hotspots
- 10.2 High-Growth Applications and Customer Groups
- 10.3 Underserved Markets and White-Space Opportunities
- 10.4 Emerging Technology and Product Opportunities
- 10.5 New Capacity and Investment Hotspots
- 10.6 Market Entry and Expansion Opportunities
- 10.7 Distribution and Partnership Opportunities
- 10.8 Near-Term and Long-Term Commercial Potential
- 10.9 Opportunity Attractiveness and Execution Risks
Chapter 11 Australia Communications Test and Measurement Market Outlook, 2025-2035
- 11.1 Market Size and Analysis
- 11.1.1 Revenue (Market Measurement: 2025: USD 298.5 million → 2035: USD 556.9 million)
- 11.1.2 Market Volume and Quantity Sold
- 11.1.3 Historical Market Size, 2018-2025
- 11.1.4 Base-Year Market Size, 2025
- 11.2 Market Forecast, 2025-2035
- 11.2.1 Revenue Forecast to 2035
- 11.2.2 Volume Forecast to 2035
- 11.2.3 CAGR and Year-on-Year Growth
- 11.2.4 Incremental Revenue Opportunity
- 11.3 Forecast Assumptions and Scenario Analysis
- 11.3.1 Base-Case Forecast
- 11.3.2 Optimistic and Conservative Scenarios
- 11.3.3 Technology, Pricing and Policy Sensitivities
- 11.4 Market Attractiveness and Growth Outlook
Chapter 12 Australia Communications Test and Measurement Market Segmentation and Outlook
- 12.1 Segmentation Summary and Market Shares, 2025
- 12.2 Largest and Fastest-Growing Segments
- 12.3 By Solution Type - Market Size and Forecast, 2025-2035
- 12.3.1 Segment Definition and Scope
- 12.3.2 Historical Market Size, 2018-2025
- 12.3.3 Revenue Forecast, 2025-2035
- 12.3.4 Volume Forecast, 2025-2035
- 12.3.5 Base-Year Market Share, 2025
- 12.3.6 Segment CAGR and Growth Drivers
- 12.3.7 Subsegment Market Size and Forecast
- 12.3.7.1 Wireless Test Solutions
- 12.3.7.2 Wireline and Optical Test Solutions
- 12.3.7.3 Dedicated Testing Services
- 12.3.8 Subsegment Pricing and Adoption Trends
- 12.3.9 Leading Suppliers and Competition
- 12.3.10 Regional Demand and Opportunities
- 12.4 By Deployment Model - Market Size and Forecast, 2025-2035
- 12.4.1 Segment Definition and Scope
- 12.4.2 Historical Market Size, 2018-2025
- 12.4.3 Revenue Forecast, 2025-2035
- 12.4.4 Volume Forecast, 2025-2035
- 12.4.5 Base-Year Market Share, 2025
- 12.4.6 Segment CAGR and Growth Drivers
- 12.4.7 Subsegment Market Size and Forecast
- 12.4.7.1 Portable Field Platforms
- 12.4.7.2 Fixed Laboratory Platforms
- 12.4.7.3 Embedded Assurance Platforms
- 12.4.7.4 Cloud-Delivered Test Platforms
- 12.4.8 Subsegment Pricing and Adoption Trends
- 12.4.9 Leading Suppliers and Competition
- 12.4.10 Regional Demand and Opportunities
- 12.5 By End-Use Industry - Market Size and Forecast, 2025-2035
- 12.5.1 Segment Definition and Scope
- 12.5.2 Historical Market Size, 2018-2025
- 12.5.3 Revenue Forecast, 2025-2035
- 12.5.4 Volume Forecast, 2025-2035
- 12.5.5 Base-Year Market Share, 2025
- 12.5.6 Segment CAGR and Growth Drivers
- 12.5.7 Subsegment Market Size and Forecast
- 12.5.7.1 Telecom Service Providers
- 12.5.7.2 Government and Defence
- 12.5.7.3 Enterprise IT
- 12.5.7.4 Communications Research and Manufacturing
- 12.5.8 Subsegment Pricing and Adoption Trends
- 12.5.9 Leading Suppliers and Competition
- 12.5.10 Regional Demand and Opportunities
- 12.6 By Application - Market Size and Forecast, 2025-2035
- 12.6.1 Segment Definition and Scope
- 12.6.2 Historical Market Size, 2018-2025
- 12.6.3 Revenue Forecast, 2025-2035
- 12.6.4 Volume Forecast, 2025-2035
- 12.6.5 Base-Year Market Share, 2025
- 12.6.6 Segment CAGR and Growth Drivers
- 12.6.7 Subsegment Market Size and Forecast
- 12.6.7.1 Field Network Test
- 12.6.7.2 Lab and Manufacturing Test
- 12.6.7.3 Network Assurance Test
- 12.6.7.4 Enterprise Test
- 12.6.8 Subsegment Pricing and Adoption Trends
- 12.6.9 Leading Suppliers and Competition
- 12.6.10 Regional Demand and Opportunities
- 12.7 Segment Growth Comparison
- 12.8 Segment Attractiveness and Priority Matrix
Chapter 13 Australia Communications Test and Measurement End-Use and Application Market Outlook
- 13.1 End-Use Industry and Customer Demand Structure
- 13.2 Leading Applications and Customer Groups
- 13.3 End-Use Market Size, Share and Forecast
- 13.4 Major End-Use Industry Deep Dives
- 13.4.1 Customer Requirements and Use Cases
- 13.4.2 Demand and Replacement Cycles
- 13.4.3 Technical and Regulatory Considerations
- 13.4.4 Purchasing and Procurement Models
- 13.4.5 Leading Vendors and Distribution Channels
- 13.4.6 Forecast and Commercial Opportunities
- 13.5 Emerging Applications and Cross-Segment Demand
- 13.6 End-Use Industry Investment Priorities
Chapter 14 Australia Communications Test and Measurement Geographic Market Outlook, 2025-2035
- 14.1 Domestic Market Distribution and Demand Clusters
- 14.2 State- or Province-Wise Market Size and Forecast, 2025-2035
- 14.3 City and Metropolitan Market Outlook
- 14.4 Industrial, Manufacturing and Commercial Clusters
- 14.5 Geographic Concentration of Key End Users
- 14.6 Local Pricing and Purchasing Differences
- 14.7 Domestic Production Facilities and Capacity Map
- 14.8 Local Infrastructure and Project Pipeline
- 14.9 State-Level Policy and Incentive Differences
- 14.10 Subnational Investment Hotspots and Opportunities
- 14.11 Distribution and Logistics Networks
- 14.12 Domestic Competitive Footprint
Chapter 15 Australia Communications Test and Measurement Technology, Innovation and Sustainability Outlook
- 15.1 Technology Landscape and Maturity
- 15.2 Product, Process and Service Innovation
- 15.3 AI, Automation and Digital Tools in the Industry
- 15.4 Technology Adoption and Performance Benchmarking
- 15.5 Innovation Pipeline and R&D Investment
- 15.6 Patent and Intellectual Property Trends
- 15.7 Energy Efficiency and Resource Management
- 15.8 Sustainability, Recycling and Circularity
- 15.9 Technology Roadmap, 2025-2035
- 15.10 Risks of Obsolescence and Technology Substitution
Chapter 16 Australia Communications Test and Measurement Market Key Strategic Imperatives
- 16.1 Growth and Market Entry Priorities
- 16.2 High-Return Products and Segments
- 16.3 Pricing, Profitability and Cost Optimization
- 16.4 Technology Investment and Product Differentiation
- 16.5 Supply Chain Localization and Resilience
- 16.6 Distribution and Customer Acquisition
- 16.7 Partnership, Acquisition and Capacity Strategy
- 16.8 Regional Expansion Priorities
- 16.9 Short-, Medium- and Long-Term Actions
Chapter 17 Competition Outlook
- 17.1 Industry Competition Characteristics
- 17.2 Market Structure and Concentration
- 17.3 Market Share and Competitive Positioning, 2025
- 17.4 Company-Wise Revenue and Product Benchmarking
- 17.5 Production and Service Capacity Benchmarking
- 17.6 Technology, Pricing and Differentiation
- 17.7 Regional Footprint and Distribution Strength
- 17.8 Mergers, Acquisitions and Strategic Alliances
- 17.9 New Entrants and Competitive Threats
- 17.10 Porter's Five Forces and Industry Attractiveness
- 17.11 Competitive Outlook, 2025-2035
Chapter 18 Company Profiles
- 18.1 Company Coverage and Selection Criteria
- 18.2 Keysight Technologies
- 18.2.1 Business Description
- 18.2.2 Company Ownership and Geographic Presence
- 18.2.3 Product and Service Portfolio
- 18.2.4 Manufacturing and Operating Footprint
- 18.2.5 Production Capacity and Expansion Plans
- 18.2.6 Financial Performance and Investment
- 18.2.7 Market Share and Competitive Position
- 18.2.8 Technology and Innovation Capabilities
- 18.2.9 Strategic Alliances or Partnerships
- 18.2.10 Recent Developments
- 18.2.11 Growth Strategy and Outlook
- 18.3 Rohde & Schwarz Australia
- 18.4 Anritsu
- 18.5 VIAVI Solutions
- 18.6 EXFO
- 18.7 Other Relevant Market Participants
Note: Every listed company is profiled on the structure shown under the first company. The company list is preliminary and may change based on research findings, market developments, data availability and client requirements.
Chapter 19 Disclaimer
- 19.1 Research and Forecast Disclaimer
- 19.2 Data Source and Estimation Limitations
Note: The depth of individual sections depends on data availability for this market. Volume, capacity, trade and other unit-based metrics are included where applicable.

