
Island geography keeps satellite links in daily use
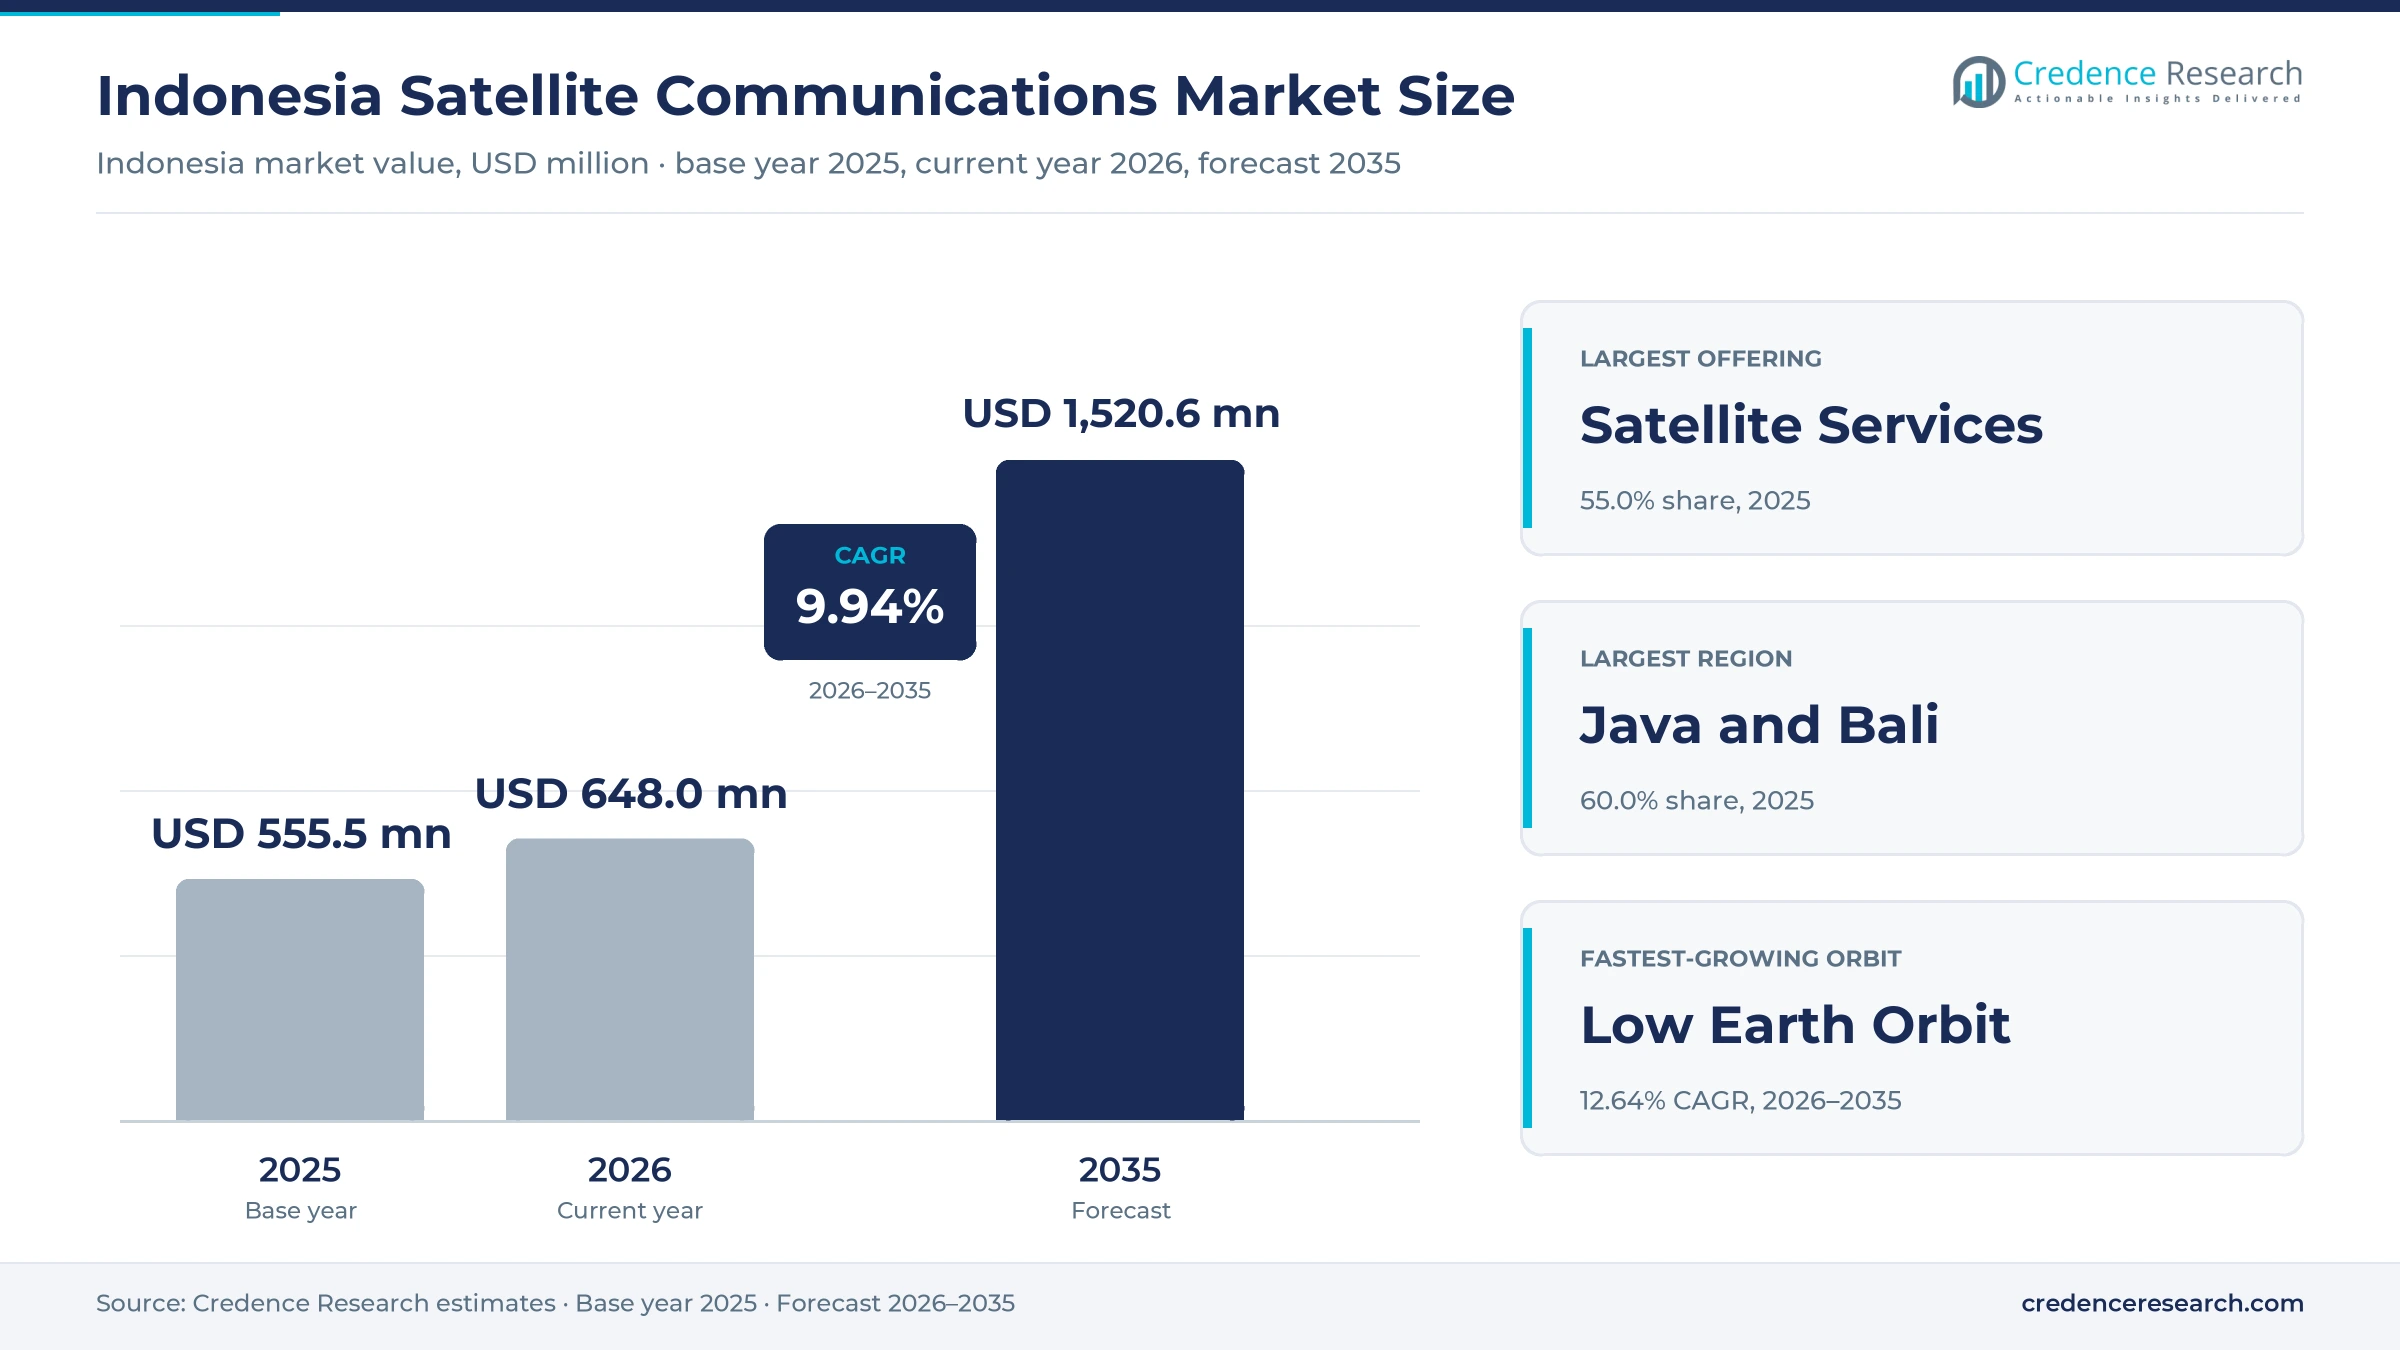
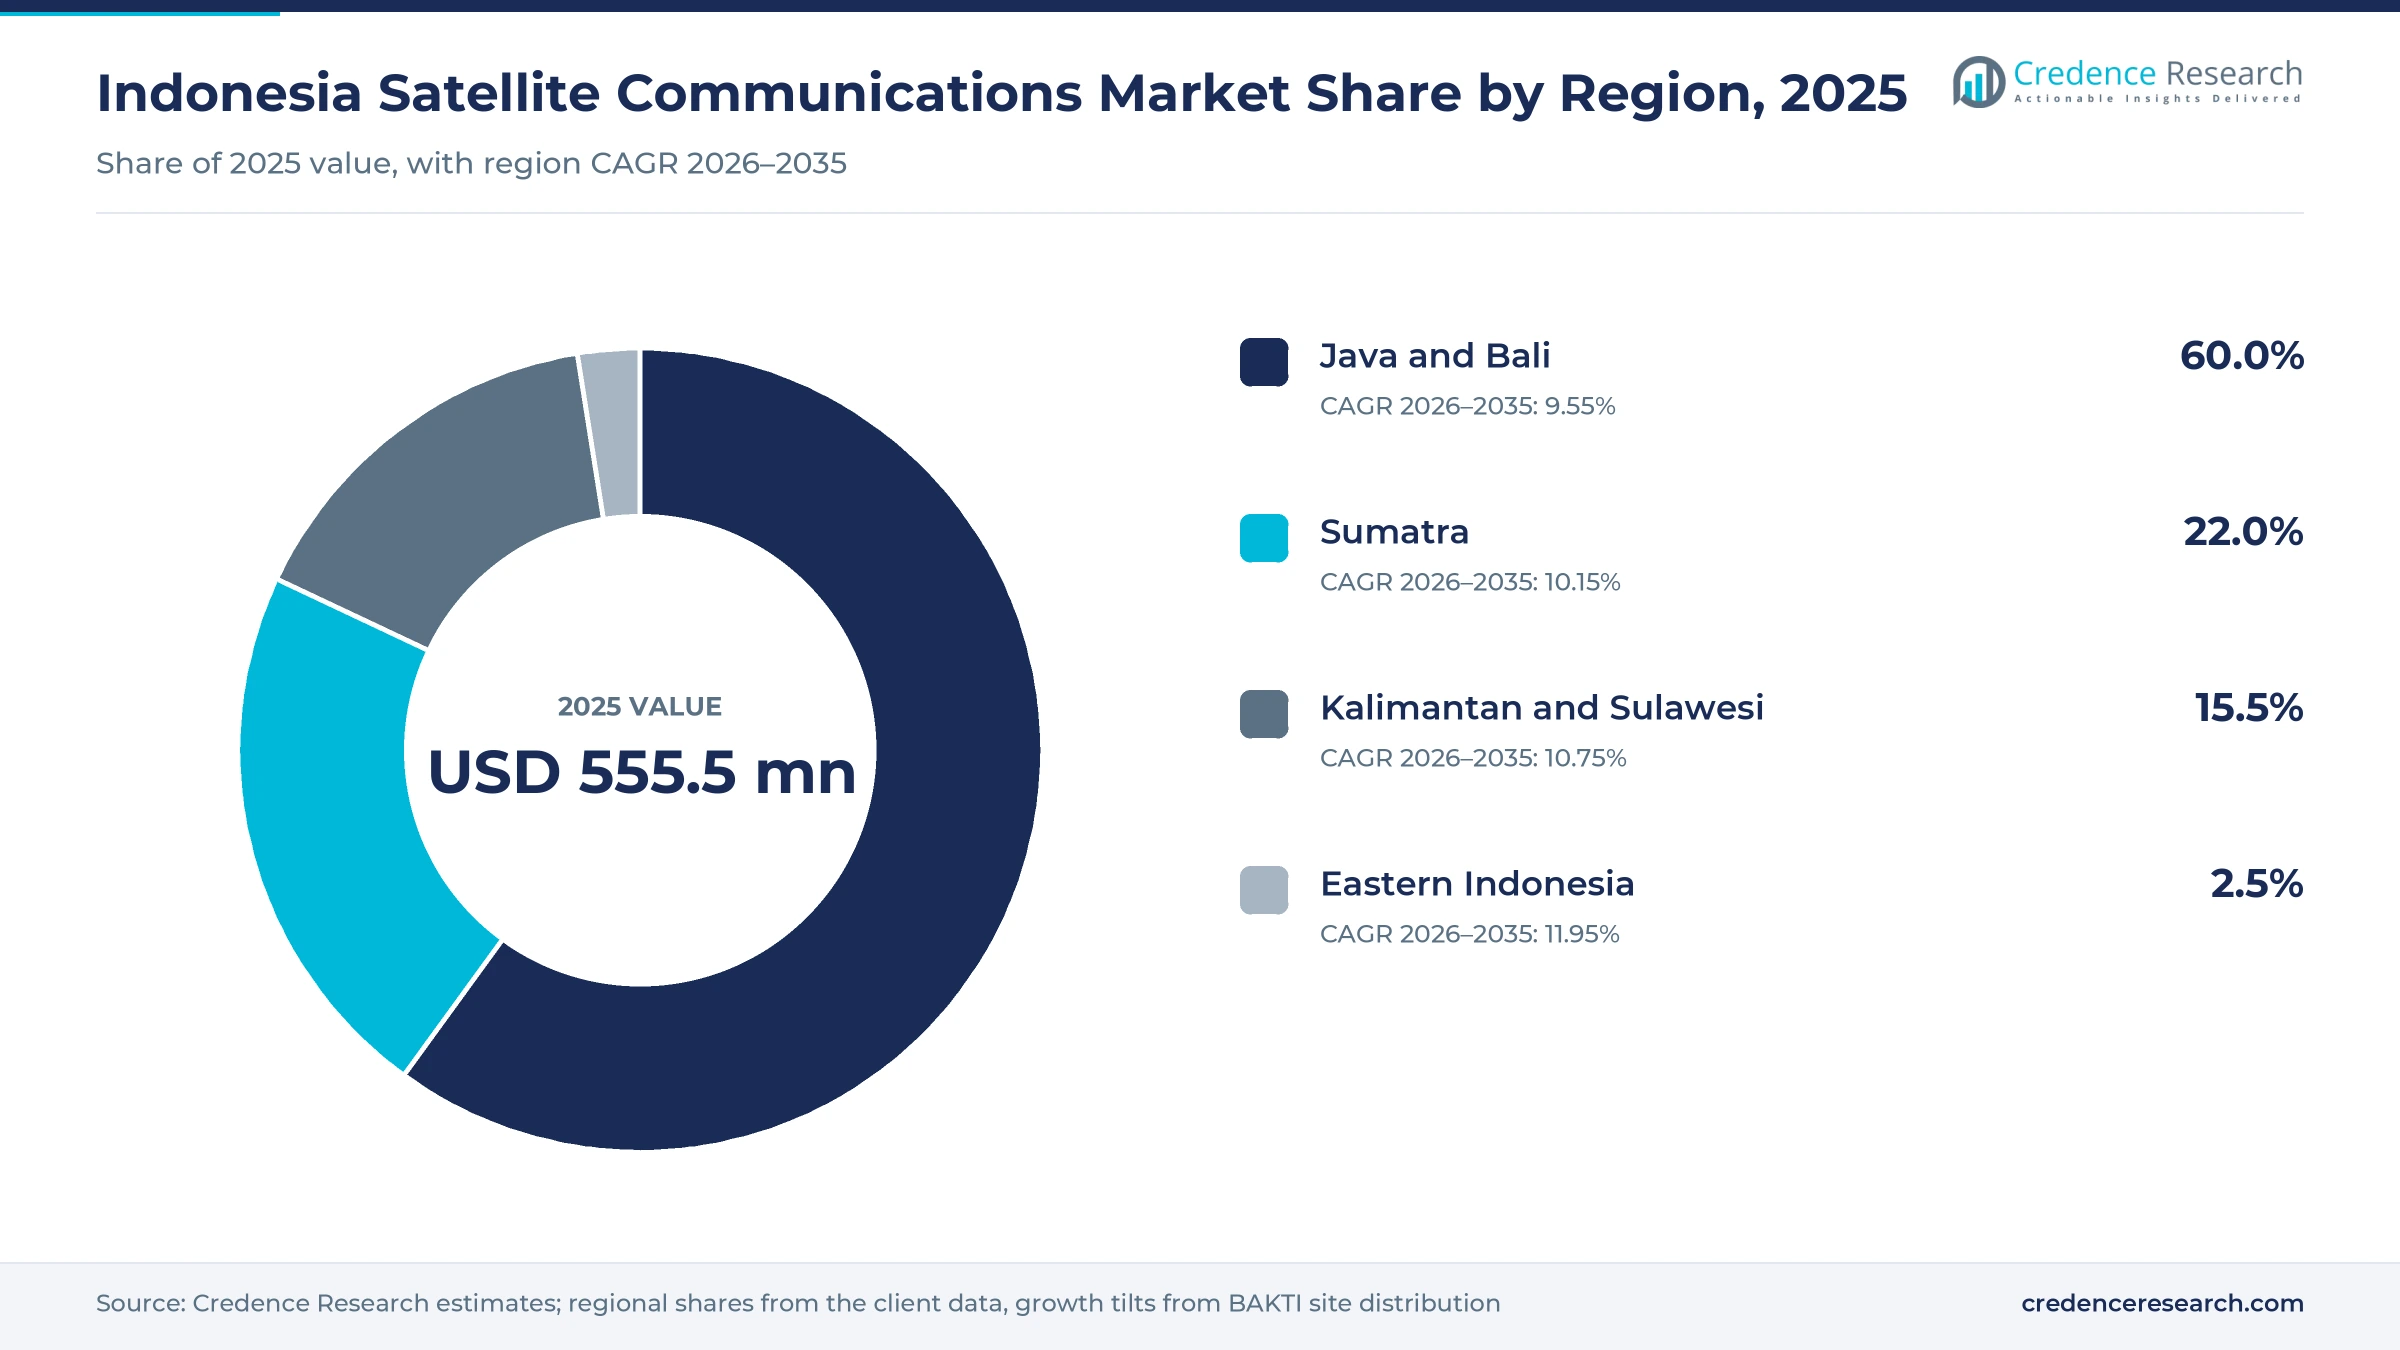
The Indonesia satellite communications market was valued at USD 555.5 million in 2025 and is projected to increase from USD 648.0 million in 2026 to USD 1.52 billion by 2035, registering a CAGR of 9.94% during 2026–2035. Demand comes from government programs that connect schools, clinics and village offices, mobile operators that backhaul remote base stations, mining and plantation companies, fishing fleets and households beyond the fiber network. Java and Bali held the largest regional share, 60.0% in 2025, because banks, broadcasters, teleports and most enterprise headquarters are located there. Eastern Indonesia is the fastest-growing region at 11.95% a year, as public access points and base stations in Papua and Maluku rely on satellite links. The arrival of low Earth orbit broadband in May 2024 and the September 2025 launch of the 160 Gbps Nusantara Lima satellite are shifting buyers toward hybrid networks that combine geostationary and low-orbit capacity.
Which links, terminals and services does the estimate cover?
The estimate measures spending in Indonesia on satellite capacity and connectivity services, user terminals, VSAT hubs and gateway equipment, and managed connectivity packages that bundle satellite links with terrestrial or wireless access. It covers fixed, maritime, portable and airborne use across C-band, Ku-band, Ka-band and L/S-band networks in all three orbits.
The estimate excludes satellite manufacturing and launch contracts, Earth observation and navigation services, and pure fiber or mobile network spending. The value chain runs from satellite operators and capacity resellers through teleports, network integrators and terminal vendors to government agencies, operators, companies, vessel owners and households that pay for each link.
Indonesia Satellite Communications Market Insights
- The Indonesia satellite communications market was valued at USD 555.5 million in 2025 and is projected to reach USD 1.52 billion by 2035, registering a CAGR of 9.94% during 2026–2035.
- Java and Bali held a 60.0% share of 2025 value, because most enterprise networks, teleports and broadcast uplinks are managed from these islands.
- Satellite services led offerings with 55.0% of 2025 value, because capacity leases and managed links generate recurring monthly payments.
- SATRIA-1 connected 30,017 public service points by Dec. 7, 2025, with each location receiving internet access of up to 10 Mbps over Ka-band.
- Pasifik Satelit Nusantara launched the 160 Gbps Nusantara Lima satellite on Sept. 11, 2025, adding 101 Ka-band spot beams and eight ground stations.
Services and GEO capacity lead as LEO grows fastest
Why do satellite services earn most of the spending?
Based on offering, the market is categorized into ground equipment, satellite services and integrated connectivity solutions. Satellite Services led with 55.0% of 2025 value, because government programs, banks and mobile operators pay monthly for capacity and managed links. Integrated Connectivity Solutions grow fastest at 11.35% a year, because buyers increasingly want one contract that combines GEO, LEO and terrestrial access with failover.
How do geostationary and low-orbit links share demand?
Based on orbit type, the market is categorized into low Earth orbit, geostationary orbit and medium Earth orbit. Geostationary Orbit led with 55.0% of 2025 value, because SATRIA-1, Merah Putih 2 and Nusantara Lima carry most public, broadcast and backhaul traffic. Low Earth Orbit grows fastest at 12.64% a year, because low-latency LEO service reached Indonesian households and companies in 2024.
Which end users buy the most satellite capacity?
Based on end-use industry, the market is categorized into government and public services, enterprise and natural resources, maritime and fisheries, and media and telecommunications. Government and Public Services led with 34.0% of 2025 value, because BAKTI funds tens of thousands of public access links. Maritime and Fisheries grows fastest at 10.69% a year, because vessel monitoring rules now reach smaller fishing boats.
How does broadband access compare with backhaul and broadcast?
Based on application, the market is categorized into broadband access, enterprise backhaul, mobility connectivity and broadcast and media distribution. Broadband Access led with 38.0% of 2025 value, because schools, clinics and rural homes need direct internet links. Mobility Connectivity grows fastest at 11.05% a year, as vessels, field teams and airlines adding in-flight connectivity adopt flat-panel terminals.
| Segment Group | Leading Sub-segment | Share, 2025 | Fastest-growing Sub-segment | CAGR, 2026–2035 |
|---|---|---|---|---|
| By Offering | Satellite Services | 55.0% | Integrated Connectivity Solutions | 11.35% |
| By Orbit Type | Geostationary Orbit | 55.0% | Low Earth Orbit | 12.64% |
| By End-Use Industry | Government and Public Services | 34.0% | Maritime and Fisheries | 10.69% |
| By Application | Broadband Access | 38.0% | Mobility Connectivity | 11.05% |
Request a Free Sample
Fill in your details and we'll send you a free sample report.
- Sample data tables & charts
- Research methodology
State HTS programs, LEO entry and remote sites lift demand
How do state HTS capacity and public access programs lift demand?
Government funding keeps a large and stable base of satellite links in service, which anchors demand for capacity and terminals. SATRIA-1, a 150 Gbps Ka-band satellite launched in June 2023, connected 30,017 public service points by Dec. 7, 2025, according to ANTARA News. The project was built under a build-operate-transfer scheme worth about IDR 6.42 trillion with a 15-year concession, so its payments recur every year. BAKTI also reported that about 70% of the satellite capacity was in use by mid-2025, with a 90% target for year-end. The ministry counted 6,747 BAKTI base stations in operation in 2025, of which 3,262 were in Papua. As a result, government and public services held 34.0% of 2025 value.
Why do LEO commercialization and hybrid networks widen use?
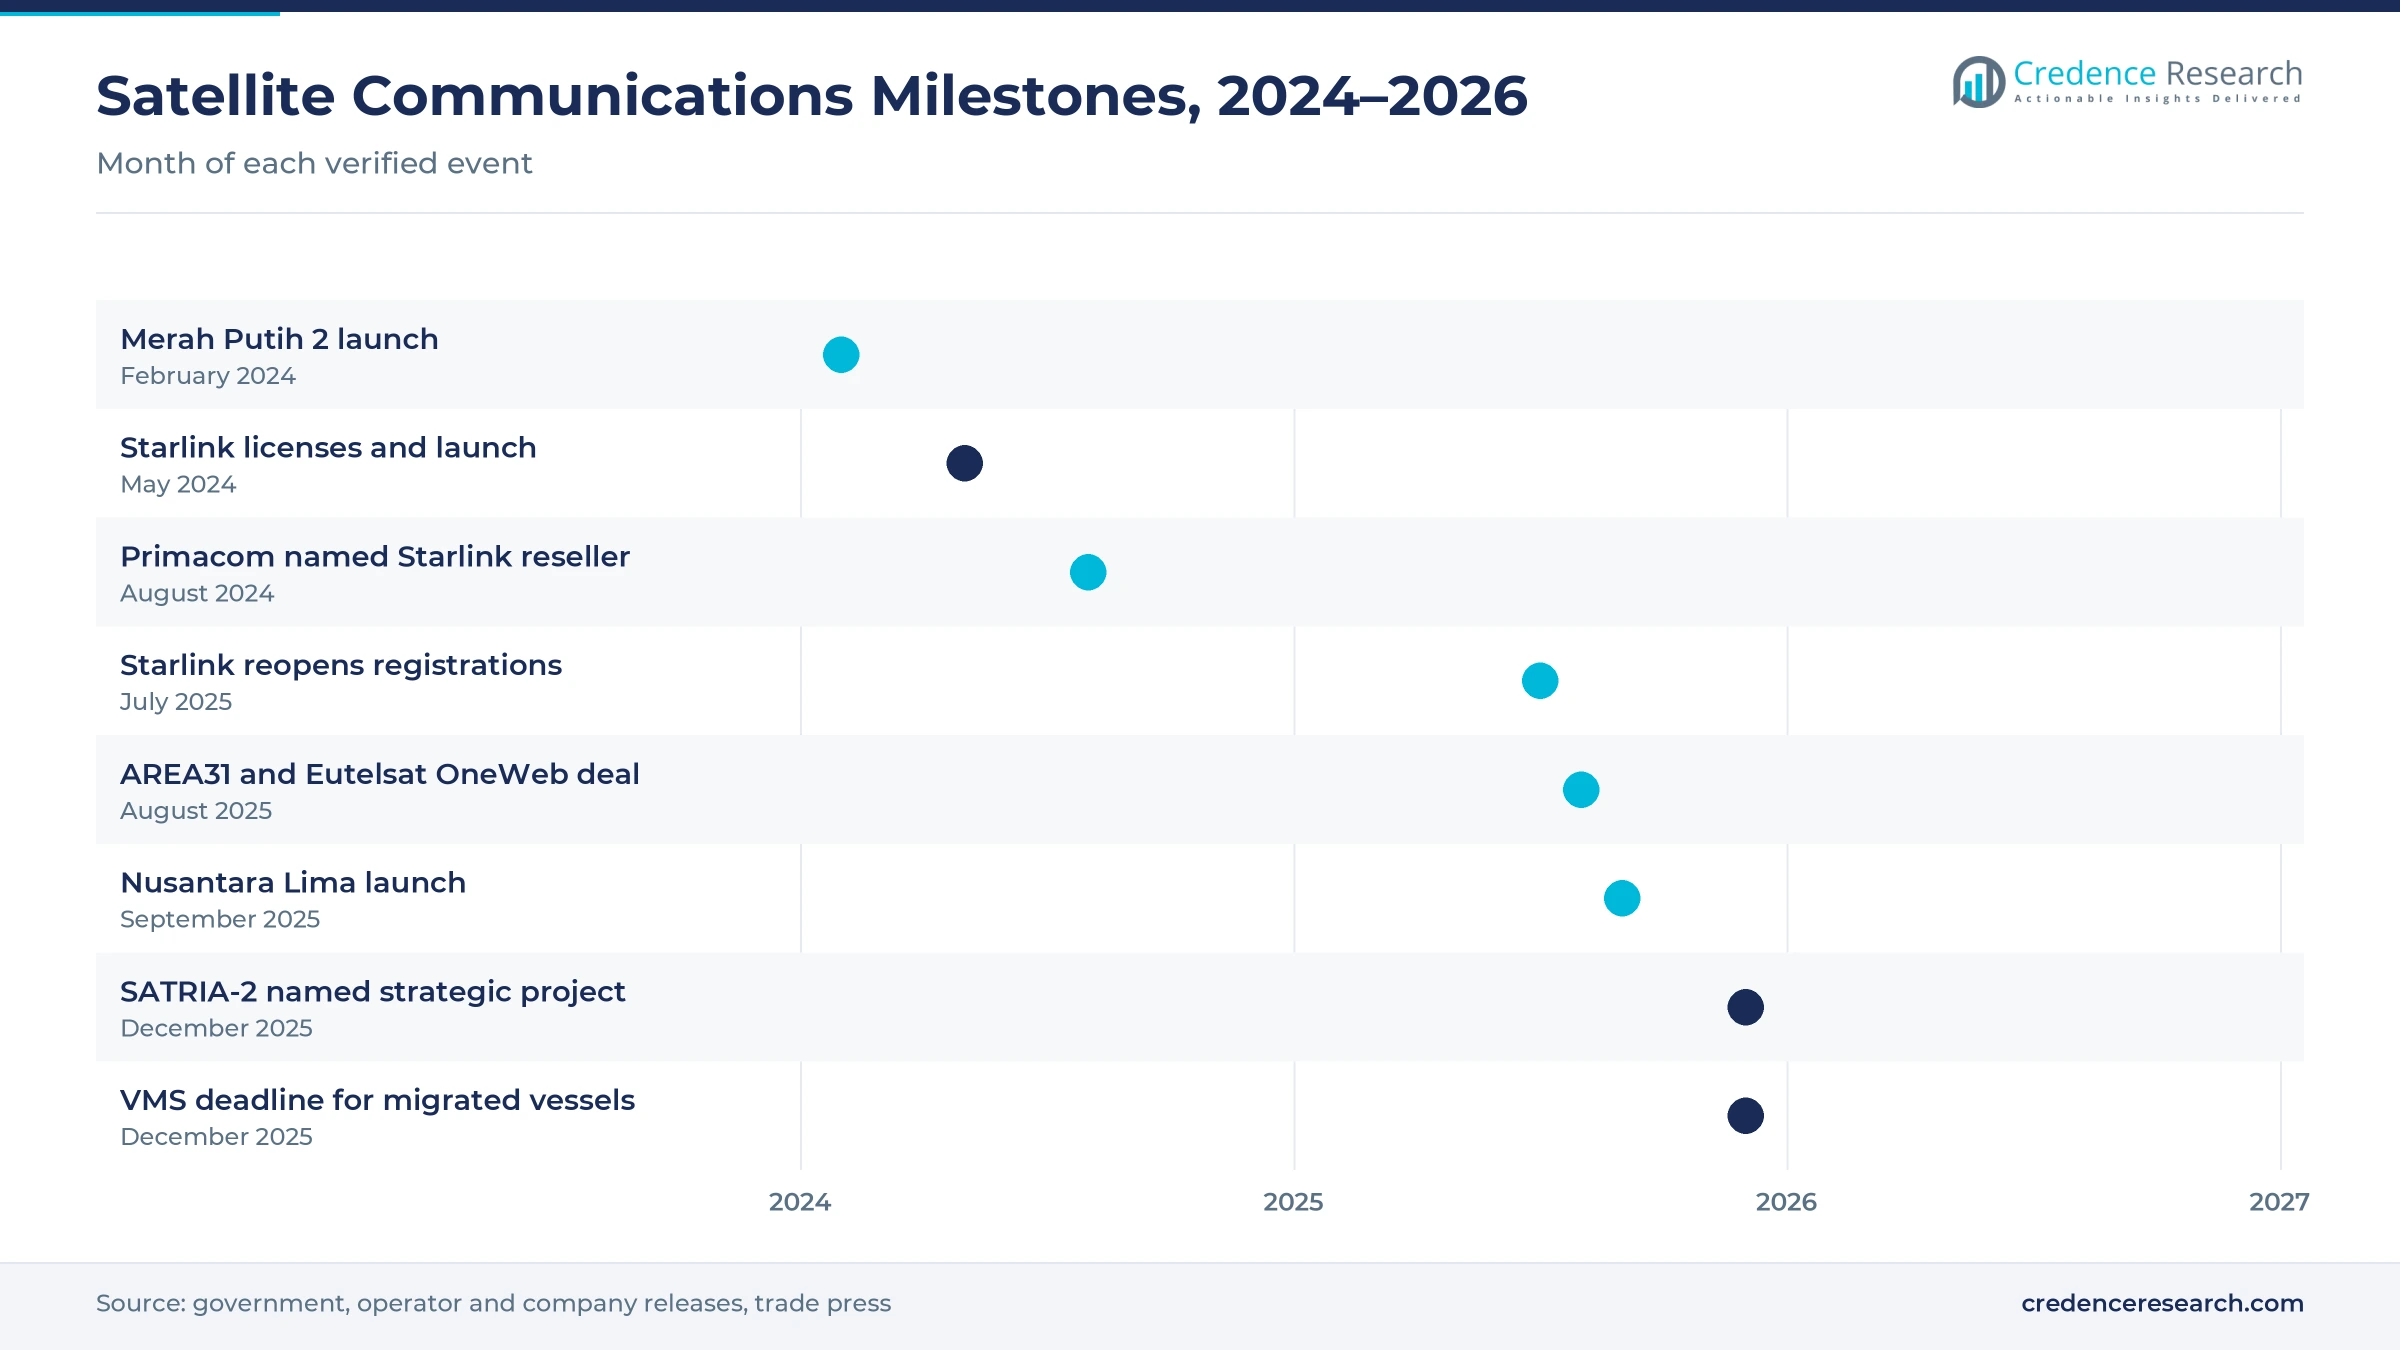
Low Earth orbit service has brought lower latency and simple self-installed terminals to buyers who previously relied on VSAT links. Starlink obtained VSAT and internet service provider licenses in May 2024 and launched service at a community health center in Denpasar on May 19, 2024. Its standard plan was priced at IDR 750,000 a month, with hardware at IDR 7.8 million. Telkomsat had already worked with Starlink since 2022 to serve corporate customers in remote areas, and PT Primacom Interbuana became an authorized reseller in August 2024. In August 2025, AREA31 partnered with Eutelsat OneWeb to sell LEO service under the BuanterOne brand. In turn, low Earth orbit grows fastest among orbit types at 12.64% a year.
Why does archipelagic geography keep satellite links essential?
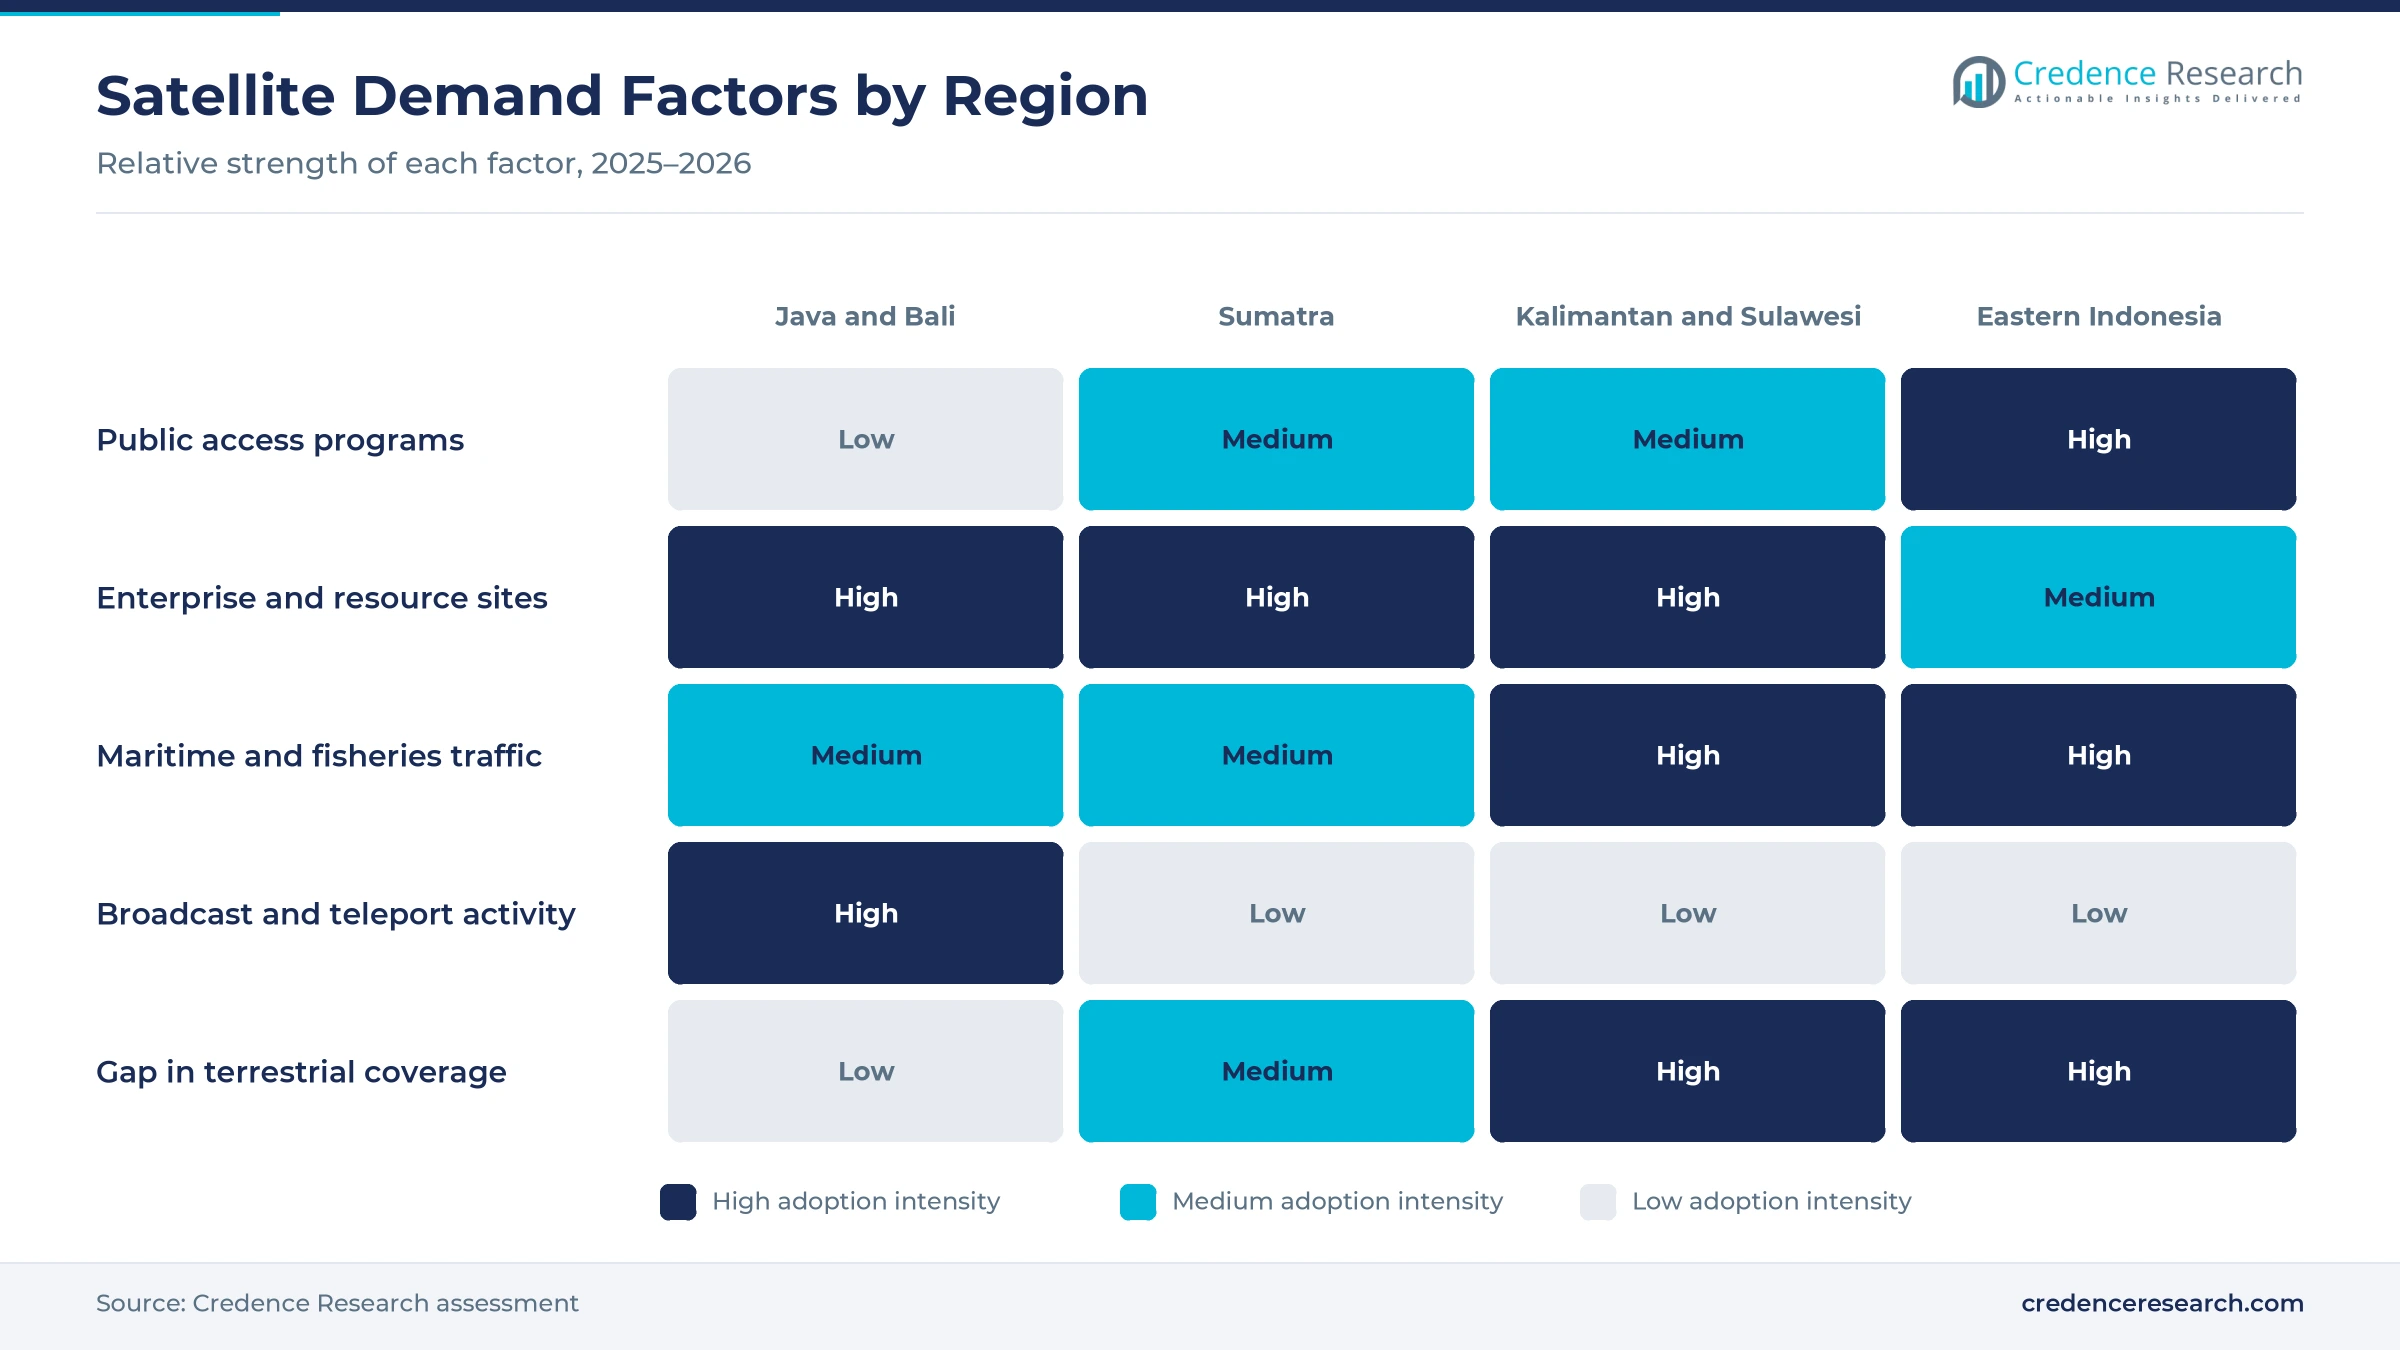
Indonesia spreads its population across thousands of islands, which makes fiber and microwave links costly or impossible in many districts. The Geospatial Information Agency counted 17,380 islands in 2024, according to its national gazetteer. Only 72.78% of Indonesians used the internet in 2024, according to World Bank data, so a large share of the population remains offline. Kacific and PT Indo Pratama Teleglobal had connected hundreds of 4G base sites over Kacific1 Ka-band capacity by July 2022, showing how operators use satellites to reach remote towers. Nusantara Lima also links eight Indonesian ground stations from Banda Aceh to Papua. As a result, base station backhaul keeps satellites in mobile networks, and the outer islands grow faster than Java and Bali.
How do vessel monitoring rules expand maritime demand?
Fisheries rules now require more boats to carry satellite transmitters, which creates new terminal sales and recurring airtime. Every fishing vessel above five gross tonnage must install and activate a vessel monitoring system transmitter under the measured fishing policy in Government Regulation No. 11 of 2023. A ministry adviser said 756 of 5,190 migrated vessels had installed VMS units, while 4,425 vessels had until Dec. 31, 2025 to comply, according to Mongabay Indonesia. The Ministry of Marine Affairs and Fisheries also restated in January 2025 that every fishing vessel must install VMS. Wider maritime digitization adds crew welfare and catch reporting traffic. In turn, maritime and fisheries grows fastest among end uses at 10.69% a year.
New satellites and direct-to-device plans shift supply
How is the shift to new high-throughput satellites changing supply?
National operators are replacing older transponder capacity with high-throughput satellites, which lowers the cost of each megabit and supports more users per beam. Telkomsat launched Merah Putih 2 on Feb. 20, 2024, adding at least 32 Gbps of C-band and Ku-band capacity built by Thales Alenia Space. Pasifik Satelit Nusantara followed with Nusantara Lima on Sept. 11, 2025, a 160 Gbps satellite with 101 Ka-band spot beams at 113 degrees east. SATRIA-1 already provides 150 Gbps through eleven gateways from Batam to Jayapura. As a result, geostationary orbit remains the largest orbit type, because these satellites carry the bulk of public, backhaul and broadcast traffic.
Why is the rise of direct-to-device services notable?
Operators are preparing for phones that connect directly to satellites, which could add a new mass-market service on top of terminal-based links. Telkomsat signed a memorandum of understanding with Space42 on Dec. 16, 2025 to explore direct-to-device service with Equatys, according to Via Satellite. Viasat and Space42 announced Equatys in September 2025, and it plans to use Thuraya-4 and Inmarsat mobile satellite spectrum plus new low-orbit satellites. The partners also aim to deliver service within three years, with work on licensing, spectrum coordination and 5G non-terrestrial standards. In turn, L/S-band mobility services gain a clearer path, and mobility connectivity grows fastest among applications at 11.05% a year.
Can capacity shortages open room for new satellite supply?
Demand has outrun available capacity on several networks, which creates an opening for new satellites and multi-orbit service bundles. Starlink halted new registrations in Indonesia because of capacity limits and reopened them in July 2025 at a much higher price, while its download speed fell from 42 Mbps in 2024 to 15.8 Mbps in 2025, according to OpenSignal data reported by Databoks. BAKTI said SATRIA-1 had only about 30% of capacity left in June 2025. The ministry then studied a 300 Gbps SATRIA-2 or LEO services to add capacity, and BAKTI said in December 2025 that SATRIA-2 had been designated a National Strategic Project. As a result, integrated connectivity solutions grow fastest among offerings at 11.35% a year.
Is there room to grow in enterprise backhaul and remote industry?
Mining, plantations, banks and mobile operators need dependable links at sites that terrestrial networks do not reach, which supports long-term managed contracts. Lintasarta already ran 15,000 remote VSATs in 2018 from hubs in Jatiluhur and Gresik, giving it a large installed base for upgrades. Thaicom subsidiary IPSTAR leased capacity to Axiata so that XL Axiata could deliver more than 1 Gbps over seven Ku-band beams on IPSTAR-1. Kacific1 Ka-band terminals also reach speeds of up to 85 Mbps for base station backhaul. Upgrades from older enterprise VSAT systems to multi-orbit terminals add equipment demand. In turn, enterprise and natural resources buyers sign multiyear managed contracts that keep satellite links in service through 2035.
Congestion, affordability and terminal costs set limits
How does capacity congestion affect service quality?
Rapid uptake has filled popular beams faster than new capacity arrives, which lowers speeds for existing users. Households and small businesses on LEO plans felt this most in 2025, when download speeds dropped and new sign-ups paused. As a result, buyers may delay migration from VSAT or keep backup links. Operators are responding by adding satellites, gateways and capacity reservations for public and enterprise users. Hybrid contracts that switch traffic between orbits also reduce the impact of a crowded beam.
Why do terminal and service prices limit household uptake?
Satellite kits and monthly fees remain expensive compared with local incomes, which narrows the household market. When Starlink reopened registrations in July 2025, the subscription price rose to USD 490 to 574, almost three times the average monthly wage, according to Databoks. In turn, rural households often depend on shared public access points. Resellers are testing lower-cost plans and community hotspot models to widen access. Shared village links spread the terminal cost across many users and households.
How do equipment costs slow vessel monitoring compliance?
Small fishing boat owners face transmitter and airtime costs that they consider high relative to uncertain catches. Fishers staged protests from Muara Angke and Gorontalo to Lombok, Cilacap and Rembang against the expanded VMS rule. As a result, compliance may lag the official deadline in poorer fishing communities. Experts have urged the government to subsidize VMS units and train crews, which would speed adoption. Bundled airtime plans from local providers could also lower the yearly cost for each boat owner.
Why does uncertainty over new public satellites create risk?
The next public capacity program is still in early planning, which leaves vendors and integrators without a clear procurement timeline. BAKTI said in December 2025 that financing for SATRIA-2 had not been decided and that demand analysis was its main priority. In turn, public service points may face slower speeds until new capacity is added. Leasing LEO capacity offers a faster interim option for the ministry. However, leased capacity depends on foreign operators and on their landing rights in Indonesia.
Java and Bali lead while Eastern Indonesia grows fastest
| Region | Value, 2025 (USD million) | Share, 2025 | CAGR, 2026–2035 |
|---|---|---|---|
| Java and Bali | 333.3 | 60.0% | 9.55% |
| Sumatra | 122.2 | 22.0% | 10.15% |
| Kalimantan and Sulawesi | 86.1 | 15.5% | 10.75% |
| Eastern Indonesia | 13.9 | 2.5% | 11.95% |
Why do Java and Bali hold the largest share of spending?
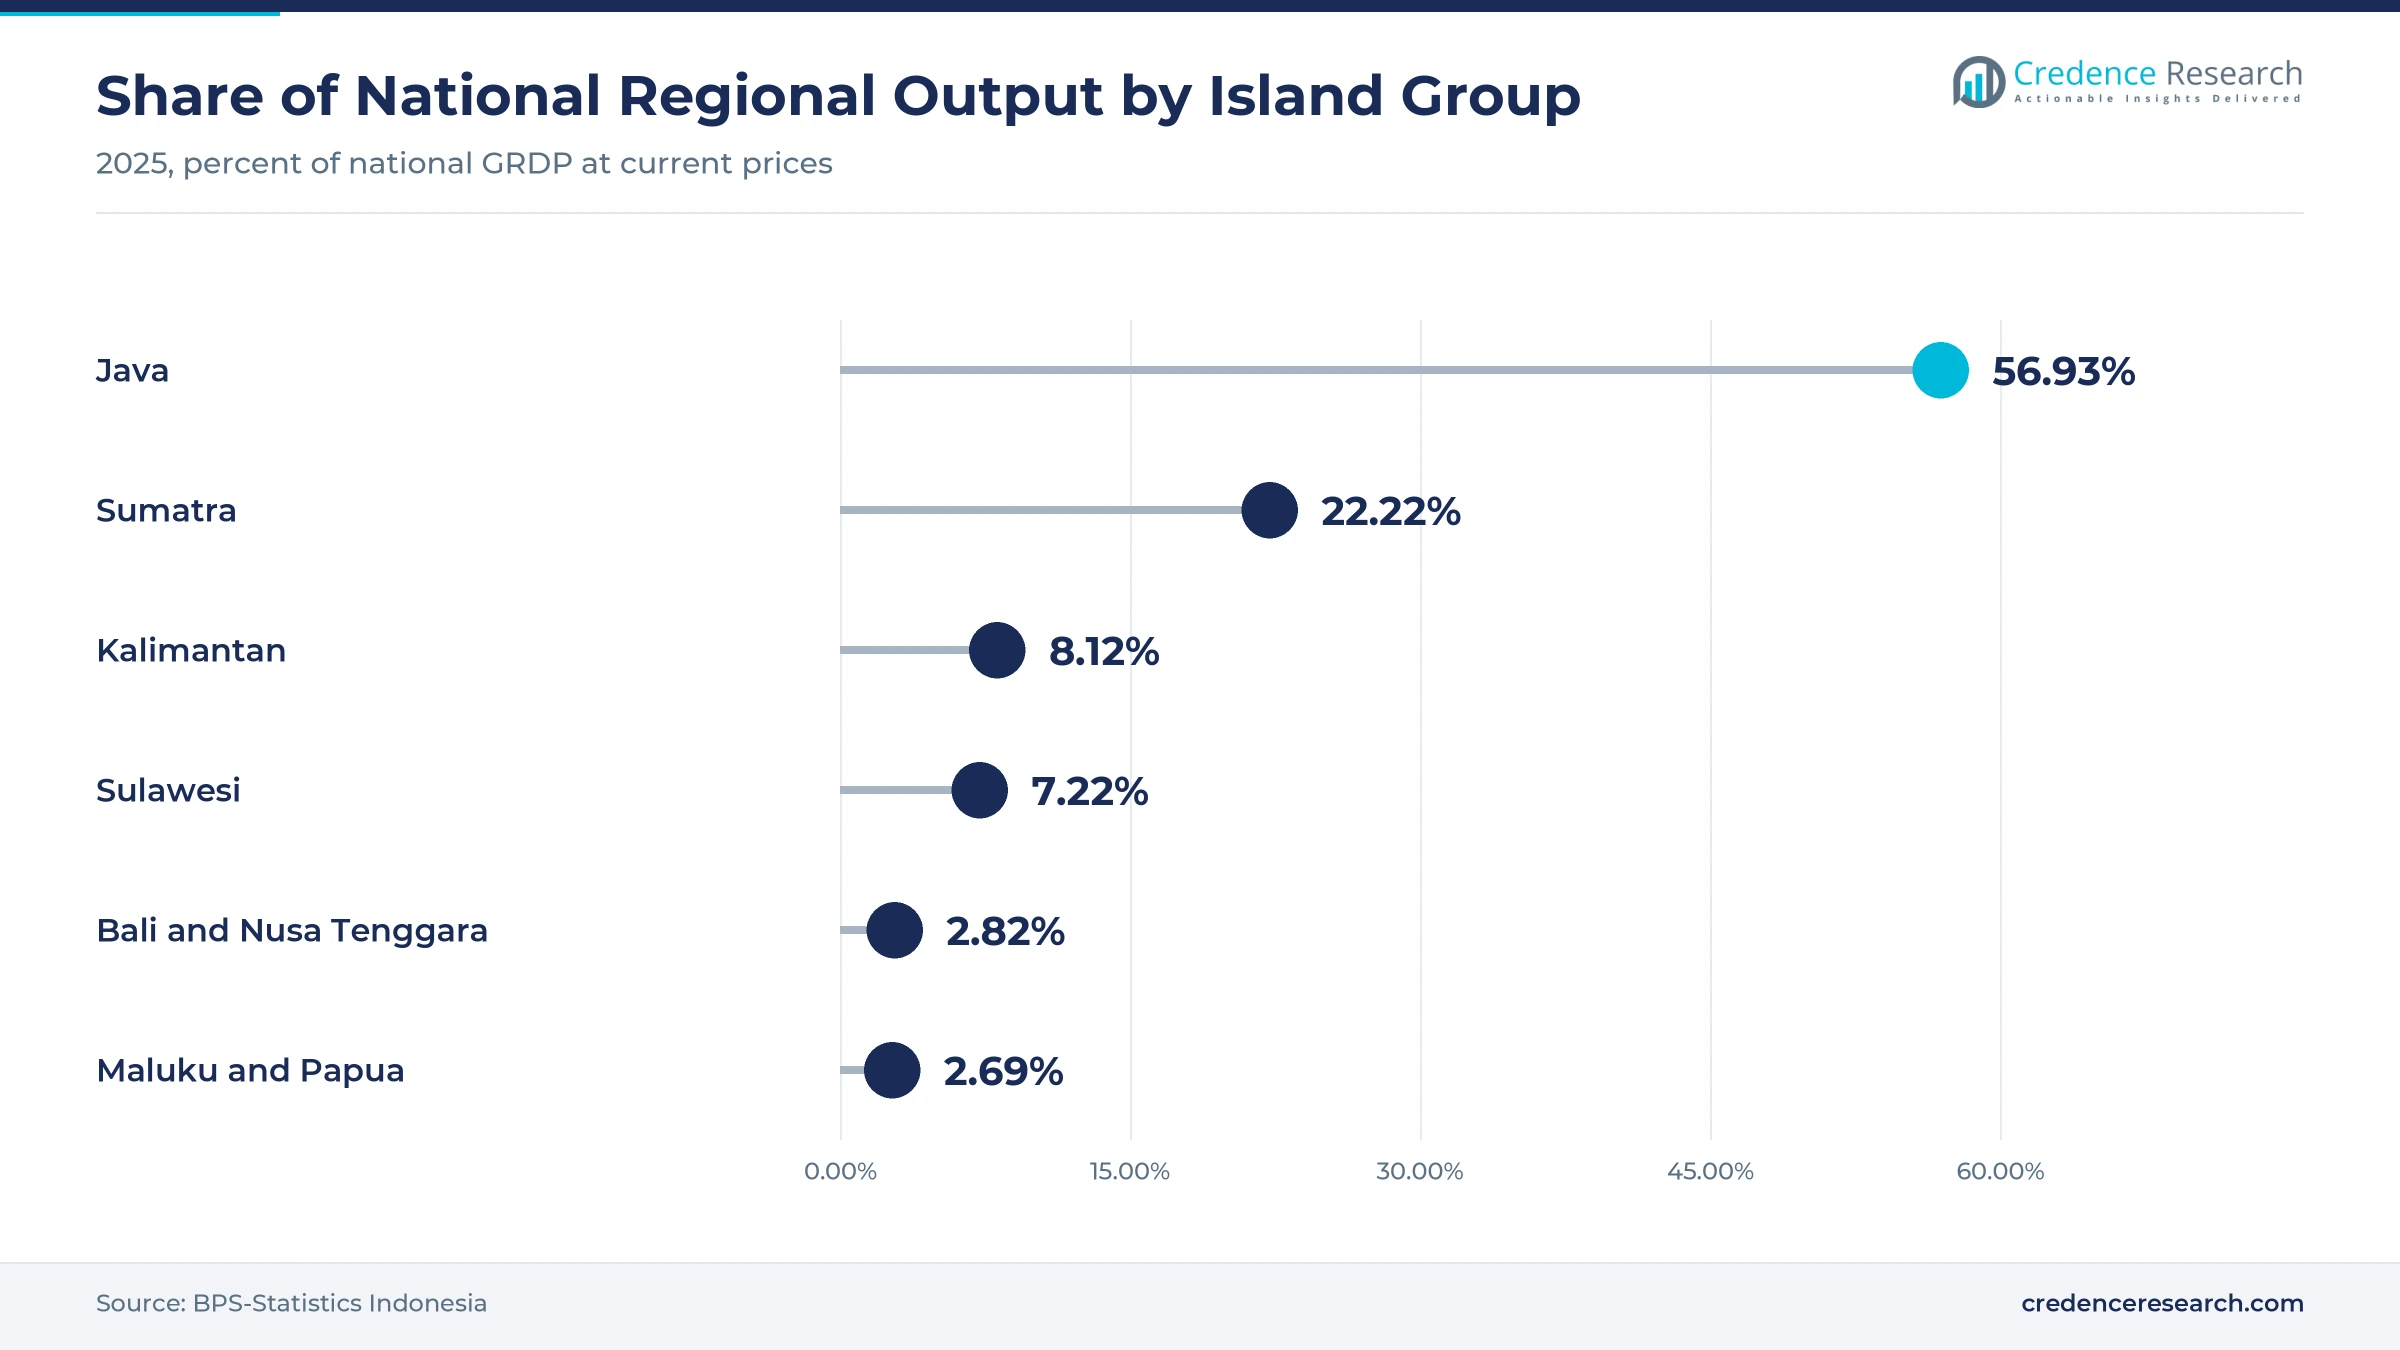
Java and Bali held 60.0% of 2025 value and grows at 9.55% a year, because banks, broadcasters, government agencies and mining companies run their satellite networks from headquarters there. Java produced 56.93% of national regional output in 2025, according to BPS data. SATRIA-1 also uses a gateway in Cikarang, and AREA31 runs its LEO teleport in Ciruas, Banten. As a result, the region concentrates hub, teleport and ground station spending.
How does Sumatra add plantation and resource demand?
Sumatra held 22.0% of 2025 value and grows at 10.15% a year, because plantations, mines and oil and gas fields operate far from fiber routes. Sumatra produced 22.22% of national regional output in 2025, according to BPS data. SATRIA-1 runs a gateway in Batam, and Nusantara Lima coverage reaches north to Banda Aceh. In turn, enterprise backhaul and VSAT upgrades form the core of spending in the region.
Why do Kalimantan and Sulawesi grow faster than Java?
Kalimantan and Sulawesi held 15.5% of 2025 value and grows at 10.75% a year, because interior mining areas and scattered coastal towns still lack terrestrial links. Kalimantan and Sulawesi produced 8.12% and 7.22% of national regional output in 2025, according to BPS data. SATRIA-1 gateways operate in Pontianak, Banjarmasin and Tarakan on Kalimantan and in Manado on Sulawesi. As a result, both public access and resource company demand support growth above the national rate.
What drives the fastest growth in Eastern Indonesia?
Eastern Indonesia held 2.5% of 2025 value and grows fastest at 11.95% a year, because Papua, Maluku and Nusa Tenggara have the widest gaps in terrestrial coverage. Papua hosted 3,262 of the 6,747 BAKTI base stations operating in 2025. SATRIA-1 gateways in Ambon, Kupang, Manokwari, Timika and Jayapura serve these islands. In turn, public programs and maritime links add value faster than the region's small share of output suggests.
Launches, LEO entry and direct-to-device talks, 2024–2026
| Development | Status and market relevance |
|---|---|
| In February 2024, Telkomsat launched the Merah Putih 2 satellite with at least 32 Gbps of C-band and Ku-band capacity. | Adds national HTS capacity for operators and enterprises |
| In May 2024, Starlink launched service in Indonesia at a community health center in Denpasar, Bali. | Brings commercial LEO broadband to the country |
| In August 2024, Starlink appointed PT Primacom Interbuana as an authorized reseller in Indonesia. | Widens LEO reach for corporate and remote users |
| In September 2025, Pasifik Satelit Nusantara launched Nusantara Lima with 160 Gbps and 101 Ka-band spot beams. | Adds the largest new private capacity over the archipelago |
| In December 2025, Telkomsat signed a memorandum of understanding with Space42 to explore direct-to-device service with Equatys. | Opens a path to satellite links for standard phones |
Ka-band HTS, LEO terminals and hybrid networks carry traffic
- Ka-band high-throughput satellites reuse frequencies across many spot beams, which lets SATRIA-1 and Nusantara Lima serve thousands of sites at lower cost per megabit.
- C-band and Ku-band transponders remain the workhorse for broadcast, cellular backhaul and maritime links, because they resist heavy tropical rain better.
- Low Earth orbit terminals use electronically steered flat panels that track fast-moving satellites, which cuts latency for video calls and cloud use.
- Hybrid network managers route traffic across GEO, LEO and terrestrial paths, which keeps enterprise and public sites online when one link fails.
Need a Custom Version of This Report?
Tailor the scope, geography, or segments to your exact requirements.
- Custom geography or segment scope
- Direct access to our analyst team
National operators compete with LEO and regional capacity
Competition centers on capacity, coverage of remote islands, landing rights and the ability to bundle links into managed services. PT Telkom Satelit Indonesia operates Merah Putih 2, resells Starlink capacity to corporate users and is studying direct-to-device service with Space42 and the Equatys venture backed by Viasat. PT Pasifik Satelit Nusantara added 160 Gbps with Nusantara Lima, which links eight Indonesian ground stations. PT Starlink Services Indonesia sells LEO broadband directly and through resellers such as PT Primacom Interbuana. PT Aplikanusa Lintasarta runs one of the largest enterprise VSAT networks. Foreign operators compete through partners, as Kacific works with Teleglobal, Thaicom supplies IPSTAR capacity, SES signed a capacity deal with Telkom, and Eutelsat OneWeb sells through AREA31. Because services hold the largest share of 2025 value, operators that control both capacity and local distribution keep the strongest position.
Companies profiled and their roles in this market
| Company | Type | Role in the market |
|---|---|---|
| PT Telkom Satelit Indonesia | National satellite operator | Runs Merah Putih 2 and resells LEO capacity |
| PT Pasifik Satelit Nusantara | Private satellite operator | Operates the 160 Gbps Nusantara Lima |
| PT Starlink Services Indonesia | LEO broadband provider | Sells LEO service directly and via resellers |
| PT Aplikanusa Lintasarta | Enterprise network provider | Runs a large remote VSAT network |
| PT Primacom Interbuana | Connectivity integrator | Authorized Starlink reseller since 2024 |
| Kacific Broadband Satellites Group | Regional HTS operator | Supplies Ka-band backhaul with Teleglobal |
| Thaicom Public Company Limited | Regional satellite operator | Leases IPSTAR-1 Ku-band capacity |
| SES S.A. | Global satellite operator | Supplies SES-9 capacity through Telkom |
| Eutelsat Group | Global multi-orbit operator | Sells OneWeb LEO service through AREA31 |
| Viasat Inc. | Global mobility operator | Co-founded the Equatys direct-to-device venture |
Capacity scarcity favors operators that add orbits
Credence Research's view is that satellite communications spending in Indonesia will keep growing because no terrestrial network can reach every island economically. Public programs will remain the largest single buyer, while LEO services win households, small firms and vessels that need low latency. Capacity shortages in 2025 show that demand is running ahead of supply, so new HTS satellites and a funded SATRIA-2 program would lift growth. However, terminal prices and congestion could slow household uptake, so operators that combine GEO, LEO and terrestrial links should gain the most.
Operator filings and official program data anchor the model
The report uses 2025 as the base year on a calendar basis, and market values come from the Credence Research model. That model draws on government program data on public access points and base stations, operator and company releases on satellite capacity, published retail prices, fisheries regulations and official statistics on internet use and regional output. Segment splits and regional growth rates are Credence Research estimates, with regional shares taken from the client data. Sources used are ministry and agency statements, World Bank and BPS data, company releases and trade press, and no interviews or surveys were used.
Hybrid GEO and LEO networks carry growth to 2035
Satellite communications spending is expected to reach USD 1.52 billion by 2035, a 9.94% CAGR during 2026–2035, as more public sites, vessels and companies rely on satellite links. Growth should stay strong through 2030 as Nusantara Lima fills its beams and LEO capacity expands. After that, direct-to-device service and a possible SATRIA-2 could add new demand from phones and public programs. Hybrid packages that combine orbits should gain share among offerings, while Eastern Indonesia and maritime users are expected to grow fastest through 2035.
Frequently Asked Questions
How big is the Indonesia satellite communications market?
Do geostationary or low Earth orbit links earn more spending?
Which region of Indonesia spends the most on satellite links?
How many public sites does SATRIA-1 connect?
Why did Starlink limit new sign-ups in Indonesia?
Which end-use industry is growing fastest?
Which companies compete in Indonesian satellite communications?
What could slow growth in satellite connectivity?
Table of Content
Chapter 1 Market Segmentation
- 1.1 Segmentation Framework
- 1.1.1 Product and Service Classification
- 1.1.2 Application and End-Use Classification
- 1.1.3 Technology and Solution Classification
- 1.1.4 Customer and Distribution Channel Classification
- 1.1.5 Geographic Segmentation
- 1.1.6 Market Segment Definitions and Boundaries
- 1.2 By Offering
- 1.2.1 Ground Equipment
- 1.2.2 Satellite Services
- 1.2.3 Integrated Connectivity Solutions
- 1.3 By Orbit Type
- 1.3.1 Geostationary Orbit
- 1.3.2 Low Earth Orbit
- 1.3.3 Medium Earth Orbit
- 1.4 By End-Use Industry
- 1.4.1 Government and Public Services
- 1.4.2 Enterprise and Natural Resources
- 1.4.3 Maritime and Fisheries
- 1.4.4 Media and Telecommunications
- 1.5 By Application
- 1.5.1 Broadband Access
- 1.5.2 Enterprise Backhaul
- 1.5.3 Mobility Connectivity
- 1.5.4 Broadcast and Media Distribution
Chapter 2 Introduction
- 2.1 Report Objectives and Scope
- 2.2 Product Definition and Industry Terminology
- 2.3 Market Inclusions and Exclusions
- 2.4 Research Process
- 2.4.1 Primary Research and Expert Interviews
- 2.4.2 Secondary Research and Source Review
- 2.4.3 Top-Down and Bottom-Up Estimation
- 2.4.4 Data Triangulation and Verification
- 2.5 Market Size Measurement Basis
- 2.5.1 2025: USD 555.5 million → 2035: USD 1.52 billion
- 2.6 Historical and Forecast Reference Periods
- 2.6.1 Historical Period: 2018-2025
- 2.6.2 Base Year: 2025
- 2.6.3 Forecast Period: 2025-2035
- 2.7 Research Assumptions and Limitations
Chapter 3 Executive Summary
- 3.1 Market Snapshot and Key Findings
- 3.2 Base-Year Market Size, 2025
- 3.3 Forecast Market Size, 2035
- 3.4 Revenue and Volume Growth Outlook
- 3.5 Key Demand and Supply Indicators
- 3.6 Leading Market Segments
- 3.7 Fastest-Growing Market Opportunities
- 3.8 Regional Performance Highlights
- 3.9 Technology and Industry Transformation
- 3.10 Competitive Landscape Summary
- 3.11 Analyst View and Strategic Implications
Chapter 4 Indonesia Satellite Communications Market Trends and Developments
- 4.1 Historical Industry Development, 2018-2025
- 4.2 Recent Market Trends and Developments
- 4.3 Demand and Customer Behavior Trends
- 4.4 Technology and Product Innovation
- 4.5 Artificial Intelligence, Automation and Digitalization
- 4.6 Local Manufacturing and Supply Chain Realignment
- 4.7 Industry Partnerships, Mergers and Acquisitions
- 4.8 Sustainability and Circular Economy Developments
- 4.9 Government and Private Sector Investment Trends
- 4.10 Emerging Business Models and Commercialization
- 4.11 Industry Developments and Announcements
Chapter 5 Indonesia Satellite Communications Market Production, Supply and Demand Analysis
- 5.1 Demand Trend and Consumption Analysis, 2018-2025
- 5.2 Demand Forecast, 2025-2035
- 5.3 Production and Output Trend, 2018-2025
- 5.4 Production and Output Forecast, 2025-2035
- 5.5 Installed Capacity and Capacity Utilization
- 5.6 Company-Wise Production Plants and Statistics
- 5.6.1 Installed Production Capacity
- 5.6.2 Actual Production
- 5.6.3 Planned Capacity and Expansion Targets
- 5.7 Supply Chain Structure and Procurement Trends
- 5.8 Supply-Demand Gap and Bottlenecks
- 5.9 Import Dependence and Sourcing Structure
- 5.10 Contract Manufacturing and Outsourcing
- 5.11 Regional Supply and Demand Concentration
Chapter 6 Indonesia Satellite Communications Market Pricing Analysis
- 6.1 Pricing Structure and Measurement
- 6.2 Historical Pricing Trends, 2018-2025
- 6.3 Pricing Outlook, 2025-2035
- 6.4 Average Selling Price and Unit Economics
- 6.5 Pricing by Product and Market Segment
- 6.6 Geographic Pricing Differences
- 6.7 Key Input, Energy, Labor and Logistics Costs
- 6.8 Contract Pricing and Purchasing Models
- 6.9 Pricing Sensitivity and Competitive Positioning
- 6.10 Price, Margin and Profitability Implications
Chapter 7 Indonesia Satellite Communications Market Dynamics
- 7.1 Market Growth Drivers
- 7.1.1 Demand-Side Drivers
- 7.1.2 Technology and Innovation Drivers
- 7.1.3 Infrastructure and Investment Drivers
- 7.1.4 Regulatory and Policy Drivers
- 7.2 Market Restraints
- 7.2.1 Cost and Affordability Constraints
- 7.2.2 Technology and Adoption Barriers
- 7.2.3 Supply Chain and Operational Constraints
- 7.3 Market Challenges
- 7.3.1 Competitive Pressure and Margin Erosion
- 7.3.2 Skills, Infrastructure and Implementation Gaps
- 7.4 Emerging Market Opportunities
- 7.5 Market Dynamics Impact and Time-Horizon Assessment
Chapter 8 Indonesia Satellite Communications Value Chain Analysis
- 8.1 Industry Value Chain Overview
- 8.2 Upstream Suppliers and Critical Inputs
- 8.3 Technology and Component Providers
- 8.4 Manufacturing or Service Delivery
- 8.5 Distribution, Channel Partners and Integrators
- 8.6 Downstream Applications and End Users
- 8.7 Value Addition and Profit Pools
- 8.8 Vertical Integration and Outsourcing
- 8.9 Supplier Concentration and Risk
- 8.10 Supply Chain Localization and Resilience
Chapter 9 Indonesia Satellite Communications Market Regulations and Policies
- 9.1 Relevant Laws, Standards and Compliance Frameworks
- 9.2 Product, Service, Safety and Quality Requirements
- 9.3 Government Policies, Incentives and Subsidies
- 9.4 Imports, Exports and Trade Barriers
- 9.5 Public Procurement and Local Content Requirements
- 9.6 Environmental and Sustainability Compliance
- 9.7 Data Protection, AI and Cybersecurity Compliance
- 9.8 Upcoming Policy Changes and Market Implications
Chapter 10 Indonesia Satellite Communications Market Hotspots and Opportunities
- 10.1 Market Opportunity Mapping and Growth Hotspots
- 10.2 High-Growth Applications and Customer Groups
- 10.3 Underserved Markets and White-Space Opportunities
- 10.4 Emerging Technology and Product Opportunities
- 10.5 New Capacity and Investment Hotspots
- 10.6 Market Entry and Expansion Opportunities
- 10.7 Distribution and Partnership Opportunities
- 10.8 Near-Term and Long-Term Commercial Potential
- 10.9 Opportunity Attractiveness and Execution Risks
Chapter 11 Indonesia Satellite Communications Market Outlook, 2025-2035
- 11.1 Market Size and Analysis
- 11.1.1 Revenue (Market Measurement: 2025: USD 555.5 million → 2035: USD 1.52 billion)
- 11.1.2 Market Volume and Quantity Sold
- 11.1.3 Historical Market Size, 2018-2025
- 11.1.4 Base-Year Market Size, 2025
- 11.2 Market Forecast, 2025-2035
- 11.2.1 Revenue Forecast to 2035
- 11.2.2 Volume Forecast to 2035
- 11.2.3 CAGR and Year-on-Year Growth
- 11.2.4 Incremental Revenue Opportunity
- 11.3 Forecast Assumptions and Scenario Analysis
- 11.3.1 Base-Case Forecast
- 11.3.2 Optimistic and Conservative Scenarios
- 11.3.3 Technology, Pricing and Policy Sensitivities
- 11.4 Market Attractiveness and Growth Outlook
Chapter 12 Indonesia Satellite Communications Market Segmentation and Outlook
- 12.1 Segmentation Summary and Market Shares, 2025
- 12.2 Largest and Fastest-Growing Segments
- 12.3 By Offering - Market Size and Forecast, 2025-2035
- 12.3.1 Segment Definition and Scope
- 12.3.2 Historical Market Size, 2018-2025
- 12.3.3 Revenue Forecast, 2025-2035
- 12.3.4 Volume Forecast, 2025-2035
- 12.3.5 Base-Year Market Share, 2025
- 12.3.6 Segment CAGR and Growth Drivers
- 12.3.7 Subsegment Market Size and Forecast
- 12.3.7.1 Ground Equipment
- 12.3.7.2 Satellite Services
- 12.3.7.3 Integrated Connectivity Solutions
- 12.3.8 Subsegment Pricing and Adoption Trends
- 12.3.9 Leading Suppliers and Competition
- 12.3.10 Regional Demand and Opportunities
- 12.4 By Orbit Type - Market Size and Forecast, 2025-2035
- 12.4.1 Segment Definition and Scope
- 12.4.2 Historical Market Size, 2018-2025
- 12.4.3 Revenue Forecast, 2025-2035
- 12.4.4 Volume Forecast, 2025-2035
- 12.4.5 Base-Year Market Share, 2025
- 12.4.6 Segment CAGR and Growth Drivers
- 12.4.7 Subsegment Market Size and Forecast
- 12.4.7.1 Geostationary Orbit
- 12.4.7.2 Low Earth Orbit
- 12.4.7.3 Medium Earth Orbit
- 12.4.8 Subsegment Pricing and Adoption Trends
- 12.4.9 Leading Suppliers and Competition
- 12.4.10 Regional Demand and Opportunities
- 12.5 By End-Use Industry - Market Size and Forecast, 2025-2035
- 12.5.1 Segment Definition and Scope
- 12.5.2 Historical Market Size, 2018-2025
- 12.5.3 Revenue Forecast, 2025-2035
- 12.5.4 Volume Forecast, 2025-2035
- 12.5.5 Base-Year Market Share, 2025
- 12.5.6 Segment CAGR and Growth Drivers
- 12.5.7 Subsegment Market Size and Forecast
- 12.5.7.1 Government and Public Services
- 12.5.7.2 Enterprise and Natural Resources
- 12.5.7.3 Maritime and Fisheries
- 12.5.7.4 Media and Telecommunications
- 12.5.8 Subsegment Pricing and Adoption Trends
- 12.5.9 Leading Suppliers and Competition
- 12.5.10 Regional Demand and Opportunities
- 12.6 By Application - Market Size and Forecast, 2025-2035
- 12.6.1 Segment Definition and Scope
- 12.6.2 Historical Market Size, 2018-2025
- 12.6.3 Revenue Forecast, 2025-2035
- 12.6.4 Volume Forecast, 2025-2035
- 12.6.5 Base-Year Market Share, 2025
- 12.6.6 Segment CAGR and Growth Drivers
- 12.6.7 Subsegment Market Size and Forecast
- 12.6.7.1 Broadband Access
- 12.6.7.2 Enterprise Backhaul
- 12.6.7.3 Mobility Connectivity
- 12.6.7.4 Broadcast and Media Distribution
- 12.6.8 Subsegment Pricing and Adoption Trends
- 12.6.9 Leading Suppliers and Competition
- 12.6.10 Regional Demand and Opportunities
- 12.7 Segment Growth Comparison
- 12.8 Segment Attractiveness and Priority Matrix
Chapter 13 Indonesia Satellite Communications End-Use and Application Market Outlook
- 13.1 End-Use Industry and Customer Demand Structure
- 13.2 Leading Applications and Customer Groups
- 13.3 End-Use Market Size, Share and Forecast
- 13.4 Major End-Use Industry Deep Dives
- 13.4.1 Customer Requirements and Use Cases
- 13.4.2 Demand and Replacement Cycles
- 13.4.3 Technical and Regulatory Considerations
- 13.4.4 Purchasing and Procurement Models
- 13.4.5 Leading Vendors and Distribution Channels
- 13.4.6 Forecast and Commercial Opportunities
- 13.5 Emerging Applications and Cross-Segment Demand
- 13.6 End-Use Industry Investment Priorities
Chapter 14 Indonesia Satellite Communications Geographic Market Outlook, 2025-2035
- 14.1 Domestic Market Distribution and Demand Clusters
- 14.2 State- or Province-Wise Market Size and Forecast, 2025-2035
- 14.3 City and Metropolitan Market Outlook
- 14.4 Industrial, Manufacturing and Commercial Clusters
- 14.5 Geographic Concentration of Key End Users
- 14.6 Local Pricing and Purchasing Differences
- 14.7 Domestic Production Facilities and Capacity Map
- 14.8 Local Infrastructure and Project Pipeline
- 14.9 State-Level Policy and Incentive Differences
- 14.10 Subnational Investment Hotspots and Opportunities
- 14.11 Distribution and Logistics Networks
- 14.12 Domestic Competitive Footprint
Chapter 15 Indonesia Satellite Communications Technology, Innovation and Sustainability Outlook
- 15.1 Technology Landscape and Maturity
- 15.2 Product, Process and Service Innovation
- 15.3 AI, Automation and Digital Tools in the Industry
- 15.4 Technology Adoption and Performance Benchmarking
- 15.5 Innovation Pipeline and R&D Investment
- 15.6 Patent and Intellectual Property Trends
- 15.7 Energy Efficiency and Resource Management
- 15.8 Sustainability, Recycling and Circularity
- 15.9 Technology Roadmap, 2025-2035
- 15.10 Risks of Obsolescence and Technology Substitution
Chapter 16 Indonesia Satellite Communications Market Key Strategic Imperatives
- 16.1 Growth and Market Entry Priorities
- 16.2 High-Return Products and Segments
- 16.3 Pricing, Profitability and Cost Optimization
- 16.4 Technology Investment and Product Differentiation
- 16.5 Supply Chain Localization and Resilience
- 16.6 Distribution and Customer Acquisition
- 16.7 Partnership, Acquisition and Capacity Strategy
- 16.8 Regional Expansion Priorities
- 16.9 Short-, Medium- and Long-Term Actions
Chapter 17 Competition Outlook
- 17.1 Industry Competition Characteristics
- 17.2 Market Structure and Concentration
- 17.3 Market Share and Competitive Positioning, 2025
- 17.4 Company-Wise Revenue and Product Benchmarking
- 17.5 Production and Service Capacity Benchmarking
- 17.6 Technology, Pricing and Differentiation
- 17.7 Regional Footprint and Distribution Strength
- 17.8 Mergers, Acquisitions and Strategic Alliances
- 17.9 New Entrants and Competitive Threats
- 17.10 Porter's Five Forces and Industry Attractiveness
- 17.11 Competitive Outlook, 2025-2035
Chapter 18 Company Profiles
- 18.1 Company Coverage and Selection Criteria
- 18.2 PT Telkom Satelit Indonesia
- 18.2.1 Business Description
- 18.2.2 Company Ownership and Geographic Presence
- 18.2.3 Product and Service Portfolio
- 18.2.4 Manufacturing and Operating Footprint
- 18.2.5 Production Capacity and Expansion Plans
- 18.2.6 Financial Performance and Investment
- 18.2.7 Market Share and Competitive Position
- 18.2.8 Technology and Innovation Capabilities
- 18.2.9 Strategic Alliances or Partnerships
- 18.2.10 Recent Developments
- 18.2.11 Growth Strategy and Outlook
- 18.3 PT Pasifik Satelit Nusantara
- 18.4 PT Starlink Services Indonesia
- 18.5 PT Aplikanusa Lintasarta
- 18.6 PT Primacom Interbuana
- 18.7 Kacific Broadband Satellites Group
- 18.8 Thaicom Public Company Limited
- 18.9 SES S.A.
- 18.10 Eutelsat Group
- 18.11 Viasat Inc.
- 18.12 Other Relevant Market Participants
Note: Every listed company is profiled on the structure shown under the first company. The company list is preliminary and may change based on research findings, market developments, data availability and client requirements.
Chapter 19 Disclaimer
- 19.1 Research and Forecast Disclaimer
- 19.2 Data Source and Estimation Limitations
Note: The depth of individual sections depends on data availability for this market. Volume, capacity, trade and other unit-based metrics are included where applicable.

