
Older patients and growing catchments fill hospital beds
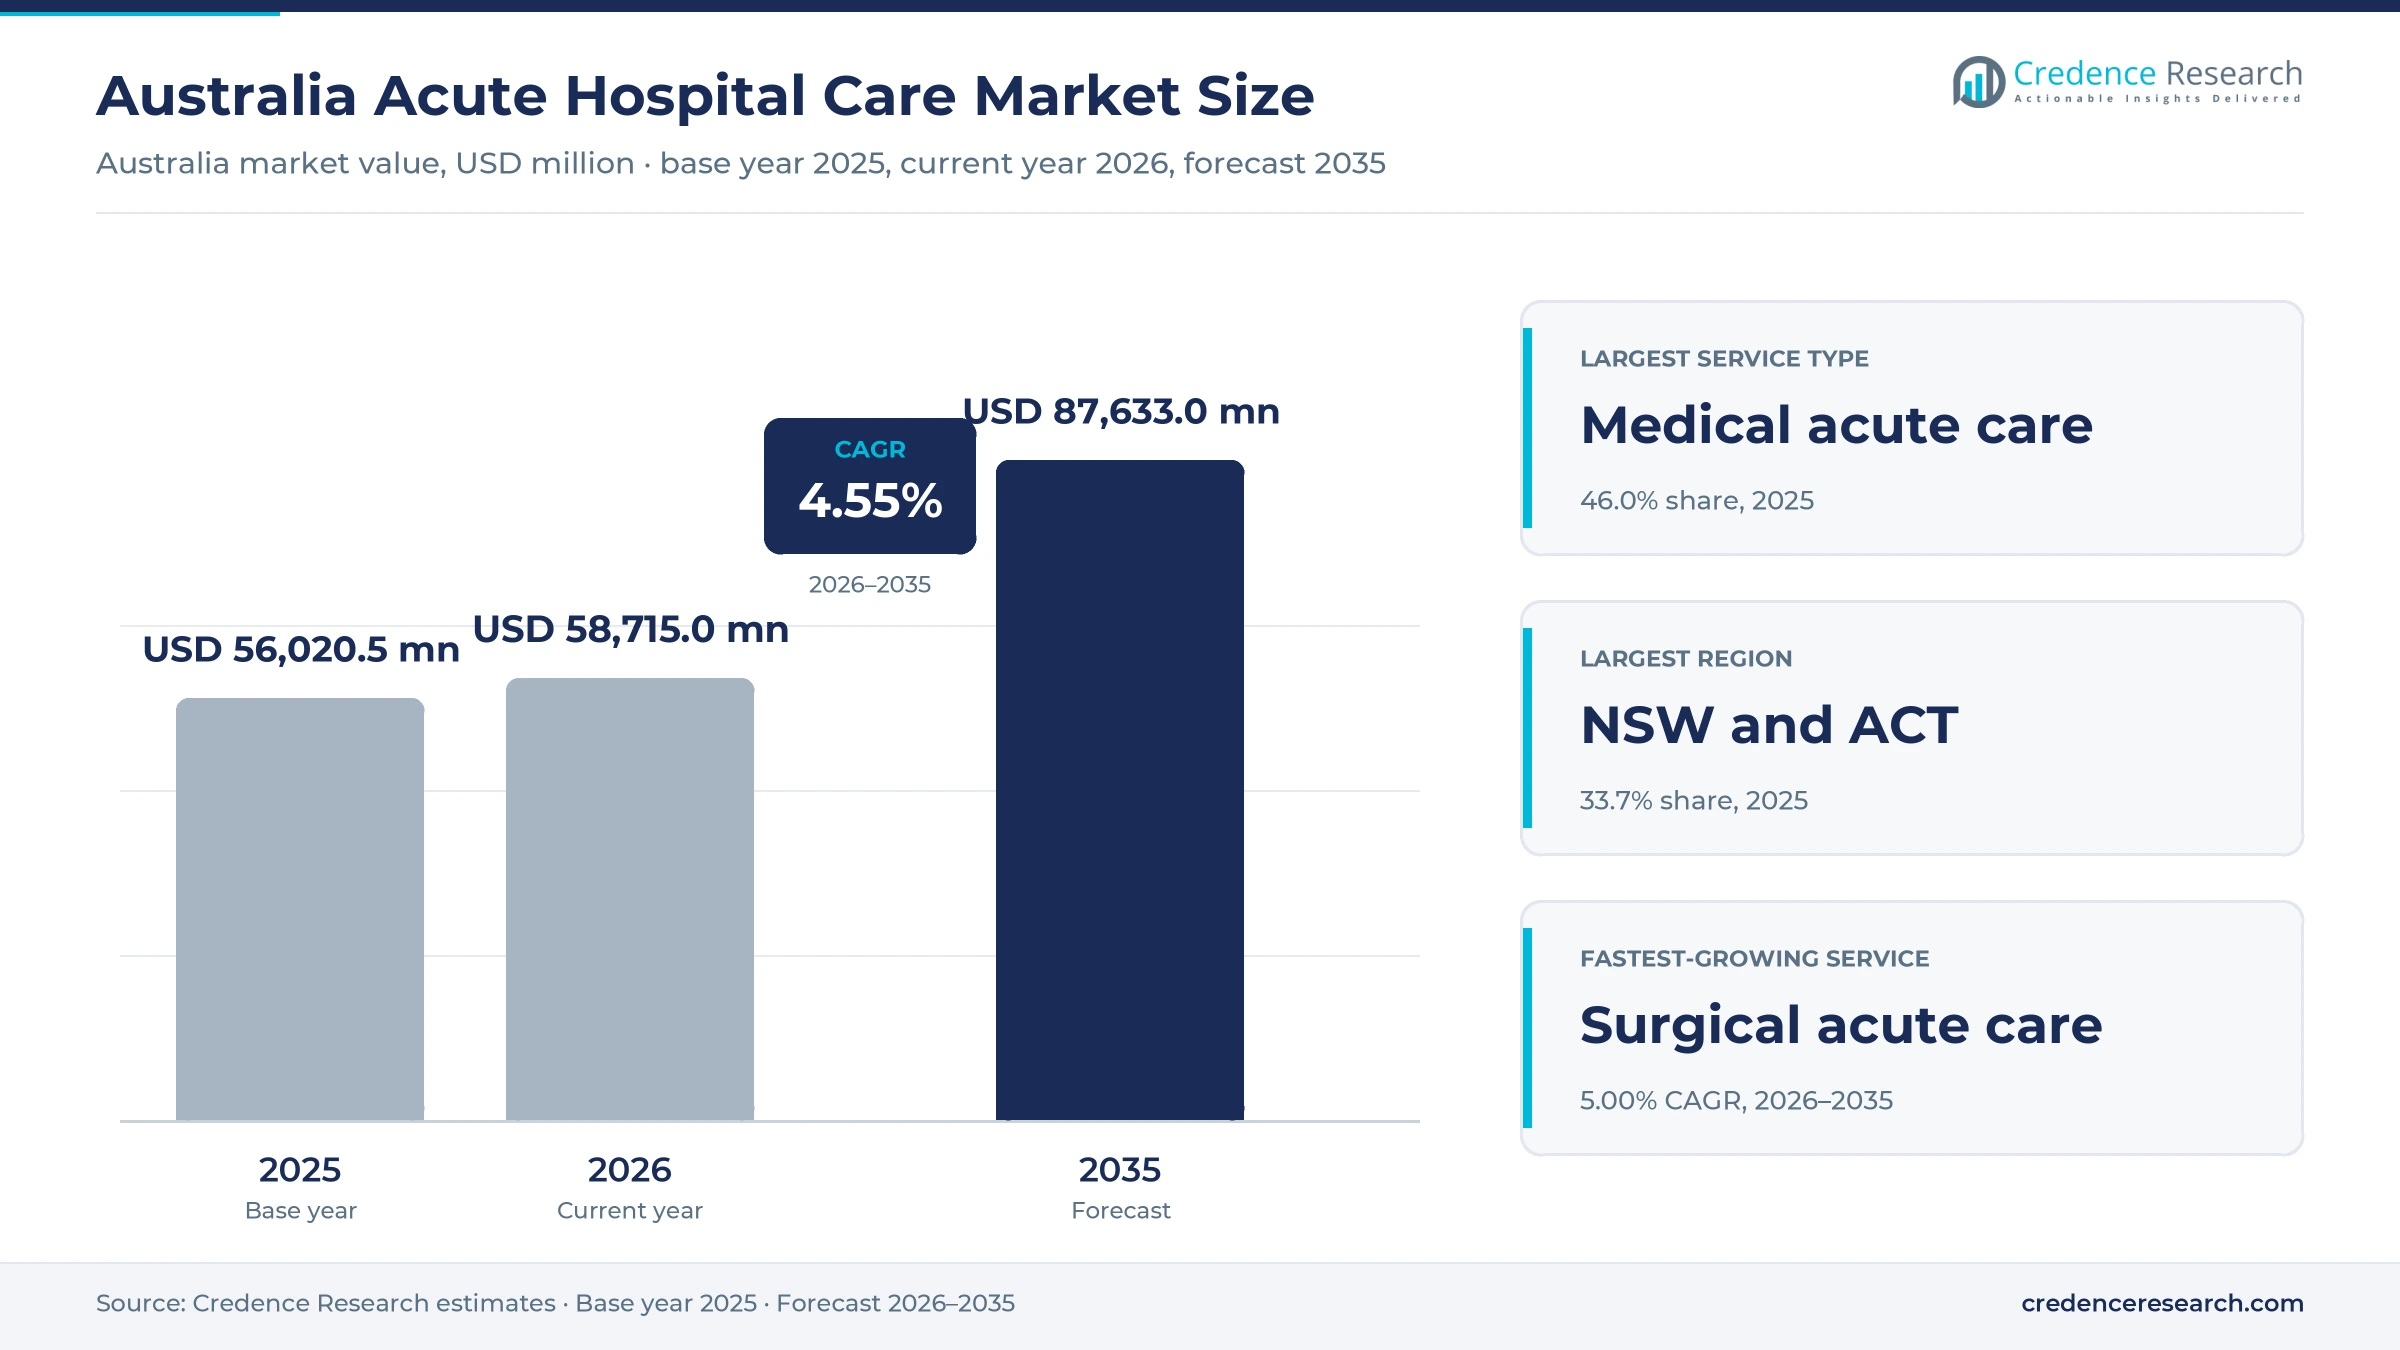
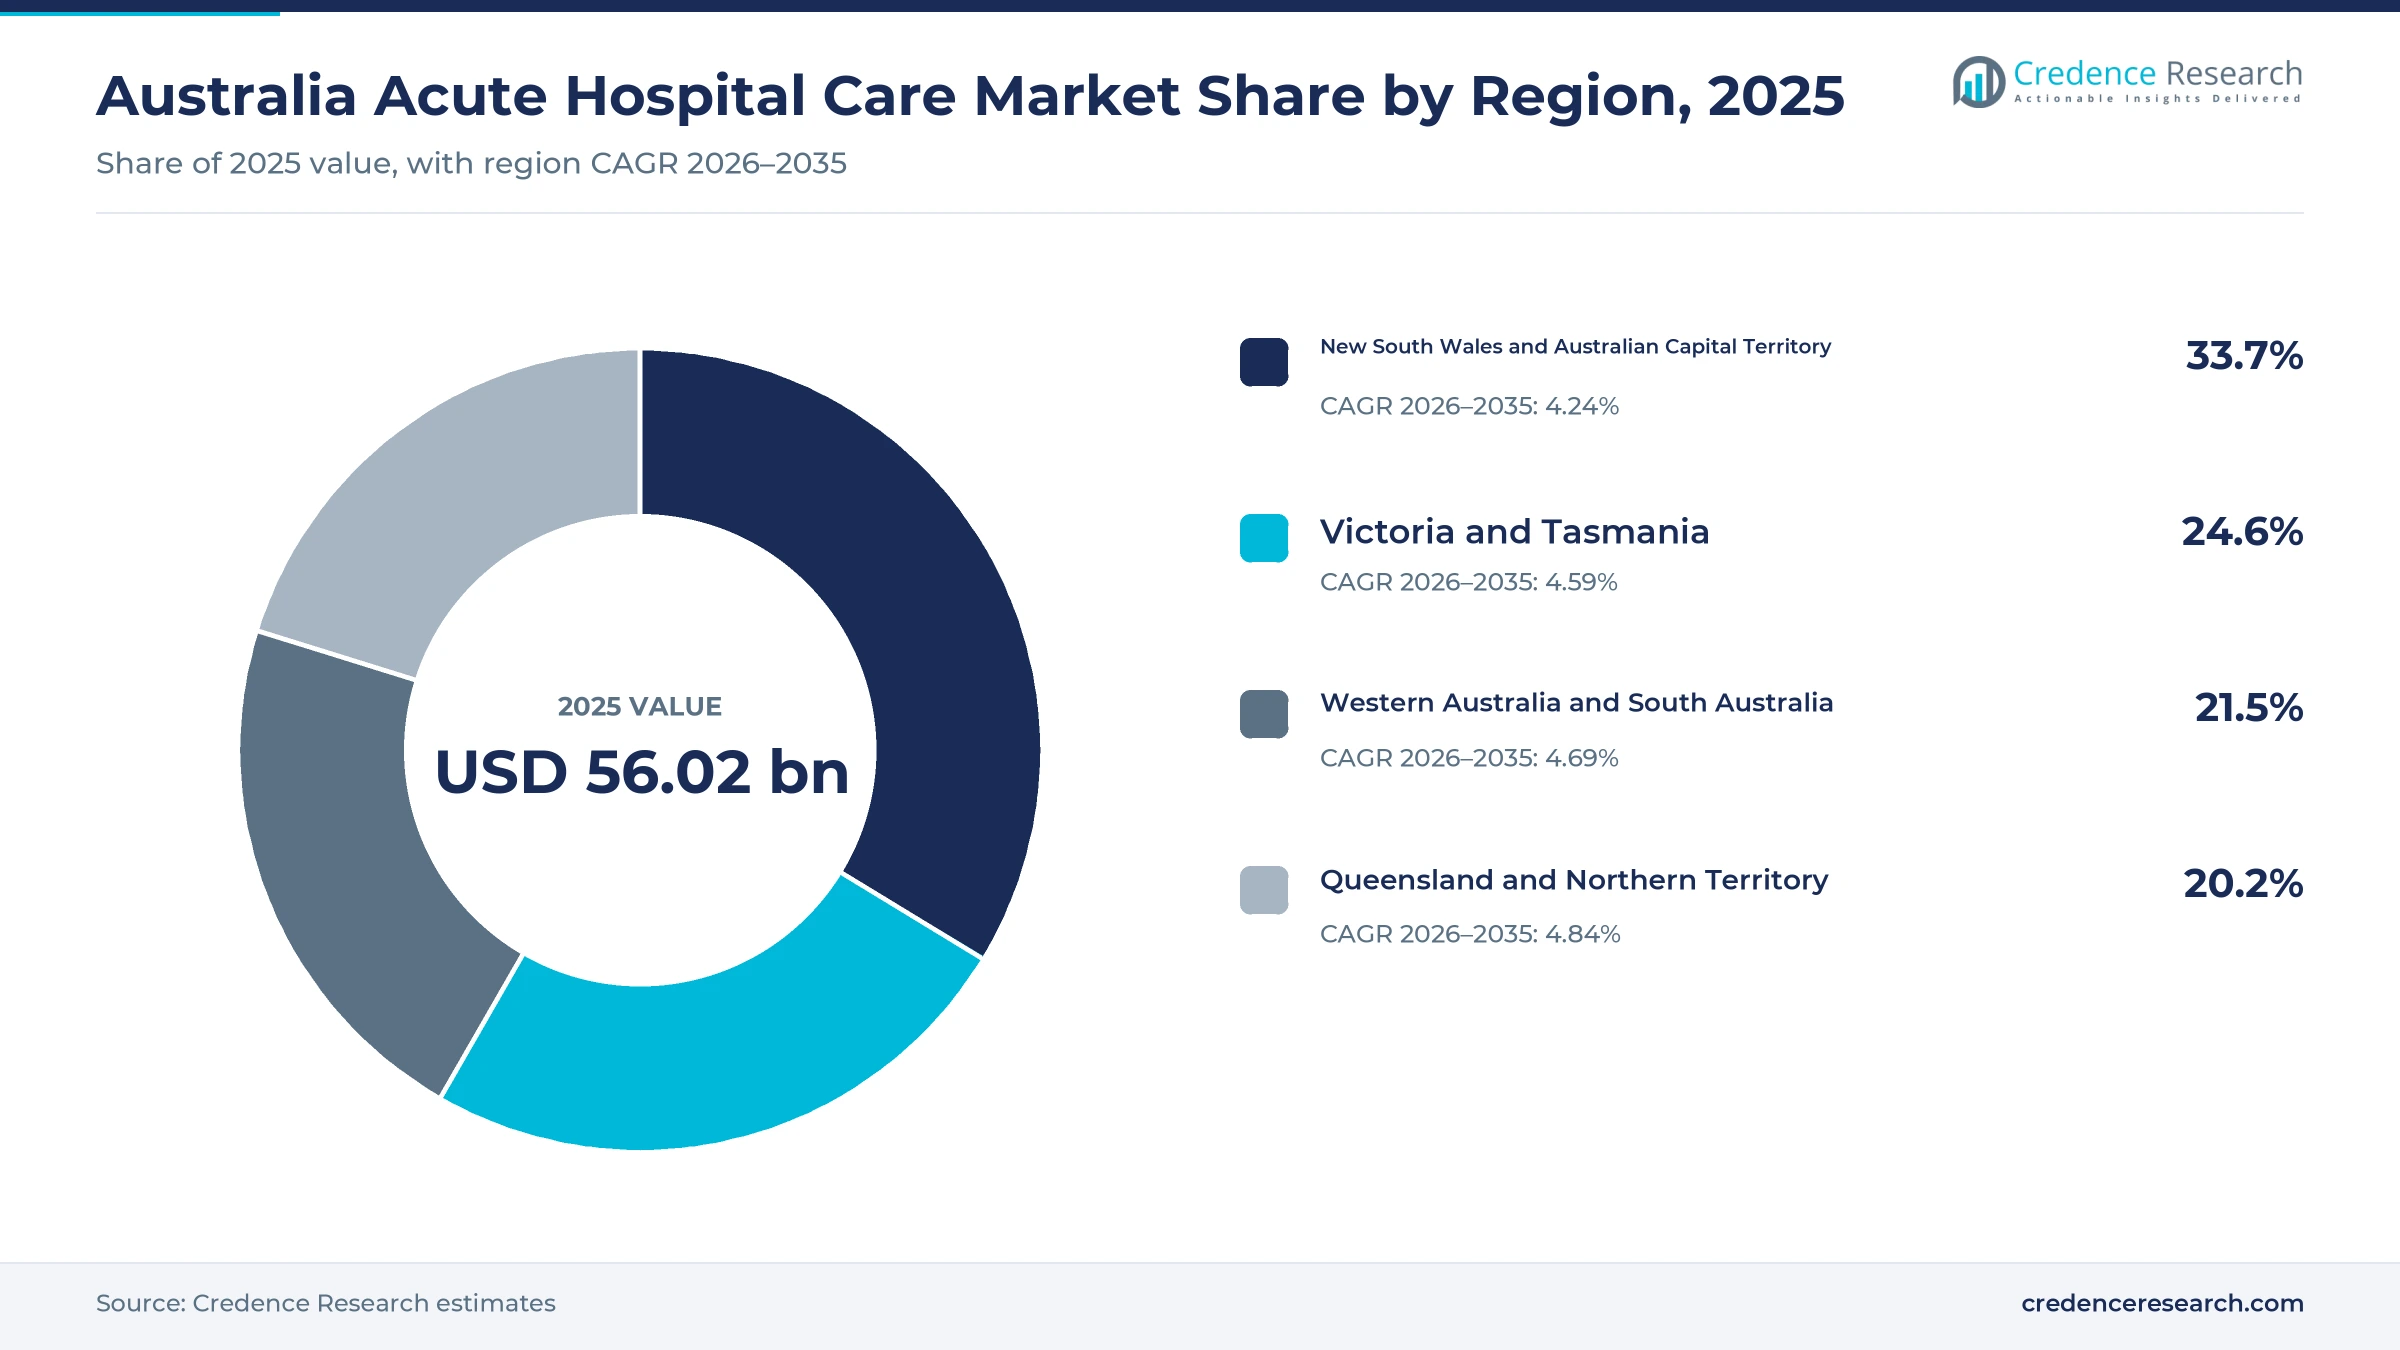
The Australia acute hospital care market was valued at USD 56.02 billion in 2025 and is projected to increase from USD 58.72 billion in 2026 to USD 87.63 billion by 2035, registering a CAGR of 4.55% during 2026–2035. Demand comes from public and private hospitals that admit patients for surgery, medical treatment, childbirth and emergency care, funded by states, the Commonwealth, private insurers and patients. New South Wales and the Australian Capital Territory held the largest regional share, 33.7% in 2025, because this zone has the largest population and the densest network of major hospitals. Queensland and the Northern Territory is the fastest-growing region at 4.84% a year, as Queensland adds beds and residents. However, the private sector is changing shape, because receivers are moving most Healthscope hospitals to a new not-for-profit operator while several sites pass to other groups.
Which hospital services and care settings does the estimate cover?
The estimate measures the value of acute care delivered in Australian public and private hospitals, including surgical, medical, obstetric and emergency department care. It counts overnight and same-day admitted episodes and emergency department encounters, whether they are paid by governments, private health insurers or patients.
The estimate excludes residential aged care, subacute rehabilitation, mental health beds outside acute wards, general practice and outpatient clinics that do not lead to an admission. The value chain runs from Commonwealth and state funding and insurer benefits through hospital operators to clinicians, suppliers and the patients they treat.
Australia Acute Hospital Care Market Insights
- The Australia acute hospital care market was valued at USD 56.02 billion in 2025 and is projected to reach USD 87.63 billion by 2035, registering a CAGR of 4.55% during 2026–2035.
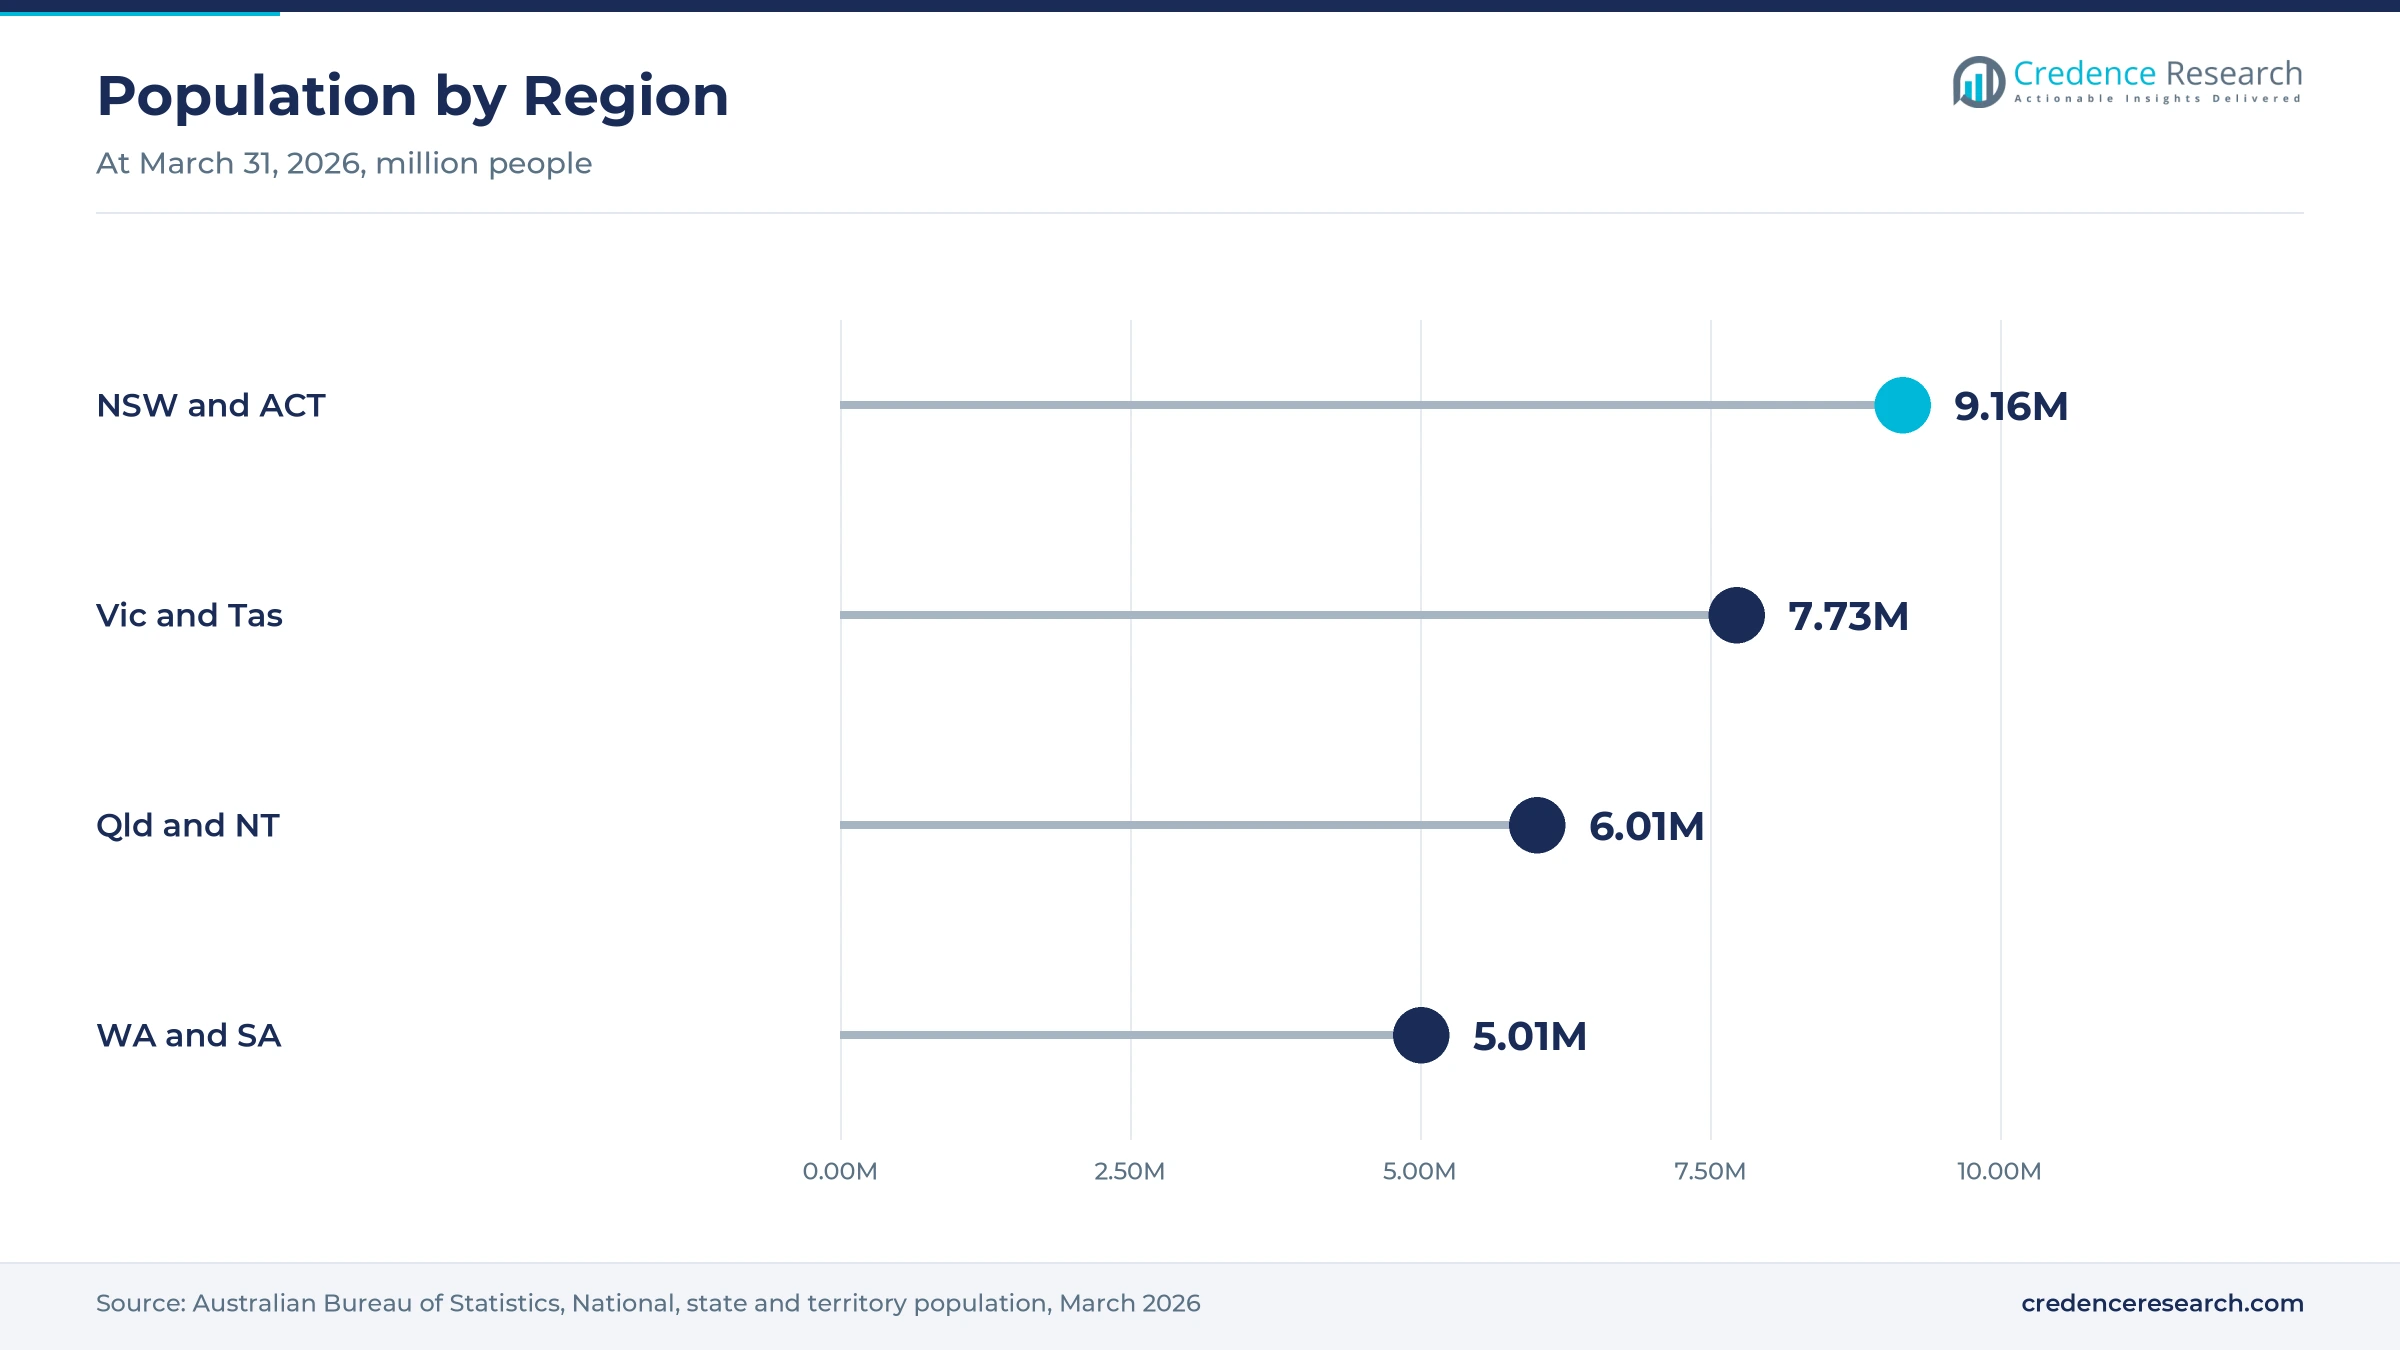
- New South Wales and the Australian Capital Territory held a 33.7% share of 2025 value, because the zone had about 9.2 million residents at March 31, 2026.
- Medical acute care led with a 46.0% share of 2025 value, because heart, lung, cancer and infection admissions fill most acute medical beds every year.
- Australian hospitals recorded 12.6 million hospitalizations in 2023–24, up from 10.2 million in 2014–15, with 59% in public hospitals and 41% in private hospitals.
- Private not-for-profit hospitals grow fastest at 5.20% a year during 2026–2035, as a new nonprofit operator takes over 31 Healthscope hospitals.
Medical care leads while surgical activity grows fastest
Why does medical acute care hold the largest value?
Based on service type, the market is categorized into surgical acute care, medical acute care, obstetric acute care and emergency department care. Medical acute care led with a 46.0% share of 2025 value, because heart, lung, cancer and infection admissions fill most acute beds. Surgical acute care grows fastest at 5.00% a year, as public and private hospitals expand elective theater lists.
How do overnight stays dominate admitted care value?
Based on care setting, the market is categorized into overnight admitted care, same-day admitted care and emergency department encounters. Overnight admitted care led with a 62.0% share of 2025 value, because overnight episodes use far more nursing time and bed days. Same-day admitted care grows fastest at 5.14% a year, as day surgery, dialysis and chemotherapy shift away from overnight beds.
Why do older patients account for the most value?
Based on end user, the market is categorized into patients aged 0–17, patients aged 18–64 and patients aged 65 and above. Patients aged 65 and above led with a 50.0% share of 2025 value, because this group accounts for most patient days. Patients aged 65 and above also grow fastest at 5.01% a year, as the number of older Australians keeps rising.
How do public hospitals anchor the operating mix?
Based on operating model, the market is categorized into public-operated hospitals, private for-profit hospitals and private not-for-profit hospitals. Public-operated hospitals led with a 66.0% share of 2025 value, because they handle most emergency and medical admissions. Private not-for-profit hospitals grow fastest at 5.20% a year, as 31 Healthscope hospitals move to a new nonprofit owner. Private for-profit hospitals remain important for insured elective surgery in major cities.
| Segment Group | Leading Sub-segment | Share, 2025 | Fastest-growing Sub-segment | CAGR, 2026–2035 |
|---|---|---|---|---|
| By Service Type | Medical acute care | 46.0% | Surgical acute care | 5.00% |
| By Care Setting | Overnight admitted care | 62.0% | Same-day admitted care | 5.14% |
| By End User | Patients aged 65 and above | 50.0% | Patients aged 65 and above | 5.01% |
| By Operating Model | Public-operated hospitals | 66.0% | Private not-for-profit hospitals | 5.20% |
Request a Free Sample
Fill in your details and we'll send you a free sample report.
- Sample data tables & charts
- Research methodology
Population, funding and surgery recovery lift admissions
How does catchment population growth lift admissions?
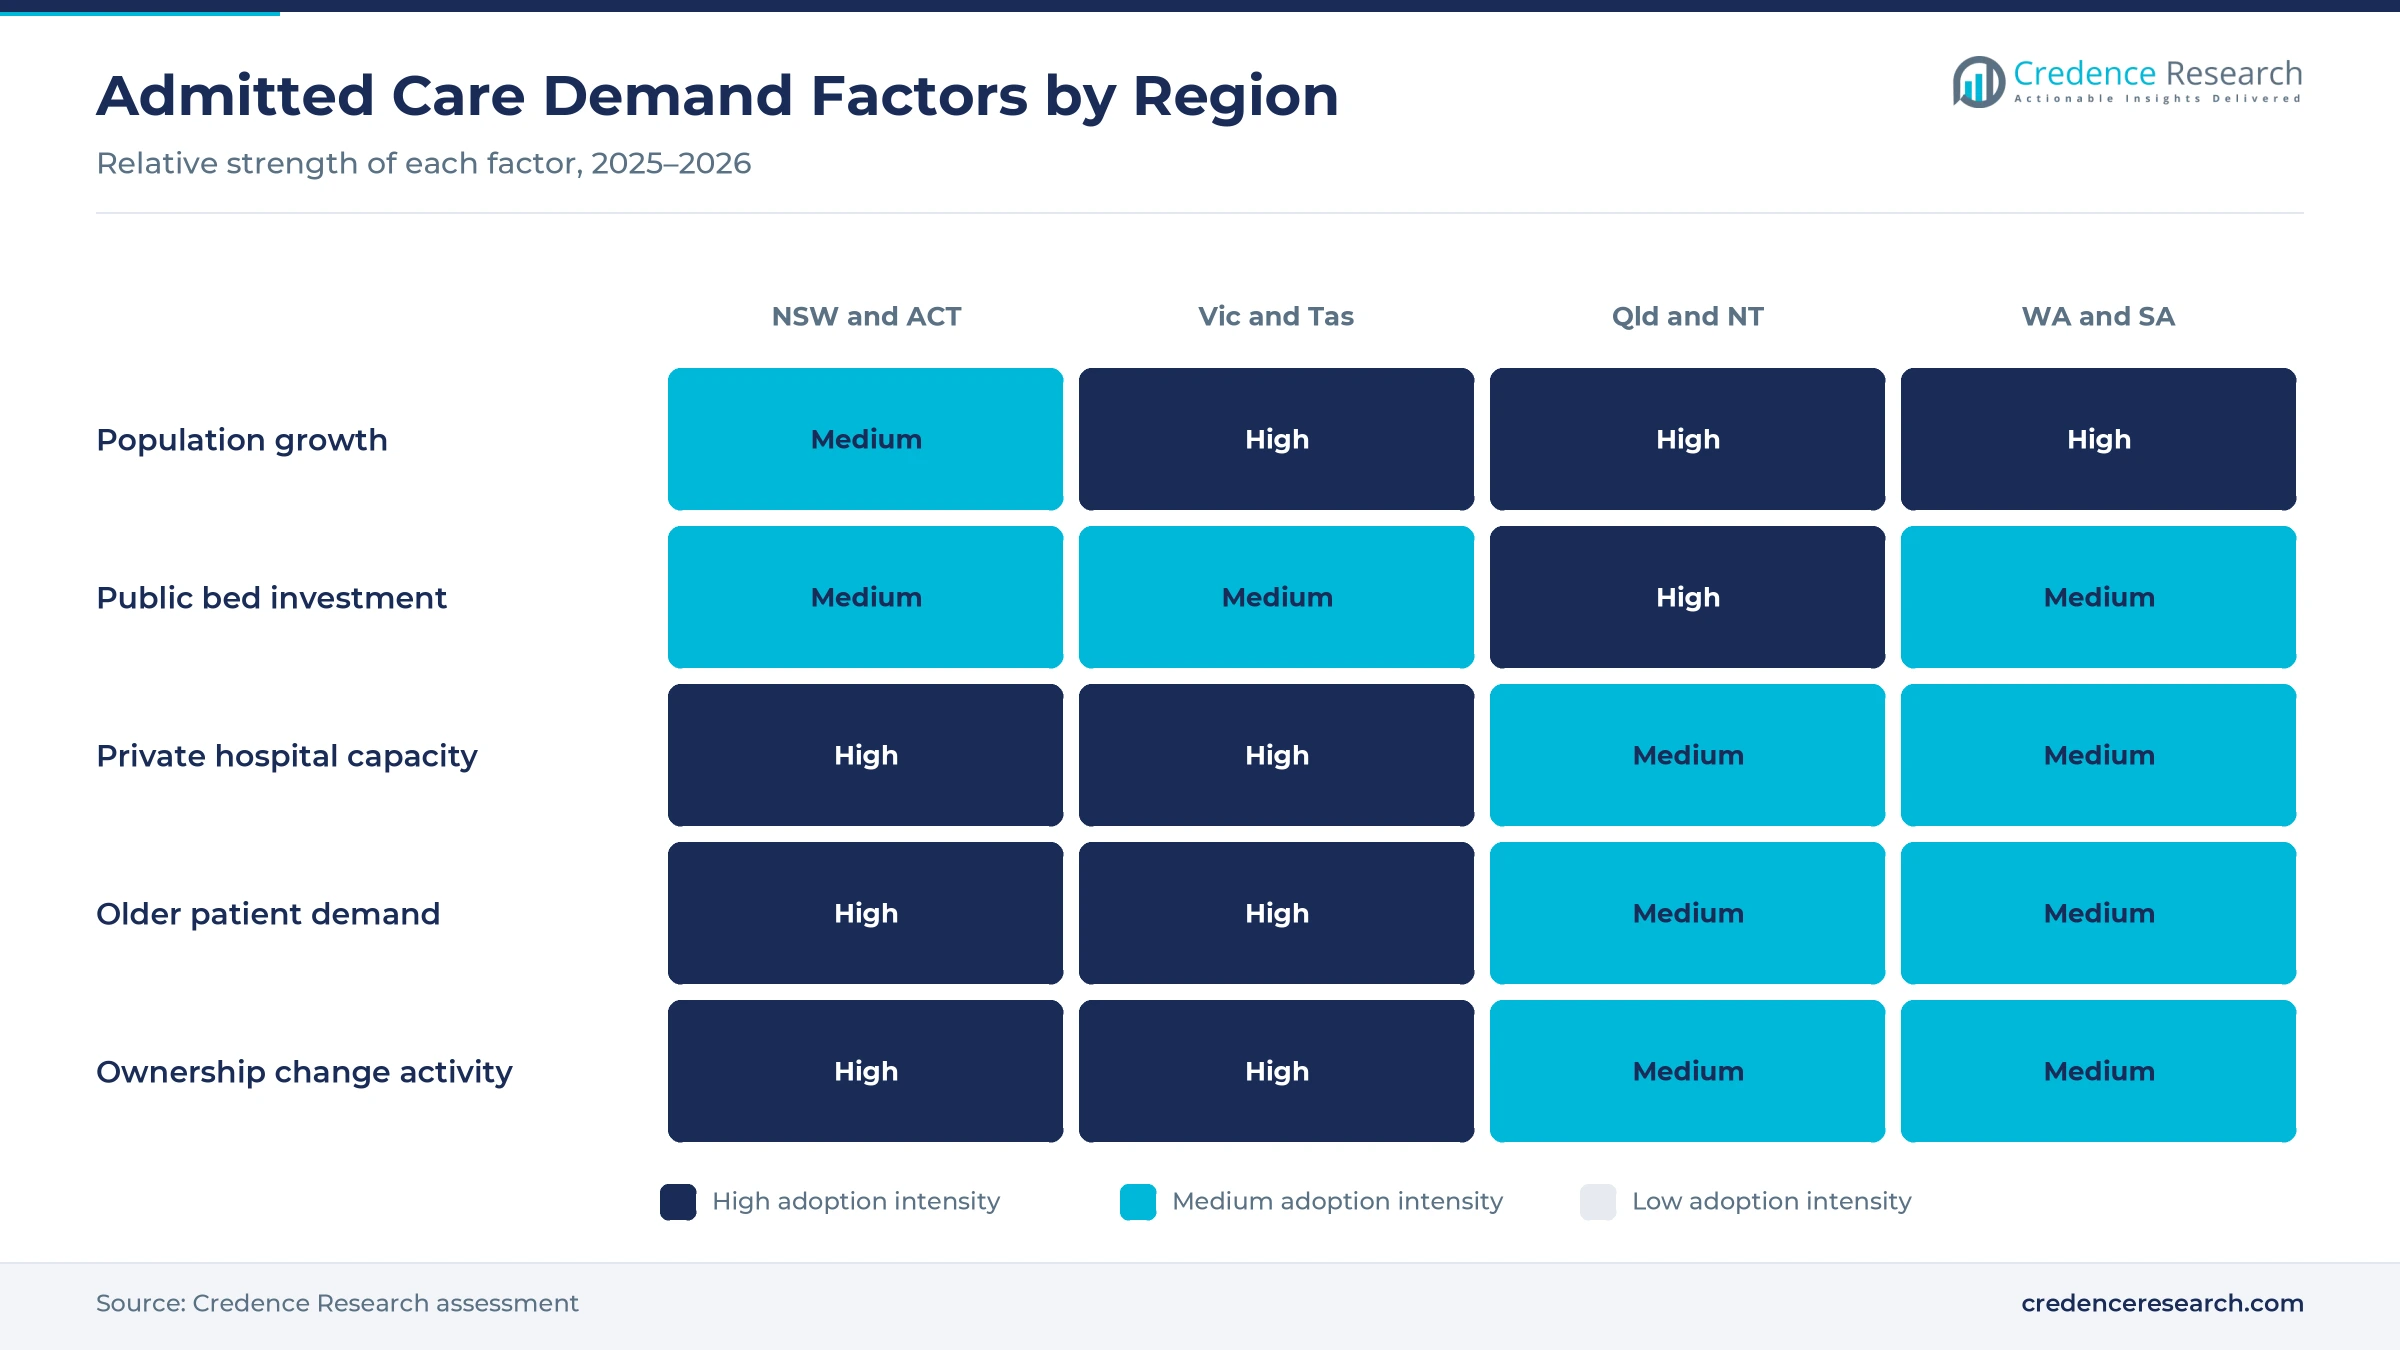
Population-linked catchment expansion lifts admissions, because every new resident adds expected hospital stays, births and emergency visits to a local network. Australia reached 27.9 million people at March 31, 2026, up 392,700 or 1.4% in a year, according to the Australian Bureau of Statistics. Western Australia grew fastest at 2.1%, while Victoria and Queensland each grew 1.6% over the same period. Hospitalizations also rose from 10.2 million in 2014–15 to 12.6 million in 2023–24, according to national hospital data released in May 2025. The rate reached 421 per 1,000 people, so use is rising faster than headcount. As a result, New South Wales and the Australian Capital Territory remain the largest zone, because they hold about 9.2 million residents and the densest hospital network.
Why does public hospital funding continuity support demand?
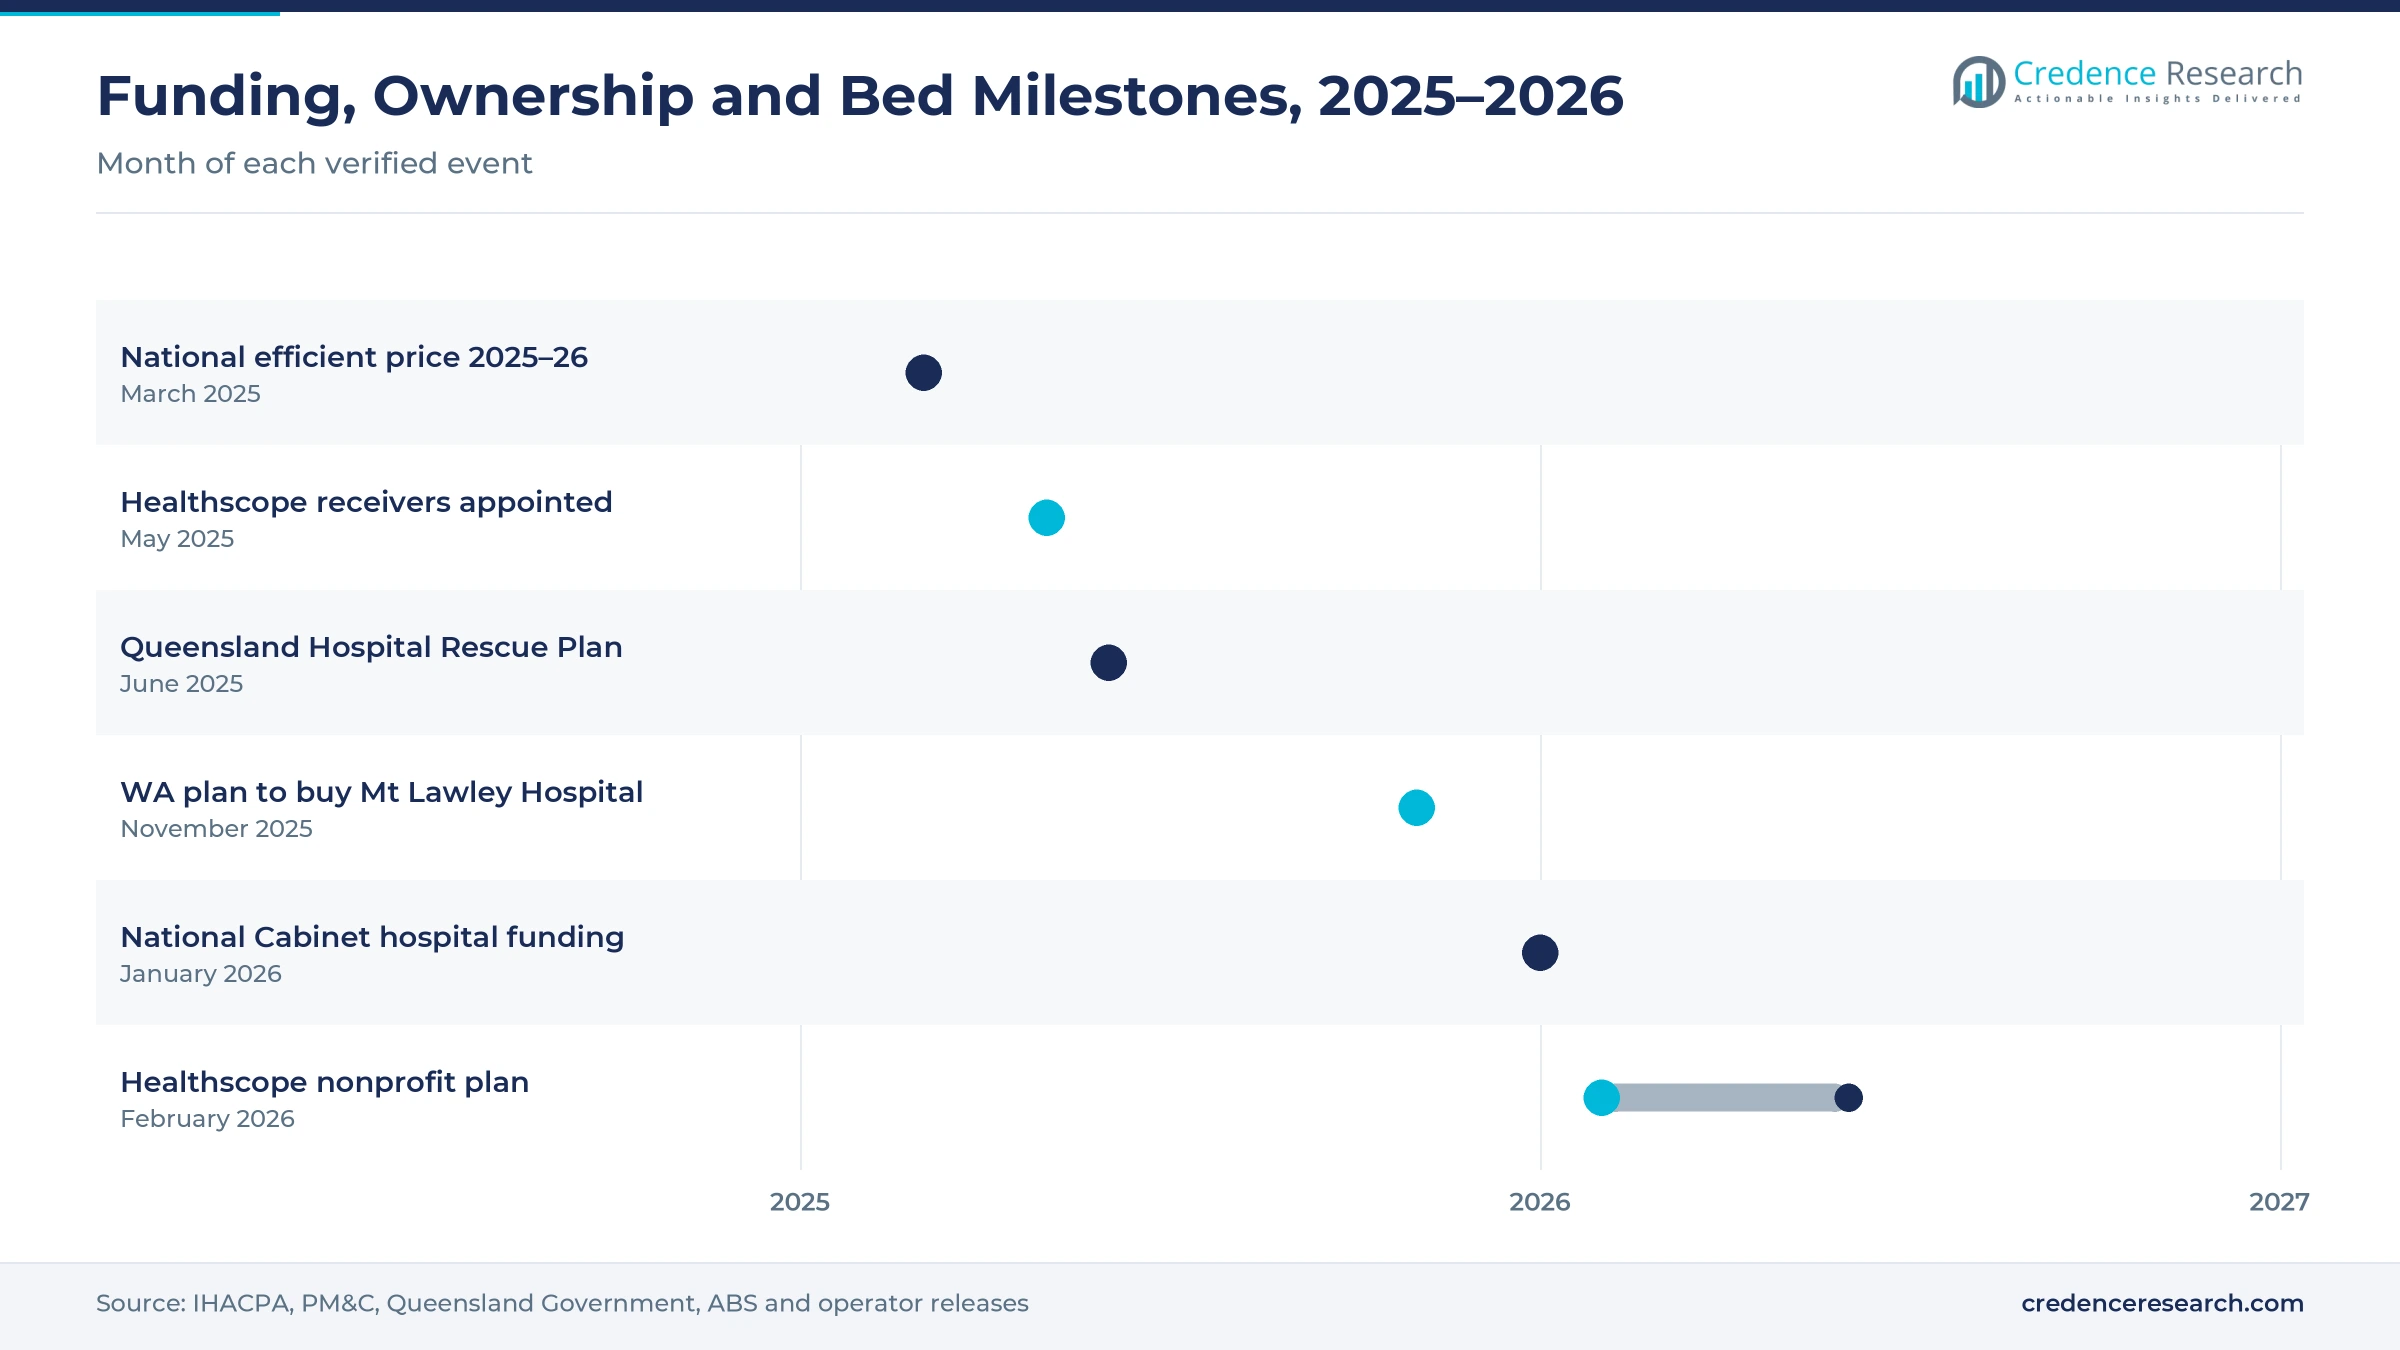
Public hospital funding continuity supports demand, because states can plan beds, staff and theaters against a known Commonwealth contribution. National Cabinet agreed on Jan. 30, 2026, to an extra $25 billion for public hospitals, lifting Commonwealth funding to $219.6 billion from 2026–27 to 2030–31, according to the Prime Minister’s office. The national efficient price for 2025–26 was set at $7,258 per weighted activity unit in March 2025. Queensland also committed $18.5 billion over five years to a Hospital Rescue Plan that promises more than 2,600 new beds. In turn, public-operated hospitals hold 66.0% of 2025 value, because activity-based funding pays for most admitted episodes in the country.
How does elective activity recovery raise surgical volumes?
Elective activity recovery raises surgical volumes, because hospitals are clearing waiting lists that grew during earlier disruptions. Public hospitals recorded 791,000 elective surgery admissions in 2024–25, up from 712,000 in 2015–16, according to national hospital statistics. Half of patients were admitted within 45 days, while 6.0% waited more than a year for surgery. Median cataract waits fell to 106 days from 189 days, which signals faster throughput for high-volume procedures. Private insurers also paid about $5.33 billion in hospital benefits in the June 2026 quarter, according to the prudential regulator. As a result, surgical acute care grows fastest at 5.00% a year during 2026–2035.
Why does an aging population raise bed-day demand?
An aging population raises bed-day demand, because older patients need longer stays and more complex medical care than younger adults. People aged 65 and over made up 17.7% of the Australian population in 2024, according to World Bank figures compiled by Destatis. This group accounted for 44% of hospitalizations and 52% of patient days in 2023–24, according to national hospital data. Overnight stays also made up 37% of the 12.6 million hospitalizations recorded that year. In turn, patients aged 65 and above hold 50.0% of 2025 value and grow fastest at 5.01% a year, because heart disease, cancer and joint conditions concentrate in this age group.
Same-day care and nonprofit ownership reshape supply
How is the shift toward same-day care changing capacity?
The shift toward same-day admitted care is changing capacity, because more procedures and treatments now finish without an overnight stay. Same-day episodes made up 63% of the 12.6 million hospitalizations in 2023–24, while 37% involved at least one night in hospital. Private hospitals handled 41% of all hospitalizations that year, and many of their surgical lists run as day cases. Day surgery assets are also changing hands, as Tweed Day Surgery transferred to Day Hospital Partners in October 2025. As a result, same-day admitted care grows fastest at 5.14% a year during 2026–2035, because hospitals free overnight beds for complex medical patients and older adults.
Why is the rise of nonprofit private ownership notable?
The rise of nonprofit private ownership is notable, because the largest ownership change in years is moving dozens of hospitals out of investor hands. Receivers were appointed to Healthscope parent companies on May 26, 2025, when the group ran 37 hospitals. A plan announced on Feb. 6, 2026, moves 31 of them to a new operator described as the largest not-for-profit private hospital operator in Australia. Calvary Health Care is taking Holmesglen and Hobart Private, while Mater is taking Gold Coast Private. In turn, private not-for-profit hospitals grow fastest at 5.20% a year during 2026–2035, because mission-led owners reinvest surpluses in local services.
Can public purchase of private capacity open new beds?
Public purchase of private capacity can open new beds quickly, because buying a working hospital is faster than building one. The Western Australian government announced its intention on Nov. 6, 2025, to buy the 197-bed St John of God Mt Lawley Hospital and run it as a public site. Northern Beaches Hospital in Sydney is also transferring to New South Wales public ownership. Queensland plans more than 2,600 new beds under its Hospital Rescue Plan, including three new hospitals and 10 expansions. Each new ward needs beds and stretchers, monitors and staff. As a result, Western Australia and South Australia grow at 4.69% a year during 2026–2035.
Is there room to grow in emergency streaming and urgent care?
Emergency streaming and urgent care offer room to grow, because crowded departments need faster ways to treat and admit patients. Public hospitals recorded 9.1 million emergency department presentations in 2024–25, a rate of 328 per 1,000 people. Half of patients were seen within 18 minutes, yet only 53% completed their visit within four hours, down from 55% a year earlier. The January 2026 funding deal also backs 137 Medicare Urgent Care Clinics that can take lower-acuity cases away from hospital doors. In turn, hospitals that stream patients well can turn more emergency arrivals into timely medical admissions, which protects ward capacity and shortens waits for ambulances.
Workforce, access block and costs strain hospital networks
How do workforce shortages limit acute capacity?
Workforce shortages limit acute capacity, because hospitals cannot open beds or theaters without enough nurses, doctors and allied health staff. As a result, many networks rely on agency and clinical staffing services, which raise the cost of each shift. Hospitals respond with graduate programs, overseas recruitment and flexible rosters, which ease gaps over time. This pressure is strongest in regional areas and specialties such as anesthesia, emergency medicine and intensive care.
Why does access block strain emergency departments?
Access block strains emergency departments, because admitted patients wait in the department when ward beds are full. In turn, ambulances queue at the door and new arrivals wait longer to be seen by clinicians. Hospitals respond with discharge lounges, weekend discharge planning and virtual care teams, which free beds earlier in the day. This challenge persists while older patients with long stays occupy a rising share of ward capacity.
How do private hospital margins affect service supply?
Private hospital margins affect service supply, because insurer payments and rising labor costs squeeze operators that run high fixed costs. As a result, some private hospitals have closed wards, sold sites or entered receivership, which reduces local choice for insured patients. Operators respond by renegotiating insurer contracts, consolidating services and shifting care to day hospitals. This pressure explains much of the ownership change seen in the private sector since 2025.
Why do capital costs slow new hospital capacity?
Capital costs slow new hospital capacity, because new towers, theaters and imaging suites take years to plan, fund and build. In turn, population growth in fast-growing suburbs can run ahead of local bed supply for long periods. Governments respond with multiyear capital plans and purchases of existing private hospitals, which add beds sooner. This barrier means short-term capacity often depends on better patient flow rather than new buildings.
Sydney leads while Queensland adds beds fastest
| Region | Value, 2025 (USD billion) | Share, 2025 | CAGR, 2026–2035 |
|---|---|---|---|
| New South Wales and Australian Capital Territory | 18.88 | 33.7% | 4.24% |
| Victoria and Tasmania | 13.78 | 24.6% | 4.59% |
| Western Australia and South Australia | 12.04 | 21.5% | 4.69% |
| Queensland and Northern Territory | 11.32 | 20.2% | 4.84% |
Why do New South Wales and the ACT hold the top share?
New South Wales and the Australian Capital Territory held a 33.7% share of 2025 value and grow at 4.24% a year, because the zone had about 9.2 million residents at March 31, 2026. Sydney hosts many of the largest teaching hospitals in the country. Ramsay Health Care also agreed to buy National Capital Private Hospital in Canberra from Healthscope receivers. As a result, this zone combines the largest public network with a deep private sector.
How do Victoria and Tasmania support admitted care demand?
Victoria and Tasmania held a 24.6% share of 2025 value and grow at 4.59% a year, because Victoria added 109,500 residents in the year to March 2026. Calvary Health Care agreed to take over Holmesglen Private Hospital in Melbourne and Hobart Private Hospital from Healthscope receivers. Tasmania also gained an extra $700 million over five years under the January 2026 funding deal. In turn, this zone pairs strong Melbourne growth with smaller Tasmanian networks.
Why are Queensland and the Northern Territory growing fastest?
Queensland and the Northern Territory held a 20.2% share of 2025 value and grow fastest at 4.84% a year, because Queensland plans more than 2,600 new beds under its $18.5 billion Hospital Rescue Plan. Queensland added 90,100 residents in the year to March 2026. Mater also agreed to take over Gold Coast Private Hospital from Healthscope receivers. As a result, this zone adds public and private capacity faster than the others.
What supports demand in Western Australia and South Australia?
Western Australia and South Australia held a 21.5% share of 2025 value and grow at 4.69% a year, because Western Australia had the fastest population growth at 2.1% in the year to March 2026. The state government also plans to buy the 197-bed St John of God Mt Lawley Hospital. South Australia grew more slowly at 1.0% over the same year. In turn, Perth drives most growth in this zone, while Adelaide adds steady medical demand.
Funding deals, ownership changes and bed plans since 2025
| Development | Status and market relevance |
|---|---|
| In March 2025, the national pricing authority set the 2025–26 efficient price at $7,258 per weighted activity unit. | Sets the base price for activity-funded public admissions |
| In May 2025, receivers were appointed to the parent companies of Healthscope, which ran 37 hospitals. | Triggers the largest private hospital ownership change |
| In June 2025, Queensland announced an $18.5 billion Hospital Rescue Plan with more than 2,600 new beds. | Adds public capacity in the fastest-growing zone |
| In November 2025, the Western Australian government announced plans to buy St John of God Mt Lawley Hospital. | Converts 197 private beds to public use |
| In January 2026, National Cabinet agreed to an extra $25 billion for public hospitals to 2030–31. | Secures Commonwealth funding for five years |
Activity pricing and digital records steer hospital flow
- Activity-based funding classifications group admitted episodes by diagnosis and complexity, which lets governments pay hospitals a national price for each weighted unit of activity.
- Electronic medical records bring notes, medication charts and results into one system, which lets clinicians act faster on pathology test results and imaging reports.
- Patient flow command centers track beds, discharges and emergency arrivals in real time, which helps managers reduce access block and ambulance delays.
- Virtual wards and remote monitoring let stable patients finish treatment at home with nurse and doctor oversight, which frees acute beds for new admissions and shortens average length of stay.
Need a Custom Version of This Report?
Tailor the scope, geography, or segments to your exact requirements.
- Custom geography or segment scope
- Direct access to our analyst team
Public networks and private groups share admitted demand
Competition combines large state-run public networks with private groups that serve insured and self-paying patients. Public hospitals performed 59% of all hospitalizations in 2023–24 and handle most emergency admissions, while private hospitals performed the other 41%. Ramsay Health Care is the largest private operator and agreed to buy National Capital Private Hospital in Canberra, with competition clearance announced in February 2026. Healthscope entered receivership in May 2025, and 31 of its hospitals are moving to a new not-for-profit operator. Calvary Health Care and Mater are taking over three further Healthscope sites. St John of God Health Care is selling its Mt Lawley hospital to the Western Australian government while it builds capacity elsewhere in Perth. Operators compete on surgeon relationships, insurer contracts, specialty services, location and the ability to staff beds, while mission-led groups reinvest surpluses into local services.
Which hospital operators are reshaping private capacity?
| Company | Type | Role in the market |
|---|---|---|
| Ramsay Health Care | Private for-profit operator | Agreed to buy National Capital Private Hospital in Canberra |
| Healthscope | Private operator in receivership | Moving 31 hospitals to a new not-for-profit operator |
| Calvary Health Care | Private not-for-profit operator | Taking over Holmesglen and Hobart Private hospitals |
| Mater | Private not-for-profit operator | Taking over Gold Coast Private Hospital |
| St John of God Health Care | Private not-for-profit operator | Selling the 197-bed Mt Lawley Hospital to the state |
Credence Research view on Australian admitted care
Credence Research's view is that Australian acute hospital care will grow steadily because population growth, an older patient mix and secure public funding keep raising admitted activity. Medical acute care remains the largest service type, while surgical care grows fastest as waiting lists clear. The private sector is consolidating toward nonprofit and larger operators after the Healthscope receivership. Operators that staff beds reliably, run efficient day surgery and manage patient flow well should gain the most share by 2035, while Queensland offers the strongest capacity growth.
How the national admitted care estimate was built
The report uses 2025 as the base year on a calendar basis, and market values come from the Credence Research model. That model combines official population statistics, national hospital activity data, public funding agreements, insurer benefit statistics and operator releases. Segment splits and zone growth rates are Credence Research estimates, while zone shares follow the client's regional split. Sources used are official statistics, government releases, regulator data and company releases, and no interviews or surveys were used.
Aging patients and new beds carry growth to 2035
The Australia acute hospital care market is expected to reach USD 87.63 billion by 2035, a 4.55% CAGR during 2026–2035, as population growth, older patients and steady public funding keep admissions rising. Growth should be strongest in surgical acute care, same-day admitted care and Queensland, because these areas gain most from waiting list recovery and new beds. Workforce gaps, access block and private margins could slow some operators, while nonprofit consolidation and public purchases should keep private capacity in service.
Frequently Asked Questions
How big is the Australia acute hospital care market?
Which service type leads acute hospital value?
Which region leads the market?
How many hospitalizations does Australia record?
How much public hospital funding did governments agree in 2026?
Why do older patients matter for acute hospital demand?
Who are the leading operators in Australian acute hospital care?
What are the main challenges for hospital operators?
Table of Content
Chapter 1 Market Segmentation
- 1.1 Segmentation Framework
- 1.1.1 Product and Service Classification
- 1.1.2 Application and End-Use Classification
- 1.1.3 Technology and Solution Classification
- 1.1.4 Customer and Distribution Channel Classification
- 1.1.5 Geographic Segmentation
- 1.1.6 Market Segment Definitions and Boundaries
- 1.2 By Service Type
- 1.2.1 Surgical acute care
- 1.2.2 Medical acute care
- 1.2.3 Obstetric acute care
- 1.2.4 Emergency department care
- 1.3 By Care Setting
- 1.3.1 Overnight admitted care
- 1.3.2 Same-day admitted care
- 1.3.3 Emergency department encounters
- 1.4 By End User
- 1.4.1 Patients aged 0–17
- 1.4.2 Patients aged 18–64
- 1.4.3 Patients aged 65 and above
- 1.5 By Operating Model
- 1.5.1 Public-operated hospitals
- 1.5.2 Private for-profit hospitals
- 1.5.3 Private not-for-profit hospitals
Chapter 2 Introduction
- 2.1 Report Objectives and Scope
- 2.2 Product Definition and Industry Terminology
- 2.3 Market Inclusions and Exclusions
- 2.4 Research Process
- 2.4.1 Primary Research and Expert Interviews
- 2.4.2 Secondary Research and Source Review
- 2.4.3 Top-Down and Bottom-Up Estimation
- 2.4.4 Data Triangulation and Verification
- 2.5 Market Size Measurement Basis
- 2.5.1 2025: USD 56.02 billion → 2035: USD 87.63 billion
- 2.6 Historical and Forecast Reference Periods
- 2.6.1 Historical Period: 2018-2025
- 2.6.2 Base Year: 2025
- 2.6.3 Forecast Period: 2025-2035
- 2.7 Research Assumptions and Limitations
Chapter 3 Executive Summary
- 3.1 Market Snapshot and Key Findings
- 3.2 Base-Year Market Size, 2025
- 3.3 Forecast Market Size, 2035
- 3.4 Revenue and Volume Growth Outlook
- 3.5 Key Demand and Supply Indicators
- 3.6 Leading Market Segments
- 3.7 Fastest-Growing Market Opportunities
- 3.8 Regional Performance Highlights
- 3.9 Technology and Industry Transformation
- 3.10 Competitive Landscape Summary
- 3.11 Analyst View and Strategic Implications
Chapter 4 Australia Acute Hospital Care Market Trends and Developments
- 4.1 Historical Industry Development, 2018-2025
- 4.2 Recent Market Trends and Developments
- 4.3 Demand and Customer Behavior Trends
- 4.4 Technology and Product Innovation
- 4.5 Artificial Intelligence, Automation and Digitalization
- 4.6 Local Manufacturing and Supply Chain Realignment
- 4.7 Industry Partnerships, Mergers and Acquisitions
- 4.8 Sustainability and Circular Economy Developments
- 4.9 Government and Private Sector Investment Trends
- 4.10 Emerging Business Models and Commercialization
- 4.11 Industry Developments and Announcements
Chapter 5 Australia Acute Hospital Care Market Production, Supply and Demand Analysis
- 5.1 Demand Trend and Consumption Analysis, 2018-2025
- 5.2 Demand Forecast, 2025-2035
- 5.3 Production and Output Trend, 2018-2025
- 5.4 Production and Output Forecast, 2025-2035
- 5.5 Installed Capacity and Capacity Utilization
- 5.6 Company-Wise Production Plants and Statistics
- 5.6.1 Installed Production Capacity
- 5.6.2 Actual Production
- 5.6.3 Planned Capacity and Expansion Targets
- 5.7 Supply Chain Structure and Procurement Trends
- 5.8 Supply-Demand Gap and Bottlenecks
- 5.9 Import Dependence and Sourcing Structure
- 5.10 Contract Manufacturing and Outsourcing
- 5.11 Regional Supply and Demand Concentration
Chapter 6 Australia Acute Hospital Care Market Pricing Analysis
- 6.1 Pricing Structure and Measurement
- 6.2 Historical Pricing Trends, 2018-2025
- 6.3 Pricing Outlook, 2025-2035
- 6.4 Average Selling Price and Unit Economics
- 6.5 Pricing by Product and Market Segment
- 6.6 Geographic Pricing Differences
- 6.7 Key Input, Energy, Labor and Logistics Costs
- 6.8 Contract Pricing and Purchasing Models
- 6.9 Pricing Sensitivity and Competitive Positioning
- 6.10 Price, Margin and Profitability Implications
Chapter 7 Australia Acute Hospital Care Market Dynamics
- 7.1 Market Growth Drivers
- 7.1.1 Demand-Side Drivers
- 7.1.2 Technology and Innovation Drivers
- 7.1.3 Infrastructure and Investment Drivers
- 7.1.4 Regulatory and Policy Drivers
- 7.2 Market Restraints
- 7.2.1 Cost and Affordability Constraints
- 7.2.2 Technology and Adoption Barriers
- 7.2.3 Supply Chain and Operational Constraints
- 7.3 Market Challenges
- 7.3.1 Competitive Pressure and Margin Erosion
- 7.3.2 Skills, Infrastructure and Implementation Gaps
- 7.4 Emerging Market Opportunities
- 7.5 Market Dynamics Impact and Time-Horizon Assessment
Chapter 8 Australia Acute Hospital Care Value Chain Analysis
- 8.1 Industry Value Chain Overview
- 8.2 Upstream Suppliers and Critical Inputs
- 8.3 Technology and Component Providers
- 8.4 Manufacturing or Service Delivery
- 8.5 Distribution, Channel Partners and Integrators
- 8.6 Downstream Applications and End Users
- 8.7 Value Addition and Profit Pools
- 8.8 Vertical Integration and Outsourcing
- 8.9 Supplier Concentration and Risk
- 8.10 Supply Chain Localization and Resilience
Chapter 9 Australia Acute Hospital Care Market Regulations and Policies
- 9.1 Relevant Laws, Standards and Compliance Frameworks
- 9.2 Product, Service, Safety and Quality Requirements
- 9.3 Government Policies, Incentives and Subsidies
- 9.4 Imports, Exports and Trade Barriers
- 9.5 Public Procurement and Local Content Requirements
- 9.6 Environmental and Sustainability Compliance
- 9.7 Upcoming Policy Changes and Market Implications
Chapter 10 Australia Acute Hospital Care Market Hotspots and Opportunities
- 10.1 Market Opportunity Mapping and Growth Hotspots
- 10.2 High-Growth Applications and Customer Groups
- 10.3 Underserved Markets and White-Space Opportunities
- 10.4 Emerging Technology and Product Opportunities
- 10.5 New Capacity and Investment Hotspots
- 10.6 Market Entry and Expansion Opportunities
- 10.7 Distribution and Partnership Opportunities
- 10.8 Near-Term and Long-Term Commercial Potential
- 10.9 Opportunity Attractiveness and Execution Risks
Chapter 11 Australia Acute Hospital Care Market Outlook, 2025-2035
- 11.1 Market Size and Analysis
- 11.1.1 Revenue (Market Measurement: 2025: USD 56.02 billion → 2035: USD 87.63 billion)
- 11.1.2 Market Volume and Quantity Sold
- 11.1.3 Historical Market Size, 2018-2025
- 11.1.4 Base-Year Market Size, 2025
- 11.2 Market Forecast, 2025-2035
- 11.2.1 Revenue Forecast to 2035
- 11.2.2 Volume Forecast to 2035
- 11.2.3 CAGR and Year-on-Year Growth
- 11.2.4 Incremental Revenue Opportunity
- 11.3 Forecast Assumptions and Scenario Analysis
- 11.3.1 Base-Case Forecast
- 11.3.2 Optimistic and Conservative Scenarios
- 11.3.3 Technology, Pricing and Policy Sensitivities
- 11.4 Market Attractiveness and Growth Outlook
Chapter 12 Australia Acute Hospital Care Market Segmentation and Outlook
- 12.1 Segmentation Summary and Market Shares, 2025
- 12.2 Largest and Fastest-Growing Segments
- 12.3 By Service Type - Market Size and Forecast, 2025-2035
- 12.3.1 Segment Definition and Scope
- 12.3.2 Historical Market Size, 2018-2025
- 12.3.3 Revenue Forecast, 2025-2035
- 12.3.4 Volume Forecast, 2025-2035
- 12.3.5 Base-Year Market Share, 2025
- 12.3.6 Segment CAGR and Growth Drivers
- 12.3.7 Subsegment Market Size and Forecast
- 12.3.7.1 Surgical acute care
- 12.3.7.2 Medical acute care
- 12.3.7.3 Obstetric acute care
- 12.3.7.4 Emergency department care
- 12.3.8 Subsegment Pricing and Adoption Trends
- 12.3.9 Leading Suppliers and Competition
- 12.3.10 Regional Demand and Opportunities
- 12.4 By Care Setting - Market Size and Forecast, 2025-2035
- 12.4.1 Segment Definition and Scope
- 12.4.2 Historical Market Size, 2018-2025
- 12.4.3 Revenue Forecast, 2025-2035
- 12.4.4 Volume Forecast, 2025-2035
- 12.4.5 Base-Year Market Share, 2025
- 12.4.6 Segment CAGR and Growth Drivers
- 12.4.7 Subsegment Market Size and Forecast
- 12.4.7.1 Overnight admitted care
- 12.4.7.2 Same-day admitted care
- 12.4.7.3 Emergency department encounters
- 12.4.8 Subsegment Pricing and Adoption Trends
- 12.4.9 Leading Suppliers and Competition
- 12.4.10 Regional Demand and Opportunities
- 12.5 By End User - Market Size and Forecast, 2025-2035
- 12.5.1 Segment Definition and Scope
- 12.5.2 Historical Market Size, 2018-2025
- 12.5.3 Revenue Forecast, 2025-2035
- 12.5.4 Volume Forecast, 2025-2035
- 12.5.5 Base-Year Market Share, 2025
- 12.5.6 Segment CAGR and Growth Drivers
- 12.5.7 Subsegment Market Size and Forecast
- 12.5.7.1 Patients aged 0–17
- 12.5.7.2 Patients aged 18–64
- 12.5.7.3 Patients aged 65 and above
- 12.5.8 Subsegment Pricing and Adoption Trends
- 12.5.9 Leading Suppliers and Competition
- 12.5.10 Regional Demand and Opportunities
- 12.6 By Operating Model - Market Size and Forecast, 2025-2035
- 12.6.1 Segment Definition and Scope
- 12.6.2 Historical Market Size, 2018-2025
- 12.6.3 Revenue Forecast, 2025-2035
- 12.6.4 Volume Forecast, 2025-2035
- 12.6.5 Base-Year Market Share, 2025
- 12.6.6 Segment CAGR and Growth Drivers
- 12.6.7 Subsegment Market Size and Forecast
- 12.6.7.1 Public-operated hospitals
- 12.6.7.2 Private for-profit hospitals
- 12.6.7.3 Private not-for-profit hospitals
- 12.6.8 Subsegment Pricing and Adoption Trends
- 12.6.9 Leading Suppliers and Competition
- 12.6.10 Regional Demand and Opportunities
- 12.7 Segment Growth Comparison
- 12.8 Segment Attractiveness and Priority Matrix
Chapter 13 Australia Acute Hospital Care End-Use and Application Market Outlook
- 13.1 End-Use Industry and Customer Demand Structure
- 13.2 Leading Applications and Customer Groups
- 13.3 End-Use Market Size, Share and Forecast
- 13.4 Major End-Use Industry Deep Dives
- 13.4.1 Customer Requirements and Use Cases
- 13.4.2 Demand and Replacement Cycles
- 13.4.3 Technical and Regulatory Considerations
- 13.4.4 Purchasing and Procurement Models
- 13.4.5 Leading Vendors and Distribution Channels
- 13.4.6 Forecast and Commercial Opportunities
- 13.5 Emerging Applications and Cross-Segment Demand
- 13.6 End-Use Industry Investment Priorities
Chapter 14 Australia Acute Hospital Care Geographic Market Outlook, 2025-2035
- 14.1 Domestic Market Distribution and Demand Clusters
- 14.2 State- or Province-Wise Market Size and Forecast, 2025-2035
- 14.3 City and Metropolitan Market Outlook
- 14.4 Industrial, Manufacturing and Commercial Clusters
- 14.5 Geographic Concentration of Key End Users
- 14.6 Local Pricing and Purchasing Differences
- 14.7 Domestic Production Facilities and Capacity Map
- 14.8 Local Infrastructure and Project Pipeline
- 14.9 State-Level Policy and Incentive Differences
- 14.10 Subnational Investment Hotspots and Opportunities
- 14.11 Distribution and Logistics Networks
- 14.12 Domestic Competitive Footprint
Chapter 15 Australia Acute Hospital Care Technology, Innovation and Sustainability Outlook
- 15.1 Technology Landscape and Maturity
- 15.2 Product, Process and Service Innovation
- 15.3 AI, Automation and Digital Tools in the Industry
- 15.4 Technology Adoption and Performance Benchmarking
- 15.5 Innovation Pipeline and R&D Investment
- 15.6 Patent and Intellectual Property Trends
- 15.7 Energy Efficiency and Resource Management
- 15.8 Sustainability, Recycling and Circularity
- 15.9 Technology Roadmap, 2025-2035
- 15.10 Risks of Obsolescence and Technology Substitution
Chapter 16 Australia Acute Hospital Care Market Key Strategic Imperatives
- 16.1 Growth and Market Entry Priorities
- 16.2 High-Return Products and Segments
- 16.3 Pricing, Profitability and Cost Optimization
- 16.4 Technology Investment and Product Differentiation
- 16.5 Supply Chain Localization and Resilience
- 16.6 Distribution and Customer Acquisition
- 16.7 Partnership, Acquisition and Capacity Strategy
- 16.8 Regional Expansion Priorities
- 16.9 Short-, Medium- and Long-Term Actions
Chapter 17 Competition Outlook
- 17.1 Industry Competition Characteristics
- 17.2 Market Structure and Concentration
- 17.3 Market Share and Competitive Positioning, 2025
- 17.4 Company-Wise Revenue and Product Benchmarking
- 17.5 Production and Service Capacity Benchmarking
- 17.6 Technology, Pricing and Differentiation
- 17.7 Regional Footprint and Distribution Strength
- 17.8 Mergers, Acquisitions and Strategic Alliances
- 17.9 New Entrants and Competitive Threats
- 17.10 Porter's Five Forces and Industry Attractiveness
- 17.11 Competitive Outlook, 2025-2035
Chapter 18 Company Profiles
- 18.1 Company Coverage and Selection Criteria
- 18.2 Ramsay Health Care
- 18.2.1 Business Description
- 18.2.2 Company Ownership and Geographic Presence
- 18.2.3 Product and Service Portfolio
- 18.2.4 Manufacturing and Operating Footprint
- 18.2.5 Production Capacity and Expansion Plans
- 18.2.6 Financial Performance and Investment
- 18.2.7 Market Share and Competitive Position
- 18.2.8 Technology and Innovation Capabilities
- 18.2.9 Strategic Alliances or Partnerships
- 18.2.10 Recent Developments
- 18.2.11 Growth Strategy and Outlook
- 18.3 Healthscope
- 18.4 St Vincent’s Health Australia
- 18.5 St John of God Health Care
- 18.6 Calvary Health Care
- 18.7 Mater
- 18.8 Healthe Care
- 18.9 Epworth HealthCare
- 18.10 Cabrini Health
- 18.11 Adventist HealthCare
- 18.12 Other Relevant Market Participants
Note: Every listed company is profiled on the structure shown under the first company. The company list is preliminary and may change based on research findings, market developments, data availability and client requirements.
Chapter 19 Disclaimer
- 19.1 Research and Forecast Disclaimer
- 19.2 Data Source and Estimation Limitations
Note: The depth of individual sections depends on data availability for this market. Volume, capacity, trade and other unit-based metrics are included where applicable.

