
Cost pressure and payment reform keep advisers in demand
The USA healthcare consulting services market was valued at USD 12.54 billion in 2025 and is projected to increase from USD 13.67 billion in 2026 to USD 29.71 billion by 2035, registering a CAGR of 9.01% during 2026–2035. Demand comes from hospitals, health plans, drug makers and public agencies that need outside help to control costs, modernize systems and meet new federal payment and data rules. The South held the largest regional share, 37.5% in 2025, because the region hosts many large multi-state health systems and gains population faster than any other region. The South also grows fastest at 9.39% a year, while the West follows on strong public-sector and digital demand. Federal payer API requirements that take effect on Jan. 1, 2027, are pushing health plans and providers to fund interoperability, prior authorization and data strategy programs through the forecast period.
Which advisory services for health organizations are counted?
The estimate measures fees paid by U.S. health organizations for outside advisory work, including digital and technology programs, strategy and transaction advice, operations and financial performance projects, and regulatory and clinical transformation. Buyers include hospitals and health systems, health plans, life sciences companies and government health agencies. Engagements run as fixed projects, retainers, outcome-based contracts and longer managed advisory programs.
The estimate excludes software licenses, hardware, staffing agencies and fully outsourced billing or coding operations, unless the work is sold as an advisory engagement. It also excludes audit and tax fees that firms earn from health clients. The value chain runs from specialist advisers and global professional services firms through alliances with software vendors to health system, payer and agency buyers.
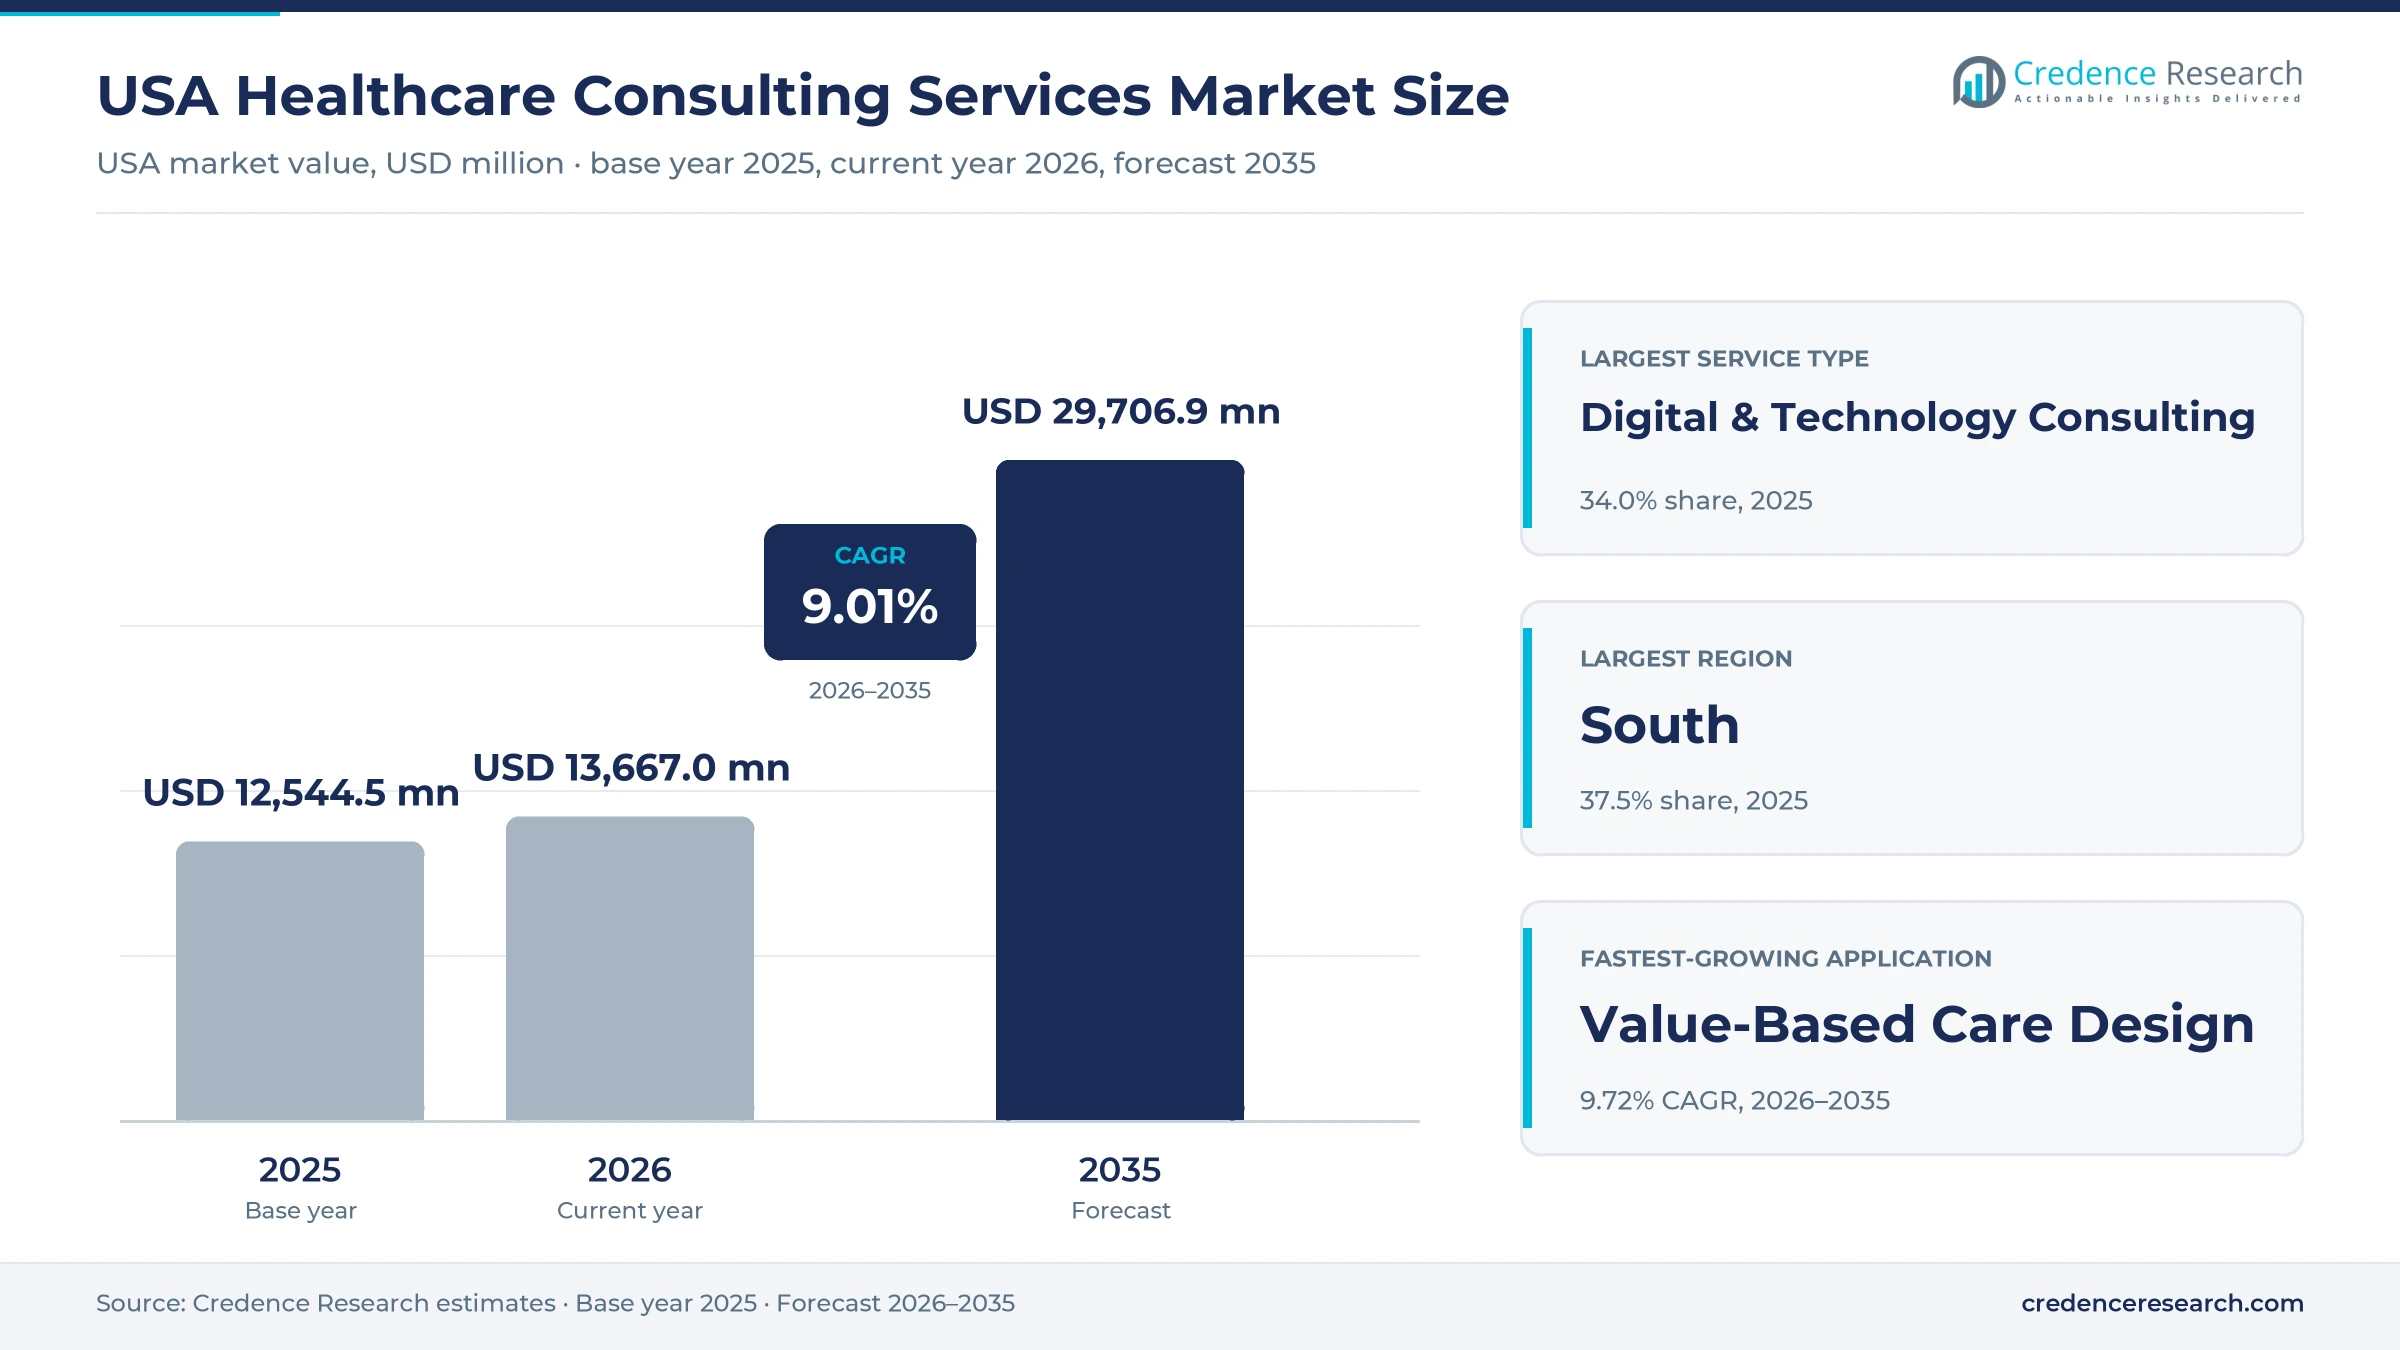
USA Healthcare Consulting Services Market Insights
- The USA healthcare consulting services market was valued at USD 12.54 billion in 2025 and is projected to reach USD 29.71 billion by 2035, registering a CAGR of 9.01% during 2026–2035.
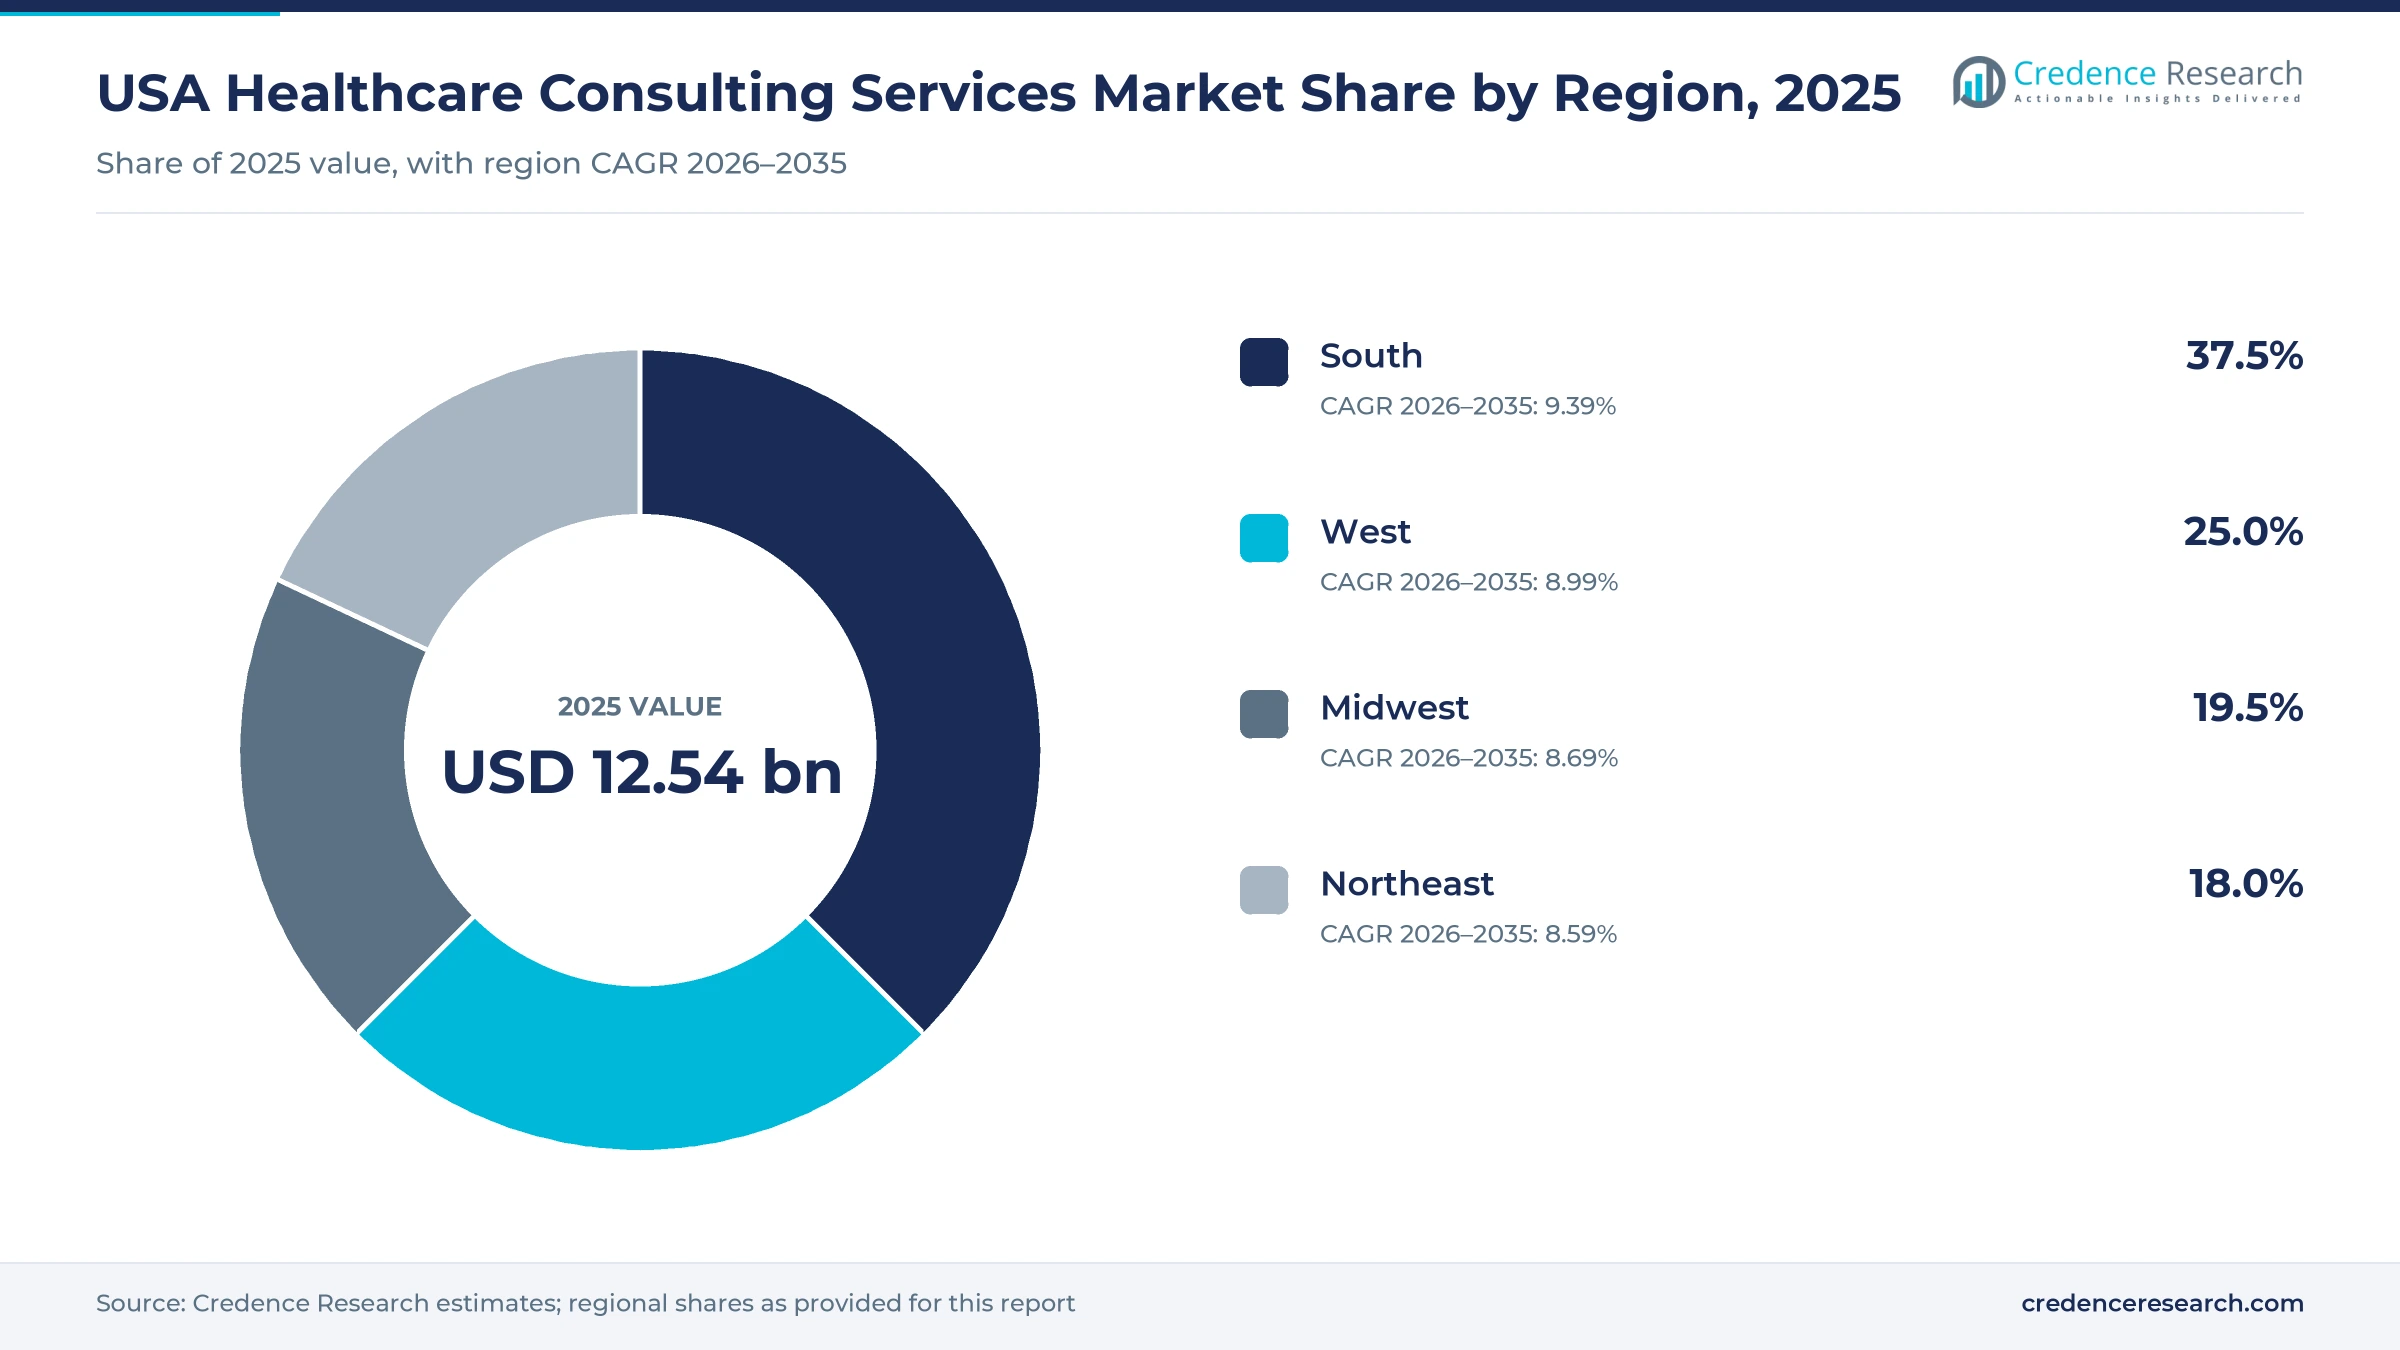
- The South held 37.5% of 2025 value and also grows fastest at 9.39% a year, because large health systems and population gains keep advisers busy across the region.
- Digital and technology consulting led with 34.0% of 2025 value, as providers and payers rebuild data, cloud and electronic record platforms for new federal rules.
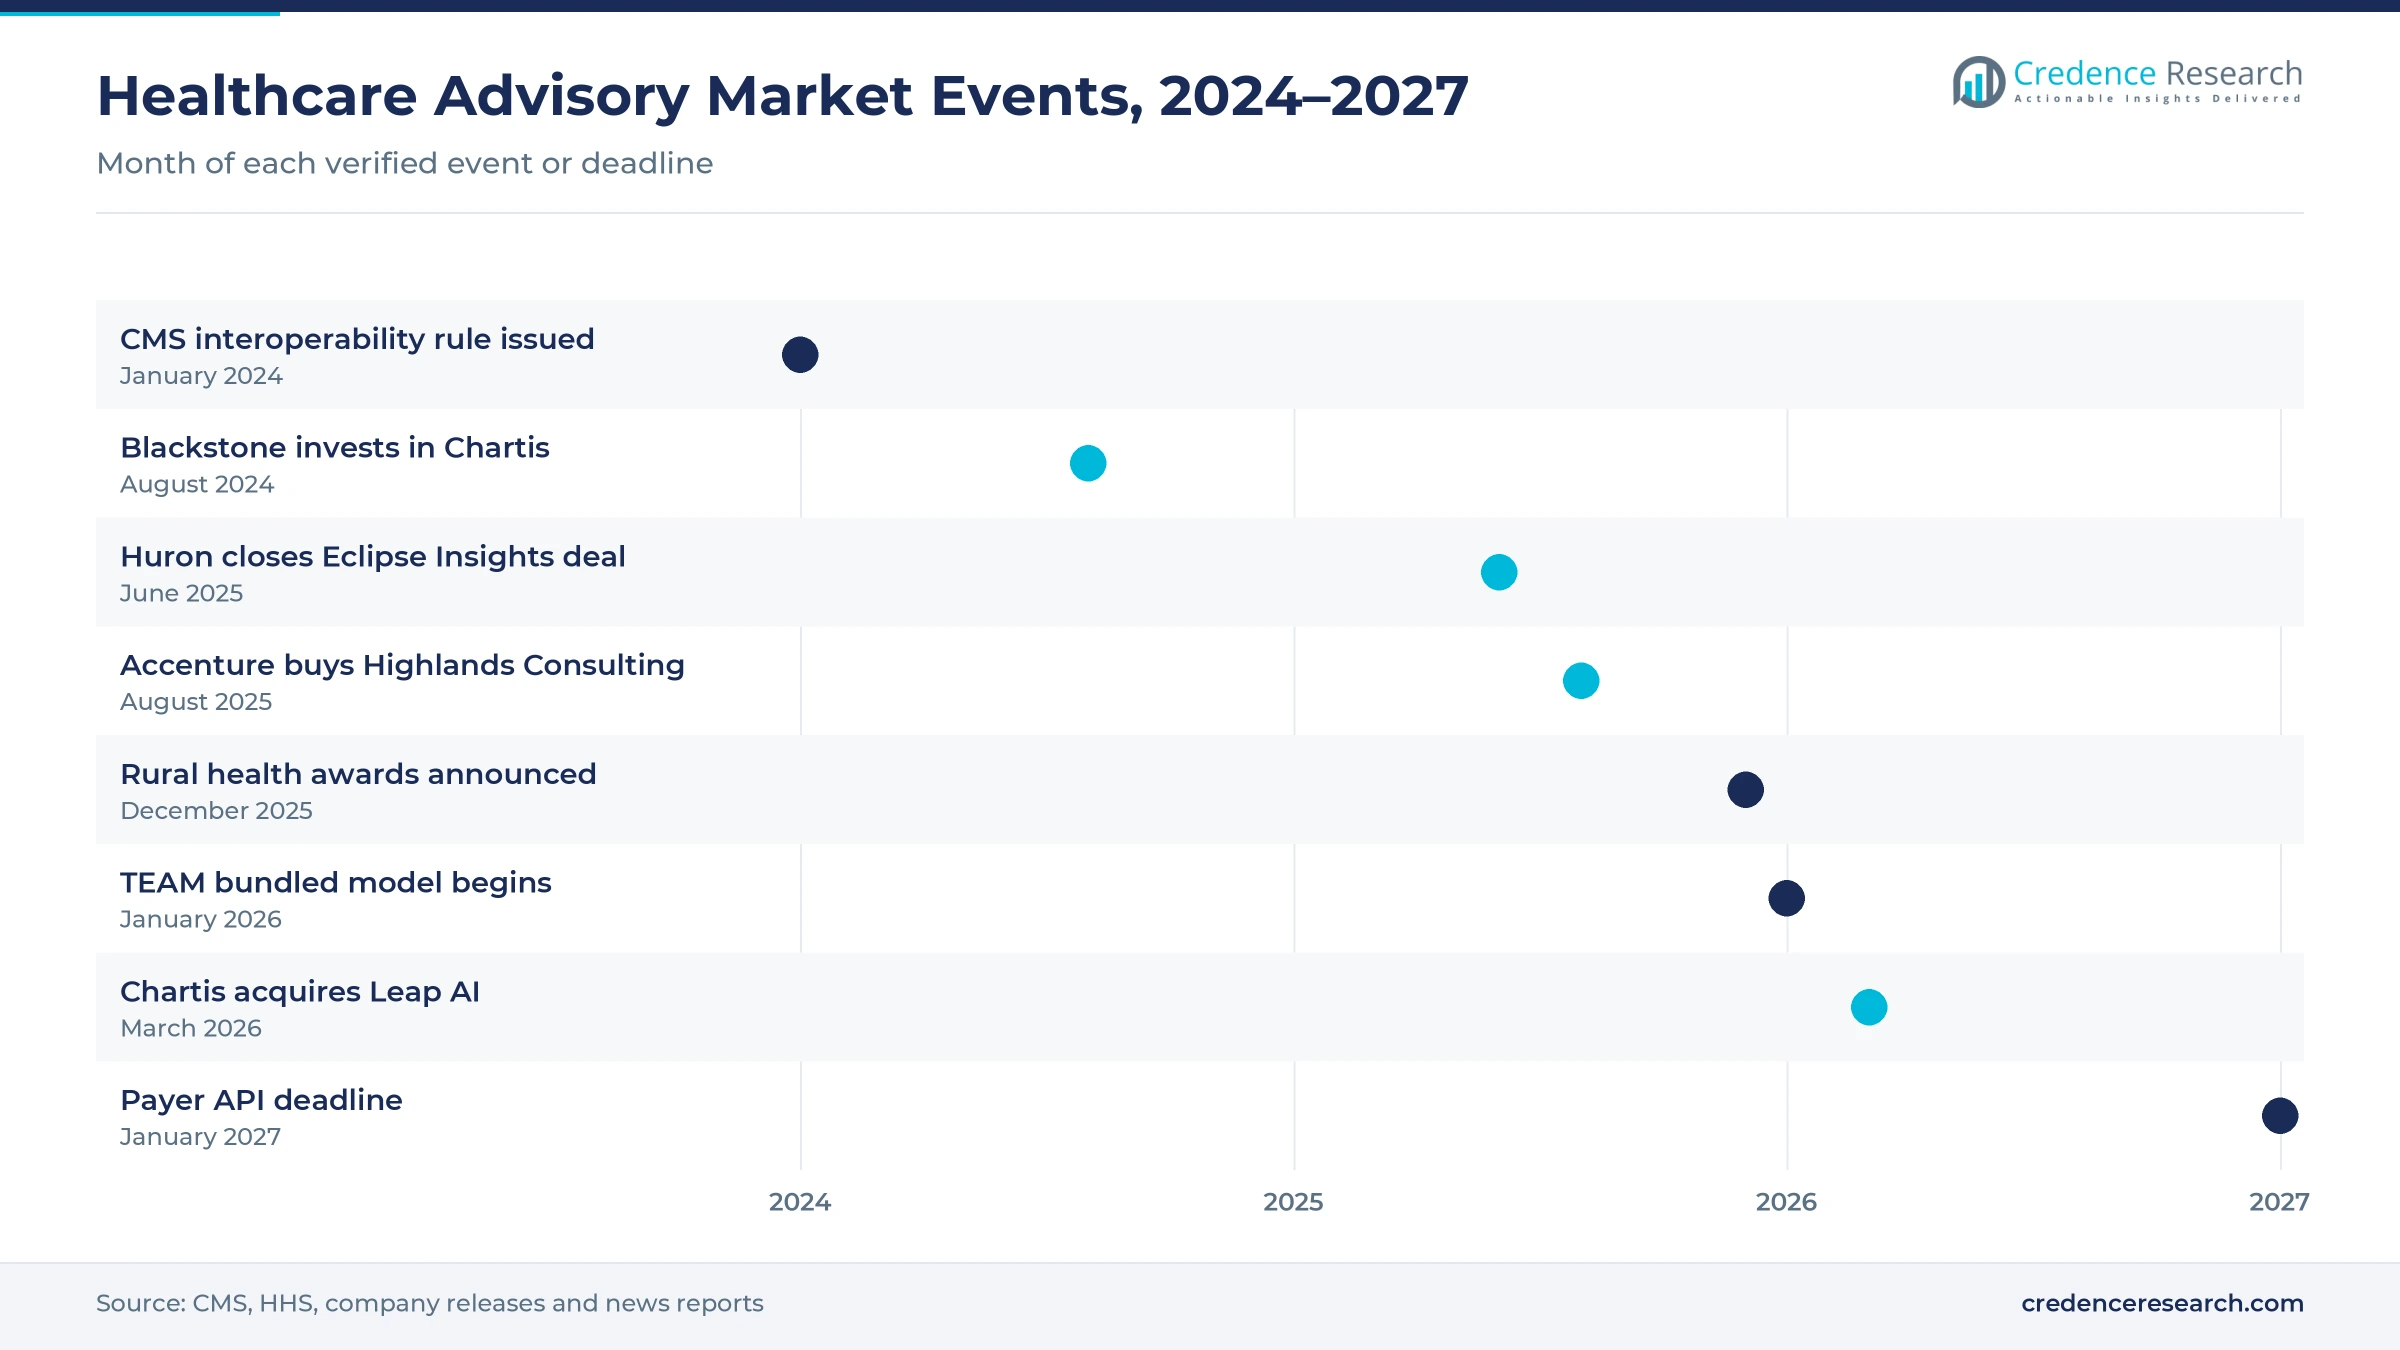
- The Transforming Episode Accountability Model began on Jan. 1, 2026, and runs through Dec. 31, 2030, which adds bundled payment design work for selected hospitals.
- Specialist firms are buying capabilities, as shown by Huron closing its purchase of revenue cycle adviser Eclipse Insights in June 2025 and Chartis buying Leap AI in March 2026.
Digital work and hospital clients carry the most value
Why does digital and technology work lead advisory spending?
Based on service type, the market is categorized into digital and technology consulting, strategy and transaction advisory, operations and financial performance consulting, and regulatory and clinical transformation consulting. Digital & Technology Consulting led with 34.0% of 2025 value, because providers and payers are rebuilding record, cloud and data platforms. Digital & Technology Consulting also grows fastest at 9.76% a year, as payer API deadlines and AI programs widen project scope.
Which customers buy the most advisory work?
Based on customer type, the market is categorized into healthcare providers, health plans and payers, life sciences companies and government and public health agencies. Healthcare Providers led with 52.0% of 2025 value, because hospitals face rising labor costs, payment changes and system upgrades at the same time. Government & Public Health Agencies grow fastest at 9.57% a year, as states spend federal rural health awards and redesign Medicaid operations.
How do applications shape engagement demand?
Based on application, the market is categorized into enterprise digital transformation, cost and revenue optimization, value-based care design and M&A and organizational transformation. Enterprise Digital Transformation led with 33.0% of 2025 value, because record, data and cloud programs run for several years. Value-Based Care Design grows fastest at 9.72% a year, as accountable care growth and mandatory bundles push hospitals to redesign care and contracts.
| Segment Group | Leading Sub-segment | Share, 2025 | Fastest-growing Sub-segment | CAGR, 2026–2035 |
|---|---|---|---|---|
| By Service Type | Digital & Technology Consulting | 34.0% | Digital & Technology Consulting | 9.76% |
| By Customer Type | Healthcare Providers | 52.0% | Government & Public Health Agencies | 9.57% |
| By Application | Enterprise Digital Transformation | 33.0% | Value-Based Care Design | 9.72% |
Request a Free Sample
Fill in your details and we'll send you a free sample report.
- Sample data tables & charts
- Research methodology
Cost, interoperability and payment rules lift demand
How do rising health system costs lift advisory demand?
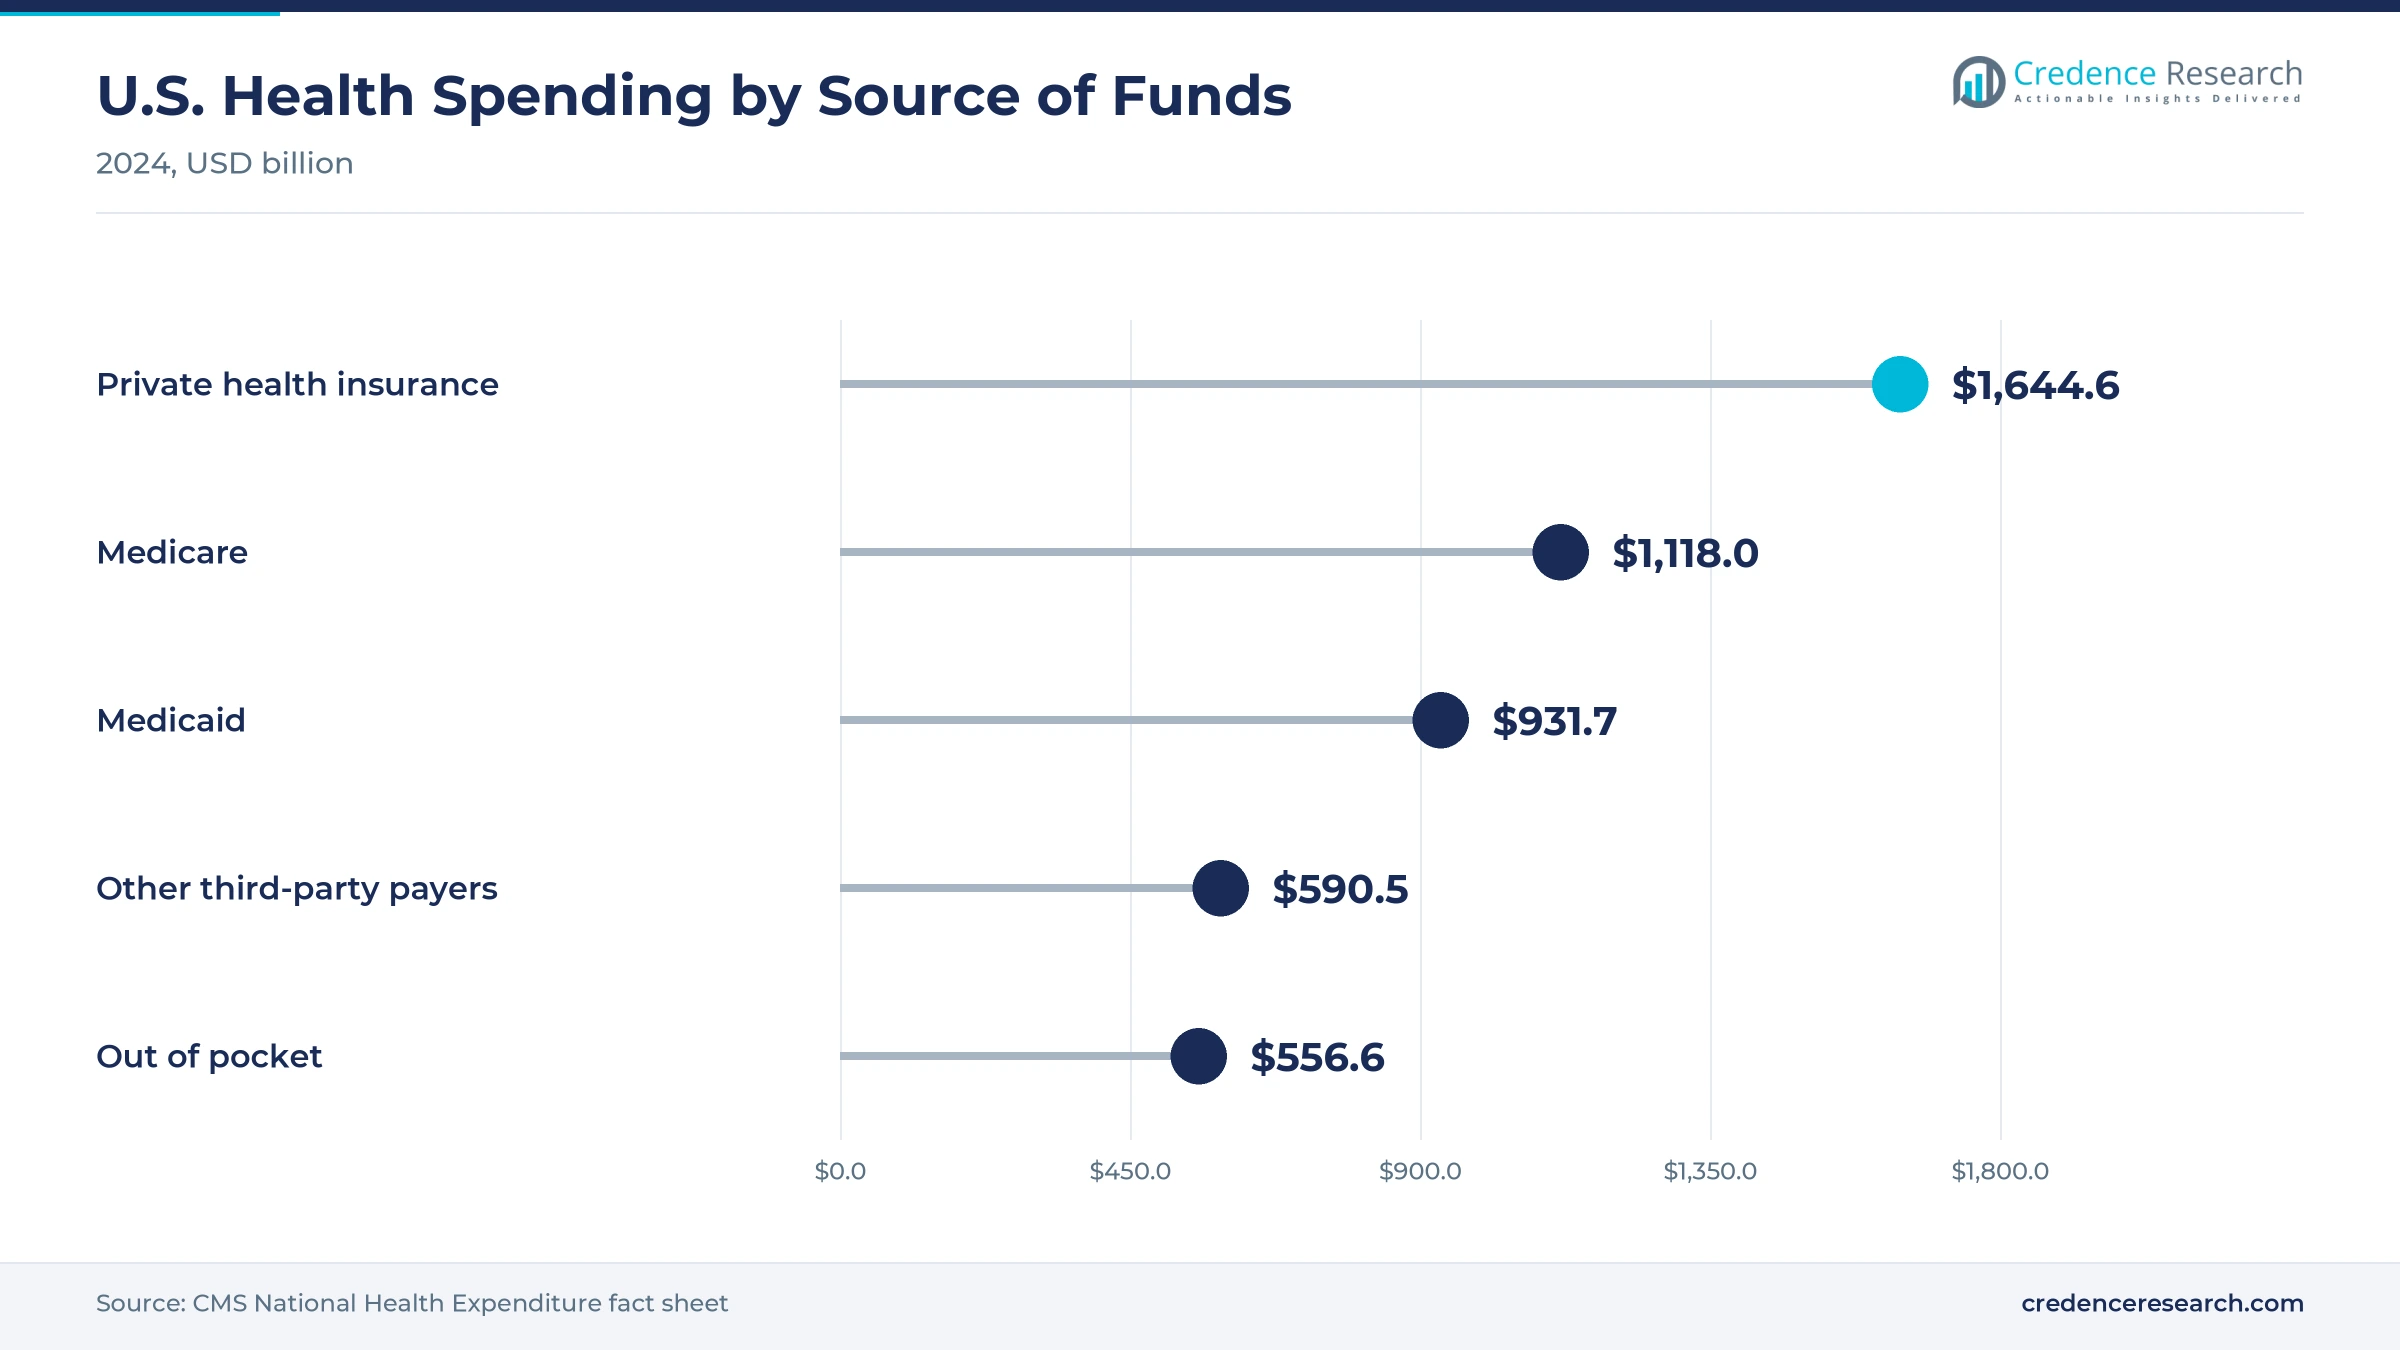
Rising health system costs lift advisory demand, because hospitals and health plans need outside help to protect margins while spending keeps climbing. National health expenditure grew 7.2% to $5.3 trillion in 2024, or 18.0% of GDP, according to the CMS national health expenditure fact sheet. Hospital spending rose 8.9% to $1,634.7 billion in the same year, which keeps cost programs at the top of board agendas. CMS also projects health spending to reach 20.6% of GDP by 2034, as average spending growth of 5.4% outpaces GDP growth of 4.1%. As a result, cost and revenue optimization remains a core application, and providers held 52.0% of 2025 advisory value.
Why do interoperability rules expand digital work?
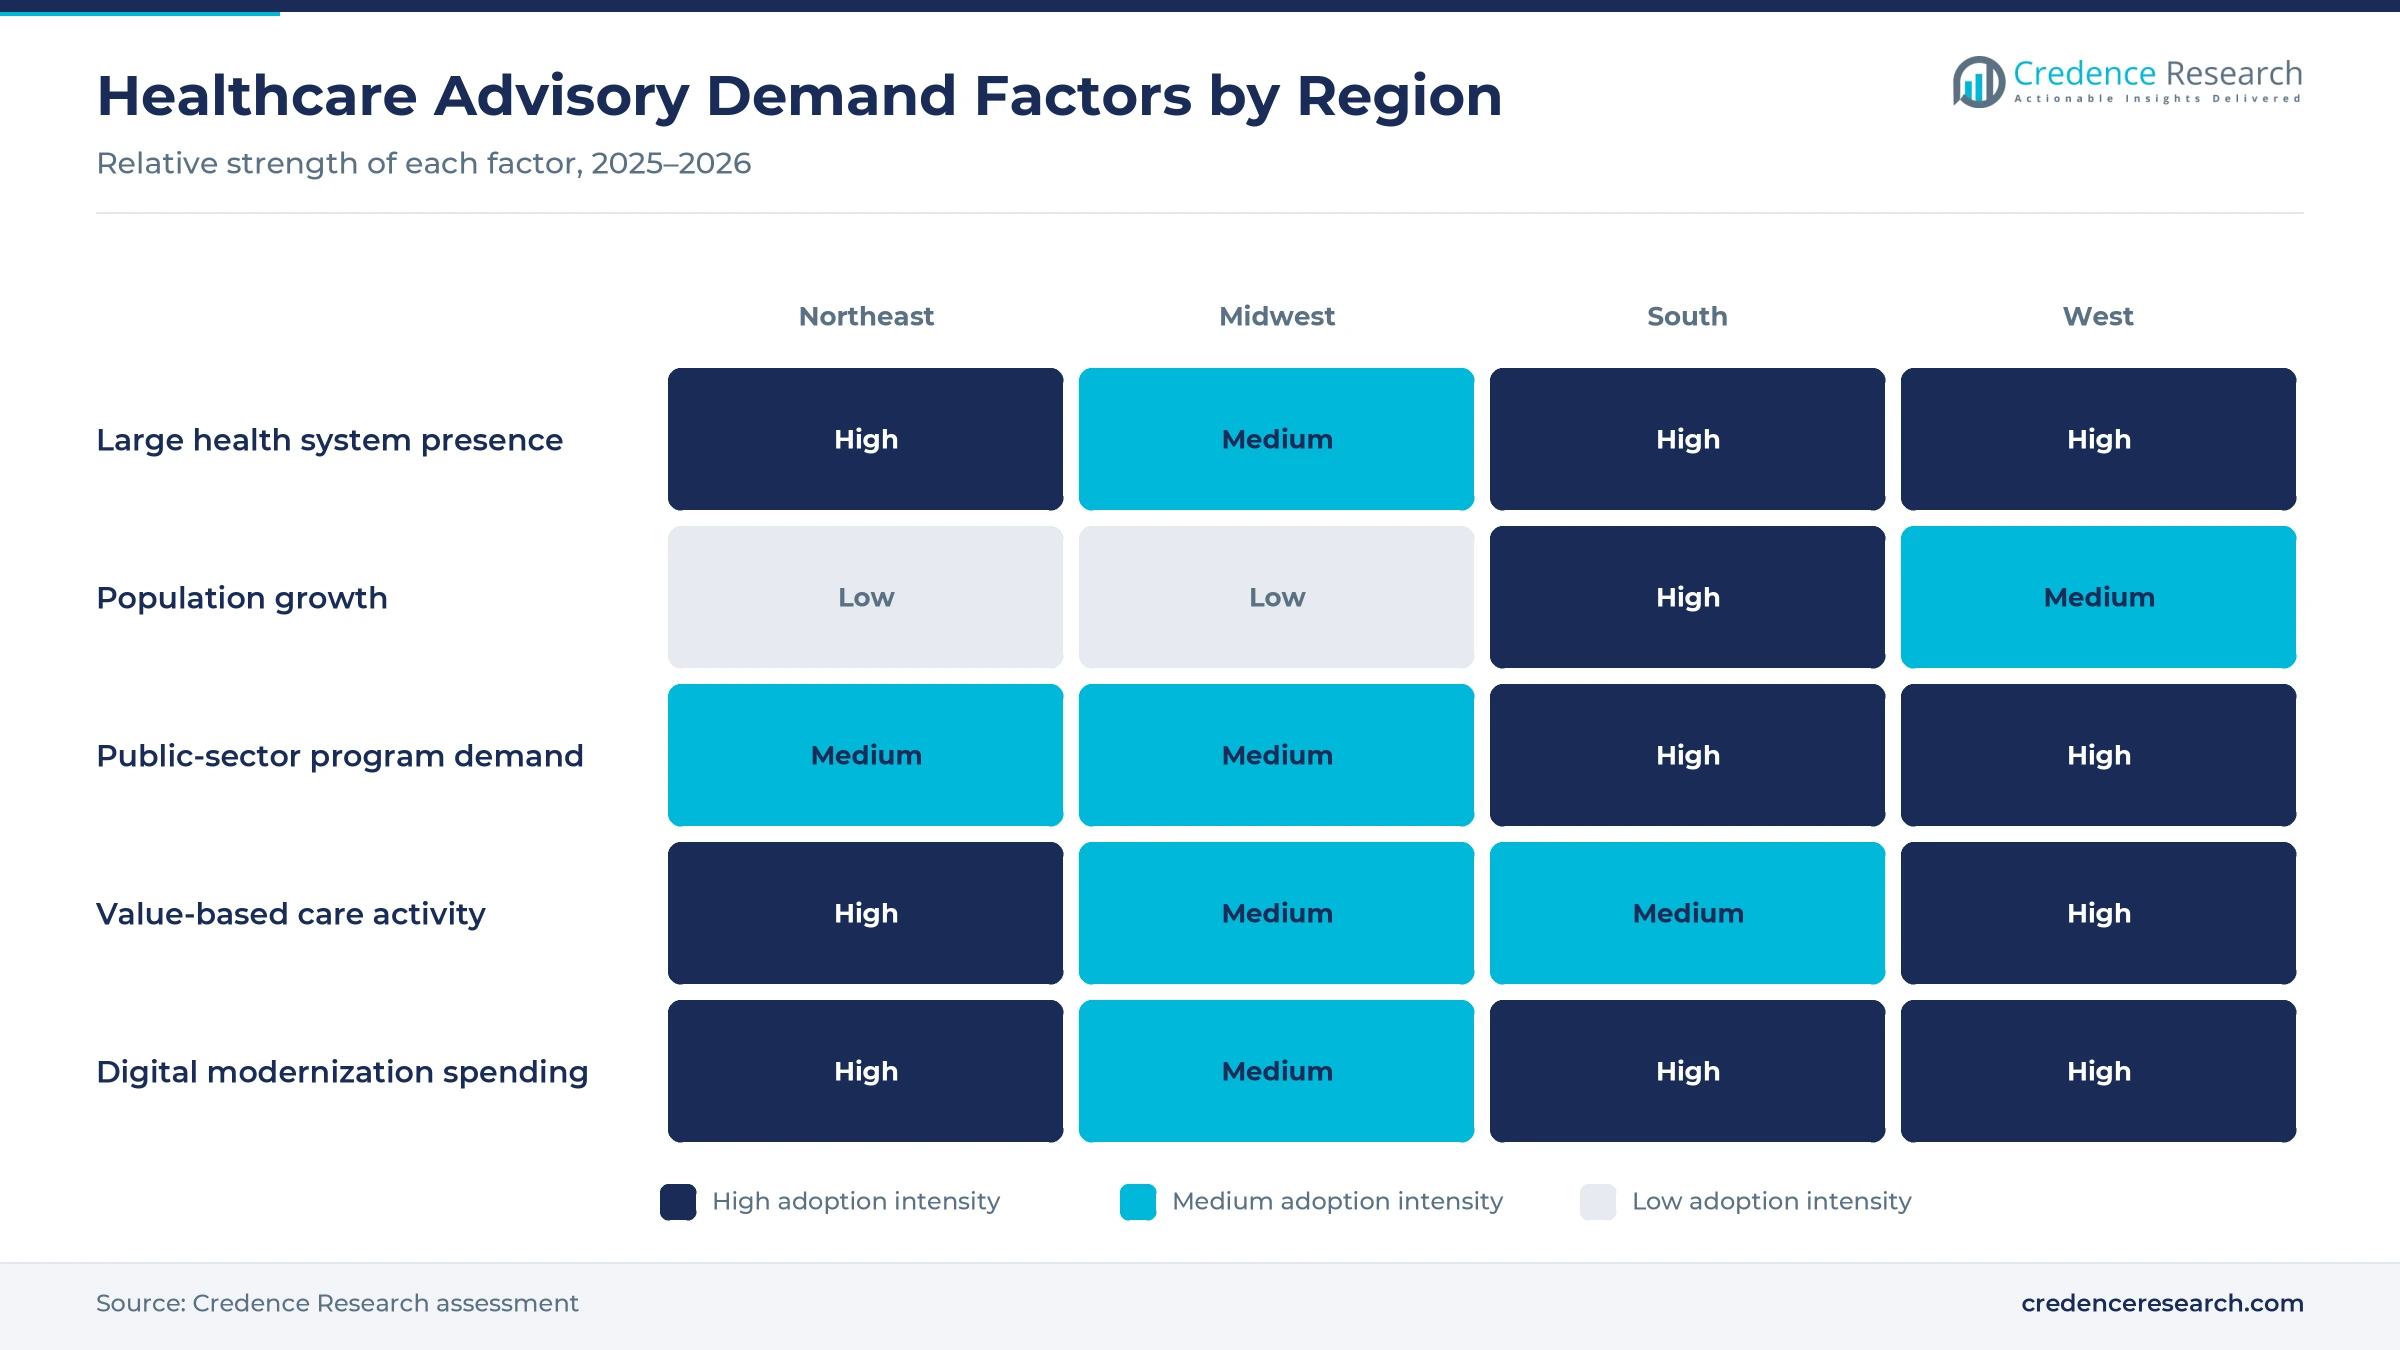
Interoperability rules expand digital work, because payers and providers must rebuild how they share patient and claims data. The CMS Interoperability and Prior Authorization Final Rule, issued on Jan. 17, 2024, requires impacted payers to build Patient Access, Provider Access, Payer-to-Payer and Prior Authorization APIs, generally by Jan. 1, 2027. The rule also sets prior authorization decision times of 72 hours for urgent requests and seven calendar days for standard requests. CMS estimates about $15 billion in savings over ten years, which gives buyers a clear business case for modernization. In turn, digital and technology consulting grows fastest at 9.76% a year, as health plans hire advisers to design and test these interfaces.
How does value-based payment reform create new projects?
Value-based payment reform creates new projects, because providers must redesign care pathways, contracts and data before they take on financial risk. As of January 2026, CMS estimated that 14.3 million Medicare beneficiaries received care coordinated by accountable care organizations, up 4.4% from 13.7 million in 2025. The Shared Savings Program alone counted 511 ACOs with 12.6 million assigned beneficiaries on Jan. 1, 2026. The mandatory Transforming Episode Accountability Model also began on Jan. 1, 2026, covering five surgical episodes such as joint replacement and spinal fusion. Therefore, value-based care design grows at 9.72% a year, faster than any other application.
Why does a growing advisory workforce support capacity?
A growing advisory workforce supports capacity, because firms need more analysts to staff long digital and payment programs for health clients. Management analysts held about 1.1 million jobs in 2025, and employment is projected to grow 10% from 2025 to 2035, according to the Bureau of Labor Statistics. About 94,100 openings are projected each year over the decade, which keeps a steady pipeline of new consultants entering the field. Specialist firms are also adding health talent through acquisitions, such as Huron closing its purchase of Eclipse Insights on June 26, 2025. Consequently, buyers can source mid-revenue cycle, data and clinical skills that their own teams lack.
AI programs, rural funds and payer deadlines reshape work
How is the shift to AI-led transformation playing out?
Advisory work is shifting toward AI-led transformation, because health organizations want to automate documentation, coding, scheduling and prior authorization. HHS released a new agencywide AI strategy in December 2025 built on five pillars, including governance, infrastructure, workforce burden reduction and public health modernization. Chartis acquired Leap AI, a generative AI and workflow automation company, on March 19, 2026, to speed technology transformation for health clients. Huron also bought RelateCare in June 2026, adding scheduling, nurse triage and care management support. As a result, demand for advice on artificial intelligence governance, vendor choice and workflow redesign rises across providers and payers.
Why are state rural health programs rising as a demand source?
State rural health programs are rising as a demand source, because new federal money must be planned, procured and tracked. CMS announced on Dec. 29, 2025, that all 50 states will receive awards under the $50 billion Rural Health Transformation Program. First-year awards in 2026 average $200 million per state, within a range of $147 million to $281 million. The money supports rural workforce, facility, technology and care model projects that many states cannot run with existing staff. Accenture also bought The Highlands Consulting Group on Aug. 18, 2025, to deepen work with California state health and social services agencies, according to Accenture. In turn, government and public health agencies grow at 9.57% a year.
Can payer API deadlines open a large modernization window?
Payer API deadlines open a large modernization window, because each impacted health plan must deliver several new interfaces by Jan. 1, 2027. Payers must also report annual Patient Access API usage metrics to CMS beginning Jan. 1, 2026, which turns data quality into an ongoing task. Providers will need to connect these feeds to their electronic health records and prior authorization workflows. Private health insurance spending grew 8.8% to $1,644.6 billion in 2024, which shows the scale of claims that will move through these interfaces. Therefore, health plans and payers offer a strong opening for integration, testing and change management work through 2035.
Is there room for coverage change and Medicaid redesign work?
Coverage change and Medicaid redesign offer a second opening, because states and health plans must adjust eligibility, outreach and financing. The Congressional Budget Office estimated in August 2025 that the 2025 reconciliation law will raise the number of uninsured people by 10 million in 2034, according to Georgetown University's Center for Children and Families. The CBO also projected an increase of 5.2 million uninsured people in 2027, which signals quick operational change for Medicaid programs. Hospitals in turn need advice on uncompensated care, pricing and revenue cycle performance. As a result, operations and financial performance consulting keeps a steady base of work across states and safety-net systems.
Tight budgets, talent costs and policy shifts weigh
How do tight provider budgets slow new engagements?
Tight provider budgets slow new engagements, because many hospitals delay discretionary projects when labor and supply costs rise faster than payments from Medicare, Medicaid and commercial health plans. Smaller and rural hospitals are most affected, since they have thin margins and few internal project staff. As a result, buyers split large programs into smaller phases or ask for outcome-based fees. Healthcare consulting services providers that tie fees to measured savings and share risk can still win work in these accounts.
Why do talent costs pressure advisory margins?
Talent costs pressure advisory margins, because experienced clinical, data and revenue cycle advisers are scarce and command high pay. Management analysts earned a median wage of $101,860 in May 2025, and specialist health skills often cost more. In turn, firms face pressure to raise rates or use more junior staff on client teams. Offshore delivery, remote work and AI tools help healthcare consulting services firms control delivery costs without losing quality on complex programs.
How does federal policy uncertainty delay decisions?
Federal policy uncertainty delays decisions, because changes to Medicaid financing, payment models and coverage can alter the business case for a project. State agencies and safety-net hospitals are the most exposed, since they depend heavily on public funds. Consequently, some buyers pause long programs until federal and state rules are final. Advisers reduce this risk by offering scenario planning, phased budgets and shorter, modular contracts that can change as the rules settle.
Do in-house teams and software vendors reduce demand?
In-house teams and software vendors can reduce demand, because large health systems build their own transformation offices and vendors bundle implementation advice with licenses. Mid-sized advisers feel this most in record and analytics projects. As a result, price competition rises for routine record and reporting work. Healthcare consulting services firms respond by focusing on independent strategy, complex integration and measurable financial outcomes that buyers cannot easily handle alone.
The South leads and also grows fastest to 2035
| Region | Value, 2025 (USD billion) | Share, 2025 | CAGR, 2026–2035 |
|---|---|---|---|
| South | 4.70 | 37.5% | 9.39% |
| West | 3.14 | 25.0% | 8.99% |
| Midwest | 2.45 | 19.5% | 8.69% |
| Northeast | 2.26 | 18.0% | 8.59% |
Why does the South lead advisory spending?
The South held 37.5% of 2025 value and grows fastest at 9.39% a year, because the region hosts many large multi-state health systems and fast-growing metro areas. The South grew by 6.0% between April 2020 and July 2025, nearly double national growth of 3.1%, according to the U.S. Census Bureau. It was also the only region to grow in all five age groups, which keeps capacity, access and growth strategy work active for hospitals and health plans.
How does the West combine digital and public-sector demand?
The West held 25.0% of 2025 value and grows at 8.99% a year, because large integrated systems and state agencies invest heavily in digital and data programs. Accenture bought Sacramento-based The Highlands Consulting Group in August 2025 to deepen work with California state agencies in health and social services. The region also has a high share of residents aged 65 and older in Arizona, Nevada and the Pacific Northwest, which supports Medicare and care model work.
What supports steady demand in the Midwest?
The Midwest held 19.5% of 2025 value and grows at 8.69% a year, because many nonprofit health systems and rural hospitals need help with consolidation, cost control and value-based contracts. Rural health awards from the $50 billion federal program add new planning and technology projects across the region. However, slower population growth limits new capacity projects compared with the South.
Why does the Northeast grow more slowly?
The Northeast held 18.0% of 2025 value and grows at 8.59% a year, because the region has mature academic medical centers and dense payer markets but slower population growth. The Northeast had the slowest growth among people aged 65 and older between 2020 and 2025, at 14.6%. Even so, academic systems keep buying advice on research operations, affiliations, digital programs and population health management.
Acquisitions and federal programs shape the field
| Development | Status and market relevance |
|---|---|
| In August 2024, Chartis agreed to receive a majority investment from funds managed by Blackstone to expand its strategic, digital, clinical and financial work. | Adds private equity backing to a health specialist |
| In June 2025, Huron completed its acquisition of revenue cycle consulting firm Eclipse Insights. | Deepens mid-revenue cycle skills for providers |
| In August 2025, Accenture acquired The Highlands Consulting Group to deepen work with California state health and social services agencies. | Strengthens public-sector procurement reach in the West |
| In December 2025, CMS announced Rural Health Transformation Program awards for all 50 states under a $50 billion initiative. | Creates state planning and technology projects in 2026 |
| In March 2026, Chartis acquired Leap AI to combine generative AI and workflow automation with its advisory platform. | Signals AI-led transformation offers for health clients |
APIs, AI tools and analytics change how advisers work
- FHIR-based APIs connect payer and provider systems for patient access, payer-to-payer exchange and prior authorization, which creates design, testing and governance work.
- Generative AI tools draft clinical notes, summarize records and automate scheduling, which pushes clients to seek advice on governance, vendor choice and workflow redesign.
- Revenue analytics flag denials and coding gaps earlier, which supports clinical documentation improvement and payment accuracy projects.
- Cloud data platforms combine claims, clinical and cost data, which helps advisers model risk contracts, bundles and site-of-care changes for clients.
Need a Custom Version of This Report?
Tailor the scope, geography, or segments to your exact requirements.
- Custom geography or segment scope
- Direct access to our analyst team
Global firms and health specialists compete for mandates
Competition is split between global professional services firms and health specialists. Deloitte, Accenture, PwC, EY and KPMG combine strategy, technology, risk and implementation teams, which suits large digital and regulatory programs. McKinsey & Company and Boston Consulting Group focus on strategy, performance improvement and transformation for systems, payers and life sciences companies. Guidehouse, Huron Consulting Group and Chartis compete as health specialists with deep revenue cycle, clinical and operations skills. Huron added Eclipse Insights in 2025 and RelateCare in 2026, while Chartis gained Blackstone backing in 2024 and bought Leap AI in 2026. Firms compete on sector depth, proof of financial results, software alliances, price and the ability to staff long programs. Outcome-based fees and managed advisory contracts are also gaining ground, as buyers want advisers to share the risk of missed savings.
Companies profiled and their roles in this market
| Company | Type | Role in the market |
|---|---|---|
| Accenture | Global professional services firm | Bought The Highlands Consulting Group in 2025 to deepen California state health work |
| Huron Consulting Group | Health specialist | Closed Eclipse Insights deal in 2025 and bought RelateCare in 2026 |
| Chartis | Health specialist | Gained Blackstone majority investment in 2024 and bought Leap AI in 2026 |
| Guidehouse | Health and public-sector adviser | Health segment serves providers, agencies, life sciences companies and payers |
Credence Research view on reform-driven advisory growth
Credence Research's view is that U.S. healthcare advisory spending will grow strongly through 2035, because cost pressure, federal data rules and payment reform all land on the same buyers at once. Payer API deadlines in 2027 and mandatory bundles from 2026 give clear dates that force action. Digital and technology work already holds 34.0% of 2025 value in this market. However, tight hospital budgets and policy uncertainty could delay large programs. Firms that pair health expertise with AI, data and outcome-based pricing should gain share, especially across the fast-growing South.
How the advisory spending estimate was built
The report uses 2025 as the base year, with values in USD million at current prices. Market values come from the Credence Research model, which combines national health spending, buyer counts, advisory intensity and average engagement fees. Regional shares are those set for this report, and segment splits by service type, customer type and application are Credence Research estimates. Sources used are federal agency data and rules, Census Bureau and Bureau of Labor Statistics releases, company announcements and news reports, and no interviews or surveys were used.
Payment reform and digital rules set the path to 2035
The market is expected to reach USD 29.71 billion by 2035, a 9.01% CAGR during 2026–2035, as payment reform, interoperability rules and AI adoption keep health organizations buying outside expertise. Growth should be strongest in the South and among government agencies, while providers keep the largest customer share. Value-based care design and digital programs will gain share as risk contracts spread. In contrast, deep cuts in provider budgets or a pause in federal programs would slow new engagements, especially for smaller hospitals and states.
Frequently Asked Questions
How big is the USA healthcare consulting services market?
Which region leads healthcare advisory spending in the United States?
Which service type holds the largest share?
Which customer group grows fastest?
How do federal payer rules affect demand?
How does value-based care affect advisory demand?
Who are the leading healthcare consulting firms in the United States?
What are the main risks to growth?
Table of Content
Chapter 1 Market Segmentation
- 1.1 Segmentation Framework
- 1.1.1 Product and Service Classification
- 1.1.2 Application and End-Use Classification
- 1.1.3 Technology and Solution Classification
- 1.1.4 Customer and Distribution Channel Classification
- 1.1.5 Geographic Segmentation
- 1.1.6 Market Segment Definitions and Boundaries
- 1.2 By Service Type
- 1.2.1 Digital & Technology Consulting
- 1.2.2 Strategy & Transaction Advisory
- 1.2.3 Operations & Financial Performance Consulting
- 1.2.4 Regulatory & Clinical Transformation Consulting
- 1.3 By Customer Type
- 1.3.1 Healthcare Providers
- 1.3.2 Health Plans & Payers
- 1.3.3 Life Sciences Companies
- 1.3.4 Government & Public Health Agencies
- 1.4 By Application
- 1.4.1 Enterprise Digital Transformation
- 1.4.2 Cost & Revenue Optimization
- 1.4.3 Value-Based Care Design
- 1.4.4 M&A and Organizational Transformation
Chapter 2 Introduction
- 2.1 Report Objectives and Scope
- 2.2 Product Definition and Industry Terminology
- 2.3 Market Inclusions and Exclusions
- 2.4 Research Process
- 2.4.1 Primary Research and Expert Interviews
- 2.4.2 Secondary Research and Source Review
- 2.4.3 Top-Down and Bottom-Up Estimation
- 2.4.4 Data Triangulation and Verification
- 2.5 Market Size Measurement Basis
- 2.5.1 2025: USD 12.54 billion → 2035: USD 29.71 billion
- 2.6 Historical and Forecast Reference Periods
- 2.6.1 Historical Period: 2018-2025
- 2.6.2 Base Year: 2025
- 2.6.3 Forecast Period: 2025-2035
- 2.7 Research Assumptions and Limitations
Chapter 3 Executive Summary
- 3.1 Market Snapshot and Key Findings
- 3.2 Base-Year Market Size, 2025
- 3.3 Forecast Market Size, 2035
- 3.4 Revenue and Volume Growth Outlook
- 3.5 Key Demand and Supply Indicators
- 3.6 Leading Market Segments
- 3.7 Fastest-Growing Market Opportunities
- 3.8 Regional Performance Highlights
- 3.9 Technology and Industry Transformation
- 3.10 Competitive Landscape Summary
- 3.11 Analyst View and Strategic Implications
Chapter 4 USA Healthcare Consulting Services Market Trends and Developments
- 4.1 Historical Industry Development, 2018-2025
- 4.2 Recent Market Trends and Developments
- 4.3 Demand and Customer Behavior Trends
- 4.4 Technology and Product Innovation
- 4.5 Artificial Intelligence, Automation and Digitalization
- 4.6 Local Manufacturing and Supply Chain Realignment
- 4.7 Industry Partnerships, Mergers and Acquisitions
- 4.8 Sustainability and Circular Economy Developments
- 4.9 Government and Private Sector Investment Trends
- 4.10 Emerging Business Models and Commercialization
- 4.11 Industry Developments and Announcements
Chapter 5 USA Healthcare Consulting Services Market Supply and Demand Analysis
- 5.1 Demand Trend and Consumption Analysis, 2018-2025
- 5.2 Demand Forecast, 2025-2035
- 5.3 Supply Chain Structure and Procurement Trends
- 5.4 Supply-Demand Gap and Bottlenecks
- 5.5 Import Dependence and Sourcing Structure
- 5.6 Regional Supply and Demand Concentration
Chapter 6 USA Healthcare Consulting Services Market Pricing Analysis
- 6.1 Pricing Structure and Measurement
- 6.2 Historical Pricing Trends, 2018-2025
- 6.3 Pricing Outlook, 2025-2035
- 6.4 Pricing by Product and Market Segment
- 6.5 Geographic Pricing Differences
- 6.6 Key Input, Energy, Labor and Logistics Costs
- 6.7 Contract Pricing and Purchasing Models
- 6.8 Pricing Sensitivity and Competitive Positioning
- 6.9 Price, Margin and Profitability Implications
Chapter 7 USA Healthcare Consulting Services Market Dynamics
- 7.1 Market Growth Drivers
- 7.1.1 Demand-Side Drivers
- 7.1.2 Technology and Innovation Drivers
- 7.1.3 Infrastructure and Investment Drivers
- 7.1.4 Regulatory and Policy Drivers
- 7.2 Market Restraints
- 7.2.1 Cost and Affordability Constraints
- 7.2.2 Technology and Adoption Barriers
- 7.2.3 Supply Chain and Operational Constraints
- 7.3 Market Challenges
- 7.3.1 Competitive Pressure and Margin Erosion
- 7.3.2 Skills, Infrastructure and Implementation Gaps
- 7.4 Emerging Market Opportunities
- 7.5 Market Dynamics Impact and Time-Horizon Assessment
Chapter 8 USA Healthcare Consulting Services Value Chain Analysis
- 8.1 Industry Value Chain Overview
- 8.2 Upstream Suppliers and Critical Inputs
- 8.3 Technology and Component Providers
- 8.4 Manufacturing or Service Delivery
- 8.5 Distribution, Channel Partners and Integrators
- 8.6 Downstream Applications and End Users
- 8.7 Value Addition and Profit Pools
- 8.8 Vertical Integration and Outsourcing
- 8.9 Supplier Concentration and Risk
- 8.10 Supply Chain Localization and Resilience
Chapter 9 USA Healthcare Consulting Services Market Regulations and Policies
- 9.1 Relevant Laws, Standards and Compliance Frameworks
- 9.2 Product, Service, Safety and Quality Requirements
- 9.3 Government Policies, Incentives and Subsidies
- 9.4 Imports, Exports and Trade Barriers
- 9.5 Public Procurement and Local Content Requirements
- 9.6 Data Protection, AI and Cybersecurity Compliance
- 9.7 Upcoming Policy Changes and Market Implications
Chapter 10 USA Healthcare Consulting Services Market Hotspots and Opportunities
- 10.1 Market Opportunity Mapping and Growth Hotspots
- 10.2 High-Growth Applications and Customer Groups
- 10.3 Underserved Markets and White-Space Opportunities
- 10.4 Emerging Technology and Product Opportunities
- 10.5 New Capacity and Investment Hotspots
- 10.6 Market Entry and Expansion Opportunities
- 10.7 Distribution and Partnership Opportunities
- 10.8 Near-Term and Long-Term Commercial Potential
- 10.9 Opportunity Attractiveness and Execution Risks
Chapter 11 USA Healthcare Consulting Services Market Outlook, 2025-2035
- 11.1 Market Size and Analysis
- 11.1.1 Revenue (Market Measurement: 2025: USD 12.54 billion → 2035: USD 29.71 billion)
- 11.1.2 Historical Market Size, 2018-2025
- 11.1.3 Base-Year Market Size, 2025
- 11.2 Market Forecast, 2025-2035
- 11.2.1 Revenue Forecast to 2035
- 11.2.2 CAGR and Year-on-Year Growth
- 11.2.3 Incremental Revenue Opportunity
- 11.3 Forecast Assumptions and Scenario Analysis
- 11.3.1 Base-Case Forecast
- 11.3.2 Optimistic and Conservative Scenarios
- 11.3.3 Technology, Pricing and Policy Sensitivities
- 11.4 Market Attractiveness and Growth Outlook
Chapter 12 USA Healthcare Consulting Services Market Segmentation and Outlook
- 12.1 Segmentation Summary and Market Shares, 2025
- 12.2 Largest and Fastest-Growing Segments
- 12.3 By Service Type - Market Size and Forecast, 2025-2035
- 12.3.1 Segment Definition and Scope
- 12.3.2 Historical Market Size, 2018-2025
- 12.3.3 Revenue Forecast, 2025-2035
- 12.3.4 Base-Year Market Share, 2025
- 12.3.5 Segment CAGR and Growth Drivers
- 12.3.6 Subsegment Market Size and Forecast
- 12.3.6.1 Digital & Technology Consulting
- 12.3.6.2 Strategy & Transaction Advisory
- 12.3.6.3 Operations & Financial Performance Consulting
- 12.3.6.4 Regulatory & Clinical Transformation Consulting
- 12.3.7 Subsegment Pricing and Adoption Trends
- 12.3.8 Leading Suppliers and Competition
- 12.3.9 Regional Demand and Opportunities
- 12.4 By Customer Type - Market Size and Forecast, 2025-2035
- 12.4.1 Segment Definition and Scope
- 12.4.2 Historical Market Size, 2018-2025
- 12.4.3 Revenue Forecast, 2025-2035
- 12.4.4 Base-Year Market Share, 2025
- 12.4.5 Segment CAGR and Growth Drivers
- 12.4.6 Subsegment Market Size and Forecast
- 12.4.6.1 Healthcare Providers
- 12.4.6.2 Health Plans & Payers
- 12.4.6.3 Life Sciences Companies
- 12.4.6.4 Government & Public Health Agencies
- 12.4.7 Subsegment Pricing and Adoption Trends
- 12.4.8 Leading Suppliers and Competition
- 12.4.9 Regional Demand and Opportunities
- 12.5 By Application - Market Size and Forecast, 2025-2035
- 12.5.1 Segment Definition and Scope
- 12.5.2 Historical Market Size, 2018-2025
- 12.5.3 Revenue Forecast, 2025-2035
- 12.5.4 Base-Year Market Share, 2025
- 12.5.5 Segment CAGR and Growth Drivers
- 12.5.6 Subsegment Market Size and Forecast
- 12.5.6.1 Enterprise Digital Transformation
- 12.5.6.2 Cost & Revenue Optimization
- 12.5.6.3 Value-Based Care Design
- 12.5.6.4 M&A and Organizational Transformation
- 12.5.7 Subsegment Pricing and Adoption Trends
- 12.5.8 Leading Suppliers and Competition
- 12.5.9 Regional Demand and Opportunities
- 12.6 Segment Growth Comparison
- 12.7 Segment Attractiveness and Priority Matrix
Chapter 13 USA Healthcare Consulting Services End-Use and Application Market Outlook
- 13.1 End-Use Industry and Customer Demand Structure
- 13.2 Leading Applications and Customer Groups
- 13.3 End-Use Market Size, Share and Forecast
- 13.4 Major End-Use Industry Deep Dives
- 13.4.1 Customer Requirements and Use Cases
- 13.4.2 Demand and Replacement Cycles
- 13.4.3 Technical and Regulatory Considerations
- 13.4.4 Purchasing and Procurement Models
- 13.4.5 Leading Vendors and Distribution Channels
- 13.4.6 Forecast and Commercial Opportunities
- 13.5 Emerging Applications and Cross-Segment Demand
- 13.6 End-Use Industry Investment Priorities
Chapter 14 USA Healthcare Consulting Services Geographic Market Outlook, 2025-2035
- 14.1 Domestic Market Distribution and Demand Clusters
- 14.2 State- or Province-Wise Market Size and Forecast, 2025-2035
- 14.3 City and Metropolitan Market Outlook
- 14.4 Industrial, Manufacturing and Commercial Clusters
- 14.5 Geographic Concentration of Key End Users
- 14.6 Local Pricing and Purchasing Differences
- 14.7 Domestic Production Facilities and Capacity Map
- 14.8 Local Infrastructure and Project Pipeline
- 14.9 State-Level Policy and Incentive Differences
- 14.10 Subnational Investment Hotspots and Opportunities
- 14.11 Distribution and Logistics Networks
- 14.12 Domestic Competitive Footprint
Chapter 15 USA Healthcare Consulting Services Technology, Innovation and Sustainability Outlook
- 15.1 Technology Landscape and Maturity
- 15.2 Product, Process and Service Innovation
- 15.3 AI, Automation and Digital Tools in the Industry
- 15.4 Technology Adoption and Performance Benchmarking
- 15.5 Innovation Pipeline and R&D Investment
- 15.6 Energy Efficiency and Resource Management
- 15.7 Sustainability, Recycling and Circularity
- 15.8 Technology Roadmap, 2025-2035
- 15.9 Risks of Obsolescence and Technology Substitution
Chapter 16 USA Healthcare Consulting Services Market Key Strategic Imperatives
- 16.1 Growth and Market Entry Priorities
- 16.2 High-Return Products and Segments
- 16.3 Pricing, Profitability and Cost Optimization
- 16.4 Technology Investment and Product Differentiation
- 16.5 Supply Chain Localization and Resilience
- 16.6 Distribution and Customer Acquisition
- 16.7 Partnership, Acquisition and Capacity Strategy
- 16.8 Regional Expansion Priorities
- 16.9 Short-, Medium- and Long-Term Actions
Chapter 17 Competition Outlook
- 17.1 Industry Competition Characteristics
- 17.2 Market Structure and Concentration
- 17.3 Market Share and Competitive Positioning, 2025
- 17.4 Company-Wise Revenue and Product Benchmarking
- 17.5 Production and Service Capacity Benchmarking
- 17.6 Technology, Pricing and Differentiation
- 17.7 Regional Footprint and Distribution Strength
- 17.8 Mergers, Acquisitions and Strategic Alliances
- 17.9 New Entrants and Competitive Threats
- 17.10 Porter's Five Forces and Industry Attractiveness
- 17.11 Competitive Outlook, 2025-2035
Chapter 18 Company Profiles
- 18.1 Company Coverage and Selection Criteria
- 18.2 Deloitte
- 18.2.1 Business Description
- 18.2.2 Company Ownership and Geographic Presence
- 18.2.3 Product and Service Portfolio
- 18.2.4 Manufacturing and Operating Footprint
- 18.2.5 Financial Performance and Investment
- 18.2.6 Market Share and Competitive Position
- 18.2.7 Technology and Innovation Capabilities
- 18.2.8 Strategic Alliances or Partnerships
- 18.2.9 Recent Developments
- 18.2.10 Growth Strategy and Outlook
- 18.3 Accenture
- 18.4 PwC
- 18.5 EY
- 18.6 KPMG
- 18.7 McKinsey & Company
- 18.8 Boston Consulting Group
- 18.9 Guidehouse
- 18.10 Huron Consulting Group
- 18.11 Chartis
- 18.12 Other Relevant Market Participants
Note: Every listed company is profiled on the structure shown under the first company. The company list is preliminary and may change based on research findings, market developments, data availability and client requirements.
Chapter 19 Disclaimer
- 19.1 Research and Forecast Disclaimer
- 19.2 Data Source and Estimation Limitations
Note: The depth of individual sections depends on data availability for this market. Volume, capacity, trade and other unit-based metrics are included where applicable.

