
Sterile drug and RNA sites set controlled space demand
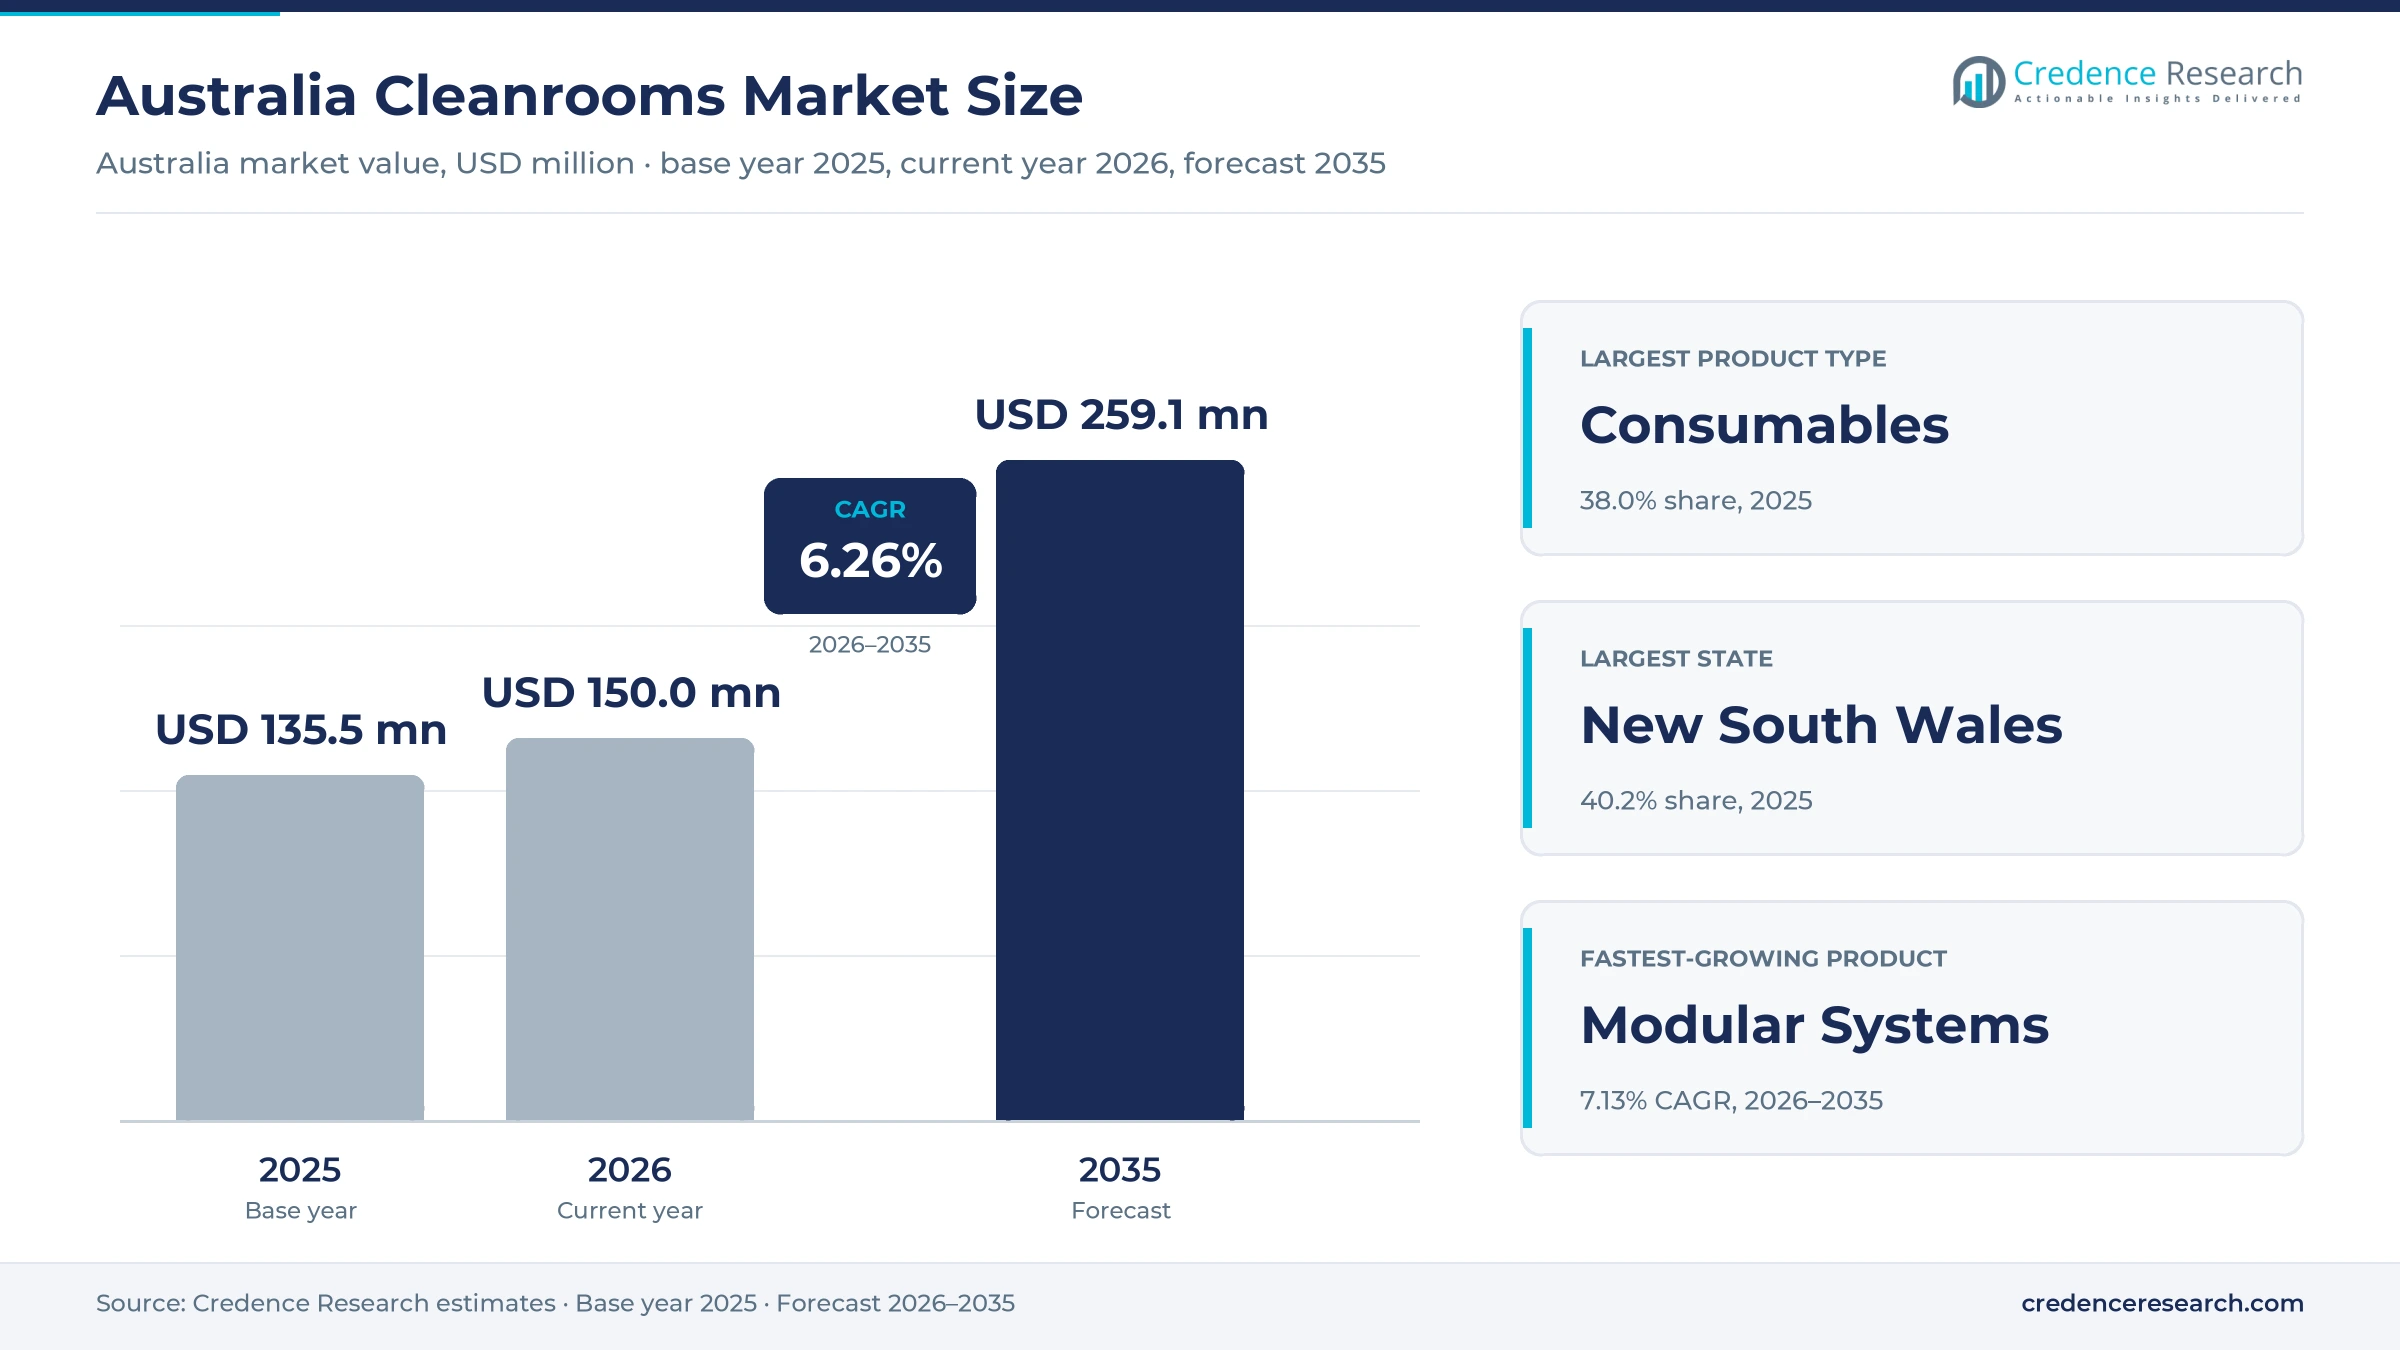
The Australia cleanrooms market was valued at USD 135.5 million in 2025 and is projected to increase from USD 150.0 million in 2026 to USD 259.1 million by 2035, registering a CAGR of 6.26% during 2026–2035. Demand comes from drug makers, biotechnology firms, device manufacturers and research groups that need particle-controlled rooms, filtration, garments and validation services to make sterile and sensitive products. New South Wales held the largest regional share, 40.2% in 2025, because Sydney hosts many sterile drug, device and research sites. Queensland is the fastest-growing state at 6.70% a year, as Brisbane adds shared biomanufacturing space for early-stage companies. However, the national move to the latest international good manufacturing practice guide in September 2025 has pushed sterile producers to upgrade contamination control, barrier systems and monitoring.
Which controlled spaces, products and services does the estimate cover?
The estimate measures the value of cleanroom consumables, equipment, services and modular systems bought by users in Australia. It counts garments, gloves, wipes and disinfectants, filtration and airflow units, isolators and pass-through hatches, design, build, validation and maintenance work, and prefabricated room systems used in drug, biotechnology, device, precision and research settings.
The estimate excludes general building works, standard heating and cooling plant, laboratory instruments and the value of products made inside the rooms. The value chain runs from global filter, glove and equipment makers through local builders, distributors and testing firms to the owners and tenants that operate controlled spaces.
Australia Cleanrooms Market Insights
- The Australia cleanrooms market was valued at USD 135.5 million in 2025 and is projected to reach USD 259.1 million by 2035, registering a CAGR of 6.26% during 2026–2035.
- New South Wales held a 40.2% share of 2025 value, because Sydney combines sterile drug sites, device makers and a new RNA pilot facility at Macquarie Park.
- Consumables led with a 38.0% share of 2025 value, because garments, gloves, wipes and disinfectants are replaced every shift in sterile production.
- The PIC/S Guide to GMP version 17 has applied to Australian medicine makers since Sept. 1, 2025, with its sterile annex bringing the most significant changes.
- Modular systems grow fastest at 7.13% a year during 2026–2035, as tenants and pilot producers want controlled space that can be built and changed quickly.
Consumables lead while modular systems grow fastest
Why do consumables hold the largest product value?
Based on product type, the market is categorized into consumables, equipment, services and modular systems. Consumables led with a 38.0% share of 2025 value, because sterile sites replace garments, gloves, wipes and disinfectants every shift. Modular Systems grow fastest at 7.13% a year, as shared facilities and pilot plants need rooms that can be installed and reconfigured quickly.
How does pharmaceutical manufacturing anchor demand?
Based on end-use industry, the market is categorized into pharmaceutical manufacturing, biotechnology, medical devices and precision manufacturing and research. Pharmaceutical Manufacturing led with a 42.0% share of 2025 value, because sterile injectables and vaccines need the strictest rooms. Biotechnology grows fastest at 7.09% a year, as RNA, cell therapy and biologics developers move toward clinical supply.
Which room technologies gain ground fastest?
Based on technology, the market is categorized into conventional controlled rooms, modular controlled rooms, barrier-based environments and localized clean zones. Conventional Controlled Rooms led with a 46.0% share of 2025 value, because most existing sterile sites were built as fixed rooms. Barrier-Based Environments grow fastest at 7.03% a year, as updated sterile rules favor isolators and restricted access barriers.
| Segment Group | Leading Sub-segment | Share, 2025 | Fastest-growing Sub-segment | CAGR, 2026–2035 |
|---|---|---|---|---|
| By Product Type | Consumables | 38.0% | Modular Systems | 7.13% |
| By End-Use Industry | Pharmaceutical Manufacturing | 42.0% | Biotechnology | 7.09% |
| By Technology | Conventional Controlled Rooms | 46.0% | Barrier-Based Environments | 7.03% |
Request a Free Sample
Fill in your details and we'll send you a free sample report.
- Sample data tables & charts
- Research methodology
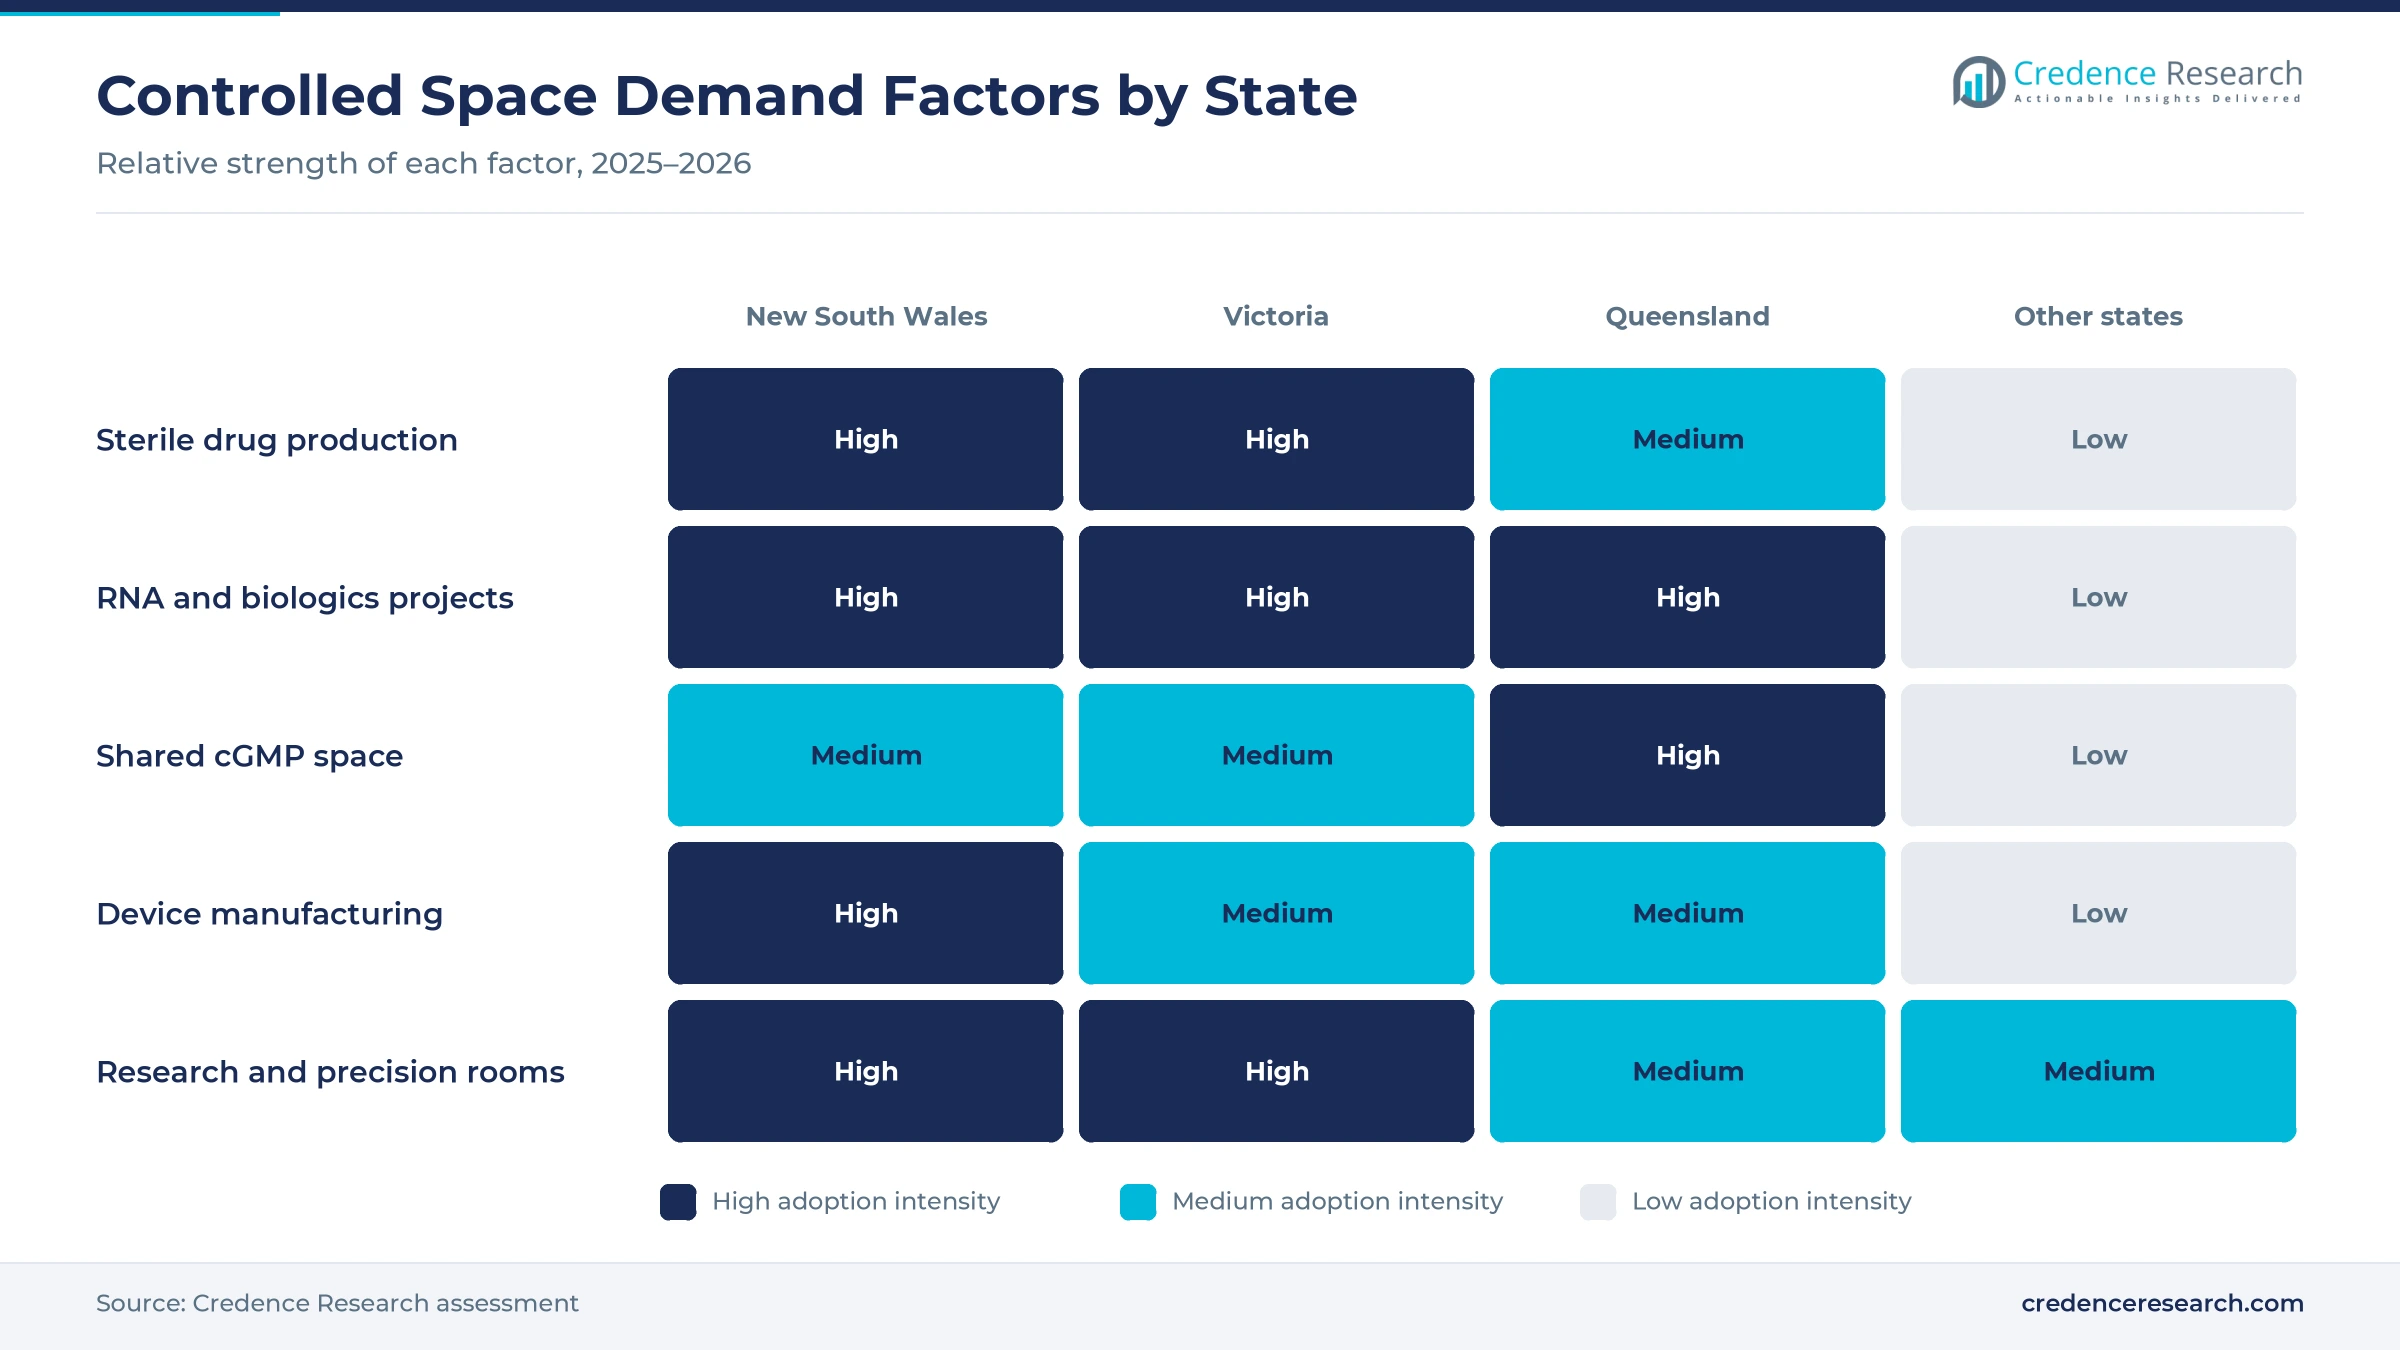
GMP rules, RNA plants and shared cGMP suites lift demand
How does sterile manufacturing compliance lift spending?
Sterile manufacturing compliance lifts spending, because medicine makers must prove that rooms, airflow and people practices keep products free of contamination. The PIC/S Guide to GMP version 17 has applied to Australian manufacturers of medicines and active ingredients since Sept. 1, 2025, according to the Therapeutic Goods Administration. The regulator identifies the sterile annex as the most significant change in that version. It also allowed a six-month window for some sterile changes, which compressed upgrade work into late 2025 and early 2026. As a result, pharmaceutical manufacturing holds 42.0% of 2025 value, because sterile producers buy the most monitoring, filtration and validation work.
Why does translational biomanufacturing capacity matter?
Translational biomanufacturing capacity matters, because RNA and biologics developers need clean space to make clinical trial batches inside the country. Moderna opened its Clayton facility in Victoria on Dec. 4, 2024, with capacity for up to 100 million vaccine doses a year, according to the Victorian Premier. The project also created about 140 direct jobs and about 500 construction jobs across the state. In New South Wales, the state government committed $72.2 million to an RNA pilot manufacturing facility of about 4,500 square meters at Macquarie Park. In turn, biotechnology grows at 7.09% a year, the fastest end-use industry during 2026–2035.
How does ENTRI on-demand cGMP space widen access?
ENTRI on-demand cGMP space widens access, because young companies can rent certified suites instead of building their own rooms. The Translational Research Institute unveiled the facility in Brisbane in August 2025, backed by more than $100 million from the institute and the Queensland Government, according to Australian Manufacturing. The building adds 7,000 square meters across four floors at the Princess Alexandra Hospital campus. Tenants can run their own cGMP production for biologics, RNA products, cell therapies and combination products, with onsite quality control and process development. As a result, Queensland is the fastest-growing state during 2026–2035, as shared suites draw early-stage producers that cannot fund their own rooms.
Why does validation and filter service demand keep rising?
Validation and filter service demand keeps rising, because every controlled room needs regular testing to keep its classification and its manufacturing license. LAF Technologies expanded its cleanroom validation services across Australia in June 2026, covering commissioning, requalification and environmental monitoring. Camfil bought Melbourne-based Airepure in March 2020, adding more than 70 staff and NATA testing services, and it now replaces HEPA filters in existing manufacturing rooms. Room classes are tested for particles from 0.1 to five micrometers under ISO 14644-1, which requires regular counts at every site. In turn, services grow faster than consumables and equipment, as owners outsource more contamination control testing and requalification work.
Barrier systems and rapid modular builds reshape projects
How is the shift to barrier-based processing changing designs?
The shift to barrier-based processing is changing designs, because isolators separate operators from open product and lower the contamination risk that inspectors focus on. The sterile annex in the PIC/S Guide to GMP version 17 became the most significant change for Australian producers from September 2025. Some sterile changes received a six-month transition, which pushed owners to plan barrier upgrades into 2026. LAF Technologies also installed a hydrogen peroxide decontamination chamber at a Melbourne vaccine plant, which reflects stronger demand for closed transfer systems. As a result, barrier-based environments grow at 7.03% a year, the fastest technology during 2026–2035, while fixed conventional rooms keep 46.0% of 2025 value.
Why is the rise of rapid modular builds notable?
The rise of rapid modular builds is notable, because owners want controlled space that can open sooner and change as products move through trials. Cleanrooms Australia offers hardwall, softwall, modular, mobile and portable rooms, and it has worked in cleanroom design and installation since 1990. ENTRI rents finished cGMP suites across 7,000 square meters, which shows how shared and flexible space now competes with fixed builds. The NSW RNA facility of about 4,500 square meters also targets small-scale clinical batches, where room layouts may change often. In turn, modular systems grow at 7.13% a year, the fastest product type, as buyers favor prefabricated wall and ceiling systems over long site works.
Can RNA and radiopharmaceutical pilot sites open new demand?
RNA and radiopharmaceutical pilot sites can open new demand, because each new therapy class needs its own controlled production space and monitoring. The NSW RNA facility will make messenger RNA, synthetic RNA and lipid nanoparticle products, with $119 million set aside over 10 years for RNA research. Sanofi plans 14 mRNA research projects from 2025 through its Queensland hub, and it has contracted IDT Australia for clinical GMP manufacturing of its mRNA assets. LAF Technologies also delivered monitoring systems for a radiopharmaceutical facility in Sydney. As a result, buyers that use outsourced biologics production create steady demand for validated rooms and consumables during 2026–2035.
Is there room to grow in precision and semiconductor-grade rooms?
Precision and semiconductor-grade rooms offer room to grow, because quantum, photonics and sensor work needs very low particle counts. Umech, an Australian laboratory equipment supplier, added an ISO Class 5 semiconductor-grade cleanroom in March 2025. The ISO 14644-1 standard classifies air cleanliness for particles from 0.1 to five micrometers, which sets the test basis for these rooms. Australian research groups also use controlled rooms for device prototypes and materials testing, which adds steady service work. In turn, precision manufacturing and research users buy more localized clean zones and laminar flow units, which lowers the cost of entry for small labs.
Skills, energy use and validation costs slow new rooms
How do skills shortages slow controlled space projects?
Skills shortages slow controlled space projects, because few engineers and technicians in Australia specialize in sterile design, validation and microbiological monitoring. As a result, projects can wait for qualified staff, and owners pay more for experienced contractors. Builders respond by training staff and partnering with testing firms, which spreads scarce skills across more sites. This constraint stays tight while several RNA and biologics sites start up at the same time.
Why do energy costs weigh on room operators?
Energy costs weigh on room operators, because high air change rates and filtered airflow run all day in most sterile rooms. In turn, operating budgets rise when electricity prices increase, which hurts smaller producers most. Owners respond with variable speed fans, setback modes for idle periods and smaller barrier zones, which reduce the volume of air that needs treatment. These steps also favor isolators and local clean zones over large open rooms.
How do validation costs affect small producers?
Validation costs affect small producers, because every new room, change or major repair needs testing and documentation before production can start. As a result, start-ups can spend a large part of early budgets on qualification rather than product work. Shared facilities such as ENTRI respond by offering validated suites, which spread the cost across tenants. This model lowers barriers yet requires careful scheduling between tenants with different products.
Why does import dependence affect equipment lead times?
Import dependence affects equipment lead times, because many filters, isolators, particle counters and specialty gloves are made overseas. In turn, freight delays and currency swings can push back project dates and raise costs for owners. Local builders respond by holding stock of common panels and filters and by ordering long-lead items early in each project. This risk favors suppliers with local stock and service teams.
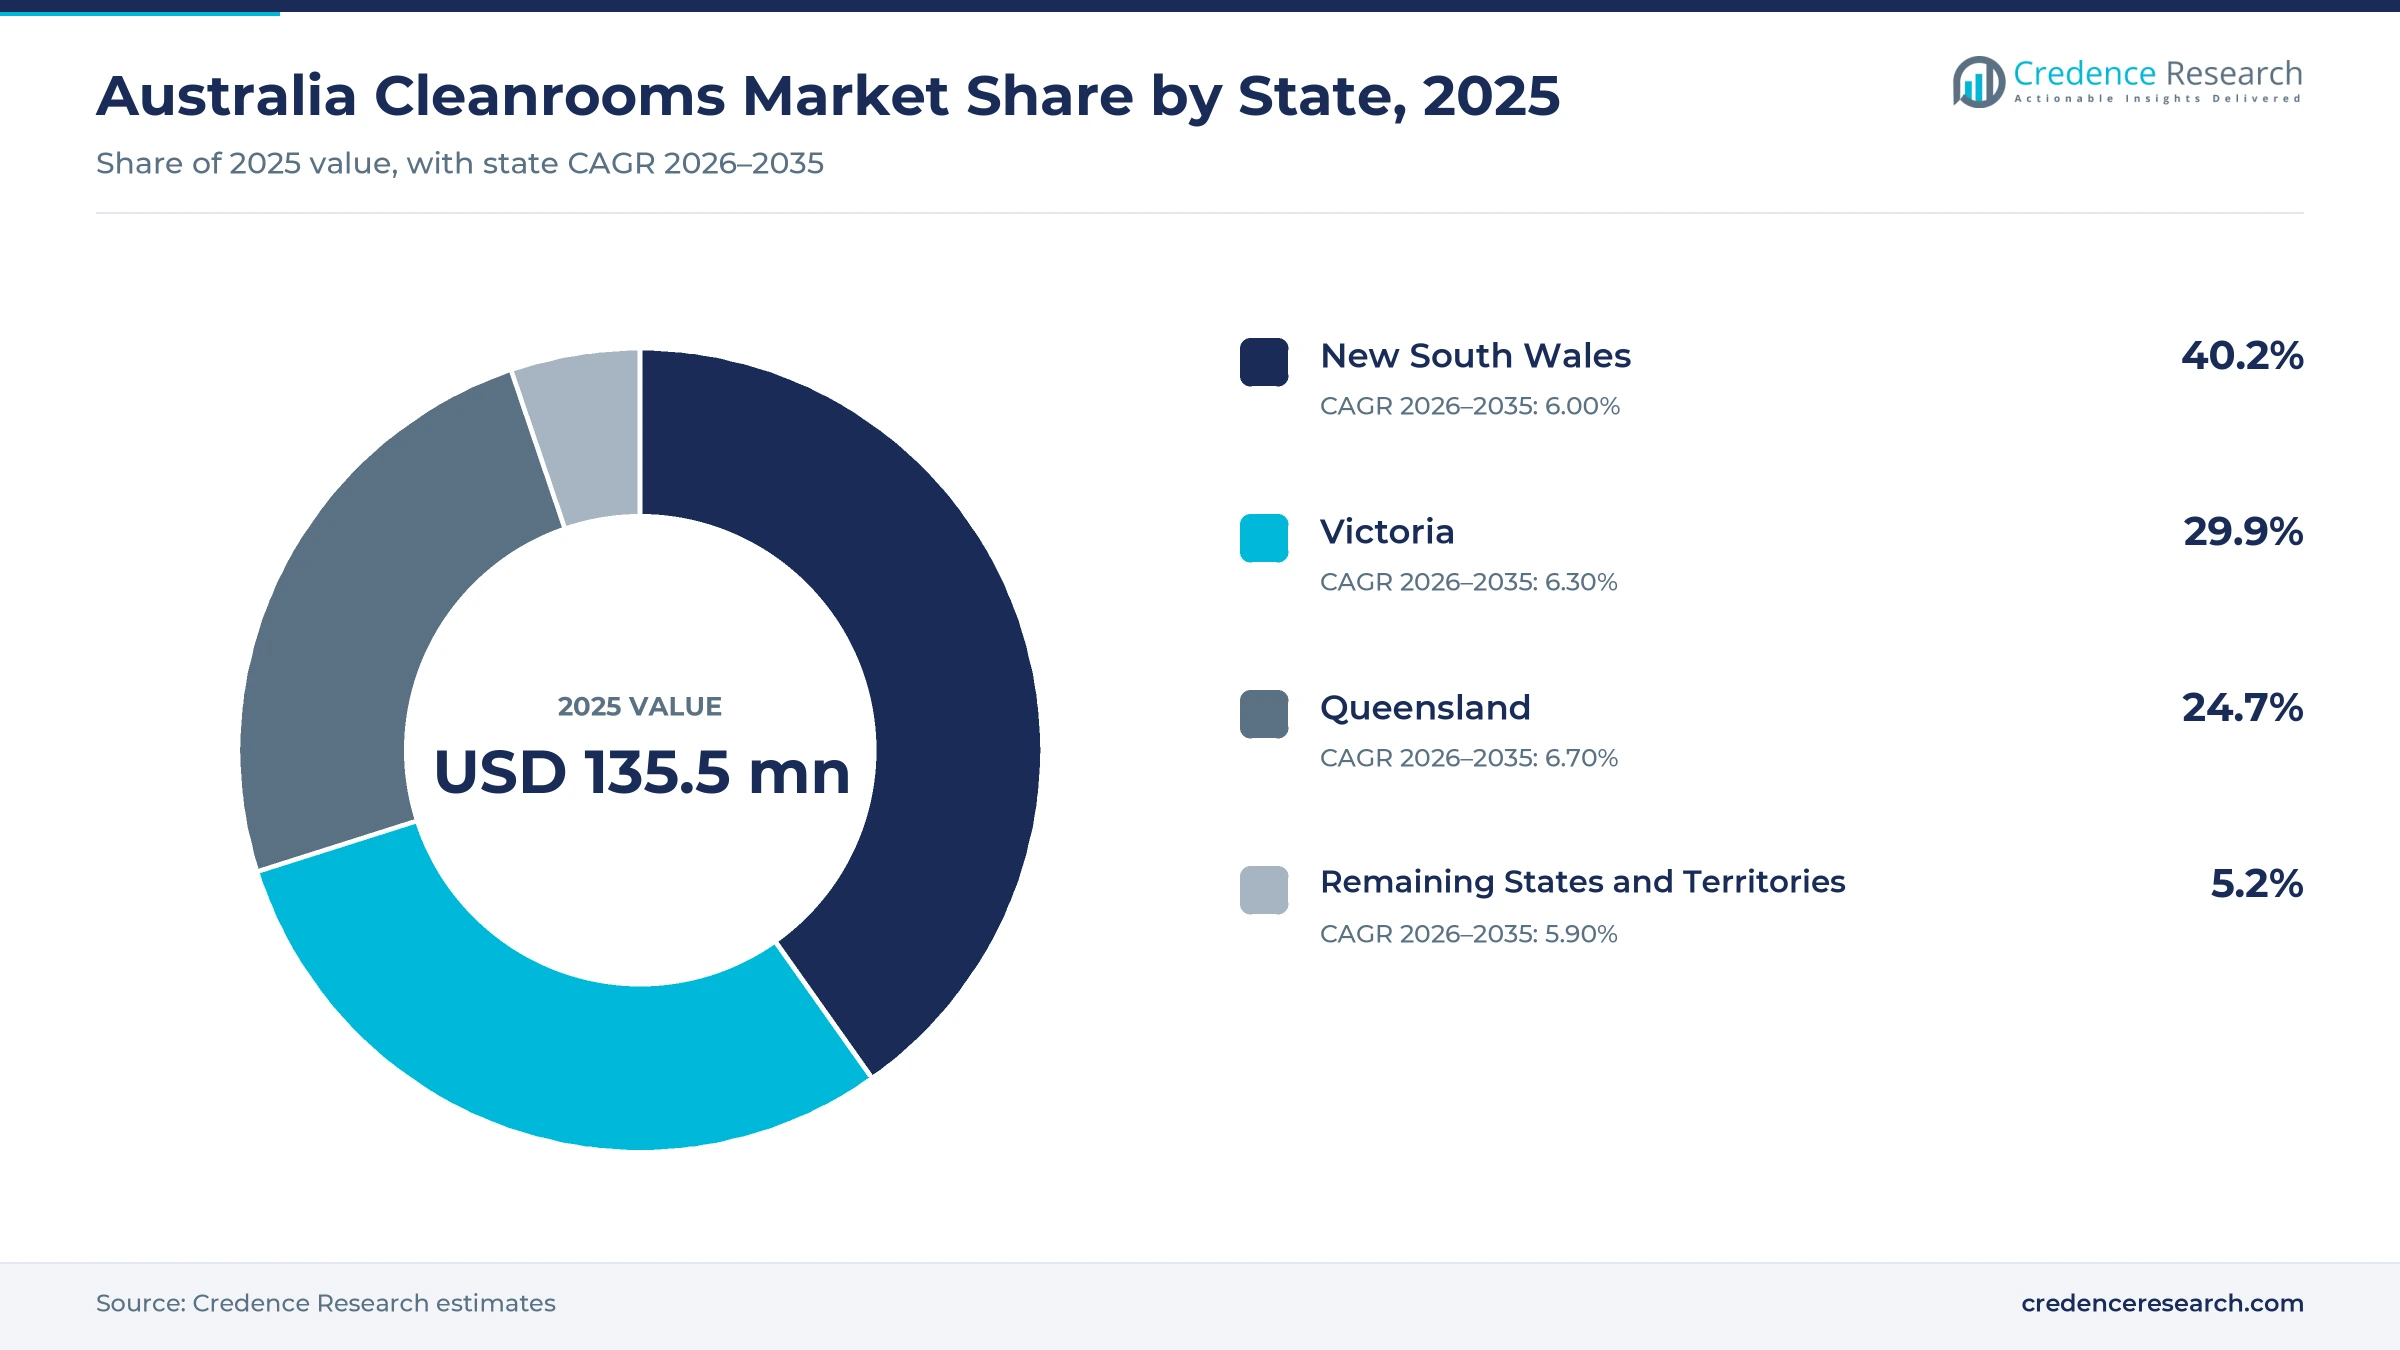
Sydney and Melbourne lead while Queensland grows fastest
| State | Value, 2025 (USD million) | Share, 2025 | CAGR, 2026–2035 |
|---|---|---|---|
| New South Wales | 54.5 | 40.2% | 6.00% |
| Victoria | 40.5 | 29.9% | 6.30% |
| Queensland | 33.5 | 24.7% | 6.70% |
| Remaining States and Territories | 7.0 | 5.2% | 5.90% |
Why does New South Wales hold the top share?
New South Wales held a 40.2% share of 2025 value and grows at 6.00% a year, because the Sydney region hosts sterile drug, device, fertility and research sites. The state government committed $72.2 million to build the RNA pilot facility at Macquarie Park within a $95.8 million commitment. A radiopharmaceutical facility in Sydney also installed new monitoring systems through LAF Technologies. As a result, New South Wales buys the largest volume of consumables and validation work.
How does Victoria support controlled space demand?
Victoria held a 29.9% share of 2025 value and grows at 6.30% a year, because Melbourne combines vaccine, plasma and device production with university research. Moderna opened its 10,000 square meter Clayton facility in December 2024 with capacity for up to 100 million doses a year. A Melbourne vaccine plant also added a decontamination chamber through LAF Technologies. In turn, Victoria remains the second largest state for room upgrades and services.
Why is Queensland growing fastest?
Queensland held a 24.7% share of 2025 value and grows fastest at 6.70% a year, because the Brisbane region adds shared cGMP space for early-stage producers. ENTRI adds 7,000 square meters of cGMP cleanrooms, wet labs and offices across four floors in Woolloongabba. Sanofi also runs its translational science hub from research sites in Brisbane and on the Gold Coast. As a result, Queensland attracts tenants that buy validation, consumables and modular fit-outs.
How do the remaining states and territories contribute?
The remaining states and territories held a 5.2% share of 2025 value and grow at 5.90% a year, because they host fewer sterile production sites. Western Australia, South Australia, Tasmania and the territories rely more on hospital pharmacy, research and mining laboratory rooms. Camfil supports these areas through offices and agents in Perth, Adelaide and Hobart. In turn, this zone buys mainly filter changes, testing and small modular rooms.
RNA plant openings, GMP rules and validation milestones
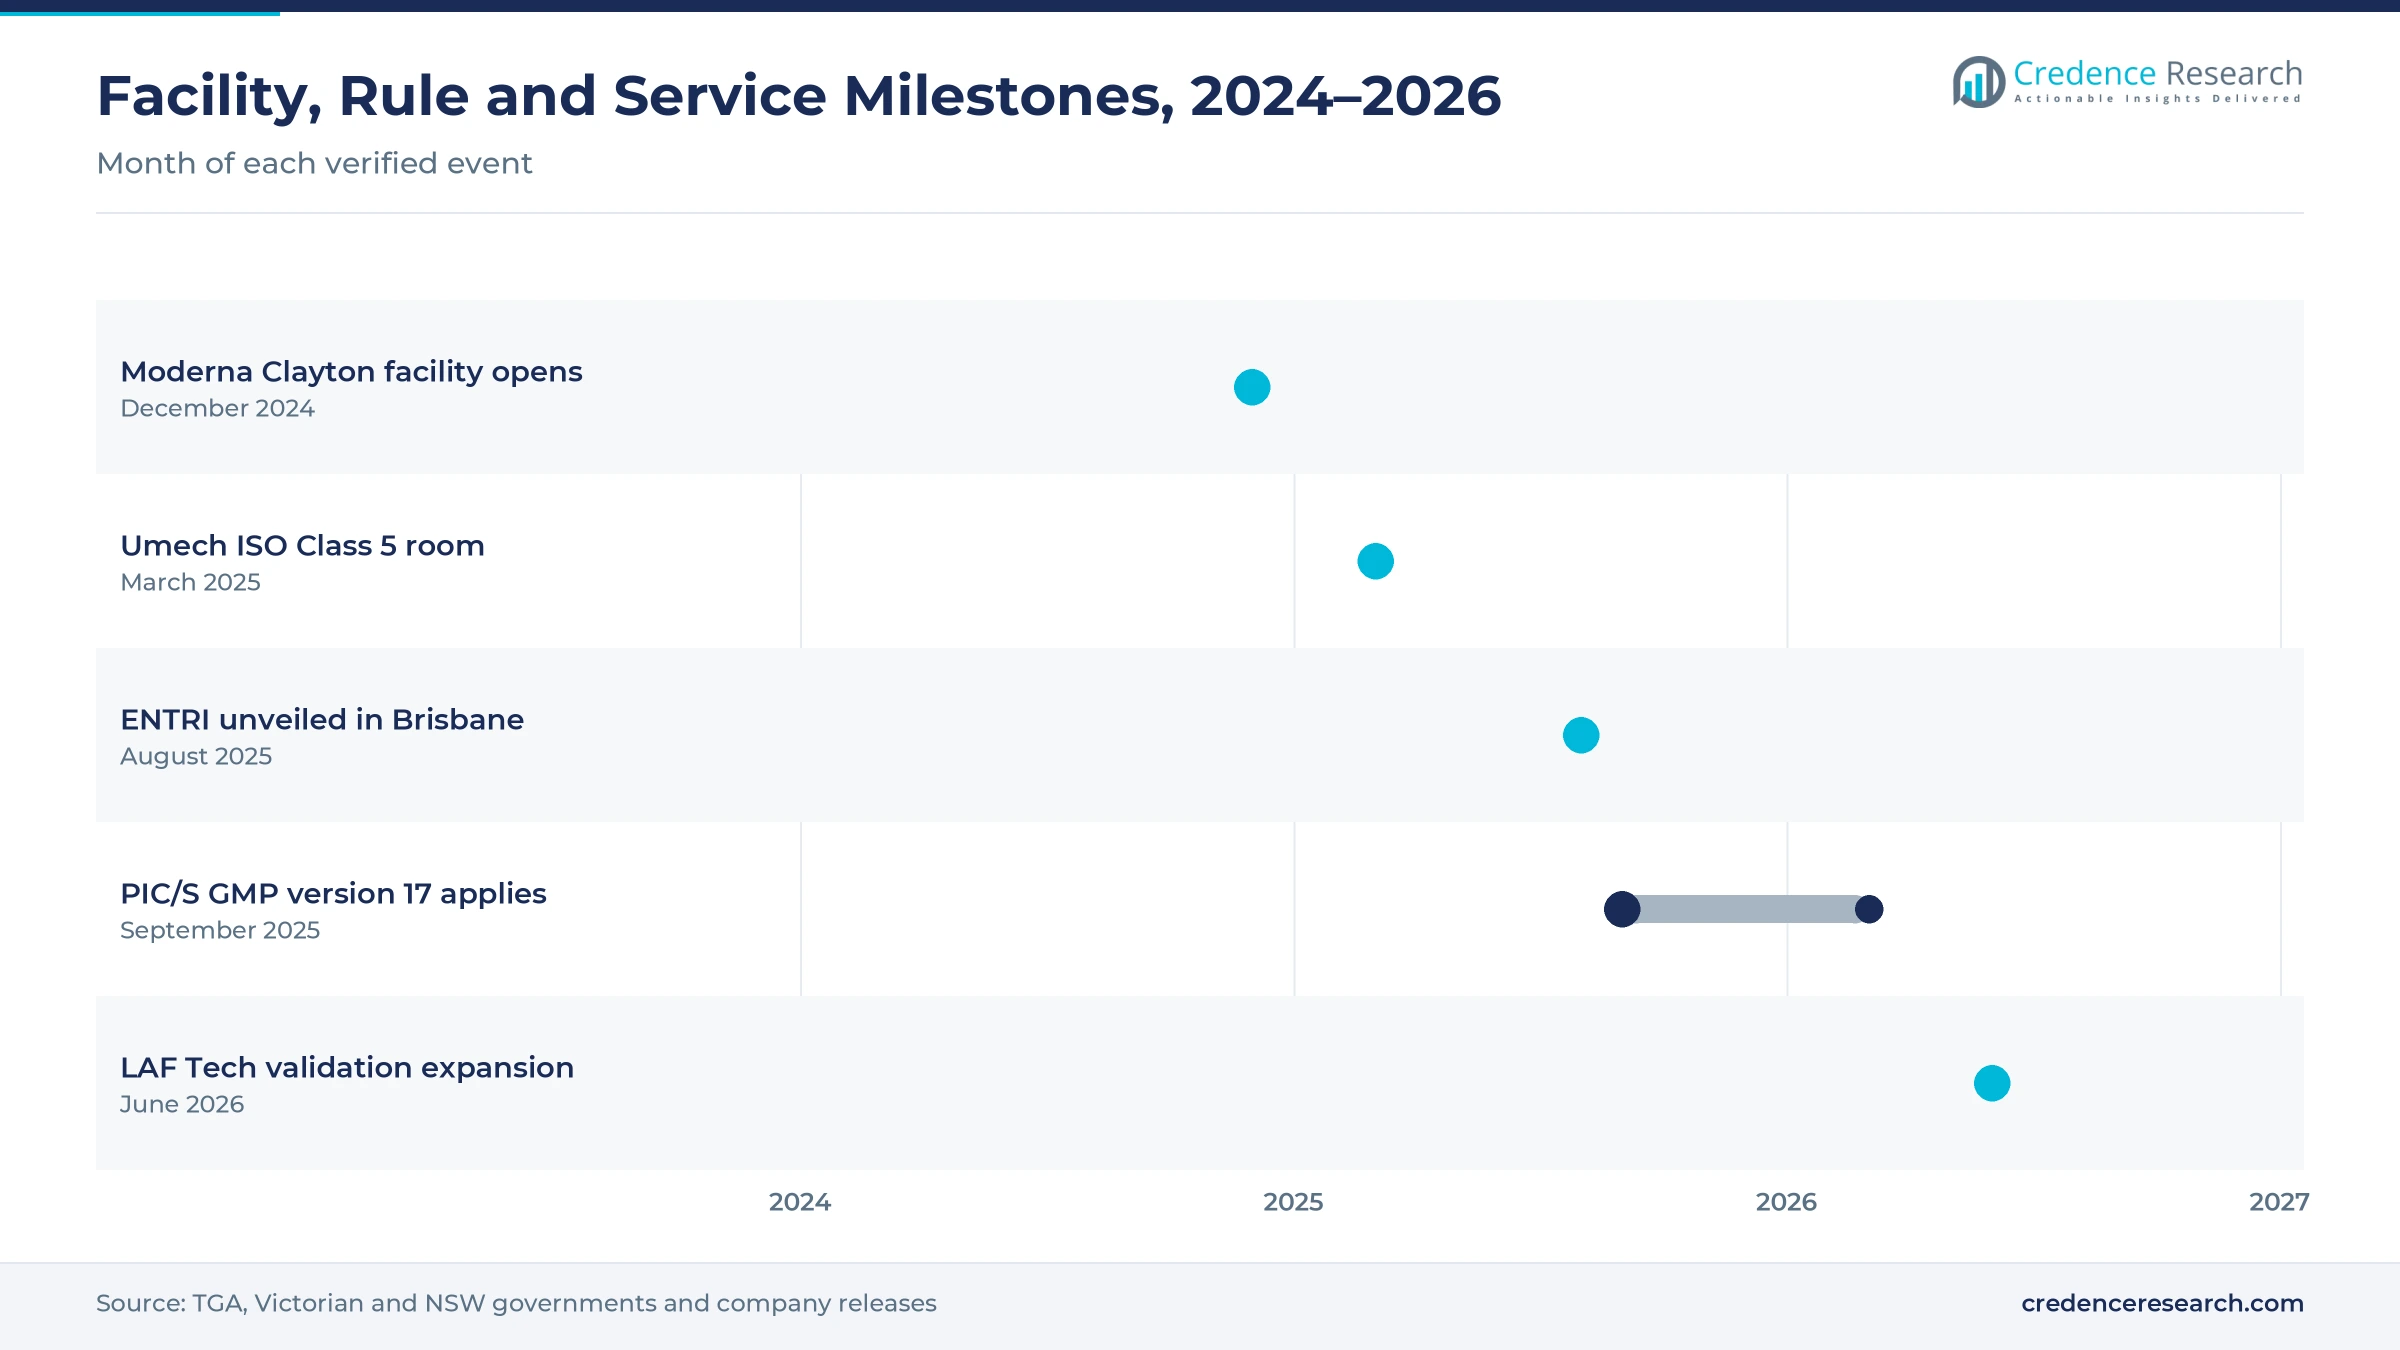
| Development | Status and market relevance |
|---|---|
| In December 2024, Moderna opened its mRNA vaccine facility at Clayton in Victoria. | Adds a large sterile production site with up to 100 million doses a year |
| In March 2025, Umech added an ISO Class 5 semiconductor-grade cleanroom in Australia. | Signals demand for very low particle rooms beyond drug making |
| In August 2025, the Translational Research Institute unveiled the ENTRI facility in Brisbane. | Opens on-demand cGMP suites for biologics, RNA and cell therapy tenants |
| In September 2025, the PIC/S Guide to GMP version 17 began to apply to Australian medicine makers. | Brings the most significant sterile manufacturing changes in the guide |
| In June 2026, LAF Technologies expanded its cleanroom validation services across Australia. | Adds testing capacity for drug, biotechnology and research sites |
Isolators, HEPA filtration and monitoring define performance
- HEPA and ULPA filtration removes fine particles from supply air, which lets rooms meet their ISO class and keeps sterile zones within limits.
- Isolators and restricted access barriers separate operators from open product, which lowers contamination risk and reduces the size of the highest grade zone.
- Continuous environmental monitoring tracks particles, pressure and microbes in real time, which helps owners spot problems early and keep batch records complete.
- Hydrogen peroxide decontamination sterilizes chambers, materials and rooms between uses, which shortens downtime and supports closed transfer of items into sterile zones.
Need a Custom Version of This Report?
Tailor the scope, geography, or segments to your exact requirements.
- Custom geography or segment scope
- Direct access to our analyst team
Local builders and global suppliers compete on compliance
Competition combines global suppliers of filters, gloves and sterilization systems with local builders and testing firms. Camfil bought Melbourne-based Airepure in March 2020, adding more than 70 staff and offices in Sydney, Brisbane, Perth, Adelaide and other cities, and it now runs a NATA certified filter replacement service. Ansell sells BioClean sterile and non-sterile cleanroom gloves in Australia. STERIS Australia supplies sterilization equipment and services to Australian hospitals. Cleanrooms Australia designs and builds hardwall, softwall and modular rooms, while LAF Technologies focuses on validation and monitoring. Many owners also run contract drug production sites that tender room work to several suppliers. Suppliers compete on compliance knowledge, speed of build, local service and the ability to keep rooms certified.
Which suppliers and builders serve Australian controlled spaces?
| Company | Type | Role in the market |
|---|---|---|
| Camfil Australia | Filtration supplier | Replaces and tests HEPA filters in manufacturing rooms |
| Ansell | Consumables supplier | Sells BioClean sterile and non-sterile cleanroom gloves |
| STERIS | Equipment supplier | Supplies sterilization equipment and services in Australia |
| Cleanrooms Australia | Room builder | Designs and builds hardwall, softwall and modular rooms |
| LAF Technologies | Validation provider | Expanded national validation services in June 2026 |
Credence Research view on controlled space demand
Credence Research's view is that Australian demand for controlled spaces will grow steadily because sterile rules, RNA projects and shared cGMP suites keep adding rooms and raising standards. Consumables remain the largest product type, while modular systems grow fastest. Queensland gains most from new shared space, while New South Wales and Victoria keep the largest installed bases. Suppliers that combine compliance knowledge, fast modular builds and local validation teams should gain the most share by 2035, while barrier systems offer a second growth path.
How the national controlled environment estimate was built
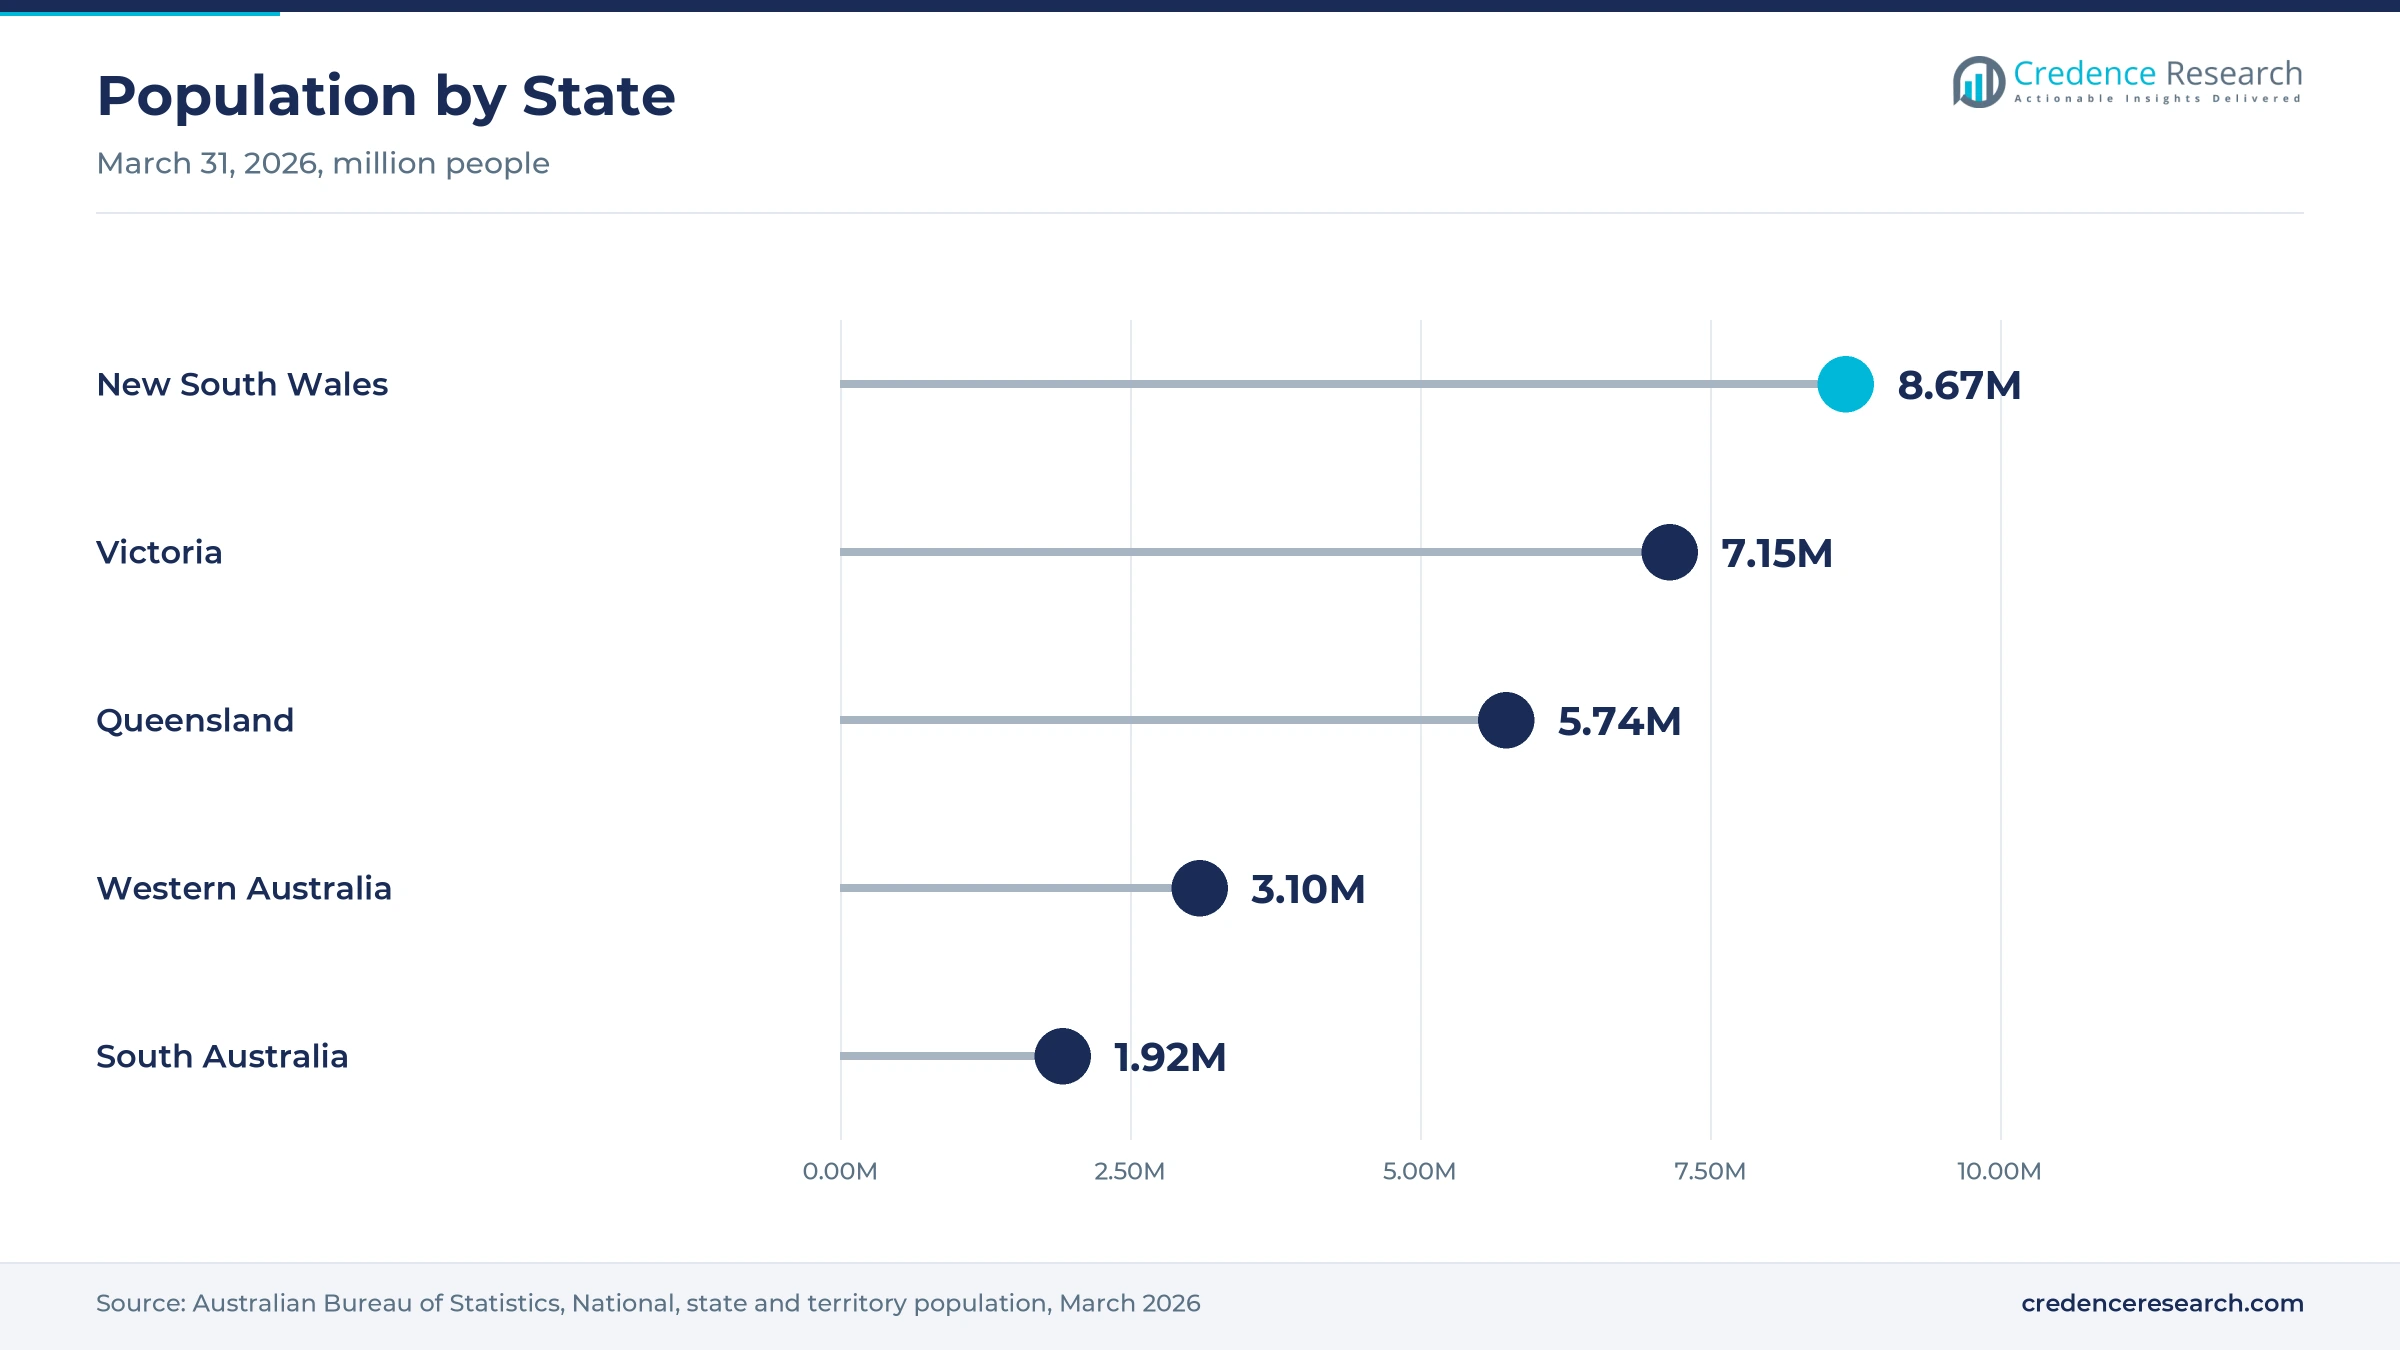
The report uses 2025 as the base year on a calendar basis, and market values come from the Credence Research model. That model combines regulator guidance, government project releases, international standards, official population statistics and company releases. Segment splits and state growth rates are Credence Research estimates, while state shares follow the client split. Sources used are regulator pages, government releases, standards bodies, trade media and company websites, and no interviews or surveys were used.
Biologics, devices and pilot plants carry growth to 2035
The Australia cleanrooms market is expected to reach USD 259.1 million by 2035, a 6.26% CAGR during 2026–2035, as sterile drug makers, RNA developers and device producers keep adding and upgrading controlled space. Growth should be strongest in modular systems, barrier-based environments and Queensland, because these areas gain most from new facilities and stricter sterile rules. Skills shortages, energy costs and validation expenses could slow some projects, while shared suites and local service teams should ease access for smaller producers.
Frequently Asked Questions
How big is the Australia cleanrooms market?
Which product type leads controlled space spending?
Which state leads the market?
How do GMP rules affect controlled space demand?
What is ENTRI and why does it matter?
How do RNA projects support controlled space demand?
Who are the leading companies in the Australian controlled space market?
What are the main challenges for room owners?
Table of Content
Chapter 1 Market Segmentation
- 1.1 Segmentation Framework
- 1.1.1 Product and Service Classification
- 1.1.2 Application and End-Use Classification
- 1.1.3 Technology and Solution Classification
- 1.1.4 Customer and Distribution Channel Classification
- 1.1.5 Geographic Segmentation
- 1.1.6 Market Segment Definitions and Boundaries
- 1.2 By Product Type
- 1.2.1 Consumables
- 1.2.2 Equipment
- 1.2.3 Services
- 1.2.4 Modular Systems
- 1.3 By End-Use Industry
- 1.3.1 Pharmaceutical Manufacturing
- 1.3.2 Biotechnology
- 1.3.3 Medical Devices
- 1.3.4 Precision Manufacturing and Research
- 1.4 By Technology
- 1.4.1 Conventional Controlled Rooms
- 1.4.2 Modular Controlled Rooms
- 1.4.3 Barrier-Based Environments
- 1.4.4 Localized Clean Zones
- 1.5 By State
- 1.5.1 Victoria
- 1.5.2 New South Wales
- 1.5.3 Queensland
- 1.5.4 Remaining States and Territories
Chapter 2 Introduction
- 2.1 Report Objectives and Scope
- 2.2 Product Definition and Industry Terminology
- 2.3 Market Inclusions and Exclusions
- 2.4 Research Process
- 2.4.1 Primary Research and Expert Interviews
- 2.4.2 Secondary Research and Source Review
- 2.4.3 Top-Down and Bottom-Up Estimation
- 2.4.4 Data Triangulation and Verification
- 2.5 Market Size Measurement Basis
- 2.5.1 2025: USD 135.5 million → 2035: USD 259.1 million
- 2.6 Historical and Forecast Reference Periods
- 2.6.1 Historical Period: 2018-2025
- 2.6.2 Base Year: 2025
- 2.6.3 Forecast Period: 2025-2035
- 2.7 Research Assumptions and Limitations
Chapter 3 Executive Summary
- 3.1 Market Snapshot and Key Findings
- 3.2 Base-Year Market Size, 2025
- 3.3 Forecast Market Size, 2035
- 3.4 Revenue and Volume Growth Outlook
- 3.5 Key Demand and Supply Indicators
- 3.6 Leading Market Segments
- 3.7 Fastest-Growing Market Opportunities
- 3.8 Regional Performance Highlights
- 3.9 Technology and Industry Transformation
- 3.10 Competitive Landscape Summary
- 3.11 Analyst View and Strategic Implications
Chapter 4 Australia Cleanrooms Market Trends and Developments
- 4.1 Historical Industry Development, 2018-2025
- 4.2 Recent Market Trends and Developments
- 4.3 Demand and Customer Behavior Trends
- 4.4 Technology and Product Innovation
- 4.5 Artificial Intelligence, Automation and Digitalization
- 4.6 Local Manufacturing and Supply Chain Realignment
- 4.7 Industry Partnerships, Mergers and Acquisitions
- 4.8 Sustainability and Circular Economy Developments
- 4.9 Government and Private Sector Investment Trends
- 4.10 Emerging Business Models and Commercialization
- 4.11 Industry Developments and Announcements
Chapter 5 Australia Cleanrooms Market Production, Supply and Demand Analysis
- 5.1 Demand Trend and Consumption Analysis, 2018-2025
- 5.2 Demand Forecast, 2025-2035
- 5.3 Production and Output Trend, 2018-2025
- 5.4 Production and Output Forecast, 2025-2035
- 5.5 Installed Capacity and Capacity Utilization
- 5.6 Company-Wise Production Plants and Statistics
- 5.6.1 Installed Production Capacity
- 5.6.2 Actual Production
- 5.6.3 Planned Capacity and Expansion Targets
- 5.7 Supply Chain Structure and Procurement Trends
- 5.8 Supply-Demand Gap and Bottlenecks
- 5.9 Import Dependence and Sourcing Structure
- 5.10 Contract Manufacturing and Outsourcing
- 5.11 Regional Supply and Demand Concentration
Chapter 6 Australia Cleanrooms Market Pricing Analysis
- 6.1 Pricing Structure and Measurement
- 6.2 Historical Pricing Trends, 2018-2025
- 6.3 Pricing Outlook, 2025-2035
- 6.4 Average Selling Price and Unit Economics
- 6.5 Pricing by Product and Market Segment
- 6.6 Geographic Pricing Differences
- 6.7 Key Input, Energy, Labor and Logistics Costs
- 6.8 Contract Pricing and Purchasing Models
- 6.9 Pricing Sensitivity and Competitive Positioning
- 6.10 Price, Margin and Profitability Implications
Chapter 7 Australia Cleanrooms Market Dynamics
- 7.1 Market Growth Drivers
- 7.1.1 Demand-Side Drivers
- 7.1.2 Technology and Innovation Drivers
- 7.1.3 Infrastructure and Investment Drivers
- 7.1.4 Regulatory and Policy Drivers
- 7.2 Market Restraints
- 7.2.1 Cost and Affordability Constraints
- 7.2.2 Technology and Adoption Barriers
- 7.2.3 Supply Chain and Operational Constraints
- 7.3 Market Challenges
- 7.3.1 Competitive Pressure and Margin Erosion
- 7.3.2 Skills, Infrastructure and Implementation Gaps
- 7.4 Emerging Market Opportunities
- 7.5 Market Dynamics Impact and Time-Horizon Assessment
Chapter 8 Australia Cleanrooms Value Chain Analysis
- 8.1 Industry Value Chain Overview
- 8.2 Upstream Suppliers and Critical Inputs
- 8.3 Technology and Component Providers
- 8.4 Manufacturing or Service Delivery
- 8.5 Distribution, Channel Partners and Integrators
- 8.6 Downstream Applications and End Users
- 8.7 Value Addition and Profit Pools
- 8.8 Vertical Integration and Outsourcing
- 8.9 Supplier Concentration and Risk
- 8.10 Supply Chain Localization and Resilience
Chapter 9 Australia Cleanrooms Market Regulations and Policies
- 9.1 Relevant Laws, Standards and Compliance Frameworks
- 9.2 Product, Service, Safety and Quality Requirements
- 9.3 Government Policies, Incentives and Subsidies
- 9.4 Imports, Exports and Trade Barriers
- 9.5 Public Procurement and Local Content Requirements
- 9.6 Environmental and Sustainability Compliance
- 9.7 Upcoming Policy Changes and Market Implications
Chapter 10 Australia Cleanrooms Market Hotspots and Opportunities
- 10.1 Market Opportunity Mapping and Growth Hotspots
- 10.2 High-Growth Applications and Customer Groups
- 10.3 Underserved Markets and White-Space Opportunities
- 10.4 Emerging Technology and Product Opportunities
- 10.5 New Capacity and Investment Hotspots
- 10.6 Market Entry and Expansion Opportunities
- 10.7 Distribution and Partnership Opportunities
- 10.8 Near-Term and Long-Term Commercial Potential
- 10.9 Opportunity Attractiveness and Execution Risks
Chapter 11 Australia Cleanrooms Market Outlook, 2025-2035
- 11.1 Market Size and Analysis
- 11.1.1 Revenue (Market Measurement: 2025: USD 135.5 million → 2035: USD 259.1 million)
- 11.1.2 Market Volume and Quantity Sold
- 11.1.3 Historical Market Size, 2018-2025
- 11.1.4 Base-Year Market Size, 2025
- 11.2 Market Forecast, 2025-2035
- 11.2.1 Revenue Forecast to 2035
- 11.2.2 Volume Forecast to 2035
- 11.2.3 CAGR and Year-on-Year Growth
- 11.2.4 Incremental Revenue Opportunity
- 11.3 Forecast Assumptions and Scenario Analysis
- 11.3.1 Base-Case Forecast
- 11.3.2 Optimistic and Conservative Scenarios
- 11.3.3 Technology, Pricing and Policy Sensitivities
- 11.4 Market Attractiveness and Growth Outlook
Chapter 12 Australia Cleanrooms Market Segmentation and Outlook
- 12.1 Segmentation Summary and Market Shares, 2025
- 12.2 Largest and Fastest-Growing Segments
- 12.3 By Product Type - Market Size and Forecast, 2025-2035
- 12.3.1 Segment Definition and Scope
- 12.3.2 Historical Market Size, 2018-2025
- 12.3.3 Revenue Forecast, 2025-2035
- 12.3.4 Volume Forecast, 2025-2035
- 12.3.5 Base-Year Market Share, 2025
- 12.3.6 Segment CAGR and Growth Drivers
- 12.3.7 Subsegment Market Size and Forecast
- 12.3.7.1 Consumables
- 12.3.7.2 Equipment
- 12.3.7.3 Services
- 12.3.7.4 Modular Systems
- 12.3.8 Subsegment Pricing and Adoption Trends
- 12.3.9 Leading Suppliers and Competition
- 12.3.10 Regional Demand and Opportunities
- 12.4 By End-Use Industry - Market Size and Forecast, 2025-2035
- 12.4.1 Segment Definition and Scope
- 12.4.2 Historical Market Size, 2018-2025
- 12.4.3 Revenue Forecast, 2025-2035
- 12.4.4 Volume Forecast, 2025-2035
- 12.4.5 Base-Year Market Share, 2025
- 12.4.6 Segment CAGR and Growth Drivers
- 12.4.7 Subsegment Market Size and Forecast
- 12.4.7.1 Pharmaceutical Manufacturing
- 12.4.7.2 Biotechnology
- 12.4.7.3 Medical Devices
- 12.4.7.4 Precision Manufacturing and Research
- 12.4.8 Subsegment Pricing and Adoption Trends
- 12.4.9 Leading Suppliers and Competition
- 12.4.10 Regional Demand and Opportunities
- 12.5 By Technology - Market Size and Forecast, 2025-2035
- 12.5.1 Segment Definition and Scope
- 12.5.2 Historical Market Size, 2018-2025
- 12.5.3 Revenue Forecast, 2025-2035
- 12.5.4 Volume Forecast, 2025-2035
- 12.5.5 Base-Year Market Share, 2025
- 12.5.6 Segment CAGR and Growth Drivers
- 12.5.7 Subsegment Market Size and Forecast
- 12.5.7.1 Conventional Controlled Rooms
- 12.5.7.2 Modular Controlled Rooms
- 12.5.7.3 Barrier-Based Environments
- 12.5.7.4 Localized Clean Zones
- 12.5.8 Subsegment Pricing and Adoption Trends
- 12.5.9 Leading Suppliers and Competition
- 12.5.10 Regional Demand and Opportunities
- 12.6 By State - Market Size and Forecast, 2025-2035
- 12.6.1 Segment Definition and Scope
- 12.6.2 Historical Market Size, 2018-2025
- 12.6.3 Revenue Forecast, 2025-2035
- 12.6.4 Volume Forecast, 2025-2035
- 12.6.5 Base-Year Market Share, 2025
- 12.6.6 Segment CAGR and Growth Drivers
- 12.6.7 Subsegment Market Size and Forecast
- 12.6.7.1 Victoria
- 12.6.7.2 New South Wales
- 12.6.7.3 Queensland
- 12.6.7.4 Remaining States and Territories
- 12.6.8 Subsegment Pricing and Adoption Trends
- 12.6.9 Leading Suppliers and Competition
- 12.6.10 Regional Demand and Opportunities
- 12.7 Segment Growth Comparison
- 12.8 Segment Attractiveness and Priority Matrix
Chapter 13 Australia Cleanrooms End-Use and Application Market Outlook
- 13.1 End-Use Industry and Customer Demand Structure
- 13.2 Leading Applications and Customer Groups
- 13.3 End-Use Market Size, Share and Forecast
- 13.4 Major End-Use Industry Deep Dives
- 13.4.1 Customer Requirements and Use Cases
- 13.4.2 Demand and Replacement Cycles
- 13.4.3 Technical and Regulatory Considerations
- 13.4.4 Purchasing and Procurement Models
- 13.4.5 Leading Vendors and Distribution Channels
- 13.4.6 Forecast and Commercial Opportunities
- 13.5 Emerging Applications and Cross-Segment Demand
- 13.6 End-Use Industry Investment Priorities
Chapter 14 Australia Cleanrooms Geographic Market Outlook, 2025-2035
- 14.1 Domestic Market Distribution and Demand Clusters
- 14.2 State- or Province-Wise Market Size and Forecast, 2025-2035
- 14.3 City and Metropolitan Market Outlook
- 14.4 Industrial, Manufacturing and Commercial Clusters
- 14.5 Geographic Concentration of Key End Users
- 14.6 Local Pricing and Purchasing Differences
- 14.7 Domestic Production Facilities and Capacity Map
- 14.8 Local Infrastructure and Project Pipeline
- 14.9 State-Level Policy and Incentive Differences
- 14.10 Subnational Investment Hotspots and Opportunities
- 14.11 Distribution and Logistics Networks
- 14.12 Domestic Competitive Footprint
Chapter 15 Australia Cleanrooms Technology, Innovation and Sustainability Outlook
- 15.1 Technology Landscape and Maturity
- 15.2 Product, Process and Service Innovation
- 15.3 AI, Automation and Digital Tools in the Industry
- 15.4 Technology Adoption and Performance Benchmarking
- 15.5 Innovation Pipeline and R&D Investment
- 15.6 Patent and Intellectual Property Trends
- 15.7 Energy Efficiency and Resource Management
- 15.8 Sustainability, Recycling and Circularity
- 15.9 Technology Roadmap, 2025-2035
- 15.10 Risks of Obsolescence and Technology Substitution
Chapter 16 Australia Cleanrooms Market Key Strategic Imperatives
- 16.1 Growth and Market Entry Priorities
- 16.2 High-Return Products and Segments
- 16.3 Pricing, Profitability and Cost Optimization
- 16.4 Technology Investment and Product Differentiation
- 16.5 Supply Chain Localization and Resilience
- 16.6 Distribution and Customer Acquisition
- 16.7 Partnership, Acquisition and Capacity Strategy
- 16.8 Regional Expansion Priorities
- 16.9 Short-, Medium- and Long-Term Actions
Chapter 17 Competition Outlook
- 17.1 Industry Competition Characteristics
- 17.2 Market Structure and Concentration
- 17.3 Market Share and Competitive Positioning, 2025
- 17.4 Company-Wise Revenue and Product Benchmarking
- 17.5 Production and Service Capacity Benchmarking
- 17.6 Technology, Pricing and Differentiation
- 17.7 Regional Footprint and Distribution Strength
- 17.8 Mergers, Acquisitions and Strategic Alliances
- 17.9 New Entrants and Competitive Threats
- 17.10 Porter's Five Forces and Industry Attractiveness
- 17.11 Competitive Outlook, 2025-2035
Chapter 18 Company Profiles
- 18.1 Company Coverage and Selection Criteria
- 18.2 Ansell
- 18.2.1 Business Description
- 18.2.2 Company Ownership and Geographic Presence
- 18.2.3 Product and Service Portfolio
- 18.2.4 Manufacturing and Operating Footprint
- 18.2.5 Production Capacity and Expansion Plans
- 18.2.6 Financial Performance and Investment
- 18.2.7 Market Share and Competitive Position
- 18.2.8 Technology and Innovation Capabilities
- 18.2.9 Strategic Alliances or Partnerships
- 18.2.10 Recent Developments
- 18.2.11 Growth Strategy and Outlook
- 18.3 DuPont
- 18.4 Camfil Australia
- 18.5 STERIS
- 18.6 Trotek Controlled Environments
- 18.7 Cleanrooms Australia
- 18.8 Arden Cleanrooms
- 18.9 LAF Technologies
- 18.10 DY Constructions Australia
- 18.11 Cleanroom Plus
- 18.12 Other Relevant Market Participants
Note: Every listed company is profiled on the structure shown under the first company. The company list is preliminary and may change based on research findings, market developments, data availability and client requirements.
Chapter 19 Disclaimer
- 19.1 Research and Forecast Disclaimer
- 19.2 Data Source and Estimation Limitations
Note: The depth of individual sections depends on data availability for this market. Volume, capacity, trade and other unit-based metrics are included where applicable.

