
Australia air ambulance services grow on state contracts
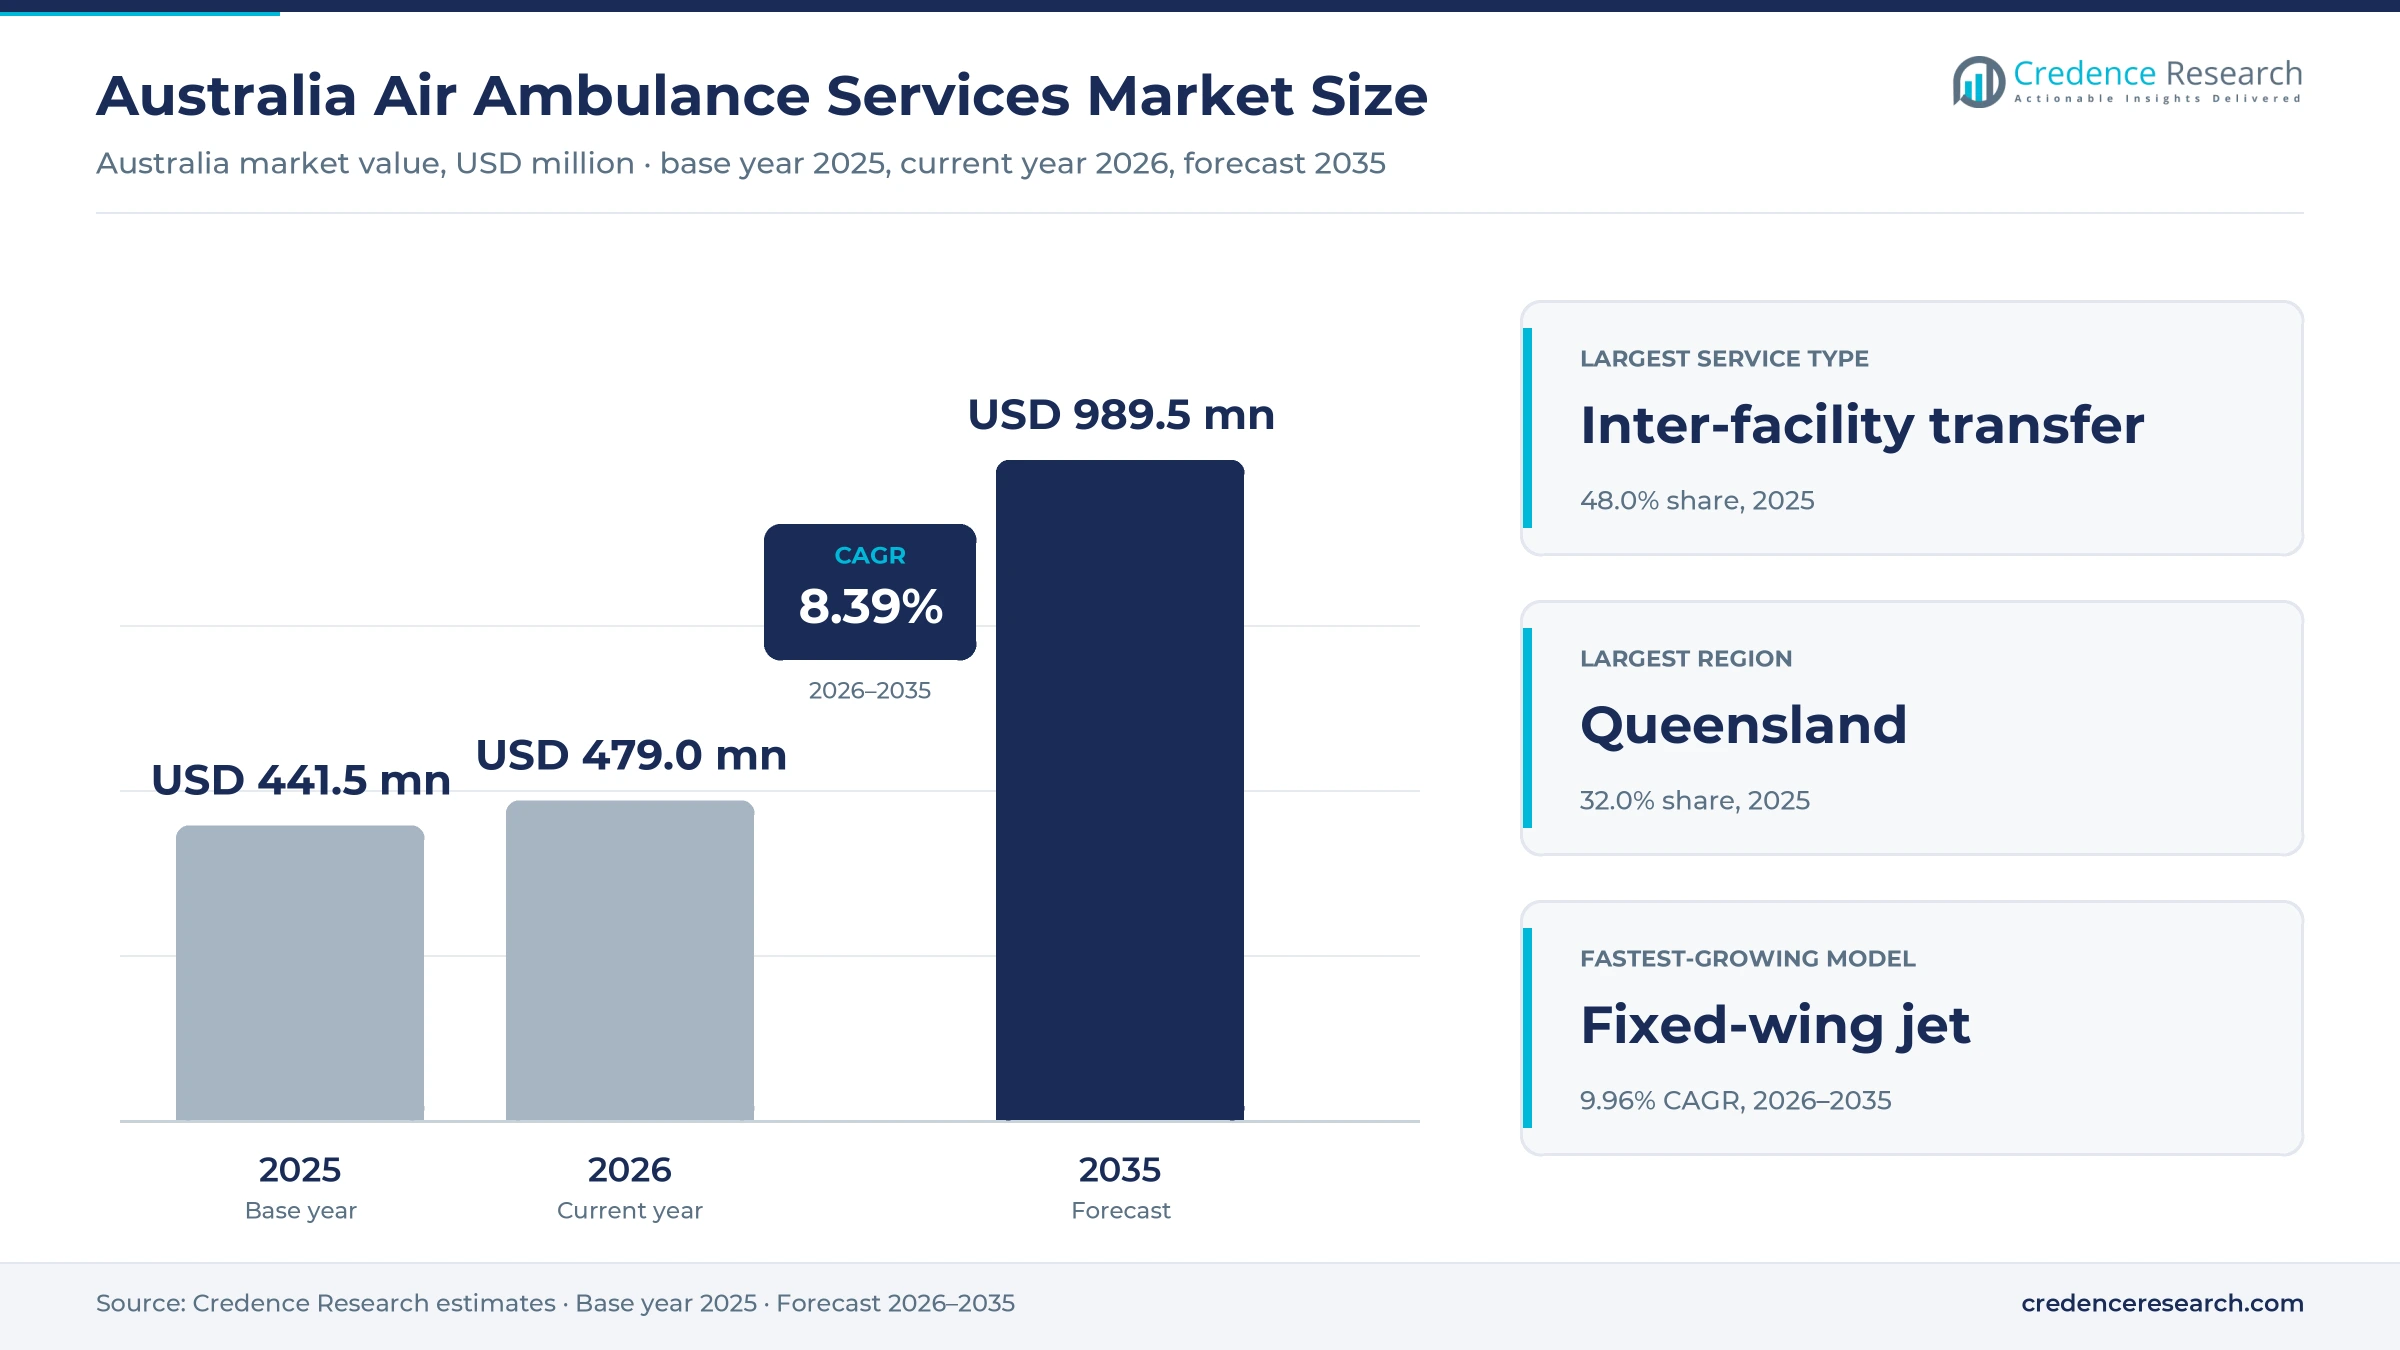
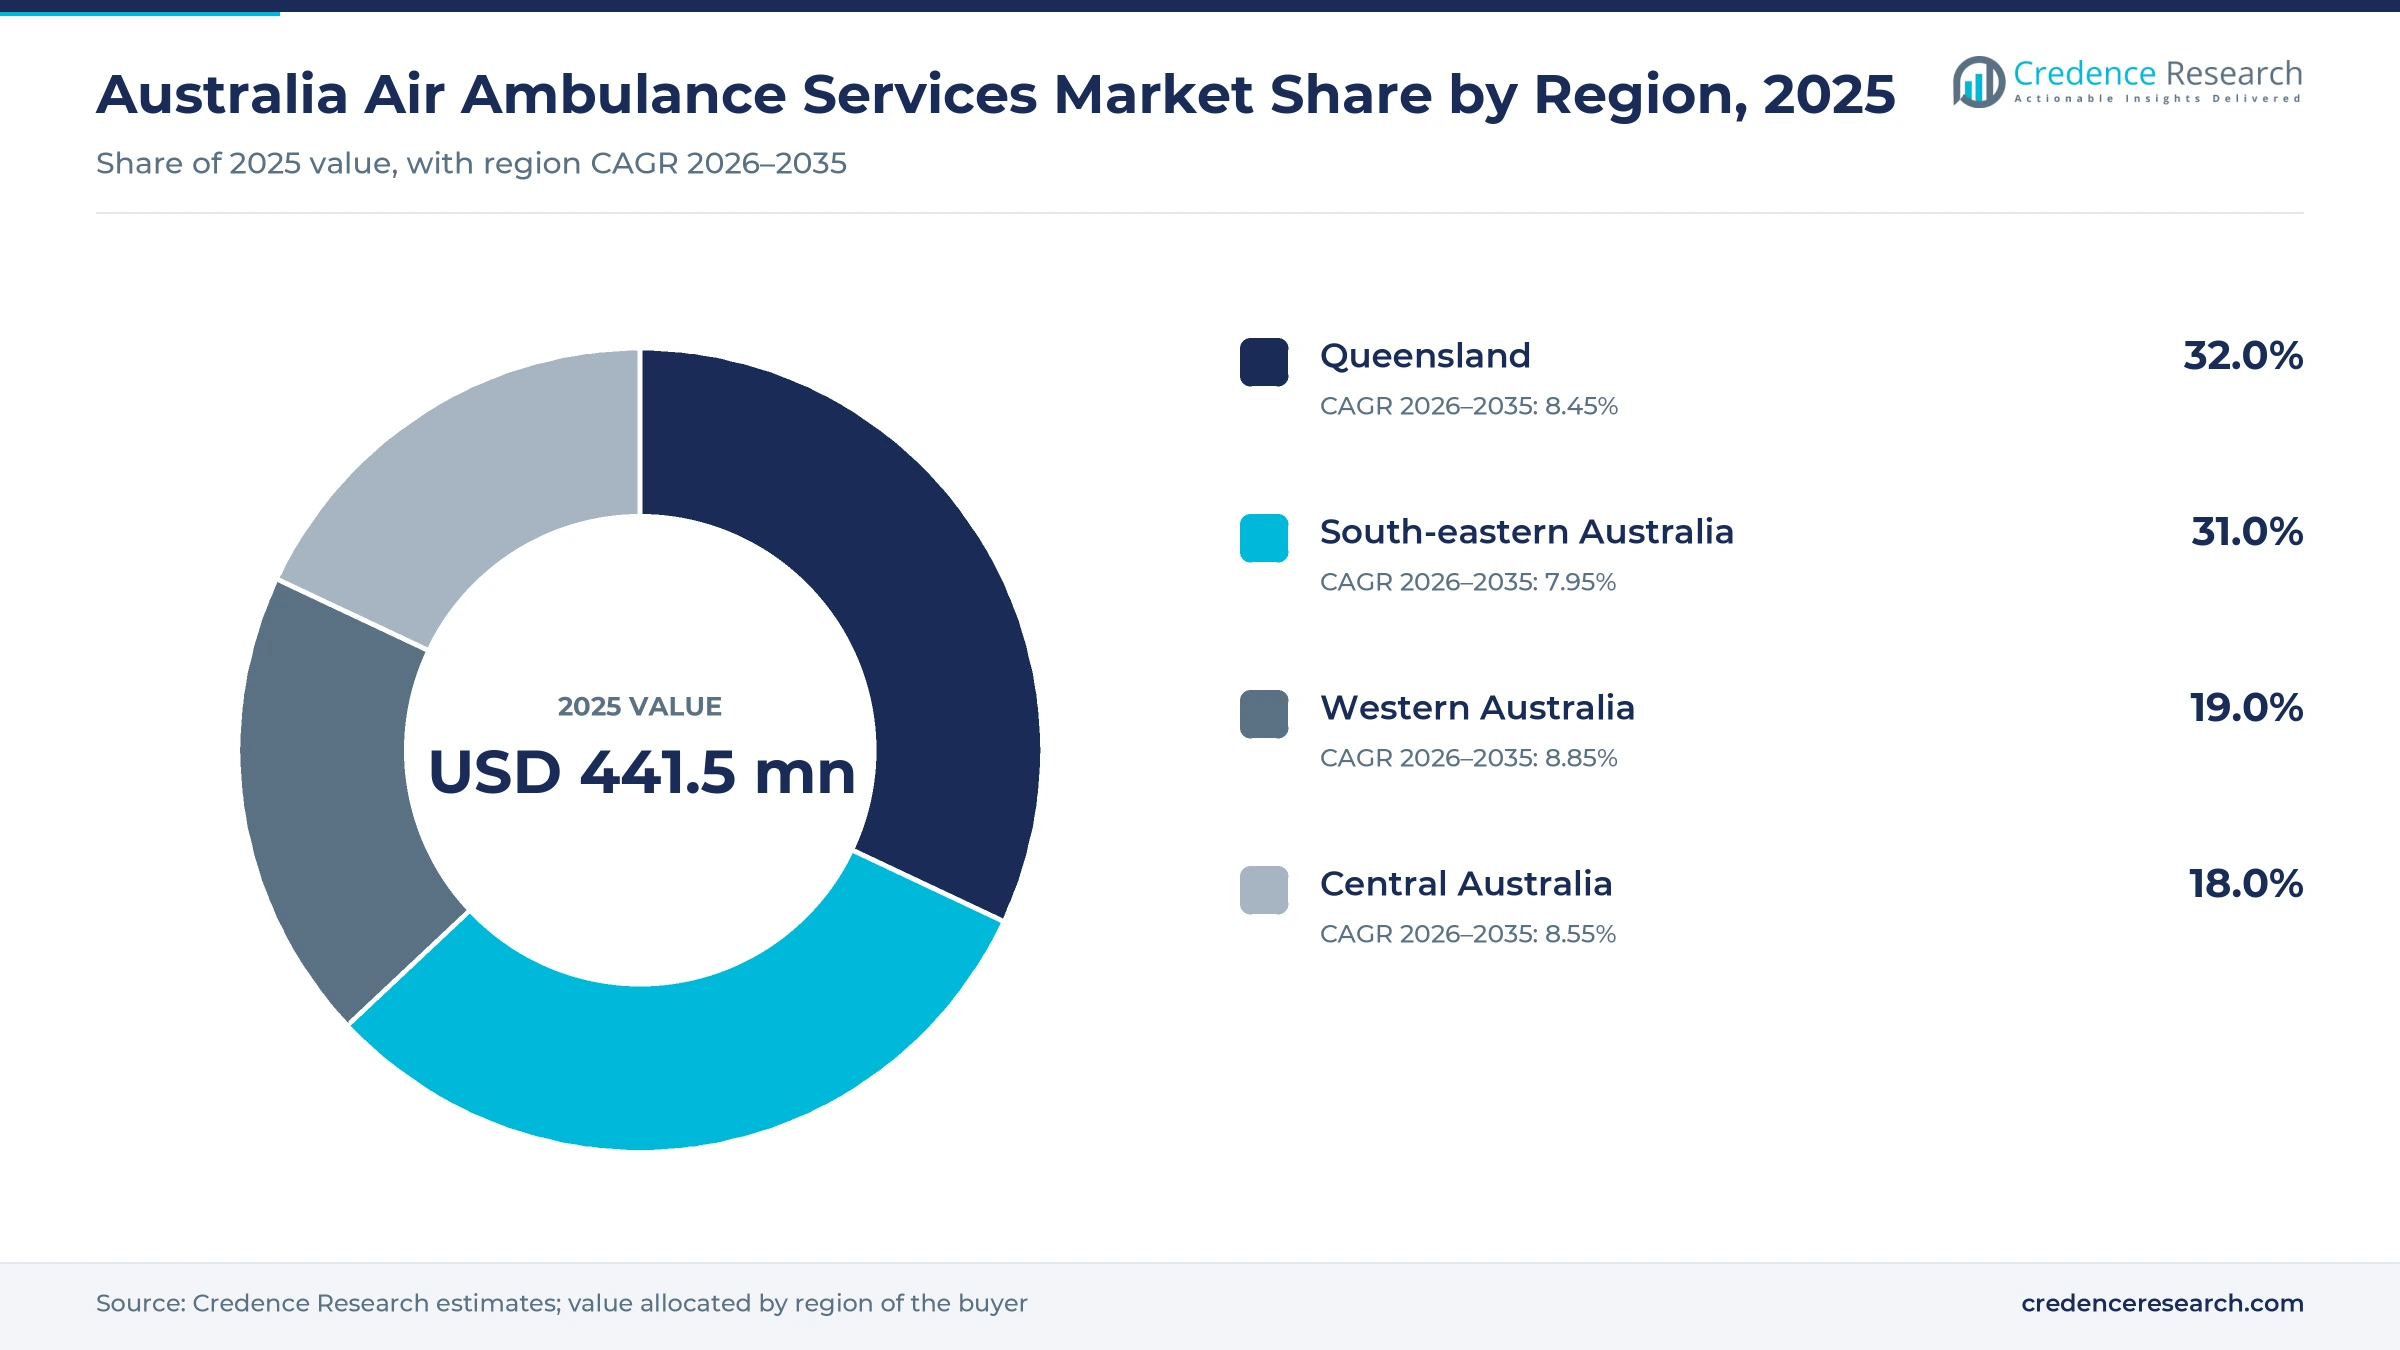
The Australia air ambulance services market was valued at USD 441.5 million in 2025 and is projected to increase from USD 479.0 million in 2026 to USD 989.5 million by 2035, registering a CAGR of 8.39% during 2026–2035. Demand comes from state health and ambulance services that fund retrieval for regional and remote patients, from mining and energy employers, and from insurers that pay for repatriation. Queensland held the largest regional share, 32.0% in 2025, while Western Australia is the fastest-growing zone at 8.85% a year after a 10-year state contract with the Royal Flying Doctor Service took effect. Fixed-wing turboprops carry most inter-hospital transfers across long distances, helicopters handle scene response and coastal rescue, and jets serve the longest routes. Operators are renewing fleets, as Queensland backed LifeFlight and Leonardo with a partnership worth A$250 million in March 2025 and StarFlight ordered three Airbus H145 helicopters for Tasmania in September 2025.
Which flights and services does the estimate count?
The estimate counts aeromedical retrieval and patient transport by helicopter, turboprop and jet within Australia, together with contracted medevac for industrial sites and insurer-funded repatriation flown by Australian operators. Services include inter-facility transfers, emergency scene response and remote primary retrieval, with clinical crews on board. Most income comes from state health and ambulance services through long contracts, supplemented by charitable income and patient or commercial fees.
Road ambulance services, search and rescue without a medical role, police aviation, aircraft sales and the primary health clinics run by aeromedical charities fall outside the estimate. The value chain runs from aircraft makers and maintenance providers through operators and retrieval coordination centers to hospitals and patients.
Australia Air Ambulance Services Market Insights
- The market grows from USD 441.5 million in 2025 to USD 989.5 million by 2035 at an 8.39% CAGR, supported by long state contracts and fleet renewal.
- Queensland held 32.0% of 2025 value, ahead of South-eastern Australia at 31.0%, on dense regional base networks and remote demand.
- Inter-facility transfer held 48.0% of 2025 value, while Fixed-wing jet grows fastest at 9.96% a year through 2035.
- The WA Country Health Service signed a 10-year RFDS contract worth more than A$800 million in July 2024, covering about 7,500 inter-hospital transfers a year.
- Toll's NSW Ambulance fleet of eight AW139 helicopters passed 40,000 flight hours and 24,000 critical care missions on Oct. 23, 2025.
Inter-hospital transfers and turboprops carry most value
Why do inter-facility transfers lead while scene response grows fastest?
Based on service type, the market is categorized into inter-facility transfer, emergency scene response, remote primary retrieval and contracted industrial medevac. In the Australia air ambulance services market, Inter-facility transfer led with a 48.0% share of 2025 value, because regional hospitals send patients to city centers every day, and RFDS Western Operations and the WA Country Health Service coordinate more than 7,500 such transfers a year. Emergency scene response grows fastest at 8.95% a year as helicopter cover widens, with Babcock's first AW139 for the Torres Strait covering 48,000 square kilometers, the Queensland government said in March 2025.
Why do turboprops lead while jets grow fastest?
Based on delivery model, the market is categorized into rotary-wing helicopter, fixed-wing turboprop and fixed-wing jet. Fixed-wing turboprop led with a 50.0% share of 2025 value, because King Air turboprops fly most long rural transfers, and the Queensland Section of the Royal Flying Doctor Service alone operates 26 of them. Fixed-wing jet grows fastest at 9.96% a year as operators add range and speed. LifeFlight's four Challenger 604 jets helped a record 8,838 people in 2025, up 4.2%, Asian Aviation reported in January 2026, while RFDS Central Operations flies a PC-24 able to carry three intensive care patients.
Why do public commissioners dominate while insurer flights grow fastest?
Based on customer type, the market is categorized into public health commissioners, industrial contract buyers and insurers and self-paying patients. Public health commissioners led with a 78.0% share of 2025 value, because state governments fund most missions through long contracts, including an extra A$334 million, 10-year Queensland commitment to the Royal Flying Doctor Service announced in June 2022. Insurers and self-paying patients grow fastest at 9.36% a year as international repatriation expands. LifeFlight's Singapore base doubled its missions to 34 in 2025, and the operator flew its first South American retrieval since 2008, Asian Aviation reported.
| Segment Group | Leading Sub-segment | Share, 2025 | Fastest-growing Sub-segment | CAGR, 2026–2035 |
|---|---|---|---|---|
| By Service Type | Inter-facility transfer | 48.0% | Emergency scene response | 8.95% |
| By Delivery Model | Fixed-wing turboprop | 50.0% | Fixed-wing jet | 9.96% |
| By Customer Type | Public health commissioners | 78.0% | Insurers and self-paying patients | 9.36% |
Request a Free Sample
Fill in your details and we'll send you a free sample report.
- Sample data tables & charts
- Research methodology
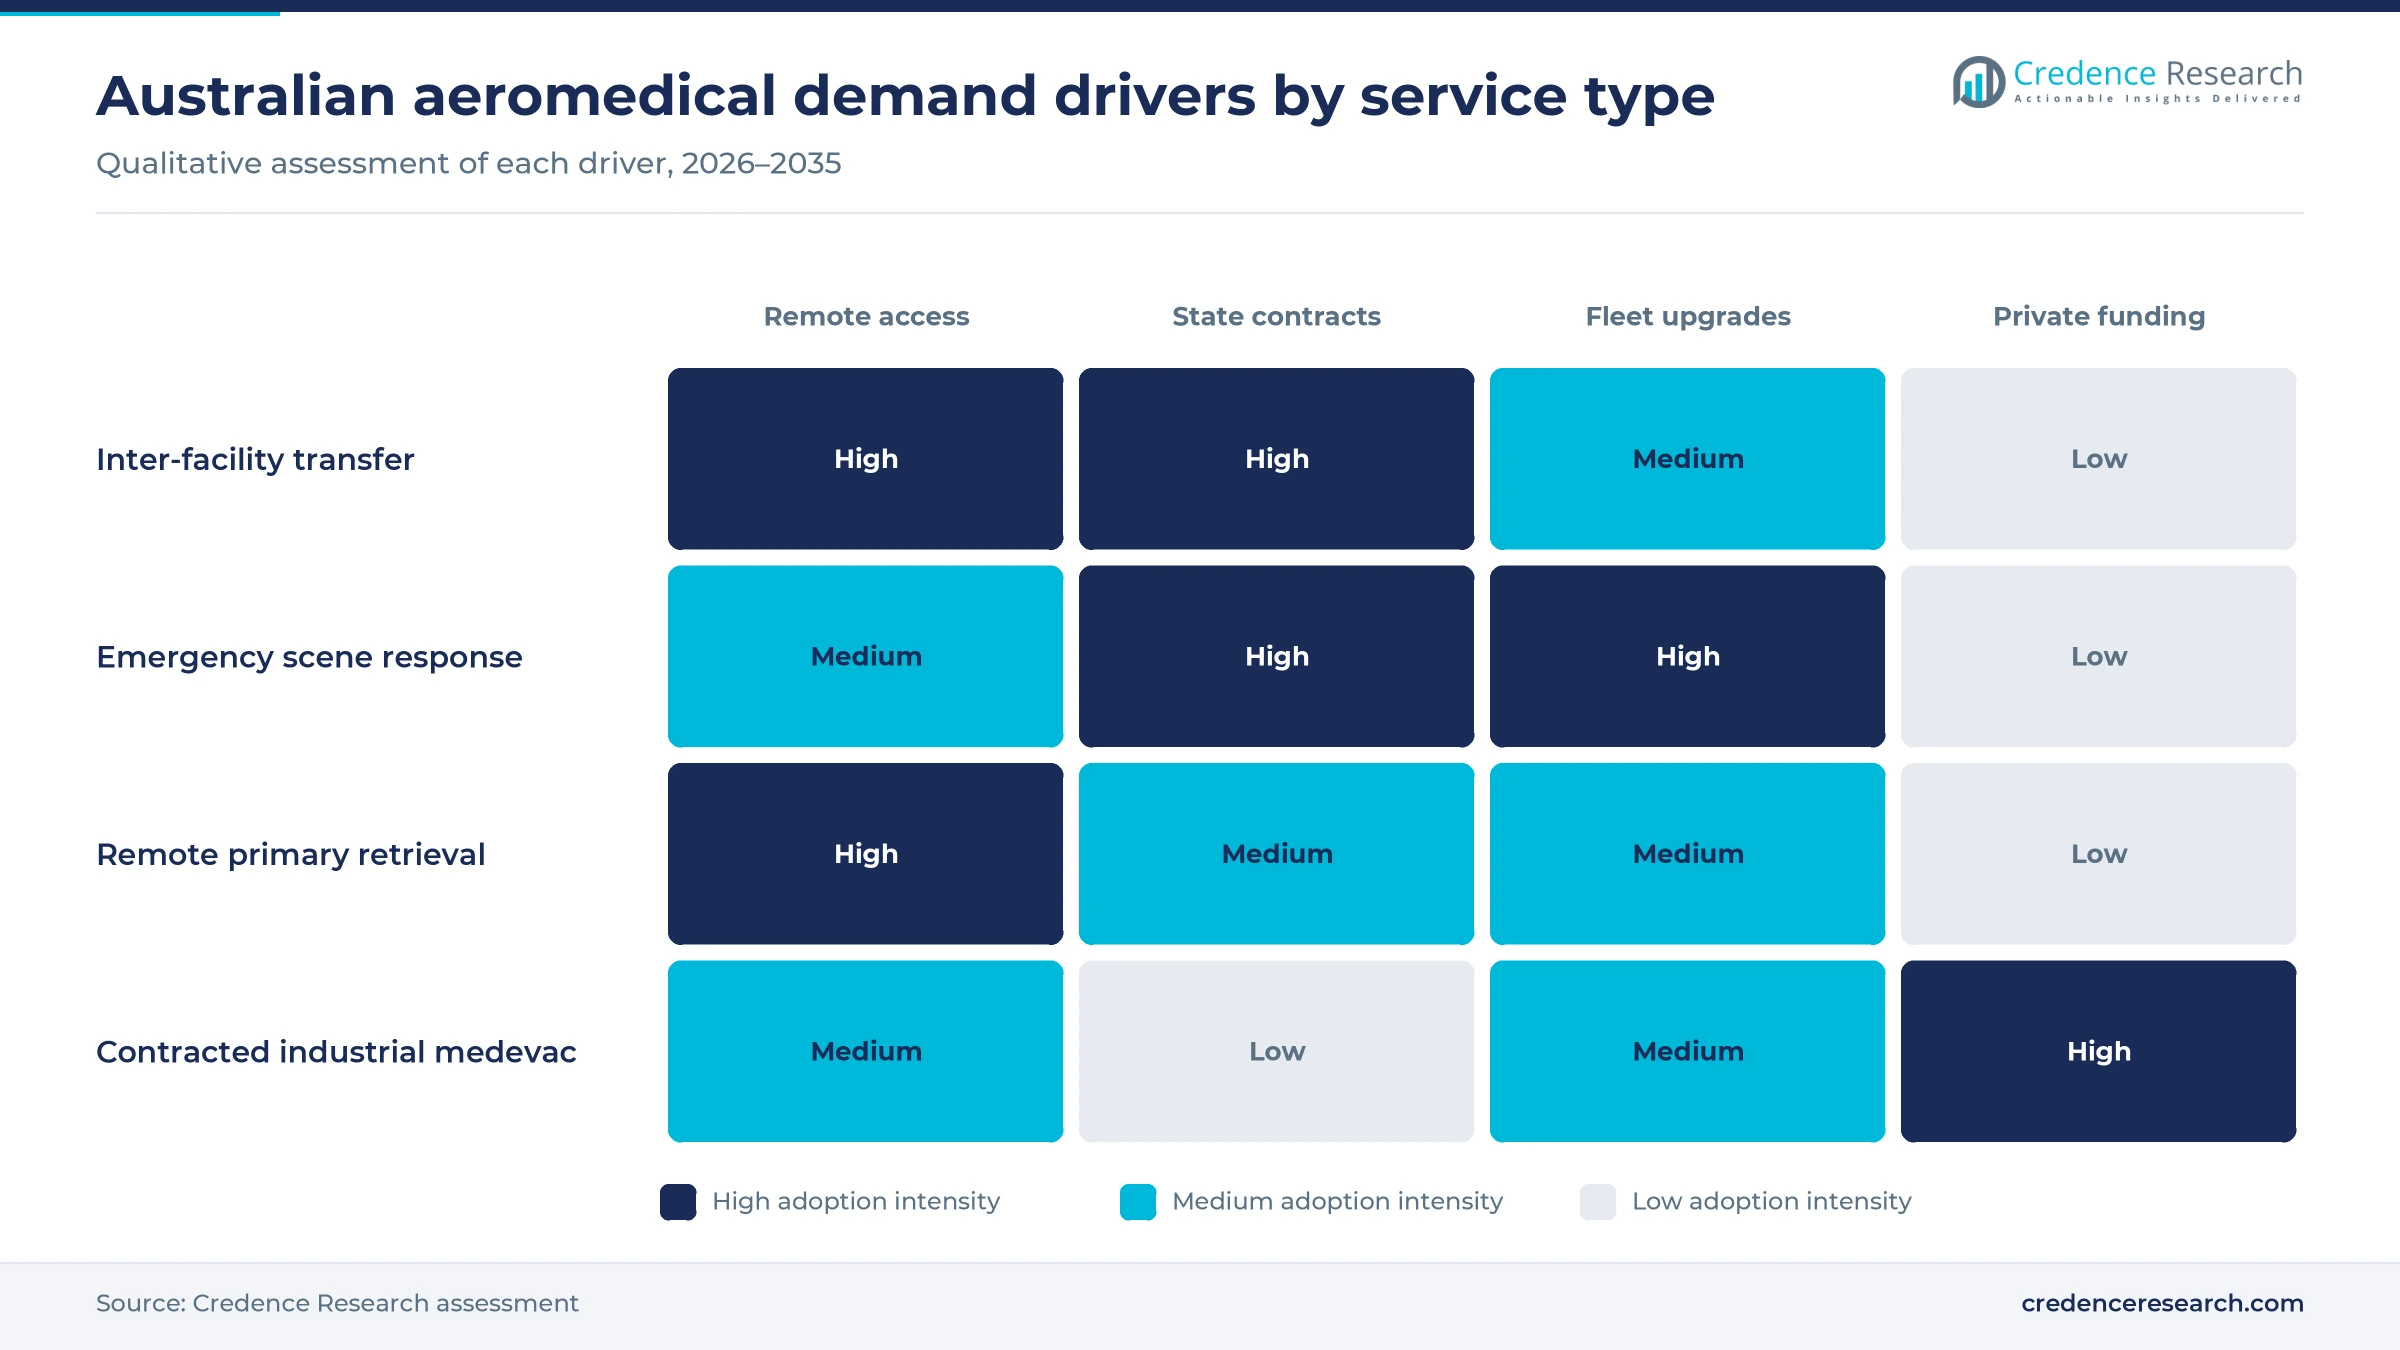
Distance, contracts and new fleets lift retrieval volumes
Persistent remote access needs keep aircraft in demand
Distance is the core driver of demand, because many Australians live far from specialist hospitals. The World Bank puts Australia's rural population at about 12.3% of residents in 2025, while the Australian Institute of Health and Welfare counts about 7 million people, or 28%, in rural and remote areas. Risk is also higher there, since land transport death rates were nearly three times the national rate in remote areas and nearly four times in very remote areas over 2017 to 2021. CareFlight treated more than 7,000 patients in the Northern Territory in the year before April 2025, and nine in 10 came from remote Aboriginal or Torres Strait Islander communities, the federal government said. These needs keep air ambulance services in steady use across every state and territory.
Contract-backed coverage expansion by state governments
Long state contracts give operators the certainty to add bases, crews and aircraft. The WA Country Health Service signed a 10-year contract worth more than A$800 million with the Royal Flying Doctor Service on July 19, 2024, adding more than 21 frontline staff and capacity at Kalgoorlie and Port Hedland. New South Wales added A$15 million for the RFDS in its 2025-26 budget, and committed a further A$15 million in the 2026-27 budget, ch-aviation reported in September 2026. Ambulance Victoria extended its Babcock helicopter contract by five years to Dec. 31, 2030. As a result, Public health commissioners held 78.0% of 2025 value, and Western Australia becomes the fastest-growing zone in the country.
Fleet and specialist retrieval capability upgrades
New aircraft and training facilities raise what crews can do on each mission, which lifts the value of air ambulance services. Queensland announced a partnership worth A$250 million between LifeFlight and Leonardo Helicopters on March 28, 2025, bringing new aircraft, an accredited simulator training center and a 5,000-square-meter maintenance center at Archerfield. StarFlight ordered three Airbus H145 helicopters for Ambulance Tasmania and Tasmania Police in September 2025, with the fleet expected to fly about 1,500 hours a year over the next decade, Vertical Mag reported. Babcock's new AW139 for far northern Queensland brought greater range and search and rescue capability. Emergency scene response therefore grows at 8.95% a year, the fastest of the four service types.
Rising patient volumes at regional retrieval bases
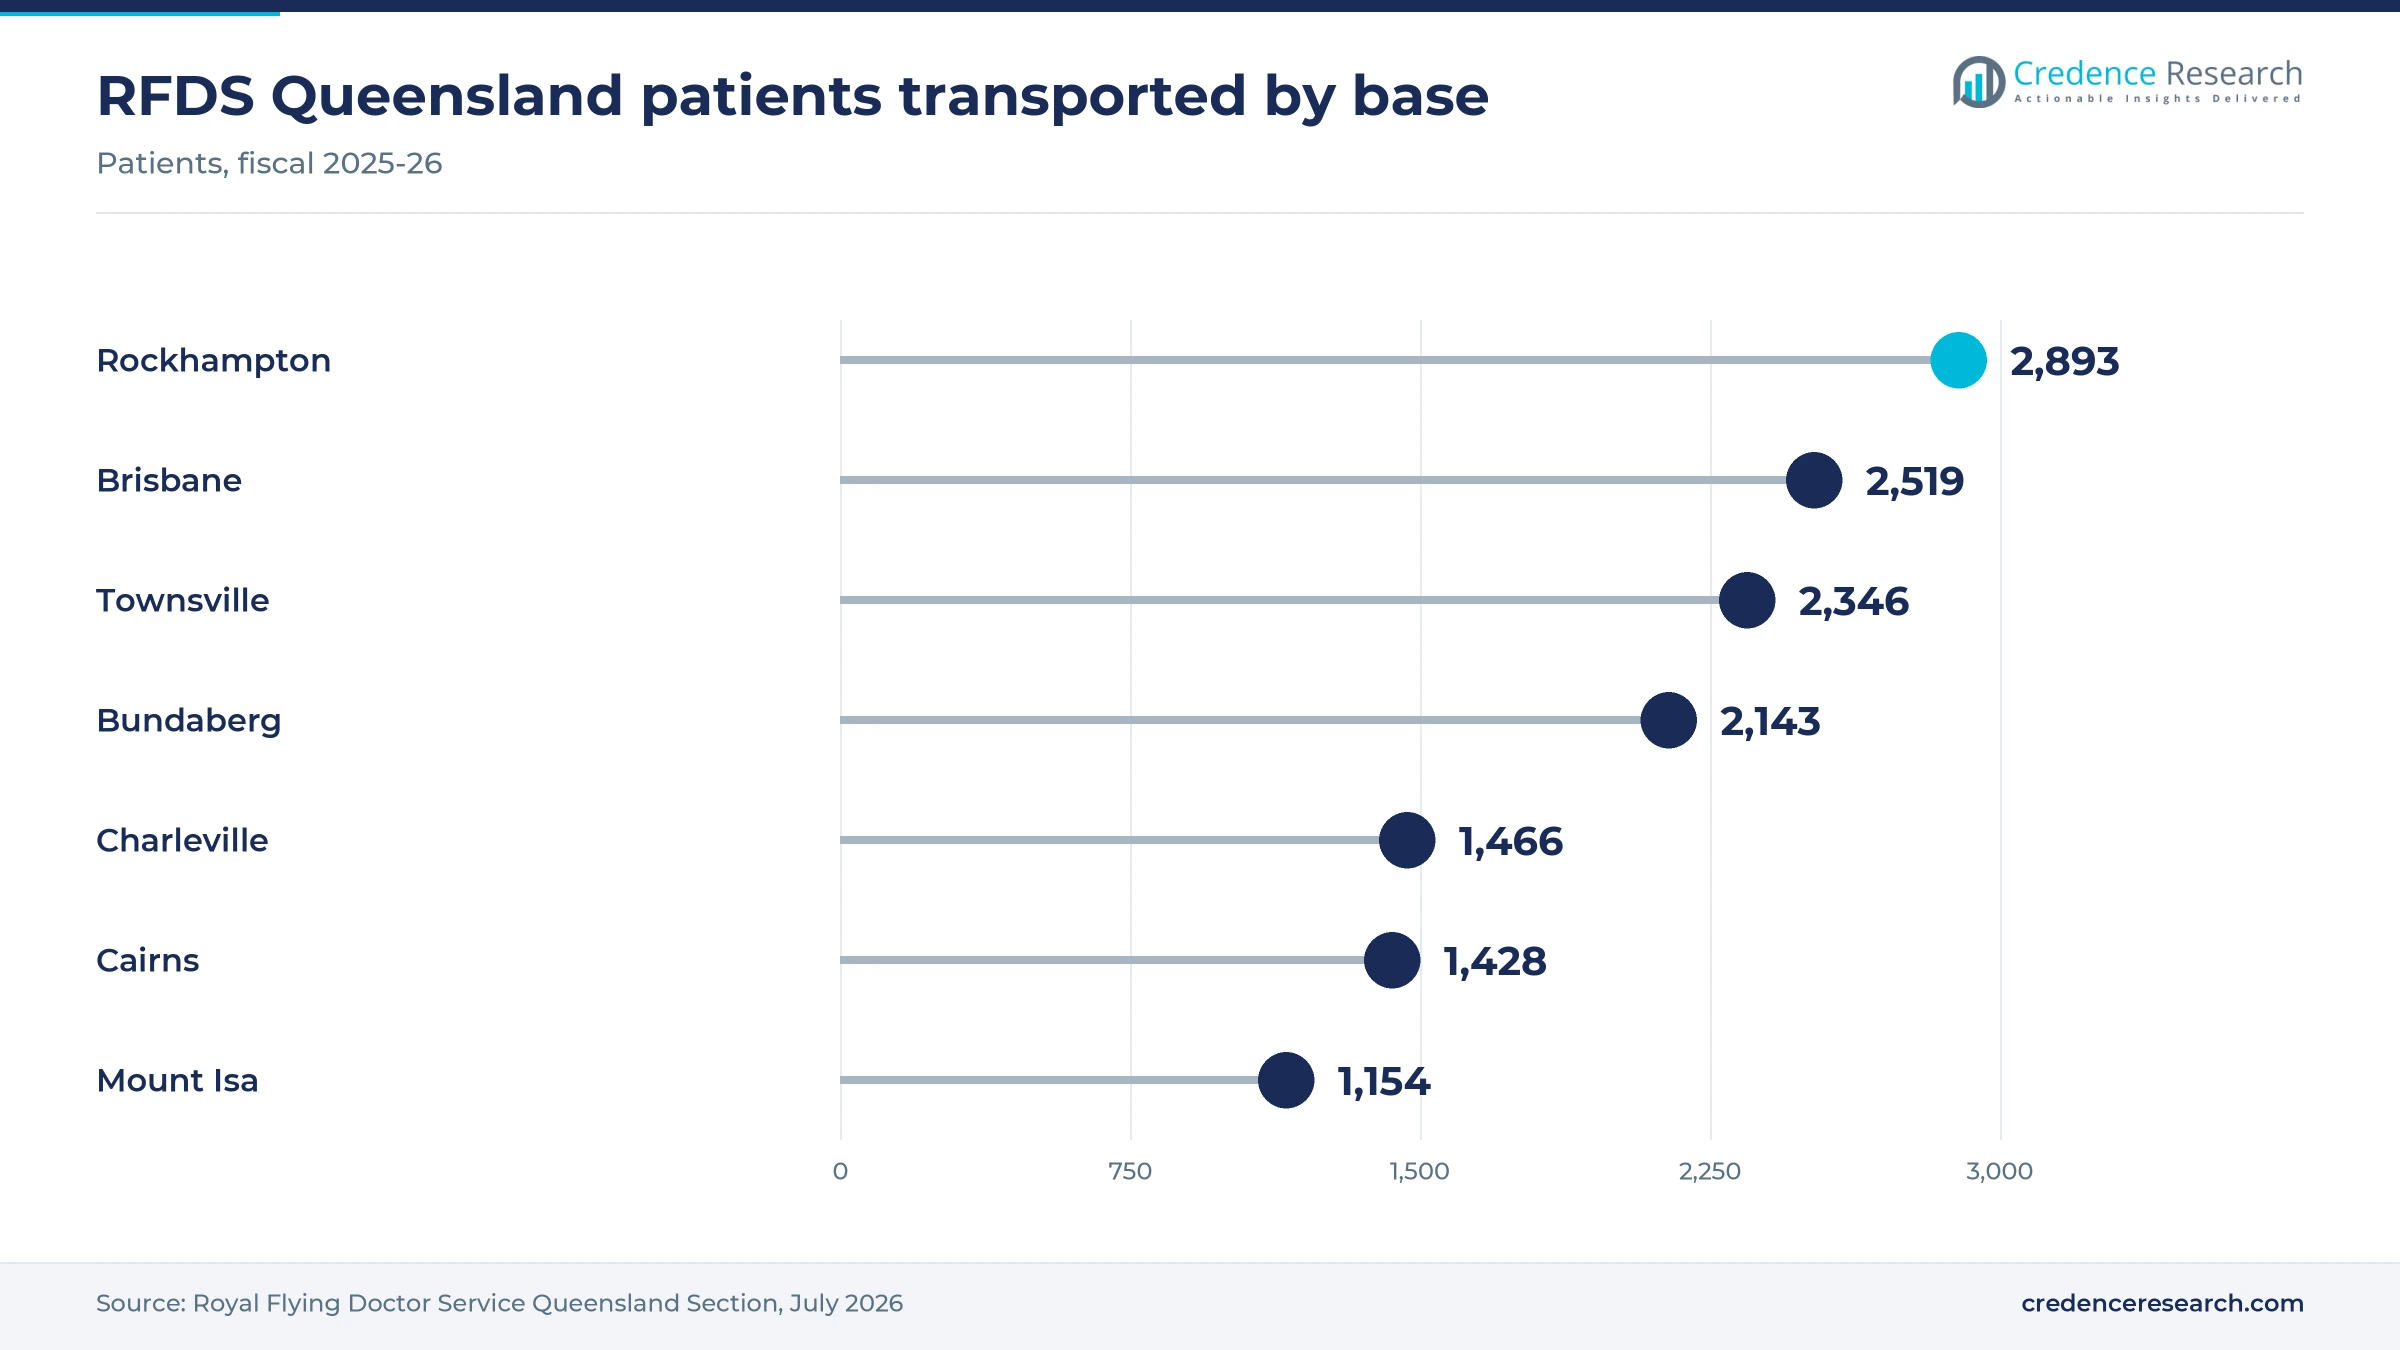
Patient numbers at regional bases are rising, which turns into more flying hours under existing contracts. The Royal Flying Doctor Service Queensland Section transported 13,949 patients in fiscal 2025-26, 947 more than a year earlier, a rise of 7.28%, and its aircraft flew almost 9 million kilometers. Rockhampton led with 2,893 patients, ahead of Brisbane at 2,519 and Townsville at 2,346. In New South Wales, the Toll-operated helicopter service passed 24,000 critical care missions and 40,000 flight hours on Oct. 23, 2025, HeliOps reported. Busier bases support Queensland, the largest regional zone, where retrieval demand is spread across seven RFDS bases from Brisbane to Mount Isa.
Jets, consolidation and new bases reshape retrieval
Shift to jets for long-range and interstate retrieval
Operators are shifting long-range work to jets, which cut flying time on interstate and remote missions. RFDS Western Operations put its second Pilatus PC-24 into service in March 2019, with jets based in Broome and Perth, and Rio Tinto donated A$15 million in February 2020 for a third jet, the RFDS said. In the Northern Territory, federal funding of A$20 million committed in 2022 paid for a second CareFlight rescue helicopter and an aeromedical jet. Jet demand keeps rising, as LifeFlight flew 432 missions with its four jets in 2025, up 2%. As a result, Fixed-wing jet grows at 9.96% a year, the fastest of the three delivery models.
Rise of consolidation among contract operators
Contract operators are consolidating, which concentrates state work in fewer, larger hands. Toll Holdings agreed to buy Pel-Air, the air ambulance subsidiary of the administered airline Rex, for about A$47.1 million in October 2024, ch-aviation reported. Pel-Air holds ambulance contracts with Ambulance Victoria and NSW Ambulance, according to the federal infrastructure department. Its Victorian fixed-wing contract, worth more than A$300 million, began a 12-year operational phase in January 2024 with four King Air aircraft, AviTrader reported. Toll already runs eight AW139 helicopters from four New South Wales bases. Fewer, larger contractors now bid for most state helicopter and fixed-wing tenders across the country.
Opportunity in northern territory fixed-wing capacity
The Northern Territory offers room for added fixed-wing capacity because demand has outgrown the existing fleet. The federal government pledged A$10.1 million on April 4, 2025 for CareFlight to buy a King Air B250 based in Darwin, expected to add about 700 hospital transports a year. Patient numbers treated by CareFlight in the territory rose by about one-third over five years, the same release said. Public hospital funding in the territory was set to rise 30% to A$560 million the following year, which supports more transfers into Darwin. Central Australia, growing at 8.55% a year, gives operators a clear case for new aircraft.
Opportunity in insurer-funded international repatriation
International and insurer-funded repatriation opens a higher-value line of work for Australian jet operators. LifeFlight's Singapore base doubled its missions to 34 in 2025, and its Townsville jet base carried 598 patients, up 22.8%, Asian Aviation reported in January 2026. The operator also flew a seven-day mission to Ushuaia covering 17,040 nautical miles and its first South American retrieval since 2008. These flights are paid by insurers and patients rather than state budgets, which makes emergency medical billing capability part of the offer. Insurers and self-paying patients, growing at 9.36% a year, therefore offer jet operators a way to raise utilization between contract missions. Townsville alone flew more than 1,100 jet hours in 2025, showing how much demand one regional base can carry.
Operator failure, aircraft costs and pilots limit growth
Operator failure exposed contract continuity risk
The collapse of Rex showed that a state air ambulance contract can depend on a fragile parent company. Rex's administrators sold Pel-Air, which flies for Ambulance Victoria and NSW Ambulance, to an entity within Toll Aviation in October 2024 to repay secured debt, according to the federal infrastructure department. Health services had to monitor a sale process they did not control. Contracting agencies can reduce this risk with step-in rights, aircraft ownership clauses and closer financial monitoring of contractors.
High aircraft costs strain charity operators
New aircraft are expensive, which strains charities that rely on donations and government grants. CareFlight needed federal funding of A$10.1 million for a single King Air B250, while RFDS Western Operations relied on Rio Tinto's A$15 million donation to buy one PC-24 jet. Fleet renewal therefore depends on fundraising and election commitments rather than on contract income alone. Operators that cannot secure such funding risk running older aircraft with higher maintenance needs and lower availability.
Pilot and crew shortages limit fleet availability
Crew supply limits how many aircraft can fly at once, even when the fleet is in place. When South Australia extended its State Rescue Helicopter Service with Babcock in October 2023 in a deal worth A$150 million, the fleet grew to four aircraft, but only three could fly at once after four new pilots were hired, Australian Aviation reported. Similar constraints apply to retrieval doctors and flight nurses in remote bases. Operators are therefore expanding training, as the simulator-equipped LifeFlight Training Academy shows.
Long distances and remote trauma raise mission costs
Long distances raise the cost of each mission and make demand hard to plan. RFDS Queensland Section aircraft flew almost 9 million kilometers in fiscal 2025-26 while transporting 13,949 patients from seven bases across the state. Road deaths are also far higher in remote areas, according to the Australian Institute of Health and Welfare, so trauma flights to hospital emergency departments are frequent and urgent. Contract prices that do not reflect fuel, crew hours and aircraft wear can therefore squeeze operator margins.
Queensland leads while Western Australia grows fastest
| Region | Value, 2025 (USD million) | Share, 2025 | CAGR, 2026–2035 |
|---|---|---|---|
| Queensland | 141.3 | 32.0% | 8.45% |
| South-eastern Australia | 136.9 | 31.0% | 7.95% |
| Western Australia | 83.9 | 19.0% | 8.85% |
| Central Australia | 79.5 | 18.0% | 8.55% |
Queensland leads on a dense regional base network
Queensland held a 32.0% regional share of 2025 value and grows at 8.45% a year. The state has the densest base network in the country, with the RFDS Queensland Section running 26 King Air aircraft and transporting 1,428 patients from Cairns and 1,154 from Mount Isa in fiscal 2025-26. LifeFlight adds helicopters and a Townsville jet base, while Babcock flies a new AW139 to Torres Strait communities. The A$250 million LifeFlight and Leonardo partnership keeps training and maintenance in the state.
South-eastern Australia combines helicopter fleets and fixed-wing contracts
South-eastern Australia held a 31.0% regional share of 2025 value and grows at 7.95% a year. Toll runs eight AW139 helicopters from Sydney, Orange, Wollongong and Canberra for NSW Ambulance, while Babcock flies five AW139s plus a backup for Ambulance Victoria and responded to 2,197 incidents in the year before March 2024. Pel-Air provides four King Air aircraft for Victorian fixed-wing work. Tasmania is adding three Airbus H145 helicopters, which StarFlight ordered to serve Ambulance Tasmania and Tasmania Police.
Western Australia grows fastest under a 10-year RFDS contract
Western Australia held a 19.0% regional share of 2025 value and grows at 8.85% a year, the fastest of the four zones. The 10-year contract between the WA Country Health Service and the Royal Flying Doctor Service, worth more than A$800 million, adds capacity at Kalgoorlie and Port Hedland. RFDS Western Operations also flies PC-24 jets from Broome and Perth, which cuts flying time across the largest state. Mining employers support the fleet as well, as the Rio Tinto jet donation shows.
Central Australia relies on long-range fixed-wing retrieval
Central Australia held an 18.0% regional share of 2025 value and grows at 8.55% a year. CareFlight treated more than 7,000 patients in the Northern Territory in the year before April 2025, and RFDS Central Operations flies a PC-24 with intensive care for three patients and unpaved airfield capability. In South Australia, the state rescue helicopter contract with Babcock added a Bell 412 configured for SA Ambulance Service, due in December 2024.
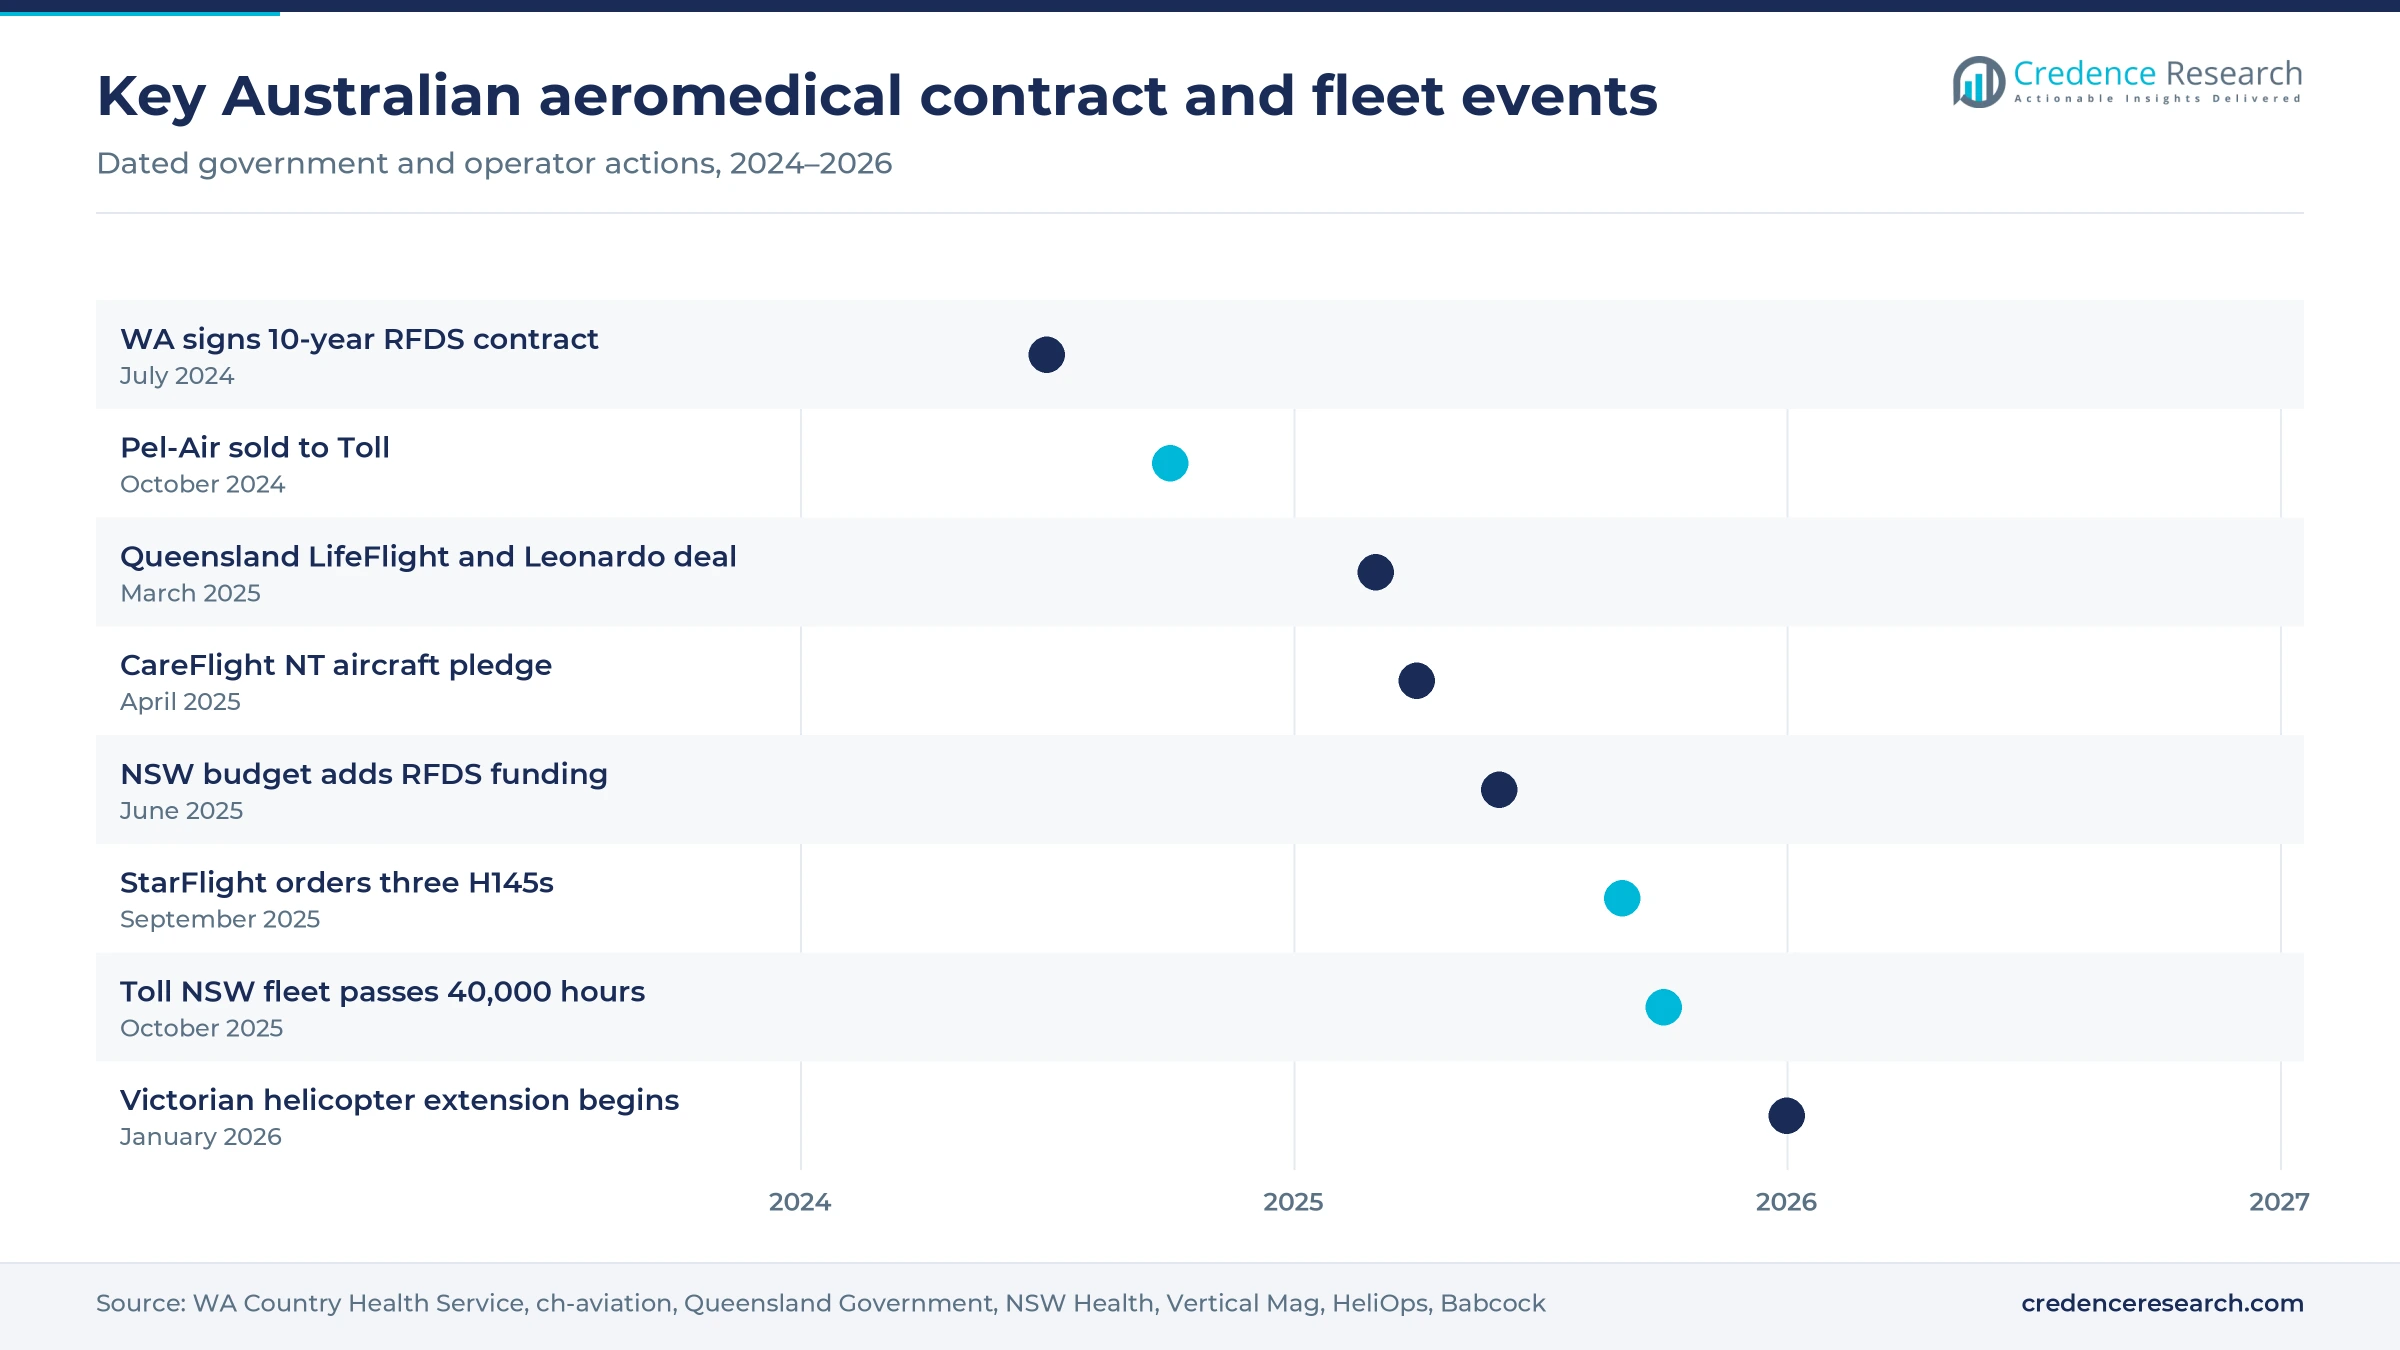
Contracts, fleet orders and funding marked 2024 to 2026
| Development | Status and market relevance |
|---|---|
| In July 2024, the WA Country Health Service signed a 10-year contract with the Royal Flying Doctor Service worth more than A$800 million. | In force; adds capacity at Kalgoorlie and Port Hedland |
| In October 2024, Rex administrators agreed to sell air ambulance operator Pel-Air to Toll for about A$47.1 million. | Completed; Pel-Air holds Victorian and NSW contracts |
| In March 2025, Queensland announced a partnership worth A$250 million between LifeFlight and Leonardo Helicopters. | Underway; new aircraft, simulators and maintenance |
| In September 2025, StarFlight ordered three Airbus H145 helicopters for Ambulance Tasmania and Tasmania Police. | On order; about 1,500 flight hours a year planned |
| In October 2025, the Toll-operated NSW Ambulance helicopter fleet passed 40,000 flight hours and 24,000 missions. | Operating; eight AW139s at four bases |
Jets, simulators and local maintenance raise capability
- Purpose-built aeromedical jets such as the RFDS PC-24 carry three intensive care patients with an electric stretcher loader, an example of the aeromedical equipment now fitted in local fleets, and can land on unpaved strips.
- High-level simulators at the LifeFlight Training Academy, now an accredited Leonardo training center, let helicopter crews train in Queensland.
- Local heavy maintenance at the LifeFlight center at Archerfield, an authorized Leonardo service center, lets the operator maintain and repair its helicopters in Queensland.
- Airbus H145 helicopters ordered for Tasmania will serve both Ambulance Tasmania and Tasmania Police from one shared fleet.
- Long-range AW139 helicopters such as Babcock's aircraft for the Torres Strait add range, speed and search and rescue capability.
Need a Custom Version of This Report?
Tailor the scope, geography, or segments to your exact requirements.
- Custom geography or segment scope
- Direct access to our analyst team
Charities and contractors compete for state tenders
Competition pits charities that run integrated retrieval networks against commercial contractors that win state aviation tenders. The Royal Flying Doctor Service operates through separate sections, with RFDS Queensland Section, RFDS Western Operations and RFDS Central Operations each holding state contracts and fleets that include King Air turboprops and PC-24 jets. LifeFlight Australia and CareFlight Limited fly both helicopters and jets, and both rely on government agreements and grants. Commercial operators compete for the helicopter and fixed-wing contracts that states tender, with Toll Aviation in New South Wales and Victoria, Babcock Australasia in Victoria, South Australia and far northern Queensland, and StarFlight Australia in Tasmania. Rivalry centers on response times, clinical capability, aircraft availability and price at contract renewal. Long contract terms limit how often new entrants can bid.
Companies profiled and their roles in this market
| Company | Type | Role in the market |
|---|---|---|
| RFDS Queensland Section | Charity operator | 26 King Air aircraft; 13,949 patients transported in fiscal 2025-26 |
| RFDS Western Operations | Charity operator | 10-year WA Country Health Service contract signed July 2024; PC-24 jets in Broome and Perth |
| RFDS Central Operations | Charity operator | South Australia and Northern Territory; PC-24 jet with intensive care for three patients |
| LifeFlight Australia | Charity operator | A$250 million Queensland partnership with Leonardo, March 2025; four Challenger 604 jets |
| CareFlight Limited | Charity operator | Top End retrieval in the Northern Territory; A$10.1 million King Air B250 pledged April 2025 |
| Toll Aviation | Contractor | Eight AW139s for NSW Ambulance; bought Pel-Air in October 2024 |
| Babcock Australasia | Contractor | Ambulance Victoria helicopters to 2030; South Australia and Torres Strait helicopters |
| StarFlight Australia | Contractor | Three Airbus H145s ordered September 2025 for Ambulance Tasmania |
State contracts will set the pace through 2035
Credence Research's view is that state contracts will set the pace of growth to 2035, with fleet renewal lifting the value of each mission. The Western Australian contract of more than A$800 million and the Queensland partnership of A$250 million show that governments are committing for a decade at a time. The main risks are contractor failure, as the sale of Pel-Air showed, and a shortage of pilots and retrieval clinicians. Operators best placed are those with jets, local maintenance and their own training capacity, because those strengths decide state tenders on response time and availability.
How the retrieval estimates were built
The report uses 2025 as the base year, 2026 as the first forecast year and 2035 as the final year. Market values come from the Credence Research model, and segment and regional splits are Credence Research estimates. As a cross-check, operator annual reports and published state contract values were combined, with judgment-based adjustments to remove ground and clinic activity. Sources are state government releases, Royal Flying Doctor Service and operator announcements, World Bank and Australian Institute of Health and Welfare statistics, and aviation trade press, all opened during this update. No interviews or surveys were used to build these estimates.
Jets and scene response gain share through 2035
Through 2035, the market should grow quickly as states renew and enlarge retrieval contracts and operators add jets and helicopters. Fixed-wing jet and Emergency scene response gain the most share, helped by new aircraft in Queensland, Tasmania and the Northern Territory. Insurer-funded repatriation adds a smaller but faster-growing stream for jet operators. The Australia air ambulance services market reaches USD 989.5 million by 2035, with Western Australia gaining share under its 10-year contract and Queensland remaining the largest zone.
Frequently Asked Questions
How big is the Australia air ambulance services market?
What does the market include?
Which service type leads the market?
Which delivery model grows fastest?
Which region holds the largest share?
How are state governments funding air ambulance services?
Who are the main companies in the market?
What is the biggest challenge for the market?
Table of Content
Chapter 1 Market Segmentation
- 1.1 Segmentation Framework
- 1.1.1 Product and Service Classification
- 1.1.2 Application and End-Use Classification
- 1.1.3 Technology and Solution Classification
- 1.1.4 Customer and Distribution Channel Classification
- 1.1.5 Geographic Segmentation
- 1.1.6 Market Segment Definitions and Boundaries
- 1.2 By Service Type
- 1.2.1 Inter-facility transfer
- 1.2.2 Emergency scene response
- 1.2.3 Remote primary retrieval
- 1.2.4 Contracted industrial medevac
- 1.3 By Delivery Model
- 1.3.1 Fixed-wing turboprop
- 1.3.2 Rotary-wing helicopter
- 1.3.3 Fixed-wing jet
- 1.4 By Customer Type
- 1.4.1 Public health commissioners
- 1.4.2 Insurers and self-paying patients
- 1.4.3 Industrial contract buyers
Chapter 2 Introduction
- 2.1 Report Objectives and Scope
- 2.2 Product Definition and Industry Terminology
- 2.3 Market Inclusions and Exclusions
- 2.4 Research Process
- 2.4.1 Primary Research and Expert Interviews
- 2.4.2 Secondary Research and Source Review
- 2.4.3 Top-Down and Bottom-Up Estimation
- 2.4.4 Data Triangulation and Verification
- 2.5 Market Size Measurement Basis
- 2.5.1 2025: USD 441.5 million → 2035: USD 989.5 million
- 2.6 Historical and Forecast Reference Periods
- 2.6.1 Historical Period: 2018-2025
- 2.6.2 Base Year: 2025
- 2.6.3 Forecast Period: 2025-2035
- 2.7 Research Assumptions and Limitations
Chapter 3 Executive Summary
- 3.1 Market Snapshot and Key Findings
- 3.2 Base-Year Market Size, 2025
- 3.3 Forecast Market Size, 2035
- 3.4 Revenue and Volume Growth Outlook
- 3.5 Key Demand and Supply Indicators
- 3.6 Leading Market Segments
- 3.7 Fastest-Growing Market Opportunities
- 3.8 Regional Performance Highlights
- 3.9 Technology and Industry Transformation
- 3.10 Competitive Landscape Summary
- 3.11 Analyst View and Strategic Implications
Chapter 4 Australia Air Ambulance Services Market Trends and Developments
- 4.1 Historical Industry Development, 2018-2025
- 4.2 Recent Market Trends and Developments
- 4.3 Demand and Customer Behavior Trends
- 4.4 Technology and Product Innovation
- 4.5 Artificial Intelligence, Automation and Digitalization
- 4.6 Local Manufacturing and Supply Chain Realignment
- 4.7 Industry Partnerships, Mergers and Acquisitions
- 4.8 Sustainability and Circular Economy Developments
- 4.9 Government and Private Sector Investment Trends
- 4.10 Emerging Business Models and Commercialization
- 4.11 Industry Developments and Announcements
Chapter 5 Australia Air Ambulance Services Market Supply and Demand Analysis
- 5.1 Demand Trend and Consumption Analysis, 2018-2025
- 5.2 Demand Forecast, 2025-2035
- 5.3 Supply Chain Structure and Procurement Trends
- 5.4 Supply-Demand Gap and Bottlenecks
- 5.5 Import Dependence and Sourcing Structure
- 5.6 Regional Supply and Demand Concentration
Chapter 6 Australia Air Ambulance Services Market Pricing Analysis
- 6.1 Pricing Structure and Measurement
- 6.2 Historical Pricing Trends, 2018-2025
- 6.3 Pricing Outlook, 2025-2035
- 6.4 Pricing by Product and Market Segment
- 6.5 Geographic Pricing Differences
- 6.6 Key Input, Energy, Labor and Logistics Costs
- 6.7 Contract Pricing and Purchasing Models
- 6.8 Pricing Sensitivity and Competitive Positioning
- 6.9 Price, Margin and Profitability Implications
Chapter 7 Australia Air Ambulance Services Market Dynamics
- 7.1 Market Growth Drivers
- 7.1.1 Demand-Side Drivers
- 7.1.2 Technology and Innovation Drivers
- 7.1.3 Infrastructure and Investment Drivers
- 7.1.4 Regulatory and Policy Drivers
- 7.2 Market Restraints
- 7.2.1 Cost and Affordability Constraints
- 7.2.2 Technology and Adoption Barriers
- 7.2.3 Supply Chain and Operational Constraints
- 7.3 Market Challenges
- 7.3.1 Competitive Pressure and Margin Erosion
- 7.3.2 Skills, Infrastructure and Implementation Gaps
- 7.4 Emerging Market Opportunities
- 7.5 Market Dynamics Impact and Time-Horizon Assessment
Chapter 8 Australia Air Ambulance Services Value Chain Analysis
- 8.1 Industry Value Chain Overview
- 8.2 Upstream Suppliers and Critical Inputs
- 8.3 Technology and Component Providers
- 8.4 Manufacturing or Service Delivery
- 8.5 Distribution, Channel Partners and Integrators
- 8.6 Downstream Applications and End Users
- 8.7 Value Addition and Profit Pools
- 8.8 Vertical Integration and Outsourcing
- 8.9 Supplier Concentration and Risk
- 8.10 Supply Chain Localization and Resilience
Chapter 9 Australia Air Ambulance Services Market Regulations and Policies
- 9.1 Relevant Laws, Standards and Compliance Frameworks
- 9.2 Product, Service, Safety and Quality Requirements
- 9.3 Government Policies, Incentives and Subsidies
- 9.4 Imports, Exports and Trade Barriers
- 9.5 Public Procurement and Local Content Requirements
- 9.6 Data Protection, AI and Cybersecurity Compliance
- 9.7 Upcoming Policy Changes and Market Implications
Chapter 10 Australia Air Ambulance Services Market Hotspots and Opportunities
- 10.1 Market Opportunity Mapping and Growth Hotspots
- 10.2 High-Growth Applications and Customer Groups
- 10.3 Underserved Markets and White-Space Opportunities
- 10.4 Emerging Technology and Product Opportunities
- 10.5 New Capacity and Investment Hotspots
- 10.6 Market Entry and Expansion Opportunities
- 10.7 Distribution and Partnership Opportunities
- 10.8 Near-Term and Long-Term Commercial Potential
- 10.9 Opportunity Attractiveness and Execution Risks
Chapter 11 Australia Air Ambulance Services Market Outlook, 2025-2035
- 11.1 Market Size and Analysis
- 11.1.1 Revenue (Market Measurement: 2025: USD 441.5 million → 2035: USD 989.5 million)
- 11.1.2 Historical Market Size, 2018-2025
- 11.1.3 Base-Year Market Size, 2025
- 11.2 Market Forecast, 2025-2035
- 11.2.1 Revenue Forecast to 2035
- 11.2.2 CAGR and Year-on-Year Growth
- 11.2.3 Incremental Revenue Opportunity
- 11.3 Forecast Assumptions and Scenario Analysis
- 11.3.1 Base-Case Forecast
- 11.3.2 Optimistic and Conservative Scenarios
- 11.3.3 Technology, Pricing and Policy Sensitivities
- 11.4 Market Attractiveness and Growth Outlook
Chapter 12 Australia Air Ambulance Services Market Segmentation and Outlook
- 12.1 Segmentation Summary and Market Shares, 2025
- 12.2 Largest and Fastest-Growing Segments
- 12.3 By Service Type - Market Size and Forecast, 2025-2035
- 12.3.1 Segment Definition and Scope
- 12.3.2 Historical Market Size, 2018-2025
- 12.3.3 Revenue Forecast, 2025-2035
- 12.3.4 Base-Year Market Share, 2025
- 12.3.5 Segment CAGR and Growth Drivers
- 12.3.6 Subsegment Market Size and Forecast
- 12.3.6.1 Inter-facility transfer
- 12.3.6.2 Emergency scene response
- 12.3.6.3 Remote primary retrieval
- 12.3.6.4 Contracted industrial medevac
- 12.3.7 Subsegment Pricing and Adoption Trends
- 12.3.8 Leading Suppliers and Competition
- 12.3.9 Regional Demand and Opportunities
- 12.4 By Delivery Model - Market Size and Forecast, 2025-2035
- 12.4.1 Segment Definition and Scope
- 12.4.2 Historical Market Size, 2018-2025
- 12.4.3 Revenue Forecast, 2025-2035
- 12.4.4 Base-Year Market Share, 2025
- 12.4.5 Segment CAGR and Growth Drivers
- 12.4.6 Subsegment Market Size and Forecast
- 12.4.6.1 Fixed-wing turboprop
- 12.4.6.2 Rotary-wing helicopter
- 12.4.6.3 Fixed-wing jet
- 12.4.7 Subsegment Pricing and Adoption Trends
- 12.4.8 Leading Suppliers and Competition
- 12.4.9 Regional Demand and Opportunities
- 12.5 By Customer Type - Market Size and Forecast, 2025-2035
- 12.5.1 Segment Definition and Scope
- 12.5.2 Historical Market Size, 2018-2025
- 12.5.3 Revenue Forecast, 2025-2035
- 12.5.4 Base-Year Market Share, 2025
- 12.5.5 Segment CAGR and Growth Drivers
- 12.5.6 Subsegment Market Size and Forecast
- 12.5.6.1 Public health commissioners
- 12.5.6.2 Insurers and self-paying patients
- 12.5.6.3 Industrial contract buyers
- 12.5.7 Subsegment Pricing and Adoption Trends
- 12.5.8 Leading Suppliers and Competition
- 12.5.9 Regional Demand and Opportunities
- 12.6 Segment Growth Comparison
- 12.7 Segment Attractiveness and Priority Matrix
Chapter 13 Australia Air Ambulance Services End-Use and Application Market Outlook
- 13.1 End-Use Industry and Customer Demand Structure
- 13.2 Leading Applications and Customer Groups
- 13.3 End-Use Market Size, Share and Forecast
- 13.4 Major End-Use Industry Deep Dives
- 13.4.1 Customer Requirements and Use Cases
- 13.4.2 Demand and Replacement Cycles
- 13.4.3 Technical and Regulatory Considerations
- 13.4.4 Purchasing and Procurement Models
- 13.4.5 Leading Vendors and Distribution Channels
- 13.4.6 Forecast and Commercial Opportunities
- 13.5 Emerging Applications and Cross-Segment Demand
- 13.6 End-Use Industry Investment Priorities
Chapter 14 Australia Air Ambulance Services Geographic Market Outlook, 2025-2035
- 14.1 Domestic Market Distribution and Demand Clusters
- 14.2 State- or Province-Wise Market Size and Forecast, 2025-2035
- 14.3 City and Metropolitan Market Outlook
- 14.4 Industrial, Manufacturing and Commercial Clusters
- 14.5 Geographic Concentration of Key End Users
- 14.6 Local Pricing and Purchasing Differences
- 14.7 Domestic Production Facilities and Capacity Map
- 14.8 Local Infrastructure and Project Pipeline
- 14.9 State-Level Policy and Incentive Differences
- 14.10 Subnational Investment Hotspots and Opportunities
- 14.11 Distribution and Logistics Networks
- 14.12 Domestic Competitive Footprint
Chapter 15 Australia Air Ambulance Services Technology, Innovation and Sustainability Outlook
- 15.1 Technology Landscape and Maturity
- 15.2 Product, Process and Service Innovation
- 15.3 AI, Automation and Digital Tools in the Industry
- 15.4 Technology Adoption and Performance Benchmarking
- 15.5 Innovation Pipeline and R&D Investment
- 15.6 Energy Efficiency and Resource Management
- 15.7 Sustainability, Recycling and Circularity
- 15.8 Technology Roadmap, 2025-2035
- 15.9 Risks of Obsolescence and Technology Substitution
Chapter 16 Australia Air Ambulance Services Market Key Strategic Imperatives
- 16.1 Growth and Market Entry Priorities
- 16.2 High-Return Products and Segments
- 16.3 Pricing, Profitability and Cost Optimization
- 16.4 Technology Investment and Product Differentiation
- 16.5 Supply Chain Localization and Resilience
- 16.6 Distribution and Customer Acquisition
- 16.7 Partnership, Acquisition and Capacity Strategy
- 16.8 Regional Expansion Priorities
- 16.9 Short-, Medium- and Long-Term Actions
Chapter 17 Competition Outlook
- 17.1 Industry Competition Characteristics
- 17.2 Market Structure and Concentration
- 17.3 Market Share and Competitive Positioning, 2025
- 17.4 Company-Wise Revenue and Product Benchmarking
- 17.5 Production and Service Capacity Benchmarking
- 17.6 Technology, Pricing and Differentiation
- 17.7 Regional Footprint and Distribution Strength
- 17.8 Mergers, Acquisitions and Strategic Alliances
- 17.9 New Entrants and Competitive Threats
- 17.10 Porter's Five Forces and Industry Attractiveness
- 17.11 Competitive Outlook, 2025-2035
Chapter 18 Company Profiles
- 18.1 Company Coverage and Selection Criteria
- 18.2 CareFlight Limited
- 18.2.1 Business Description
- 18.2.2 Company Ownership and Geographic Presence
- 18.2.3 Product and Service Portfolio
- 18.2.4 Manufacturing and Operating Footprint
- 18.2.5 Financial Performance and Investment
- 18.2.6 Market Share and Competitive Position
- 18.2.7 Technology and Innovation Capabilities
- 18.2.8 Strategic Alliances or Partnerships
- 18.2.9 Recent Developments
- 18.2.10 Growth Strategy and Outlook
- 18.3 RFDS Queensland Section
- 18.4 RFDS Western Operations
- 18.5 LifeFlight Australia
- 18.6 RFDS Central Operations
- 18.7 Toll Aviation
- 18.8 Babcock Australasia
- 18.9 StarFlight Australia
- 18.10 Other Relevant Market Participants
Note: Every listed company is profiled on the structure shown under the first company. The company list is preliminary and may change based on research findings, market developments, data availability and client requirements.
Chapter 19 Disclaimer
- 19.1 Research and Forecast Disclaimer
- 19.2 Data Source and Estimation Limitations
Note: The depth of individual sections depends on data availability for this market. Volume, capacity, trade and other unit-based metrics are included where applicable.

