
State fee rules and digital records shape ambulance billing
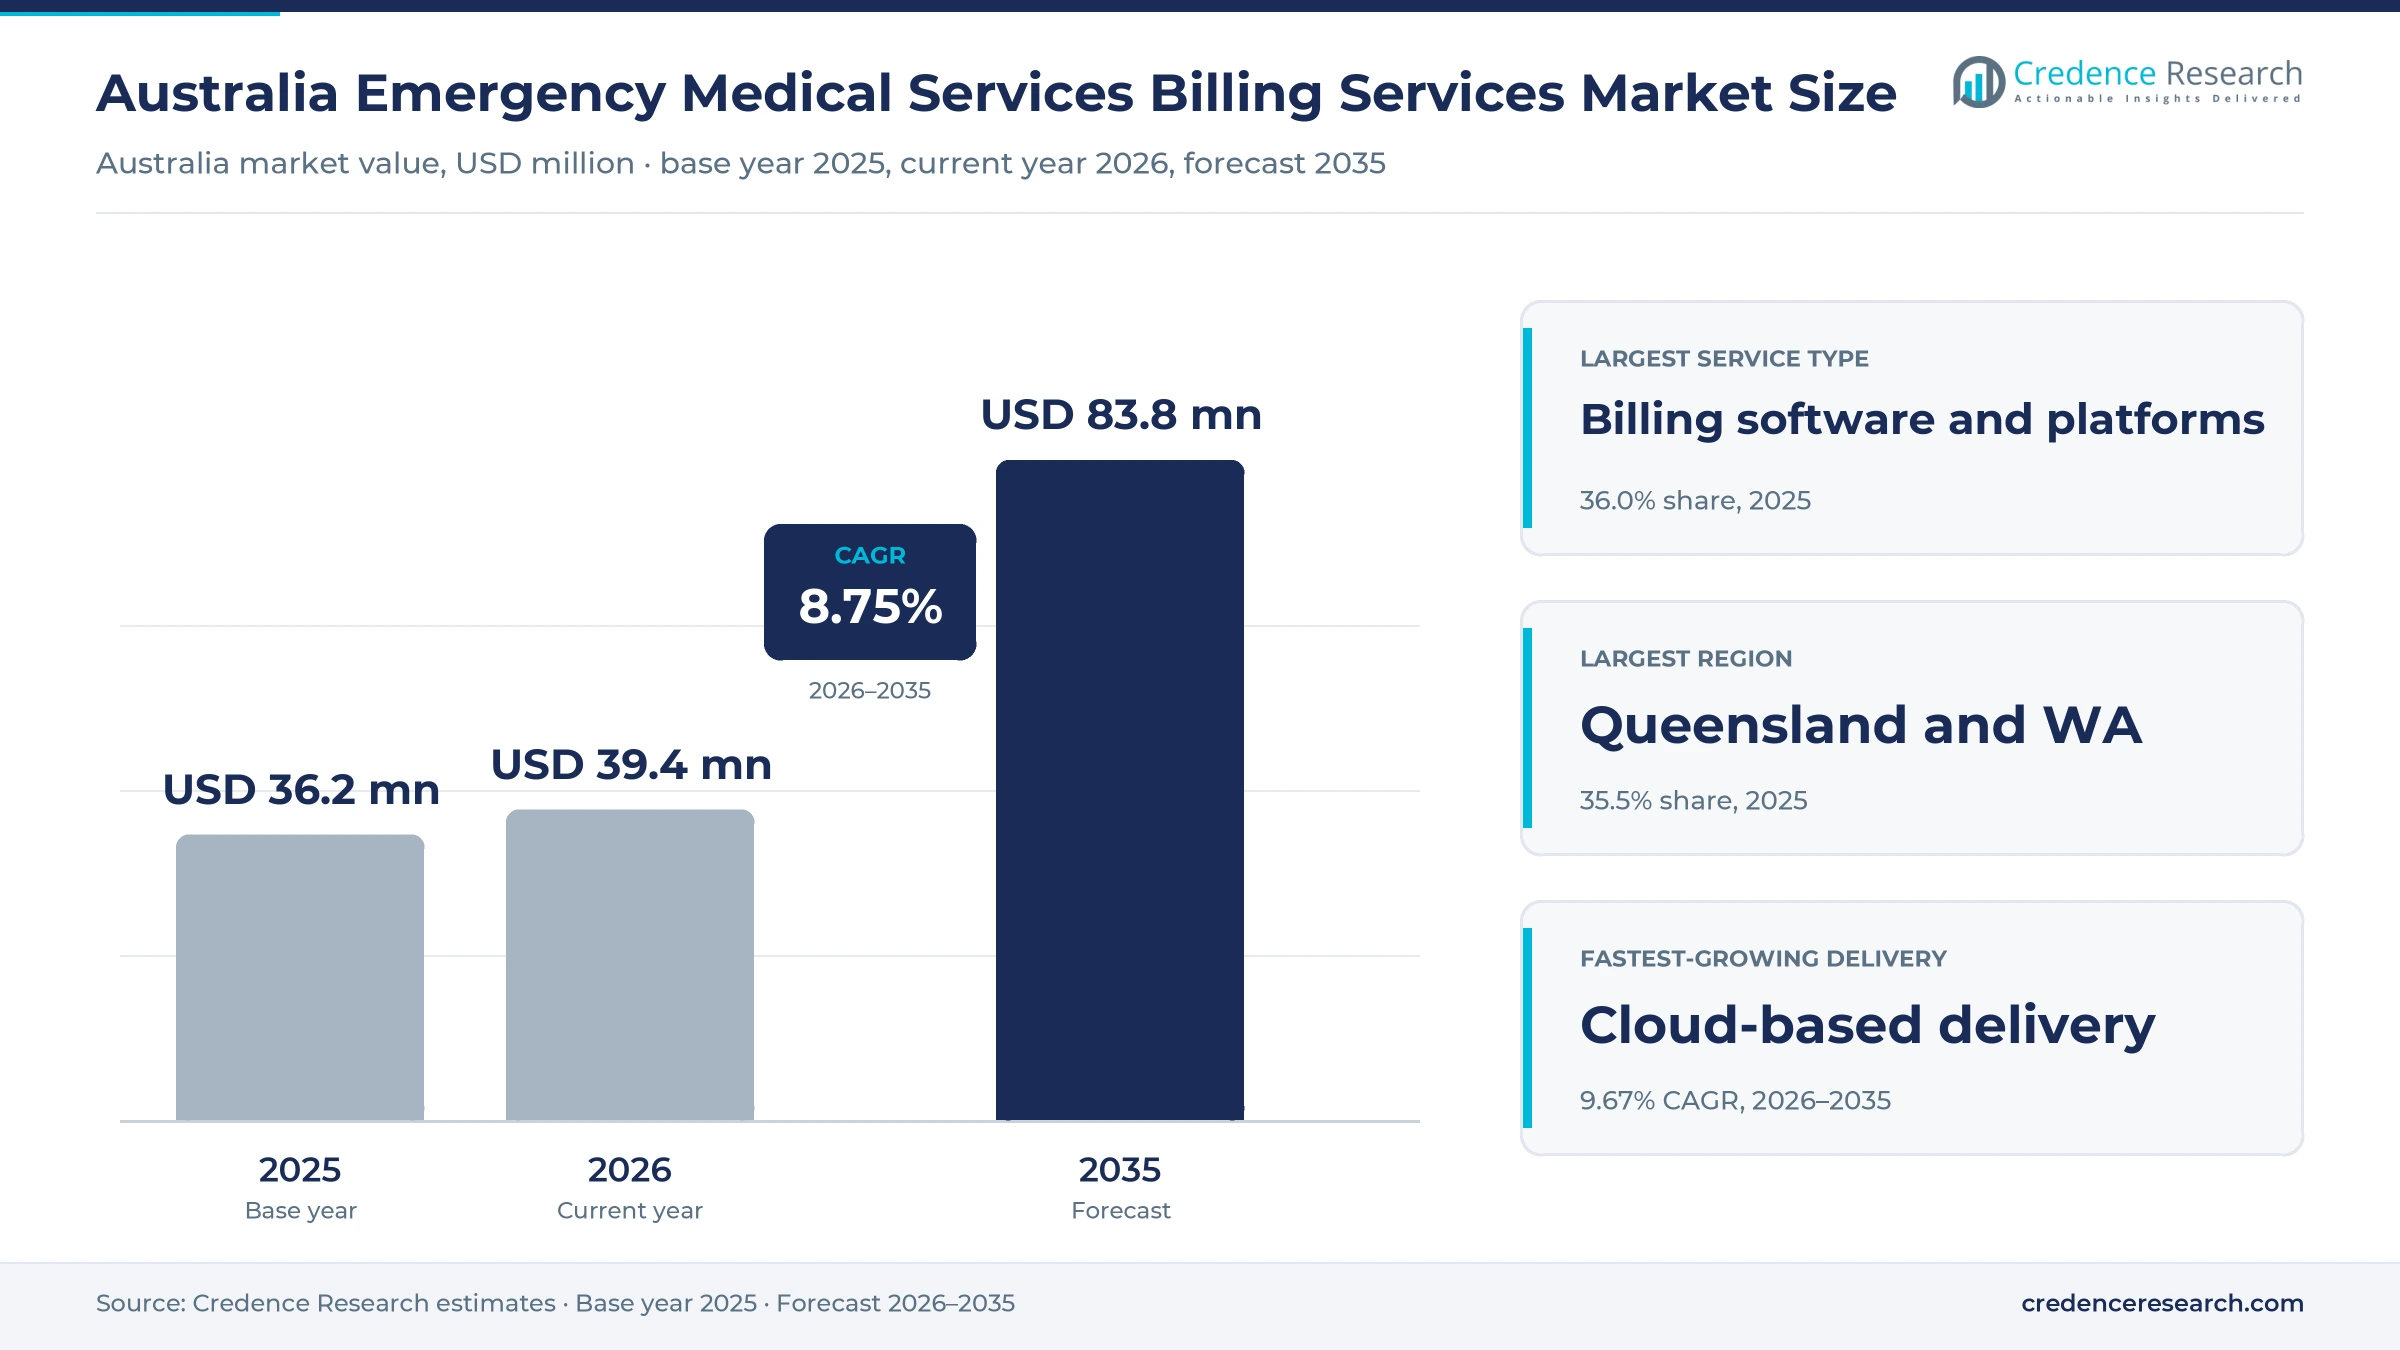
The Australia emergency medical services billing services market was valued at USD 36.2 million in 2025 and is projected to increase from USD 39.4 million in 2026 to USD 83.8 million by 2035, registering a CAGR of 8.75% during 2026–2035. Demand comes from state ambulance services, private patient transport operators and aeromedical providers that must bill patients, insurers, hospitals and government schemes under different state rules. Queensland and Western Australia held the largest regional share, 35.5% in 2025, because the zone covers two large services with wide road and air networks. South Australia and the territories form the fastest-growing region at 9.18% a year, as South Australia funds new electronic patient care records. In turn, paper case cards are giving way to digital records that feed billing systems directly, which cuts manual data entry and speeds up claims.
Which ambulance billing tools and services does the estimate cover?
The estimate measures the value of billing software, claims processing and coding, denial management and collections, and analytics and compliance services sold to ambulance providers in Australia. It counts spending by government ground ambulance services, private ground operators and aeromedical providers through direct enterprise sales, public procurement tenders and implementation partners.
The estimate excludes ambulance fees themselves, dispatch systems, clinical devices and general hospital billing. The value chain runs from software vendors and outsourcing firms through system integrators to ambulance finance teams, which then bill patients, health funds, workers compensation insurers, motor accident schemes and hospitals.
Australia Emergency Medical Services Billing Services Market Insights
- The Australia emergency medical services billing services market was valued at USD 36.2 million in 2025 and is projected to reach USD 83.8 million by 2035, registering a CAGR of 8.75% during 2026–2035.
- Queensland and Western Australia held a 35.5% share of 2025 value, because the zone covers two large state ambulance services.
- Government ground ambulance providers led with a 72.0% share of 2025 value, because state services handle most incidents and transports.
- Australian ambulance service organizations reported revenue of $6.3 billion in 2024-25, with transport fees making up 15.9% of funding, according to 2026 national data.
- Cloud-based delivery grows fastest at 9.67% a year during 2026–2035, as ambulance services replace older billing servers with hosted platforms.
Billing platforms lead while analytics tools grow fastest
Why do billing platforms lead service value?
Based on service type, the market is categorized into billing software and platforms, claims processing and coding, denial management and collections, and analytics and compliance. Billing Software and Platforms led with a 36.0% share of 2025 value, because every ambulance service needs a core system to raise and track accounts. Analytics and Compliance grows fastest at 9.67% a year, as finance teams track lost revenue and audit risk.
How do public and private providers split spending?
Based on customer type, the market is categorized into government ground ambulance providers, private ground ambulance providers and aeromedical providers. Government Ground Ambulance Providers led with a 72.0% share of 2025 value, because state services handle most incidents and transports. Aeromedical Providers grow fastest at 9.43% a year, as new aviation contracts add flights that need separate billing.
Why does emergency care billing lead applications?
Based on application, the market is categorized into emergency care billing, scheduled transport billing and contract medical support billing. Emergency Care Billing led with a 58.0% share of 2025 value, because emergency call-outs carry the highest fees and the most complex payer rules. Contract Medical Support Billing grows fastest at 9.54% a year, as events, mines and private sites hire paramedic cover.
How fast is cloud delivery replacing older systems?
Based on delivery model, the market is categorized into cloud-based delivery, on-premise delivery and hybrid delivery. Cloud-Based Delivery led with a 44.0% share of 2025 value, because new contracts favor hosted systems with regular updates. Cloud-Based Delivery grows fastest at 9.67% a year, as ambulance services retire older billing servers and link records, claims and payments.
| Segment Group | Leading Sub-segment | Share, 2025 | Fastest-growing Sub-segment | CAGR, 2026–2035 |
|---|---|---|---|---|
| By Service Type | Billing Software and Platforms | 36.0% | Analytics and Compliance | 9.67% |
| By Customer Type | Government Ground Ambulance Providers | 72.0% | Aeromedical Providers | 9.43% |
| By Application | Emergency Care Billing | 58.0% | Contract Medical Support Billing | 9.54% |
| By Delivery Model | Cloud-Based Delivery | 44.0% | Cloud-Based Delivery | 9.67% |
Request a Free Sample
Fill in your details and we'll send you a free sample report.
- Sample data tables & charts
- Research methodology
Fee complexity, digital records and recovery lift demand
How does jurisdictional payment complexity lift demand?
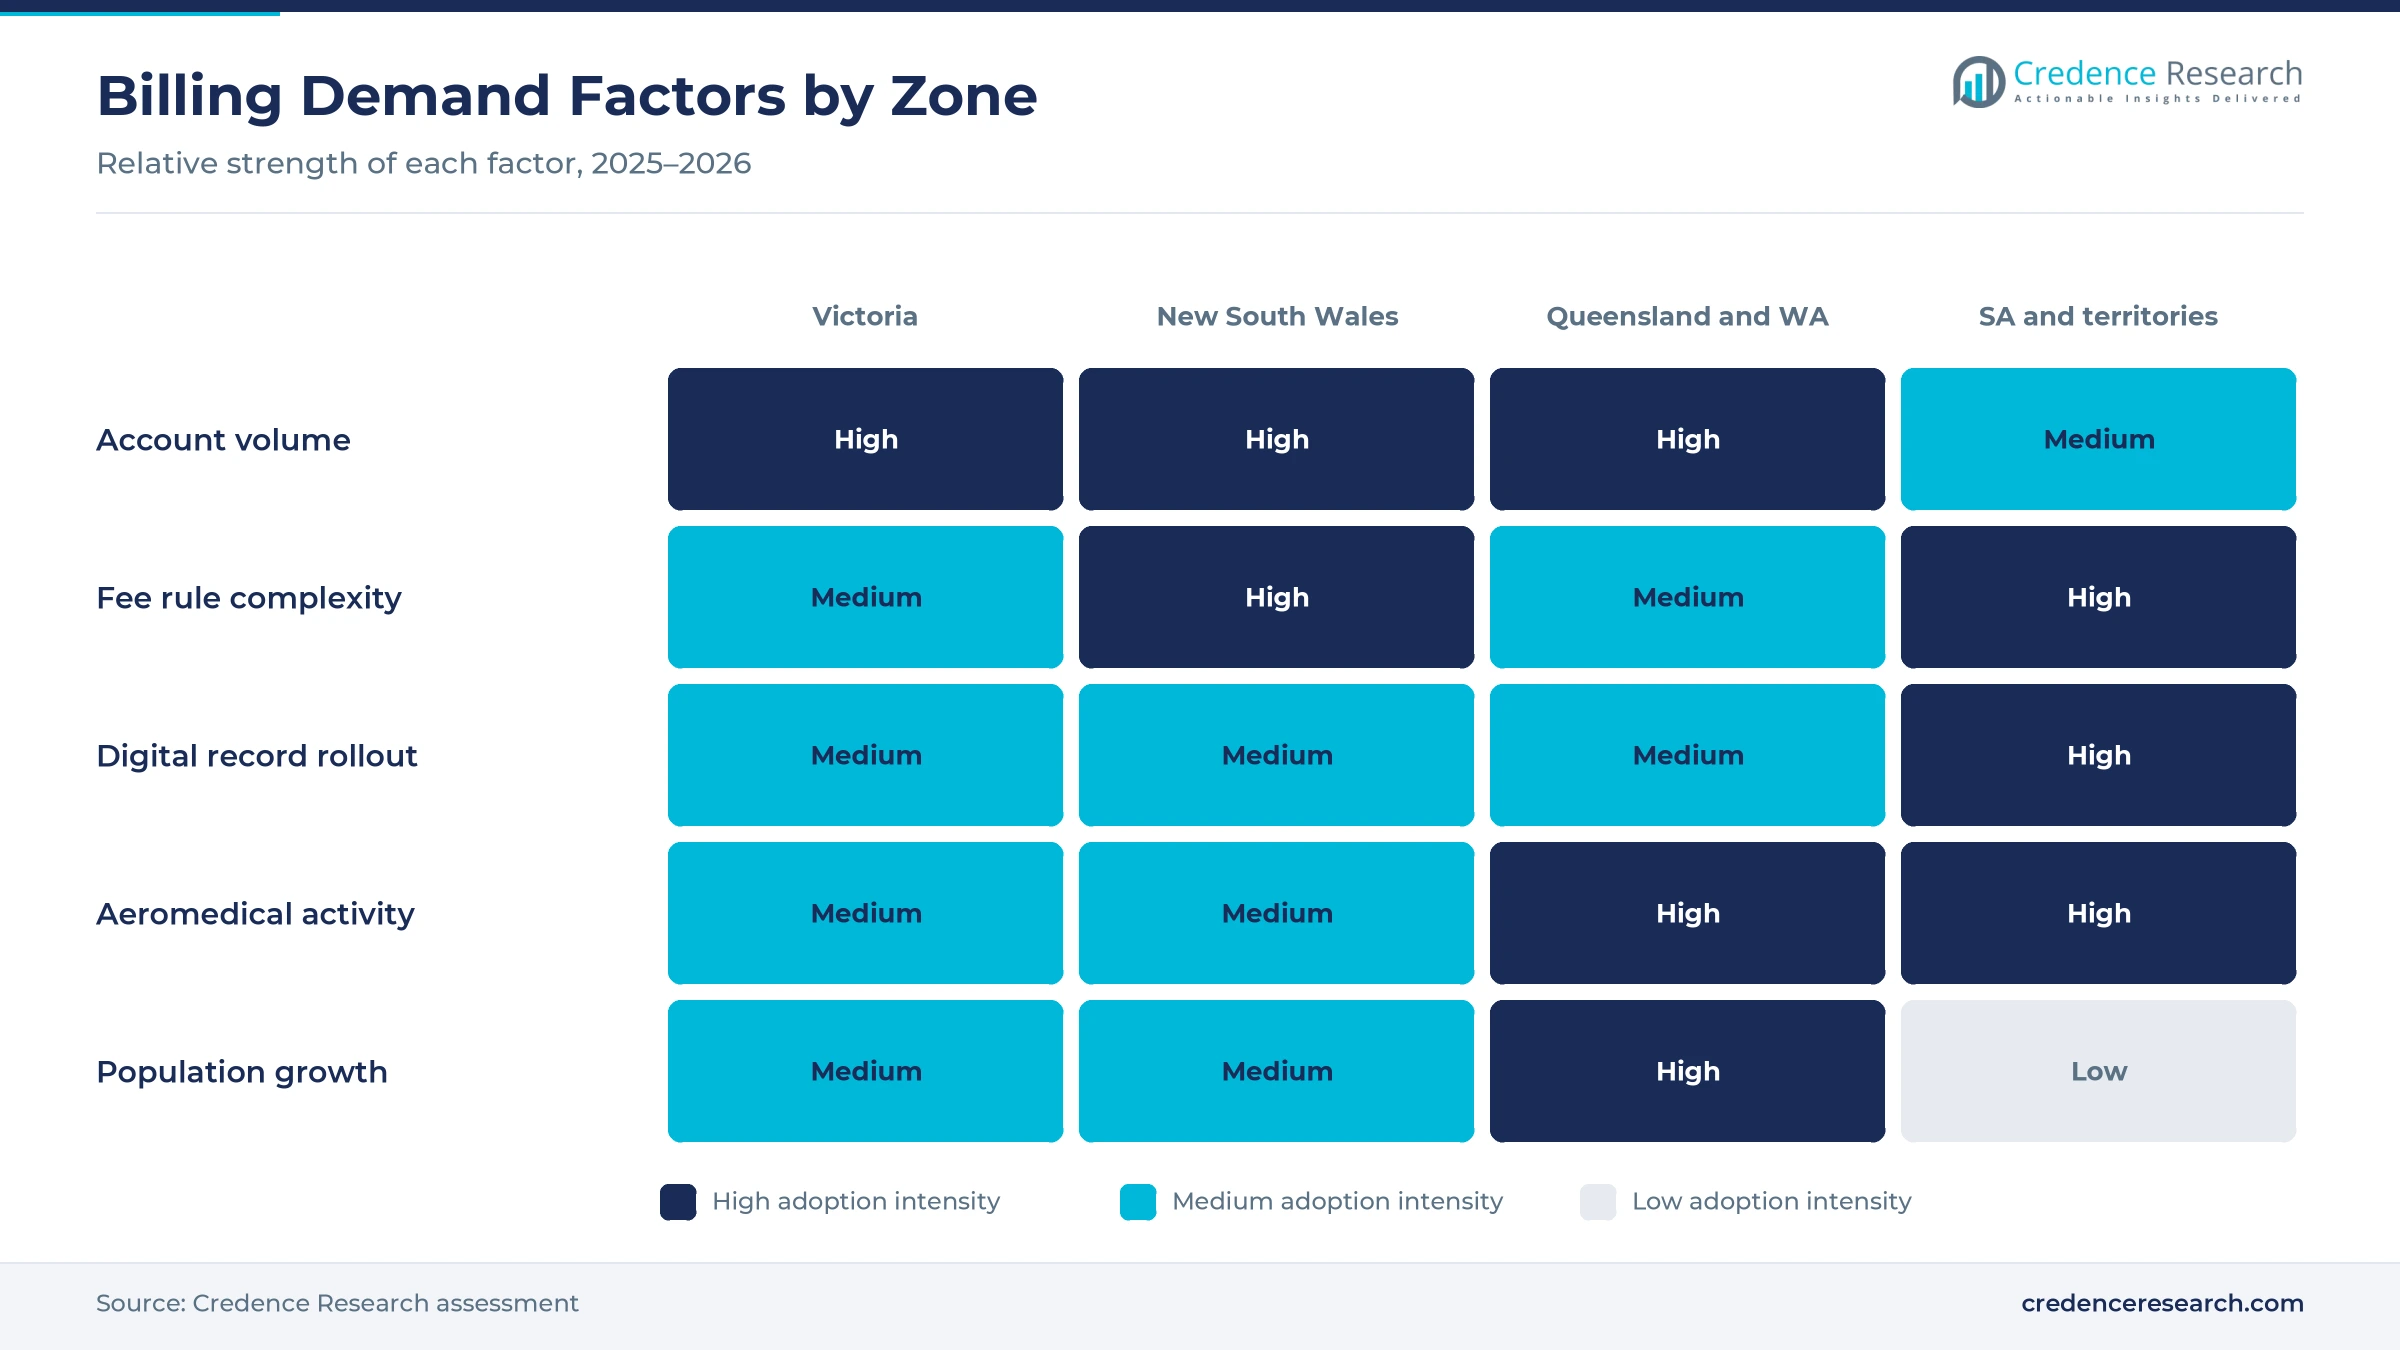
Each state sets its own fees, exemptions and payer rules, so jurisdictional payment complexity lifts demand. From July 1, 2026, NSW Ambulance charges non-residents a $948 emergency call-out fee plus $8.56 per kilometer, according to its fee schedule. NSW residents pay 51% of that fee, because the state subsidizes the other 49%, and Medicare does not cover ambulance costs. SA Ambulance Service lists a $1,247 emergency call-out fee plus $7.15 per kilometer, with exemptions for its own cover members. Victoria instead sells yearly memberships at $56.47 for singles and $112.95 for families. As a result, emergency care billing holds 58.0% of 2025 value, because each account needs the right payer and rate.
Why does digital workflow integration drive spending?
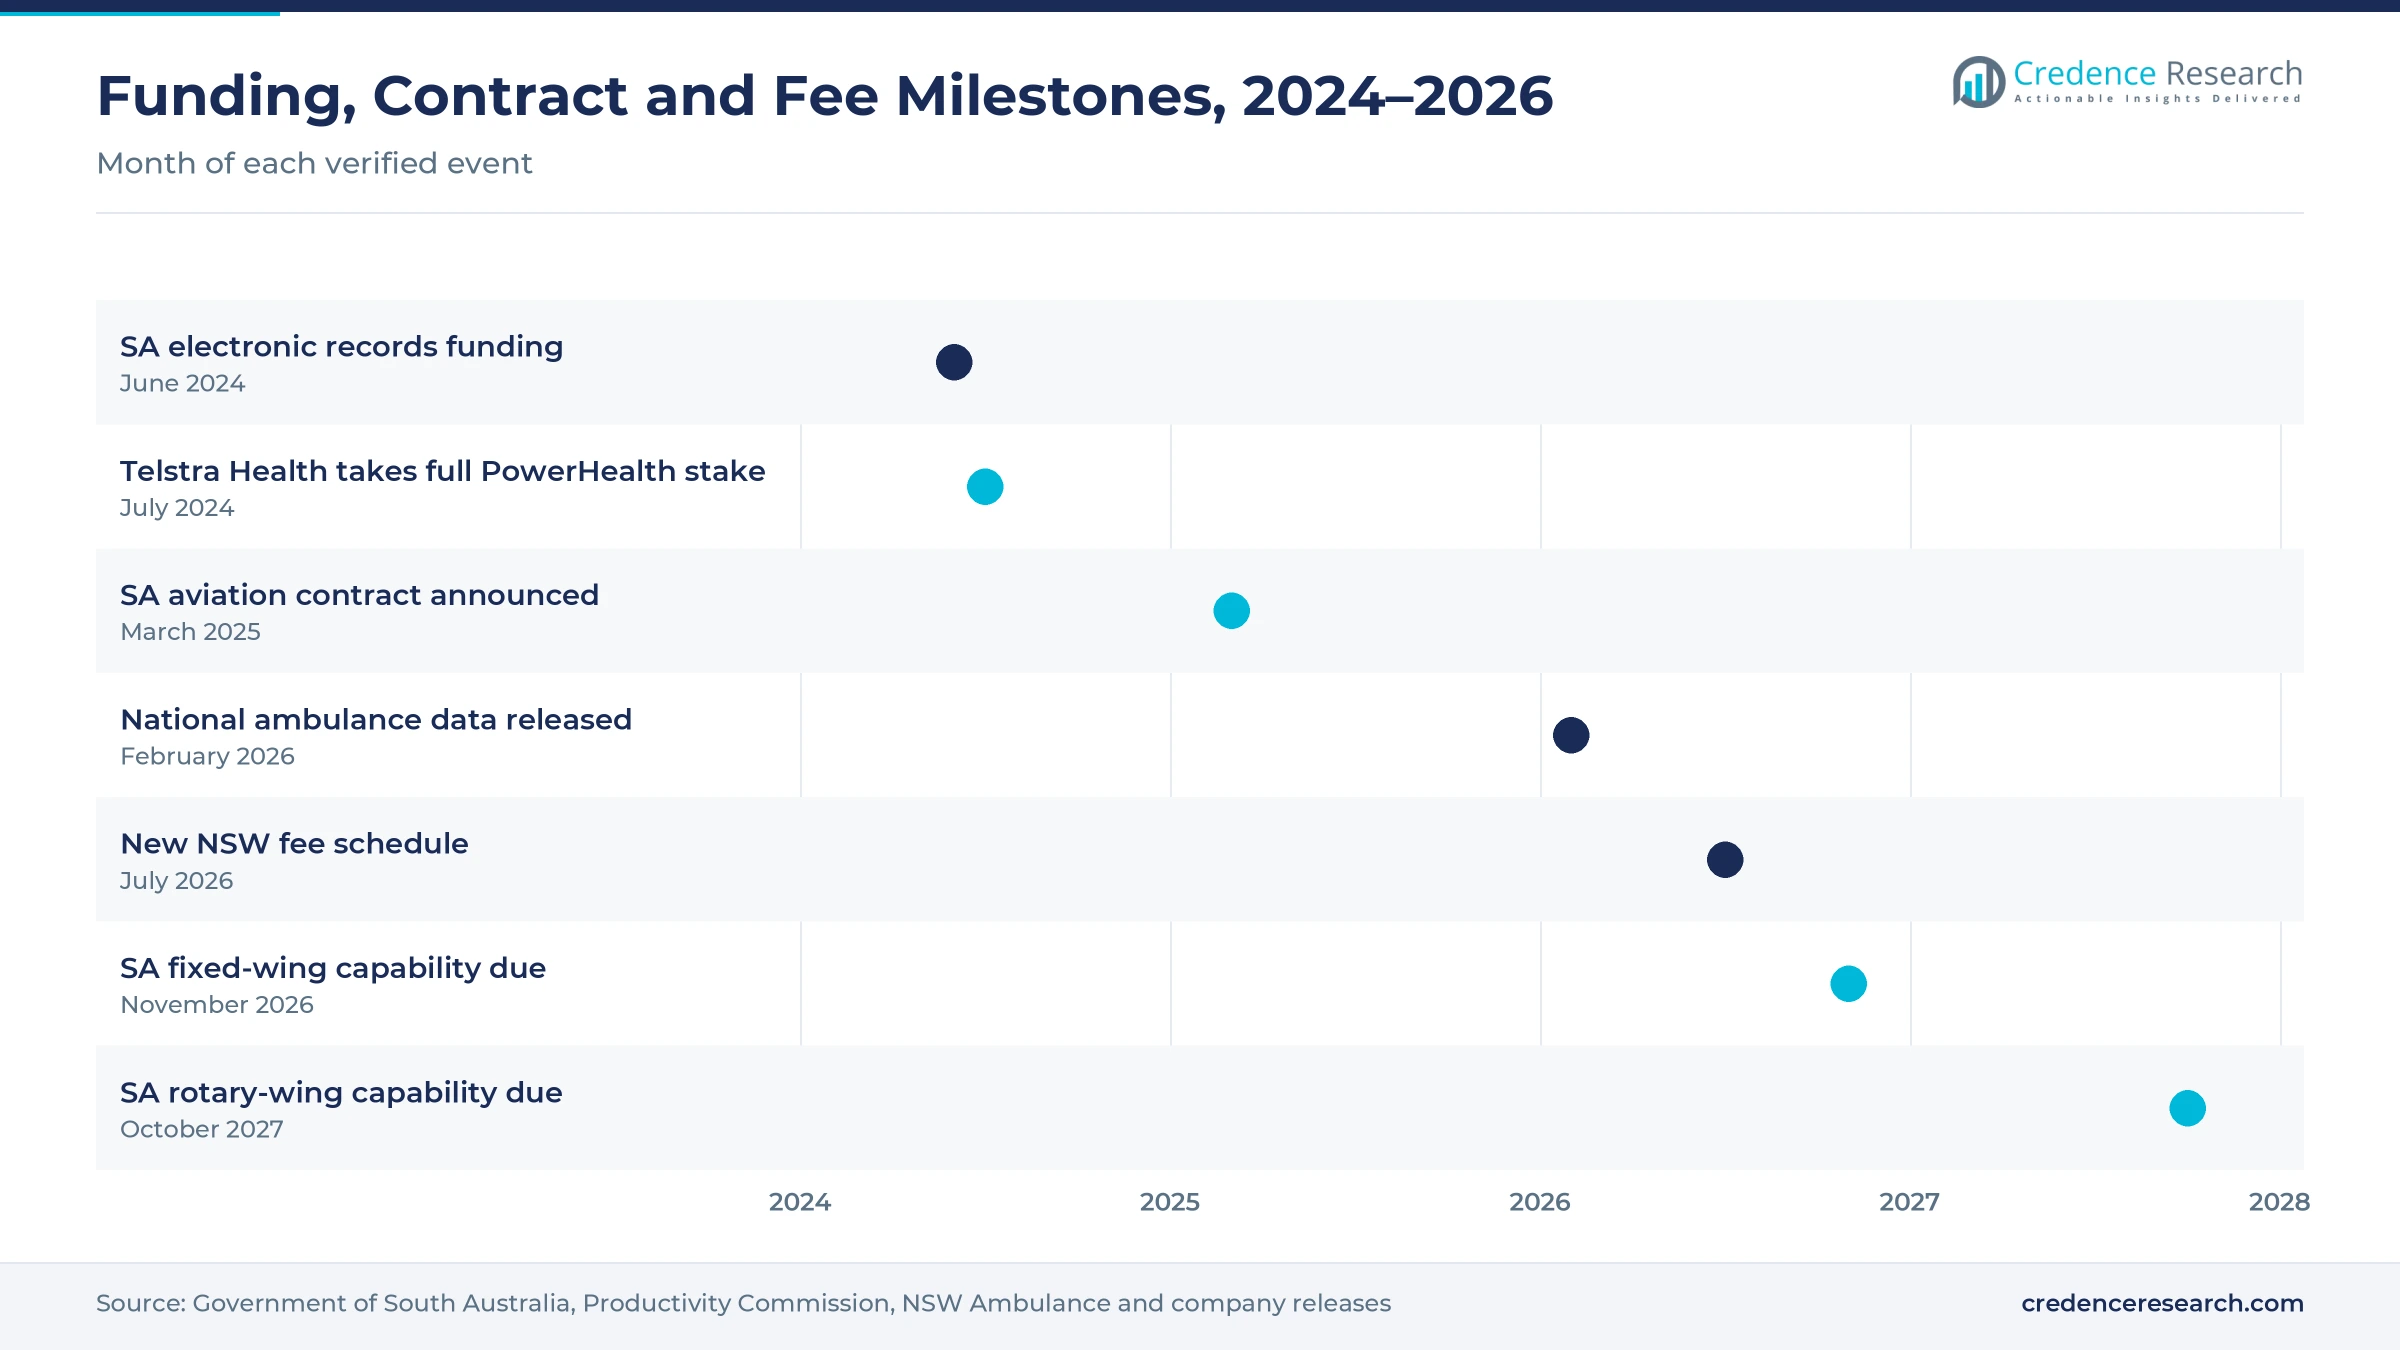
Billing teams need clean patient and trip data from the moment paramedics finish a case, so digital workflow integration drives spending. The South Australian government committed $23.5 million over two years to an electronic patient care record system on June 5, 2024, according to the state government. Paramedics there wrote case cards by hand, and support staff then re-entered the data into other systems. The rollout was set to start from mid-2025 across more than 500 vehicles. Nationally, ambulance services assessed, treated or transported 4.3 million patients in 2024-25. As a result, cloud-based delivery is the fastest-growing delivery model, because hosted tools link digital patient records and claims in one workflow.
How do revenue recovery needs support billing services?
Fees and subscriptions fund part of every ambulance budget, so revenue recovery and administrative resilience support billing services. Ambulance service organization revenue reached $6.3 billion in 2024-25, up 6.9% from the year before, according to the Report on Government Services 2026. Government grants and indirect funding made up 79.9% of that funding, while transport fees made up 15.9% and subscriptions and other income 4.2%. In New South Wales, unpaid ambulance bills may be referred to Revenue NSW, which can add $65 in fees. In turn, analytics and compliance tools gain ground quickly, as finance teams adopt revenue cycle management methods.
How do rising call volumes and aging add accounts?
Each response or transport can create a bill or a claim, so rising call volumes and an aging population add accounts. Ambulance services received 4.5 million incidents and sent 5.9 million responses across Australia in 2024-25, or 214.0 responses per 1,000 people. People aged 65 and over made up 18.1% of the population in 2025, up from 17.7% in 2024, according to the World Bank. Australia also had 27,921,150 residents at March 31, 2026, after annual growth of 1.4%. As a result, government ground ambulance providers hold 72.0% of 2025 value, and their finance teams handle growing account volumes each year.
Integrated platforms, air contracts and payer checks gain
How is the shift to integrated health billing platforms changing buyers?
Public health agencies want one system for patient billing, costing and reporting, so the shift to integrated platforms is changing buyers. Telstra Health acquired the remaining 30% of PowerHealth on July 4, 2024, according to Telstra Health. PowerHealth was founded in Adelaide in 1995 and offers billing, cost calculation, budgeting and decision support tools. The company serves most Australian hospitals and health districts and works in Canada and the Gulf region. Its tools also run for national clients such as the New Zealand Government. As a result, billing software and platforms hold 36.0% of 2025 value, because buyers value tools that link ambulance accounts with wider healthcare technology systems.
Why is the rise of long aeromedical contracts notable?
Flights carry high fees and need separate billing rules, so the rise of long aeromedical contracts is notable. Toll Group announced a 15-year deal on March 4, 2025, to provide police, ambulance and rescue aviation services for South Australia with eight fixed-wing and rotary-wing aircraft. Initial fixed-wing capability is due in November 2026, with full rotary-wing capability in October 2027. NSW Ambulance also charges $68.63 for every 15 minutes of helicopter transport after the first hour. In turn, aeromedical providers grow fastest at 9.43% a year, because air ambulance operators need tools that handle flight time, distance and contract billing.
Can automated payer checks recover more revenue?
Many patients are exempt or covered by another party, so automated payer checks can recover more revenue. In New South Wales, pensioners and concession card holders do not pay, and members with private hospital cover are exempt because funds pay an ambulance levy to the state. Workers compensation and motor accident claims are billed under separate arrangements, while interstate patients may fall under reciprocal agreements. NSW residents pay 51% of the standard fee after a 49% state subsidy. Subscriptions and other income also made up 4.2% of national ambulance funding in 2024-25. As a result, denial management and collections tools that check cover before an account is sent can cut disputes, and these tools grow faster than core billing platforms during 2026–2035.
Is there room to grow in scheduled transport billing?
Non-emergency trips follow different rates and contracts from emergency call-outs, so scheduled transport billing offers room to grow. From July 1, 2026, NSW Ambulance charges non-residents a $381 non-emergency call-out fee plus $2.36 per kilometer. SA Ambulance Service lists a $279 non-emergency call-out fee and the same $279 fee for treatment without transport. Ambulance Victoria membership also covers clinically necessary non-emergency patient transport. In turn, private operators that run non-emergency ambulance vehicles need billing tools for hospitals and health funds, and contract medical support grows fastest at 9.54% a year, as events, mines and private sites book paramedic cover under set contract rates.
Fragmented rules and legacy systems pose key barriers
How do fragmented state rules raise costs?
Each state and territory sets its own fees, exemptions and subscription schemes, so fragmented rules raise costs. As a result, vendors must configure separate rate tables and payer rules for each client, which slows rollouts and raises implementation costs. Suppliers respond with configurable rule engines and shared templates, which cut setup time when a service changes fees each July or adds a new exemption group, which lowers the risk of billing errors after each change.
Why do legacy systems slow modernization?
Many ambulance services run billing, dispatch and patient records on separate platforms built over many years, so legacy systems slow modernization. In turn, data must move between systems that were not designed to work together, and mismatches can cause lost or late accounts. Vendors respond with integration layers and staged migrations, which keep billing running while older servers are replaced with hosted platforms, which limits the risk of missed accounts during each cutover.
How do privacy and security rules affect vendors?
Billing files hold health, address, insurance and payment details for each patient, so privacy and security rules affect vendors. As a result, public buyers demand strict data controls, local hosting and regular audits before they sign cloud contracts. Suppliers respond with encryption, access logs and certified data centers, which help them pass government security reviews and win long contracts with state ambulance services that face rising cyber risk and public scrutiny.
Why do long tender cycles delay growth?
State ambulance services buy billing systems through formal public procurement with long evaluation periods, so long tender cycles delay growth. In turn, vendors wait months or years between a first approach and a signed contract, which ties up sales and bid teams. Suppliers respond with local partners, pilot projects and modular offers, which let buyers start small and expand once the first module proves its value and the buyer gains confidence in the wider rollout plan.
Queensland and WA lead as the smaller states grow fastest
| Region | Value, 2025 (USD million) | Share, 2025 | CAGR, 2026–2035 |
|---|---|---|---|
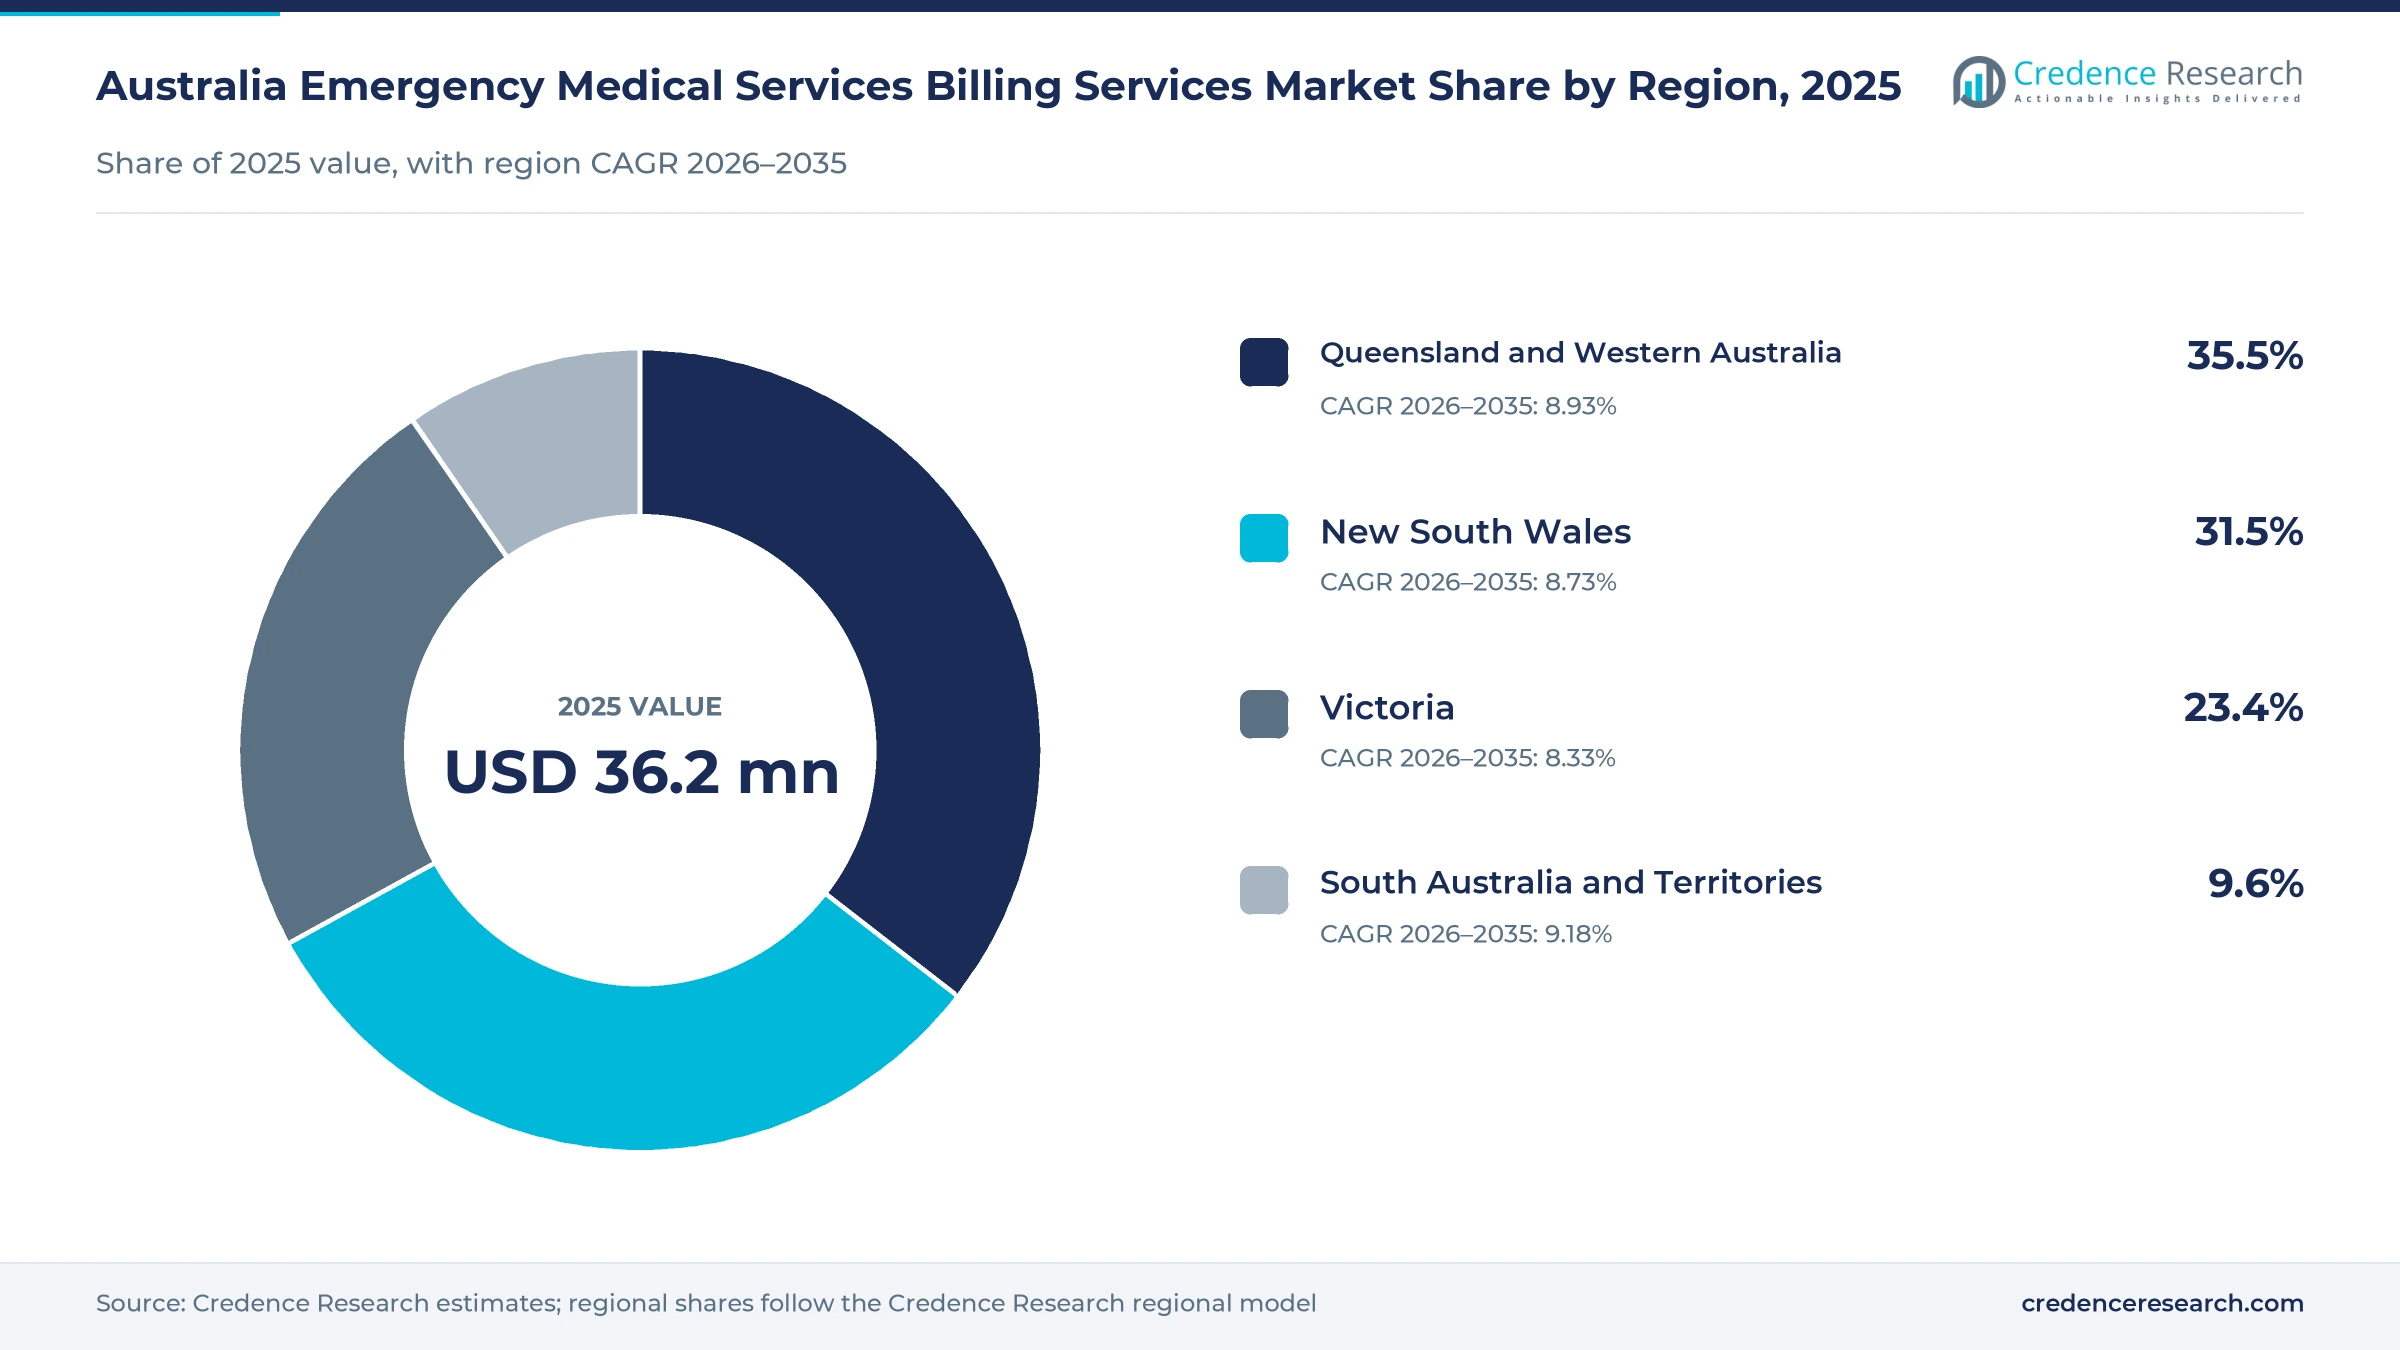
| Queensland and Western Australia | 12.9 | 35.5% | 8.93% |
| New South Wales | 11.4 | 31.5% | 8.73% |
| Victoria | 8.5 | 23.4% | 8.33% |
| South Australia and Territories | 3.5 | 9.6% | 9.18% |
Why do Queensland and Western Australia hold the top share?
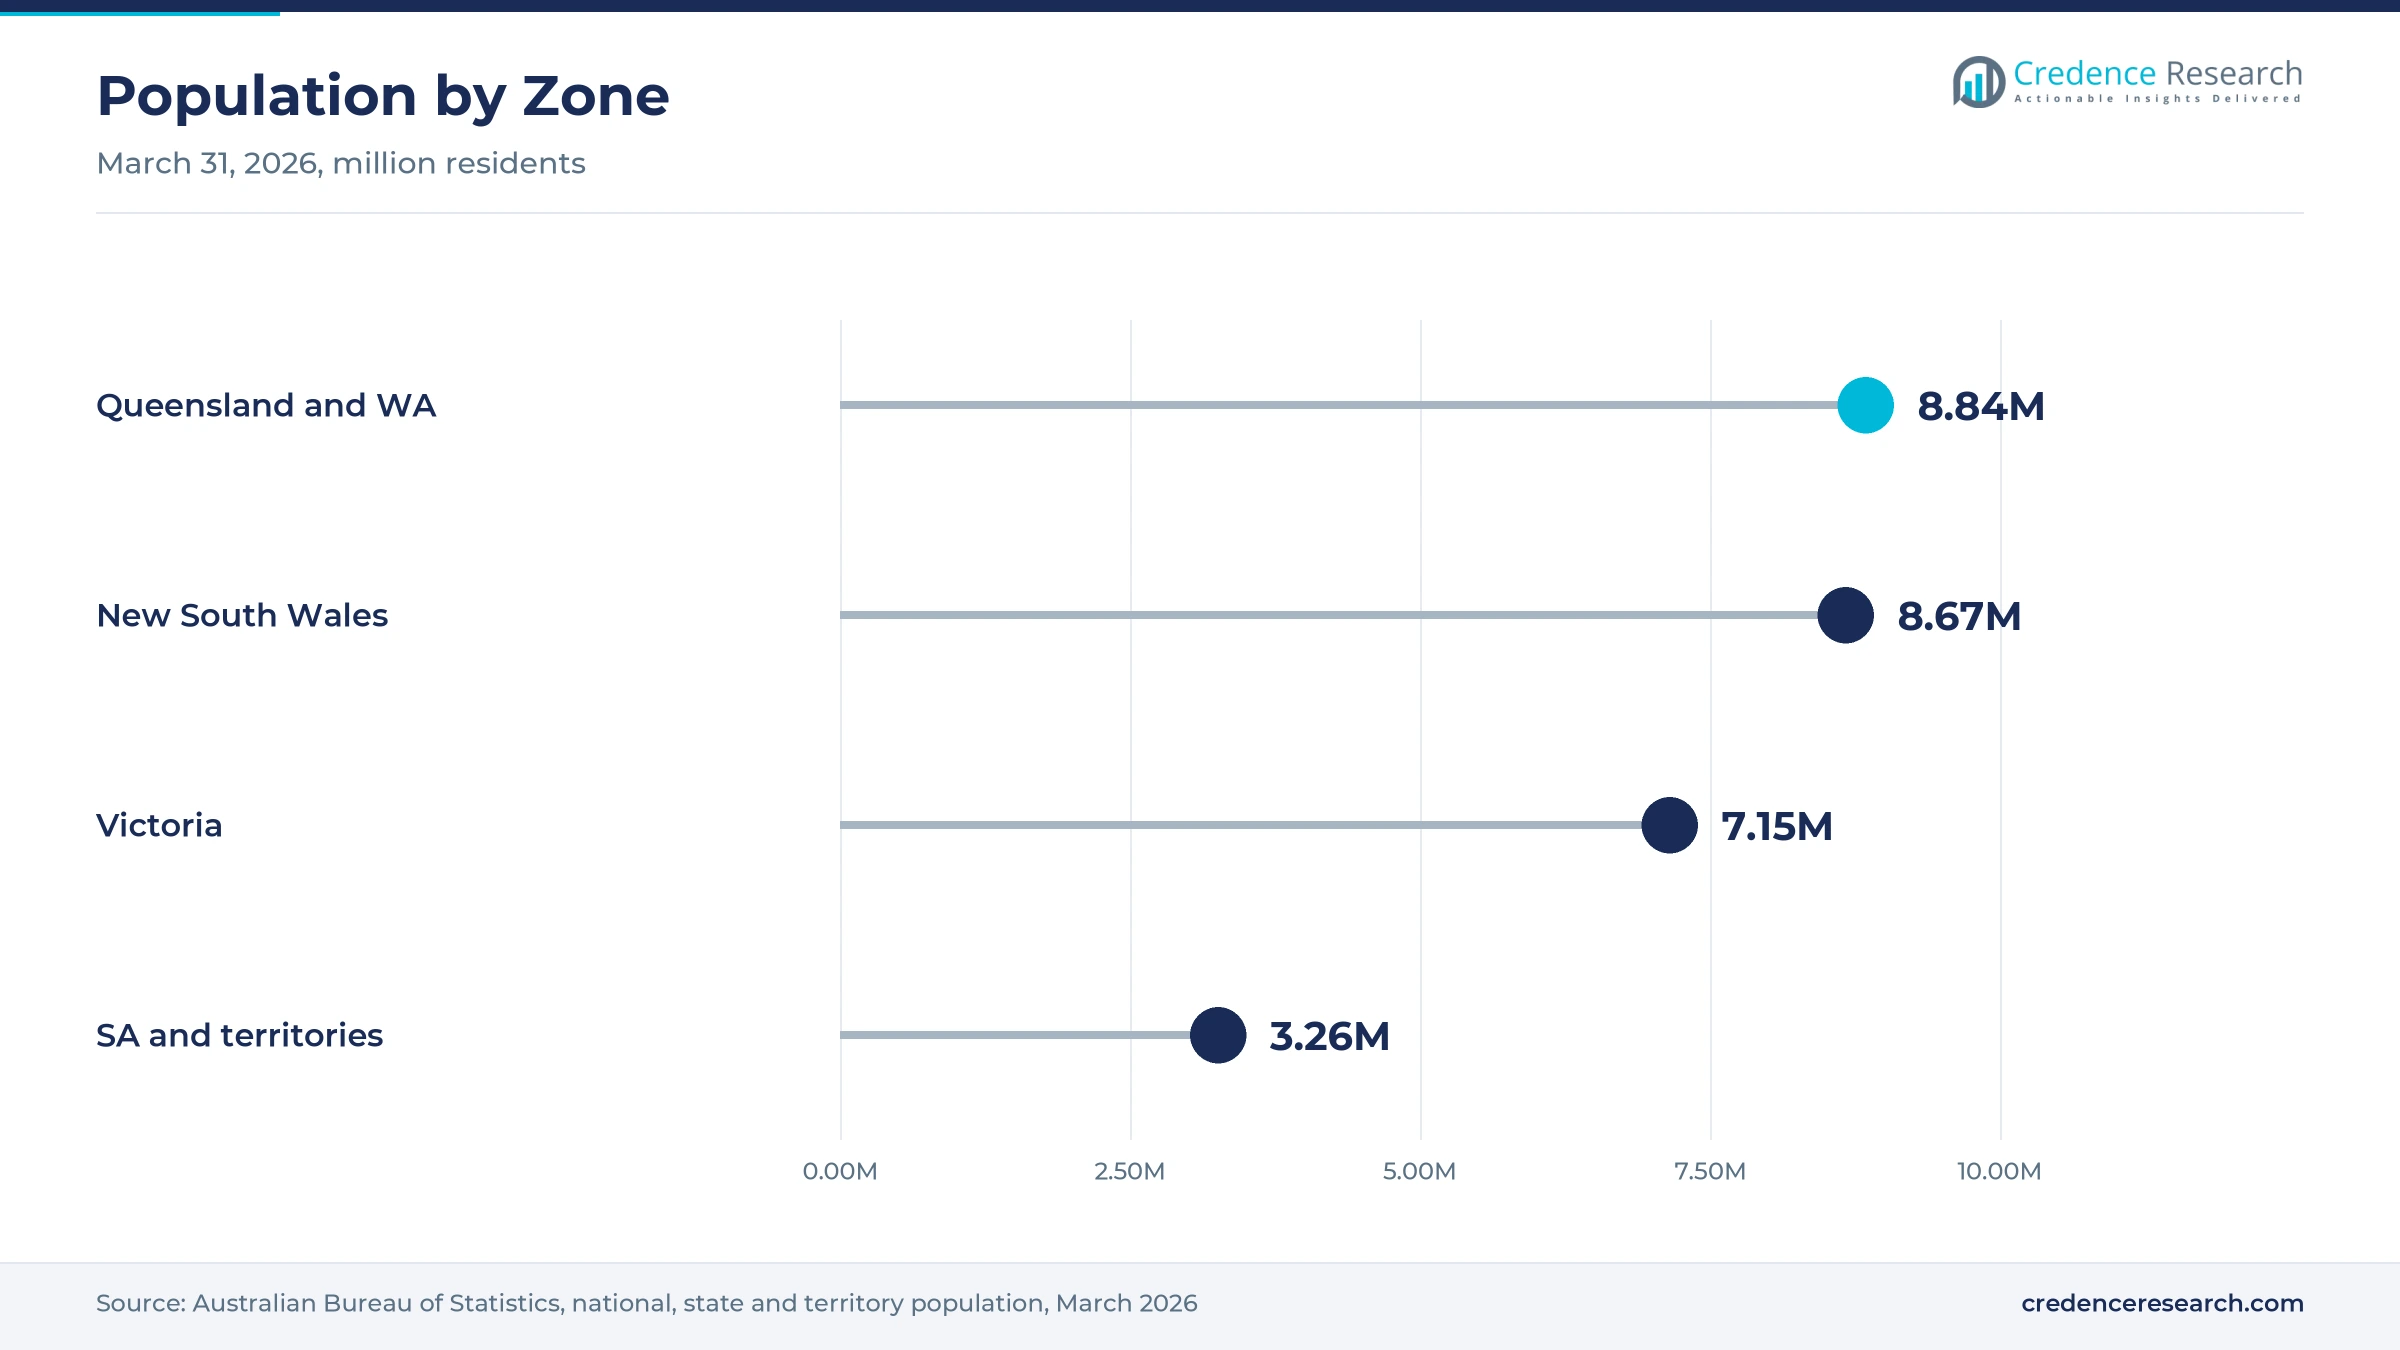
The zone had about 8.84 million residents in March 2026, so Queensland and Western Australia held a 35.5% share of 2025 value and grow at 8.93% a year. Western Australia had the fastest population growth of any state, at 2.1%, while Queensland grew 1.6%. Both states also cover vast distances, so road and air transports create many distance-based accounts. As a result, billing teams in Brisbane and Perth handle high account volumes.
How does New South Wales shape billing demand?
New South Wales held a 31.5% share of 2025 value and grows at 8.73% a year, because the state had about 8.67 million residents in March 2026, the most of any state. NSW Ambulance also runs one of the most detailed fee schedules, with separate road, fixed-wing and helicopter rates. As a result, the state needs strong exemption checks, insurer billing and debt recovery tools across millions of residents.
How does Victoria differ from other states?
Victoria held a 23.4% share of 2025 value and grows at 8.33% a year, because the state had about 7.15 million residents in March 2026 after growth of 1.6%. Ambulance Victoria sells memberships at $56.47 a year for singles and $112.95 for families, which covers emergency and some non-emergency transport. In turn, Victorian billing work focuses on membership checks and non-member accounts across Melbourne and regional areas.
Why are South Australia and the territories growing fastest?
Electronic patient care records are rolling out across more than 500 vehicles in South Australia, so South Australia and the territories held a 9.6% share of 2025 value and grow fastest at 9.18% a year. A new 15-year aviation contract in South Australia also adds aeromedical billing work from November 2026.
Funding, contract and fee schedule milestones
| Development | Status and market relevance |
|---|---|
| In June 2024, the South Australian government committed $23.5 million over two years to electronic patient care records for its ambulance service. | Links patient data with billing |
| In July 2024, Telstra Health acquired the remaining 30% of PowerHealth, an Adelaide-founded billing and costing software company. | Strengthens local health billing software |
| In March 2025, Toll Group announced a 15-year contract for police, ambulance and rescue aviation services in South Australia. | Adds aeromedical billing volume |
| In February 2026, the Report on Government Services showed ambulance service organization revenue of $6.3 billion for 2024-25. | Confirms the funding base for billing |
| In July 2026, NSW Ambulance set a $948 emergency call-out fee plus $8.56 per kilometer for non-residents. | Updates fee rules for billing systems |
Capture, claims, collections and analytics layers
- Electronic patient care records capture patient, trip and treatment details on tablets, which feed billing systems without manual re-entry.
- Claims and coding engines apply state fee schedules, exemptions and payer rules, which help each account reach the right patient, insurer or scheme.
- Collections and denial tools track unpaid and disputed accounts, which helps finance teams follow up and refer old debts for recovery.
- Analytics and compliance dashboards report revenue, write-offs and audit risk, which helps ambulance services plan budgets and meet public reporting rules.
Need a Custom Version of This Report?
Tailor the scope, geography, or segments to your exact requirements.
- Custom geography or segment scope
- Direct access to our analyst team
Health software vendors compete on integration
Competition is shaped by a small group of health software vendors, specialist billing firms and system integrators that bid for state contracts. PowerHealth Solutions, owned in full by Telstra Health since July 2024, offers billing, costing and budgeting tools and serves most Australian hospitals and health districts. ZOLL Data Systems software, including billing and accounts receivable optimization tools for EMS and fire services, is offered through ZOLL's Australian website, while ZOLL Medical Australia signed a Tasmanian defibrillator procurement plan in November 2024. Specialist billing vendors compete on fee rule setup, integration with patient care records, data security and local support. Because state ambulance services buy through formal tenders, vendors with public sector references and local partners win more contracts. Smaller private and aeromedical operators often buy hosted tools or outsource claims, which opens room for specialist billing firms.
Which companies serve Australian ambulance providers?
| Company | Type | Role in the market |
|---|---|---|
| PowerHealth Solutions | Health billing software vendor | Billing, costing and budgeting tools; owned by Telstra Health since 2024 |
| ZOLL Data Systems | EMS software supplier | EMS and fire software with billing and accounts receivable tools offered in Australia |
Credence Research view on ambulance revenue systems
Credence Research's view is that Australian demand for ambulance billing services will grow quickly from a small base, because state fee rules, digital patient records and revenue pressure all push services toward better systems. Billing platforms remain the largest value pool, while analytics, cloud delivery and aeromedical work add the fastest growth. Vendors with configurable fee engines, strong integration skills and public sector references should gain the most, while long tenders and legacy systems keep adoption gradual.
How the national ambulance billing estimate was built
The report uses 2025 as the base year on a calendar basis, and market values come from the Credence Research model. That model combines national ambulance performance data, state fee schedules, population data, government funding announcements and company releases. Segment splits and zone growth rates are Credence Research estimates, while zone shares follow the Credence Research regional model. Sources used are official statistics, government publications and company releases, and no interviews or surveys were used.
Cloud tools and aeromedical work carry growth to 2035
The Australia emergency medical services billing services market is expected to reach USD 83.8 million by 2035, an 8.75% CAGR during 2026–2035, as ambulance services link patient records, fee rules and collections in one workflow. Growth should be strongest in analytics and compliance, cloud delivery and aeromedical billing, because new contracts and digital records raise data volumes. Common fee rules across states would ease rollouts, while long tenders and privacy demands could slow vendor entry.
Frequently Asked Questions
How big is the Australia emergency medical services billing services market?
Which service type leads Australian value?
Which region leads the Australian market?
How much does an emergency ambulance cost in New South Wales?
How are Australian ambulance services funded?
Which delivery model is growing fastest?
Who are the leading companies in the Australian market?
What are the main challenges for billing vendors?
Table of Content
Chapter 1 Market Segmentation
- 1.1 Segmentation Framework
- 1.1.1 Product and Service Classification
- 1.1.2 Application and End-Use Classification
- 1.1.3 Technology and Solution Classification
- 1.1.4 Customer and Distribution Channel Classification
- 1.1.5 Geographic Segmentation
- 1.1.6 Market Segment Definitions and Boundaries
- 1.2 By Service Type
- 1.2.1 Billing Software and Platforms
- 1.2.2 Claims Processing and Coding
- 1.2.3 Denial Management and Collections
- 1.2.4 Analytics and Compliance
- 1.3 By Customer Type
- 1.3.1 Government Ground Ambulance Providers
- 1.3.2 Private Ground Ambulance Providers
- 1.3.3 Aeromedical Providers
- 1.4 By Application
- 1.4.1 Emergency Care Billing
- 1.4.2 Scheduled Transport Billing
- 1.4.3 Contract Medical Support Billing
- 1.5 By Delivery Model
- 1.5.1 Cloud-Based Delivery
- 1.5.2 On-Premise Delivery
- 1.5.3 Hybrid Delivery
Chapter 2 Introduction
- 2.1 Report Objectives and Scope
- 2.2 Product Definition and Industry Terminology
- 2.3 Market Inclusions and Exclusions
- 2.4 Research Process
- 2.4.1 Primary Research and Expert Interviews
- 2.4.2 Secondary Research and Source Review
- 2.4.3 Top-Down and Bottom-Up Estimation
- 2.4.4 Data Triangulation and Verification
- 2.5 Market Size Measurement Basis
- 2.5.1 2025: USD 36.2 million → 2035: USD 83.8 million
- 2.6 Historical and Forecast Reference Periods
- 2.6.1 Historical Period: 2018-2025
- 2.6.2 Base Year: 2025
- 2.6.3 Forecast Period: 2025-2035
- 2.7 Research Assumptions and Limitations
Chapter 3 Executive Summary
- 3.1 Market Snapshot and Key Findings
- 3.2 Base-Year Market Size, 2025
- 3.3 Forecast Market Size, 2035
- 3.4 Revenue and Volume Growth Outlook
- 3.5 Key Demand and Supply Indicators
- 3.6 Leading Market Segments
- 3.7 Fastest-Growing Market Opportunities
- 3.8 Regional Performance Highlights
- 3.9 Technology and Industry Transformation
- 3.10 Competitive Landscape Summary
- 3.11 Analyst View and Strategic Implications
Chapter 4 Australia Emergency Medical Services Billing Services Market Trends and Developments
- 4.1 Historical Industry Development, 2018-2025
- 4.2 Recent Market Trends and Developments
- 4.3 Demand and Customer Behavior Trends
- 4.4 Technology and Product Innovation
- 4.5 Artificial Intelligence, Automation and Digitalization
- 4.6 Local Manufacturing and Supply Chain Realignment
- 4.7 Industry Partnerships, Mergers and Acquisitions
- 4.8 Sustainability and Circular Economy Developments
- 4.9 Government and Private Sector Investment Trends
- 4.10 Emerging Business Models and Commercialization
- 4.11 Industry Developments and Announcements
Chapter 5 Australia Emergency Medical Services Billing Services Market Supply and Demand Analysis
- 5.1 Demand Trend and Consumption Analysis, 2018-2025
- 5.2 Demand Forecast, 2025-2035
- 5.3 Supply Chain Structure and Procurement Trends
- 5.4 Supply-Demand Gap and Bottlenecks
- 5.5 Import Dependence and Sourcing Structure
- 5.6 Regional Supply and Demand Concentration
Chapter 6 Australia Emergency Medical Services Billing Services Market Pricing Analysis
- 6.1 Pricing Structure and Measurement
- 6.2 Historical Pricing Trends, 2018-2025
- 6.3 Pricing Outlook, 2025-2035
- 6.4 Pricing by Product and Market Segment
- 6.5 Geographic Pricing Differences
- 6.6 Key Input, Energy, Labor and Logistics Costs
- 6.7 Contract Pricing and Purchasing Models
- 6.8 Pricing Sensitivity and Competitive Positioning
- 6.9 Price, Margin and Profitability Implications
Chapter 7 Australia Emergency Medical Services Billing Services Market Dynamics
- 7.1 Market Growth Drivers
- 7.1.1 Demand-Side Drivers
- 7.1.2 Technology and Innovation Drivers
- 7.1.3 Infrastructure and Investment Drivers
- 7.1.4 Regulatory and Policy Drivers
- 7.2 Market Restraints
- 7.2.1 Cost and Affordability Constraints
- 7.2.2 Technology and Adoption Barriers
- 7.2.3 Supply Chain and Operational Constraints
- 7.3 Market Challenges
- 7.3.1 Competitive Pressure and Margin Erosion
- 7.3.2 Skills, Infrastructure and Implementation Gaps
- 7.4 Emerging Market Opportunities
- 7.5 Market Dynamics Impact and Time-Horizon Assessment
Chapter 8 Australia Emergency Medical Services Billing Services Value Chain Analysis
- 8.1 Industry Value Chain Overview
- 8.2 Upstream Suppliers and Critical Inputs
- 8.3 Technology and Component Providers
- 8.4 Manufacturing or Service Delivery
- 8.5 Distribution, Channel Partners and Integrators
- 8.6 Downstream Applications and End Users
- 8.7 Value Addition and Profit Pools
- 8.8 Vertical Integration and Outsourcing
- 8.9 Supplier Concentration and Risk
- 8.10 Supply Chain Localization and Resilience
Chapter 9 Australia Emergency Medical Services Billing Services Market Regulations and Policies
- 9.1 Relevant Laws, Standards and Compliance Frameworks
- 9.2 Product, Service, Safety and Quality Requirements
- 9.3 Government Policies, Incentives and Subsidies
- 9.4 Imports, Exports and Trade Barriers
- 9.5 Public Procurement and Local Content Requirements
- 9.6 Data Protection, AI and Cybersecurity Compliance
- 9.7 Upcoming Policy Changes and Market Implications
Chapter 10 Australia Emergency Medical Services Billing Services Market Hotspots and Opportunities
- 10.1 Market Opportunity Mapping and Growth Hotspots
- 10.2 High-Growth Applications and Customer Groups
- 10.3 Underserved Markets and White-Space Opportunities
- 10.4 Emerging Technology and Product Opportunities
- 10.5 New Capacity and Investment Hotspots
- 10.6 Market Entry and Expansion Opportunities
- 10.7 Distribution and Partnership Opportunities
- 10.8 Near-Term and Long-Term Commercial Potential
- 10.9 Opportunity Attractiveness and Execution Risks
Chapter 11 Australia Emergency Medical Services Billing Services Market Outlook, 2025-2035
- 11.1 Market Size and Analysis
- 11.1.1 Revenue (Market Measurement: 2025: USD 36.2 million → 2035: USD 83.8 million)
- 11.1.2 Historical Market Size, 2018-2025
- 11.1.3 Base-Year Market Size, 2025
- 11.2 Market Forecast, 2025-2035
- 11.2.1 Revenue Forecast to 2035
- 11.2.2 CAGR and Year-on-Year Growth
- 11.2.3 Incremental Revenue Opportunity
- 11.3 Forecast Assumptions and Scenario Analysis
- 11.3.1 Base-Case Forecast
- 11.3.2 Optimistic and Conservative Scenarios
- 11.3.3 Technology, Pricing and Policy Sensitivities
- 11.4 Market Attractiveness and Growth Outlook
Chapter 12 Australia Emergency Medical Services Billing Services Market Segmentation and Outlook
- 12.1 Segmentation Summary and Market Shares, 2025
- 12.2 Largest and Fastest-Growing Segments
- 12.3 By Service Type - Market Size and Forecast, 2025-2035
- 12.3.1 Segment Definition and Scope
- 12.3.2 Historical Market Size, 2018-2025
- 12.3.3 Revenue Forecast, 2025-2035
- 12.3.4 Base-Year Market Share, 2025
- 12.3.5 Segment CAGR and Growth Drivers
- 12.3.6 Subsegment Market Size and Forecast
- 12.3.6.1 Billing Software and Platforms
- 12.3.6.2 Claims Processing and Coding
- 12.3.6.3 Denial Management and Collections
- 12.3.6.4 Analytics and Compliance
- 12.3.7 Subsegment Pricing and Adoption Trends
- 12.3.8 Leading Suppliers and Competition
- 12.3.9 Regional Demand and Opportunities
- 12.4 By Customer Type - Market Size and Forecast, 2025-2035
- 12.4.1 Segment Definition and Scope
- 12.4.2 Historical Market Size, 2018-2025
- 12.4.3 Revenue Forecast, 2025-2035
- 12.4.4 Base-Year Market Share, 2025
- 12.4.5 Segment CAGR and Growth Drivers
- 12.4.6 Subsegment Market Size and Forecast
- 12.4.6.1 Government Ground Ambulance Providers
- 12.4.6.2 Private Ground Ambulance Providers
- 12.4.6.3 Aeromedical Providers
- 12.4.7 Subsegment Pricing and Adoption Trends
- 12.4.8 Leading Suppliers and Competition
- 12.4.9 Regional Demand and Opportunities
- 12.5 By Application - Market Size and Forecast, 2025-2035
- 12.5.1 Segment Definition and Scope
- 12.5.2 Historical Market Size, 2018-2025
- 12.5.3 Revenue Forecast, 2025-2035
- 12.5.4 Base-Year Market Share, 2025
- 12.5.5 Segment CAGR and Growth Drivers
- 12.5.6 Subsegment Market Size and Forecast
- 12.5.6.1 Emergency Care Billing
- 12.5.6.2 Scheduled Transport Billing
- 12.5.6.3 Contract Medical Support Billing
- 12.5.7 Subsegment Pricing and Adoption Trends
- 12.5.8 Leading Suppliers and Competition
- 12.5.9 Regional Demand and Opportunities
- 12.6 By Delivery Model - Market Size and Forecast, 2025-2035
- 12.6.1 Segment Definition and Scope
- 12.6.2 Historical Market Size, 2018-2025
- 12.6.3 Revenue Forecast, 2025-2035
- 12.6.4 Base-Year Market Share, 2025
- 12.6.5 Segment CAGR and Growth Drivers
- 12.6.6 Subsegment Market Size and Forecast
- 12.6.6.1 Cloud-Based Delivery
- 12.6.6.2 On-Premise Delivery
- 12.6.6.3 Hybrid Delivery
- 12.6.7 Subsegment Pricing and Adoption Trends
- 12.6.8 Leading Suppliers and Competition
- 12.6.9 Regional Demand and Opportunities
- 12.7 Segment Growth Comparison
- 12.8 Segment Attractiveness and Priority Matrix
Chapter 13 Australia Emergency Medical Services Billing Services End-Use and Application Market Outlook
- 13.1 End-Use Industry and Customer Demand Structure
- 13.2 Leading Applications and Customer Groups
- 13.3 End-Use Market Size, Share and Forecast
- 13.4 Major End-Use Industry Deep Dives
- 13.4.1 Customer Requirements and Use Cases
- 13.4.2 Demand and Replacement Cycles
- 13.4.3 Technical and Regulatory Considerations
- 13.4.4 Purchasing and Procurement Models
- 13.4.5 Leading Vendors and Distribution Channels
- 13.4.6 Forecast and Commercial Opportunities
- 13.5 Emerging Applications and Cross-Segment Demand
- 13.6 End-Use Industry Investment Priorities
Chapter 14 Australia Emergency Medical Services Billing Services Geographic Market Outlook, 2025-2035
- 14.1 Domestic Market Distribution and Demand Clusters
- 14.2 State- or Province-Wise Market Size and Forecast, 2025-2035
- 14.3 City and Metropolitan Market Outlook
- 14.4 Industrial, Manufacturing and Commercial Clusters
- 14.5 Geographic Concentration of Key End Users
- 14.6 Local Pricing and Purchasing Differences
- 14.7 Domestic Production Facilities and Capacity Map
- 14.8 Local Infrastructure and Project Pipeline
- 14.9 State-Level Policy and Incentive Differences
- 14.10 Subnational Investment Hotspots and Opportunities
- 14.11 Distribution and Logistics Networks
- 14.12 Domestic Competitive Footprint
Chapter 15 Australia Emergency Medical Services Billing Services Technology, Innovation and Sustainability Outlook
- 15.1 Technology Landscape and Maturity
- 15.2 Product, Process and Service Innovation
- 15.3 AI, Automation and Digital Tools in the Industry
- 15.4 Technology Adoption and Performance Benchmarking
- 15.5 Innovation Pipeline and R&D Investment
- 15.6 Energy Efficiency and Resource Management
- 15.7 Sustainability, Recycling and Circularity
- 15.8 Technology Roadmap, 2025-2035
- 15.9 Risks of Obsolescence and Technology Substitution
Chapter 16 Australia Emergency Medical Services Billing Services Market Key Strategic Imperatives
- 16.1 Growth and Market Entry Priorities
- 16.2 High-Return Products and Segments
- 16.3 Pricing, Profitability and Cost Optimization
- 16.4 Technology Investment and Product Differentiation
- 16.5 Supply Chain Localization and Resilience
- 16.6 Distribution and Customer Acquisition
- 16.7 Partnership, Acquisition and Capacity Strategy
- 16.8 Regional Expansion Priorities
- 16.9 Short-, Medium- and Long-Term Actions
Chapter 17 Competition Outlook
- 17.1 Industry Competition Characteristics
- 17.2 Market Structure and Concentration
- 17.3 Market Share and Competitive Positioning, 2025
- 17.4 Company-Wise Revenue and Product Benchmarking
- 17.5 Production and Service Capacity Benchmarking
- 17.6 Technology, Pricing and Differentiation
- 17.7 Regional Footprint and Distribution Strength
- 17.8 Mergers, Acquisitions and Strategic Alliances
- 17.9 New Entrants and Competitive Threats
- 17.10 Porter's Five Forces and Industry Attractiveness
- 17.11 Competitive Outlook, 2025-2035
Chapter 18 Company Profiles
- 18.1 Company Coverage and Selection Criteria
- 18.2 PowerHealth Solutions
- 18.2.1 Business Description
- 18.2.2 Company Ownership and Geographic Presence
- 18.2.3 Product and Service Portfolio
- 18.2.4 Manufacturing and Operating Footprint
- 18.2.5 Financial Performance and Investment
- 18.2.6 Market Share and Competitive Position
- 18.2.7 Technology and Innovation Capabilities
- 18.2.8 Strategic Alliances or Partnerships
- 18.2.9 Recent Developments
- 18.2.10 Growth Strategy and Outlook
- 18.3 ESO
- 18.4 Intergy Consulting
- 18.5 SDSI
- 18.6 ZOLL Data Systems
- 18.7 Telstra Health
- 18.8 Other Relevant Market Participants
Note: Every listed company is profiled on the structure shown under the first company. The company list is preliminary and may change based on research findings, market developments, data availability and client requirements.
Chapter 19 Disclaimer
- 19.1 Research and Forecast Disclaimer
- 19.2 Data Source and Estimation Limitations
Note: The depth of individual sections depends on data availability for this market. Volume, capacity, trade and other unit-based metrics are included where applicable.

