
Diagnostic data and trial workloads anchor local demand
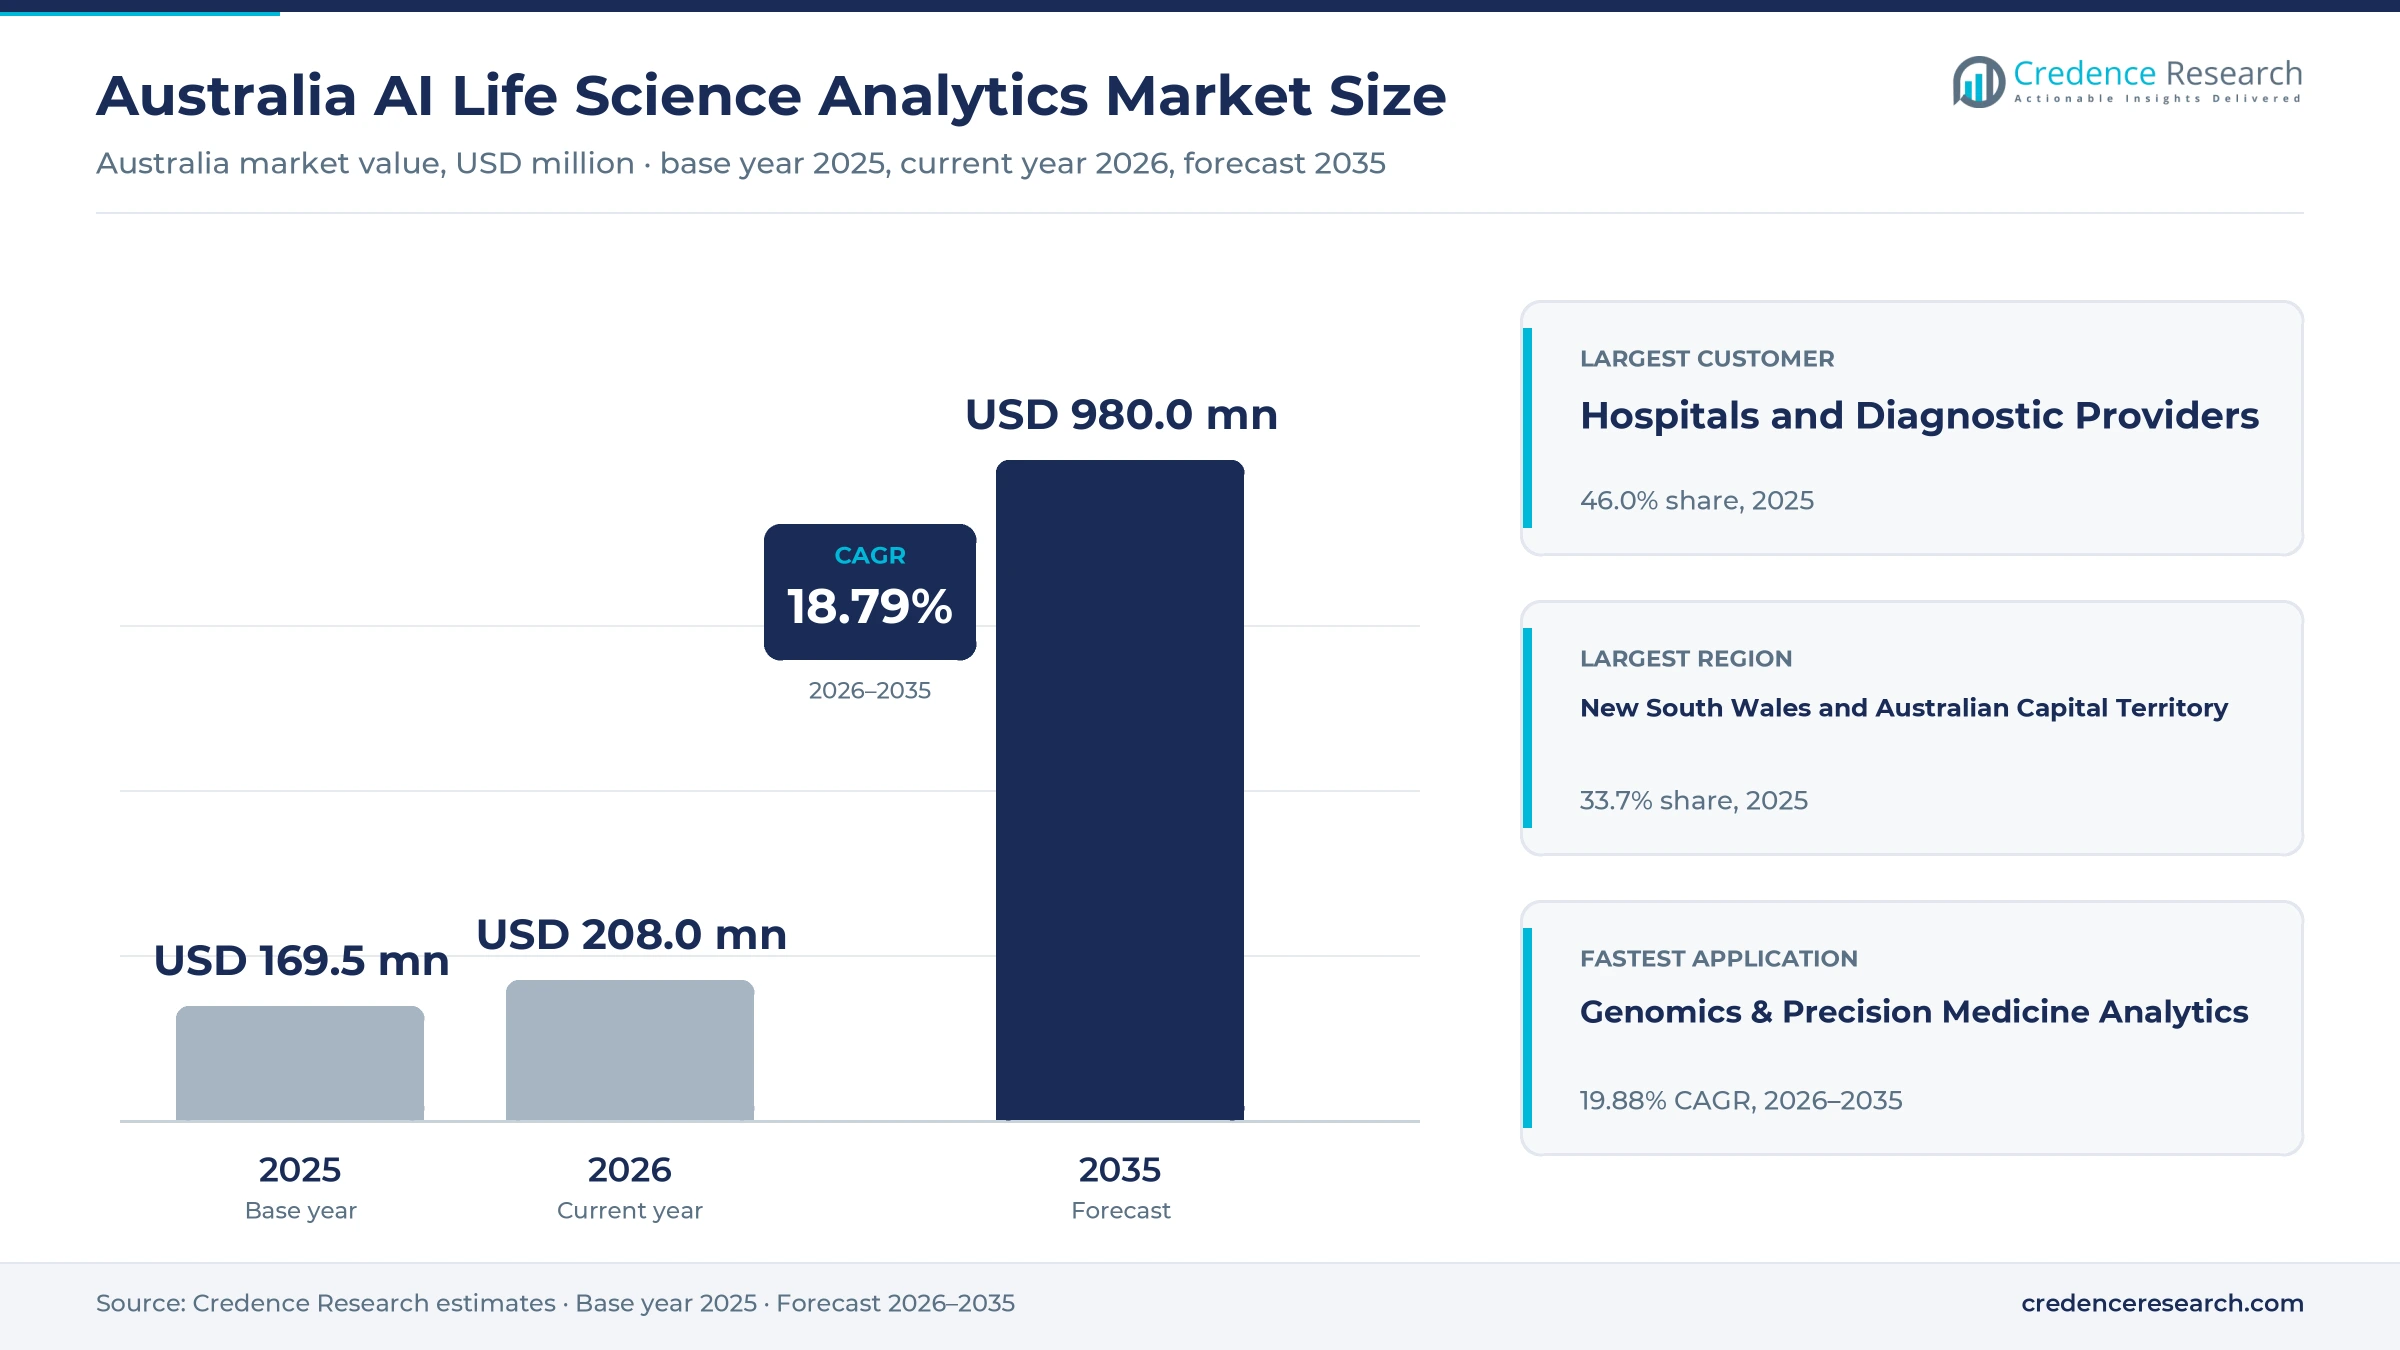
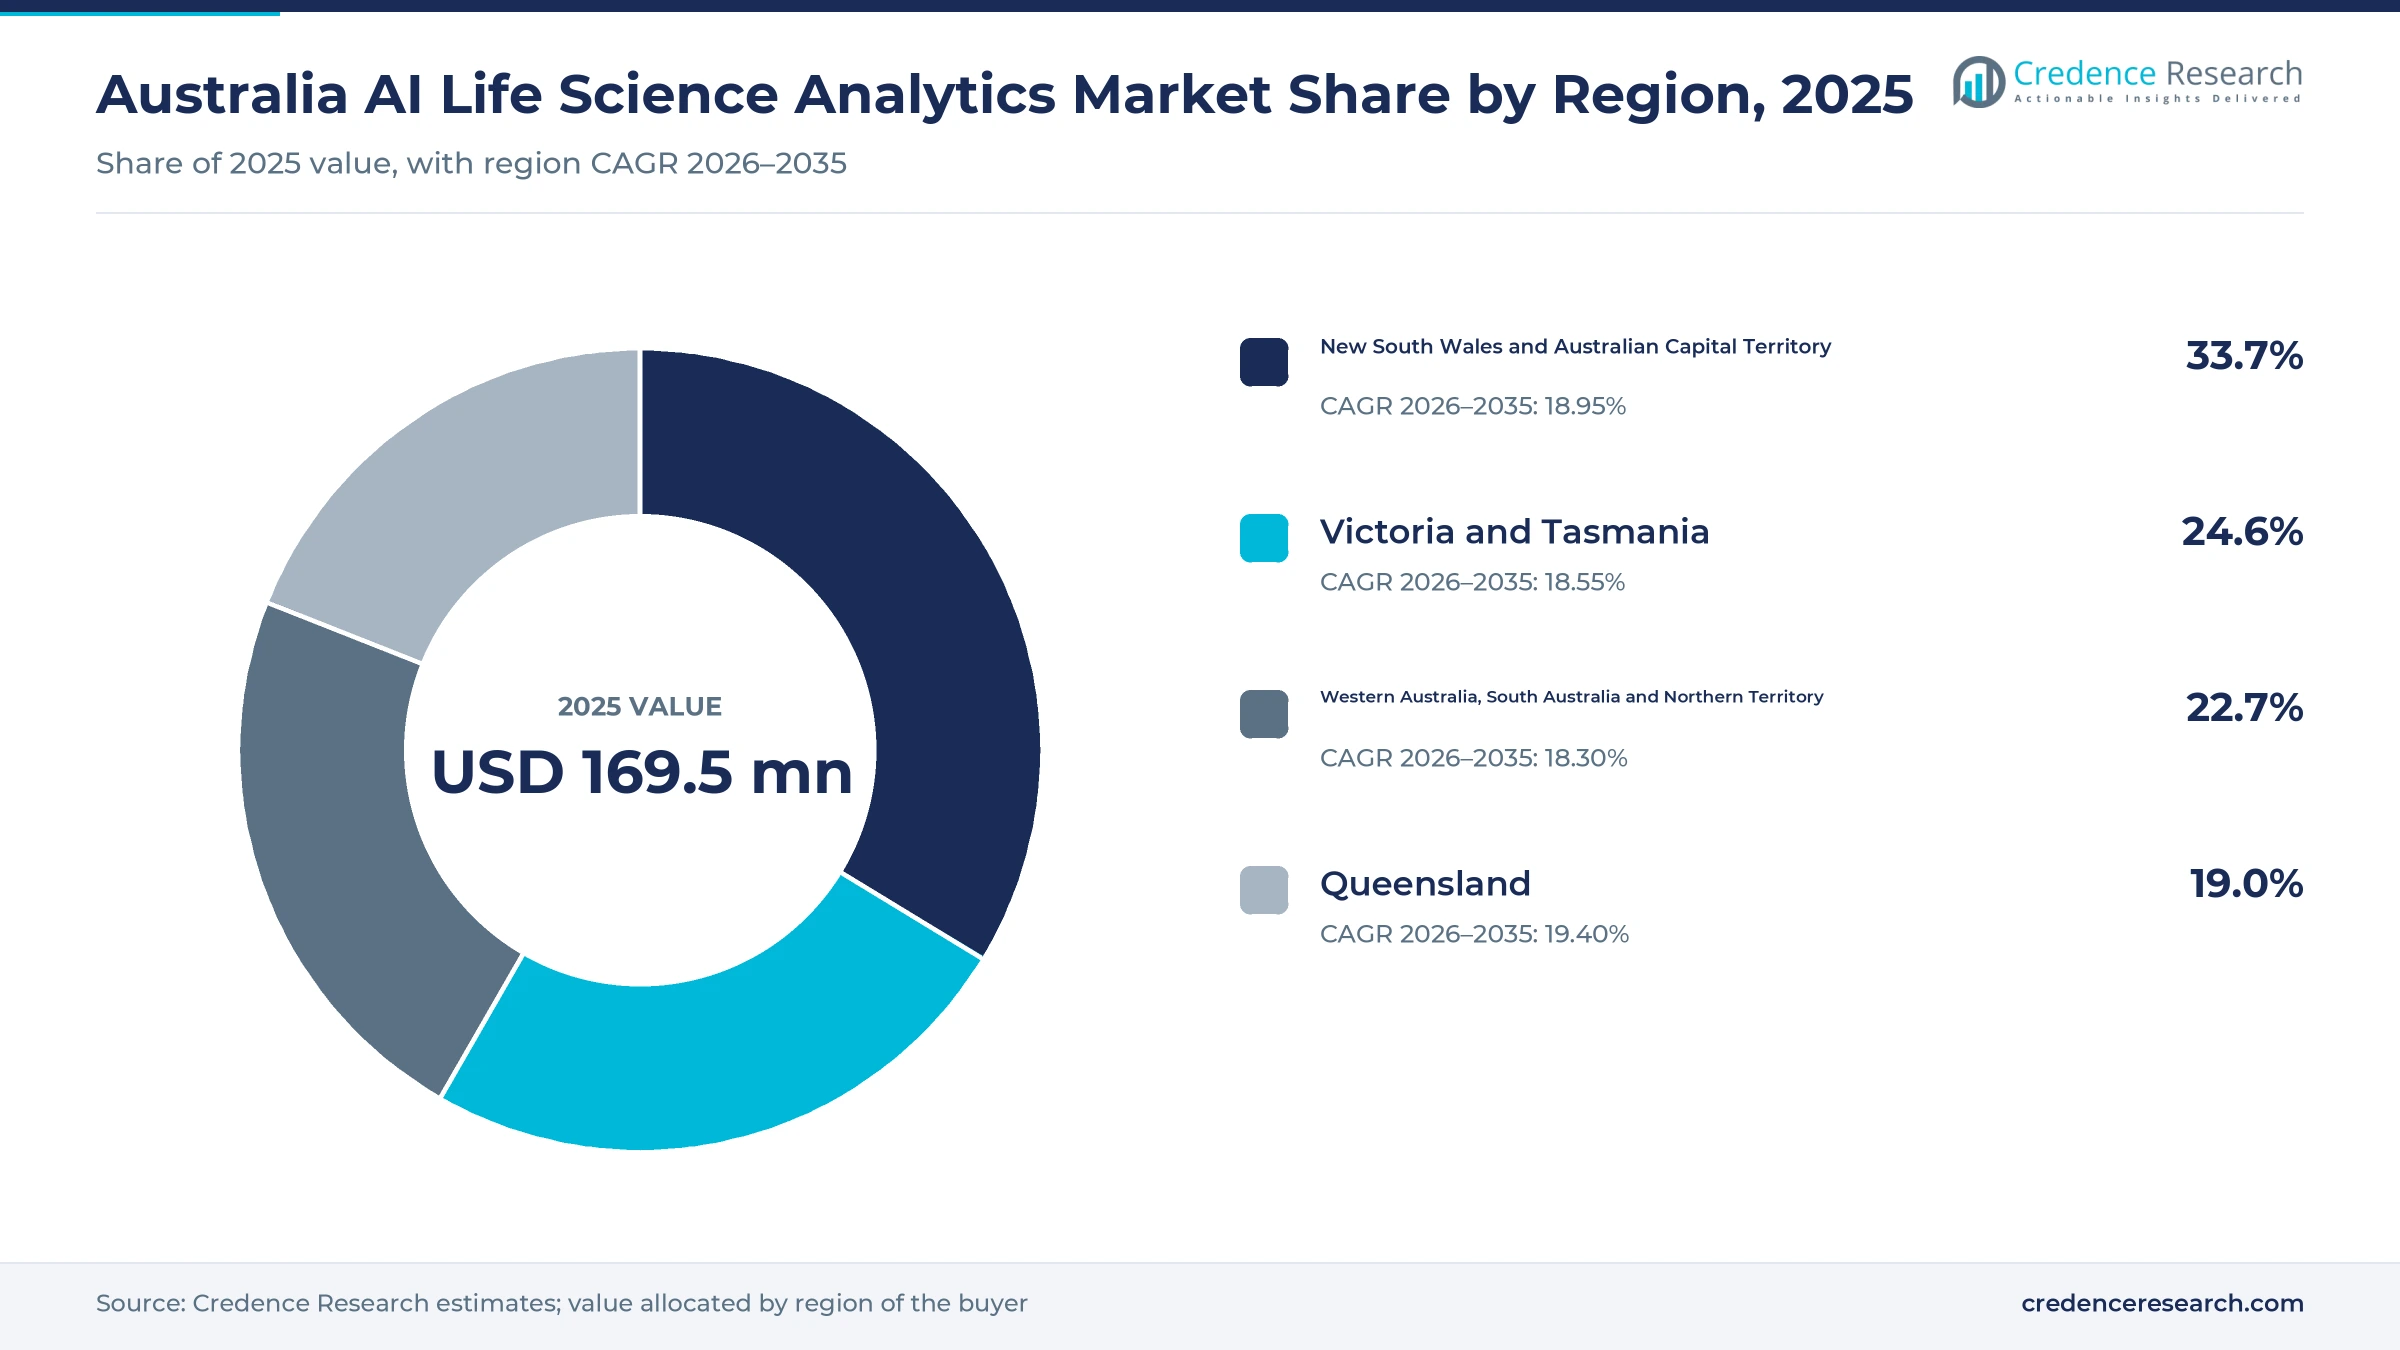
The Australia AI life science analytics market was valued at USD 169.5 million in 2025 and is projected to increase from USD 208.0 million in 2026 to USD 980.0 million by 2035, registering a CAGR of 18.79% during 2026–2035. Demand comes from public hospital networks, diagnostic groups, drug developers and research institutes that need software to read imaging, pathology, genomic and trial data at scale. New South Wales and Australian Capital Territory held the largest regional share, 33.7% in 2025, because BreastScreen NSW and the state Single Digital Patient Record sit there alongside Sydney vendors. Queensland is the fastest-growing region at 19.40% a year as Queensland Health and CSIRO expand their long-running digital partnership. The main regulatory change came on Oct. 16, 2026, when the Therapeutic Goods Administration said most reviewed digital scribes probably qualify as medical devices. As a result, suppliers now have to document clinical functions much earlier in the product cycle.
What does AI life science analytics cover for Australian buyers?
The market counts software, embedded decision support and managed services that apply machine learning to clinical, diagnostic, imaging, genomic, drug development and commercial pharmaceutical data. Buyers purchase through enterprise licenses, usage-metered contracts and fixed service agreements, usually after a clinical governance review. Public networks often buy through state budgets and tenders, while drug developers and contract research groups buy directly from platform vendors.
Scanners, sequencers, laboratory instruments and general hospital record systems are excluded, although they supply most of the data these tools analyze. General productivity software and consumer health apps are also excluded. The value chain runs from data holders and cloud hosts through model developers and integrators to the clinicians, scientists and commercial teams that use the outputs.
Australia AI Life Science Analytics Market Insights
- The market grows from USD 169.5 million in 2025 to USD 980.0 million by 2035, at an 18.79% CAGR, as diagnostic and clinical development workloads move to machine-assisted review.
- New South Wales and Australian Capital Territory led with 33.7% of 2025 value, supported by statewide screening, record and scribe programs funded through NSW Health.
- Hospitals and Diagnostic Providers held 46.0% of 2025 value because public networks and diagnostic groups carry the largest routine imaging and pathology workloads.
- The Therapeutic Goods Administration found on Oct. 16, 2026, that eight of 12 reviewed digital scribes likely qualify as devices, raising evidence requirements for suppliers.
- Microsoft committed A$25 billion through 2029 and Amazon A$20 billion through 2029, expanding the local cloud capacity that hosted health workloads depend on.
Hospital buyers and software platforms set the spending mix
Why software platforms hold the largest solution share
Based on solution type, the market is categorized into analytics software platforms, embedded AI decision support and managed analytics services. Analytics Software Platforms led with 52.0% of 2025 value because large buyers license reusable tools across many sites, and Harrison.ai reported that Annalise.ai is available to about one in two Australian radiologists, according to BioSpectrum Asia in February 2025. Embedded AI Decision Support grows fastest at 19.64% a year as the 2026-27 NSW Budget set aside A$38.7 million for scribe technology covering up to 6,000 clinicians, according to Medical Republic in July 2026.
Clinical review leads while genomic analysis gains pace
Based on application, the market is categorized into clinical and diagnostic, drug discovery and pharma R&D, medical imaging, genomics and precision medicine, and commercial pharma and market analytics. Clinical & Diagnostic AI Analytics led with 31.0% of 2025 value because clinical software already reaches routine care, with the regulator reviewing 12 digital scribe products and finding eight likely to be medical devices, according to Medical Republic in October 2026. Genomics & Precision Medicine Analytics grows fastest at 19.88% a year as Genomics Australia received more than A$30 million for its first four years, and the federal government awarded A$50 million for 30 genomics projects, according to the Department of Health.
Public networks and diagnostic groups anchor spending
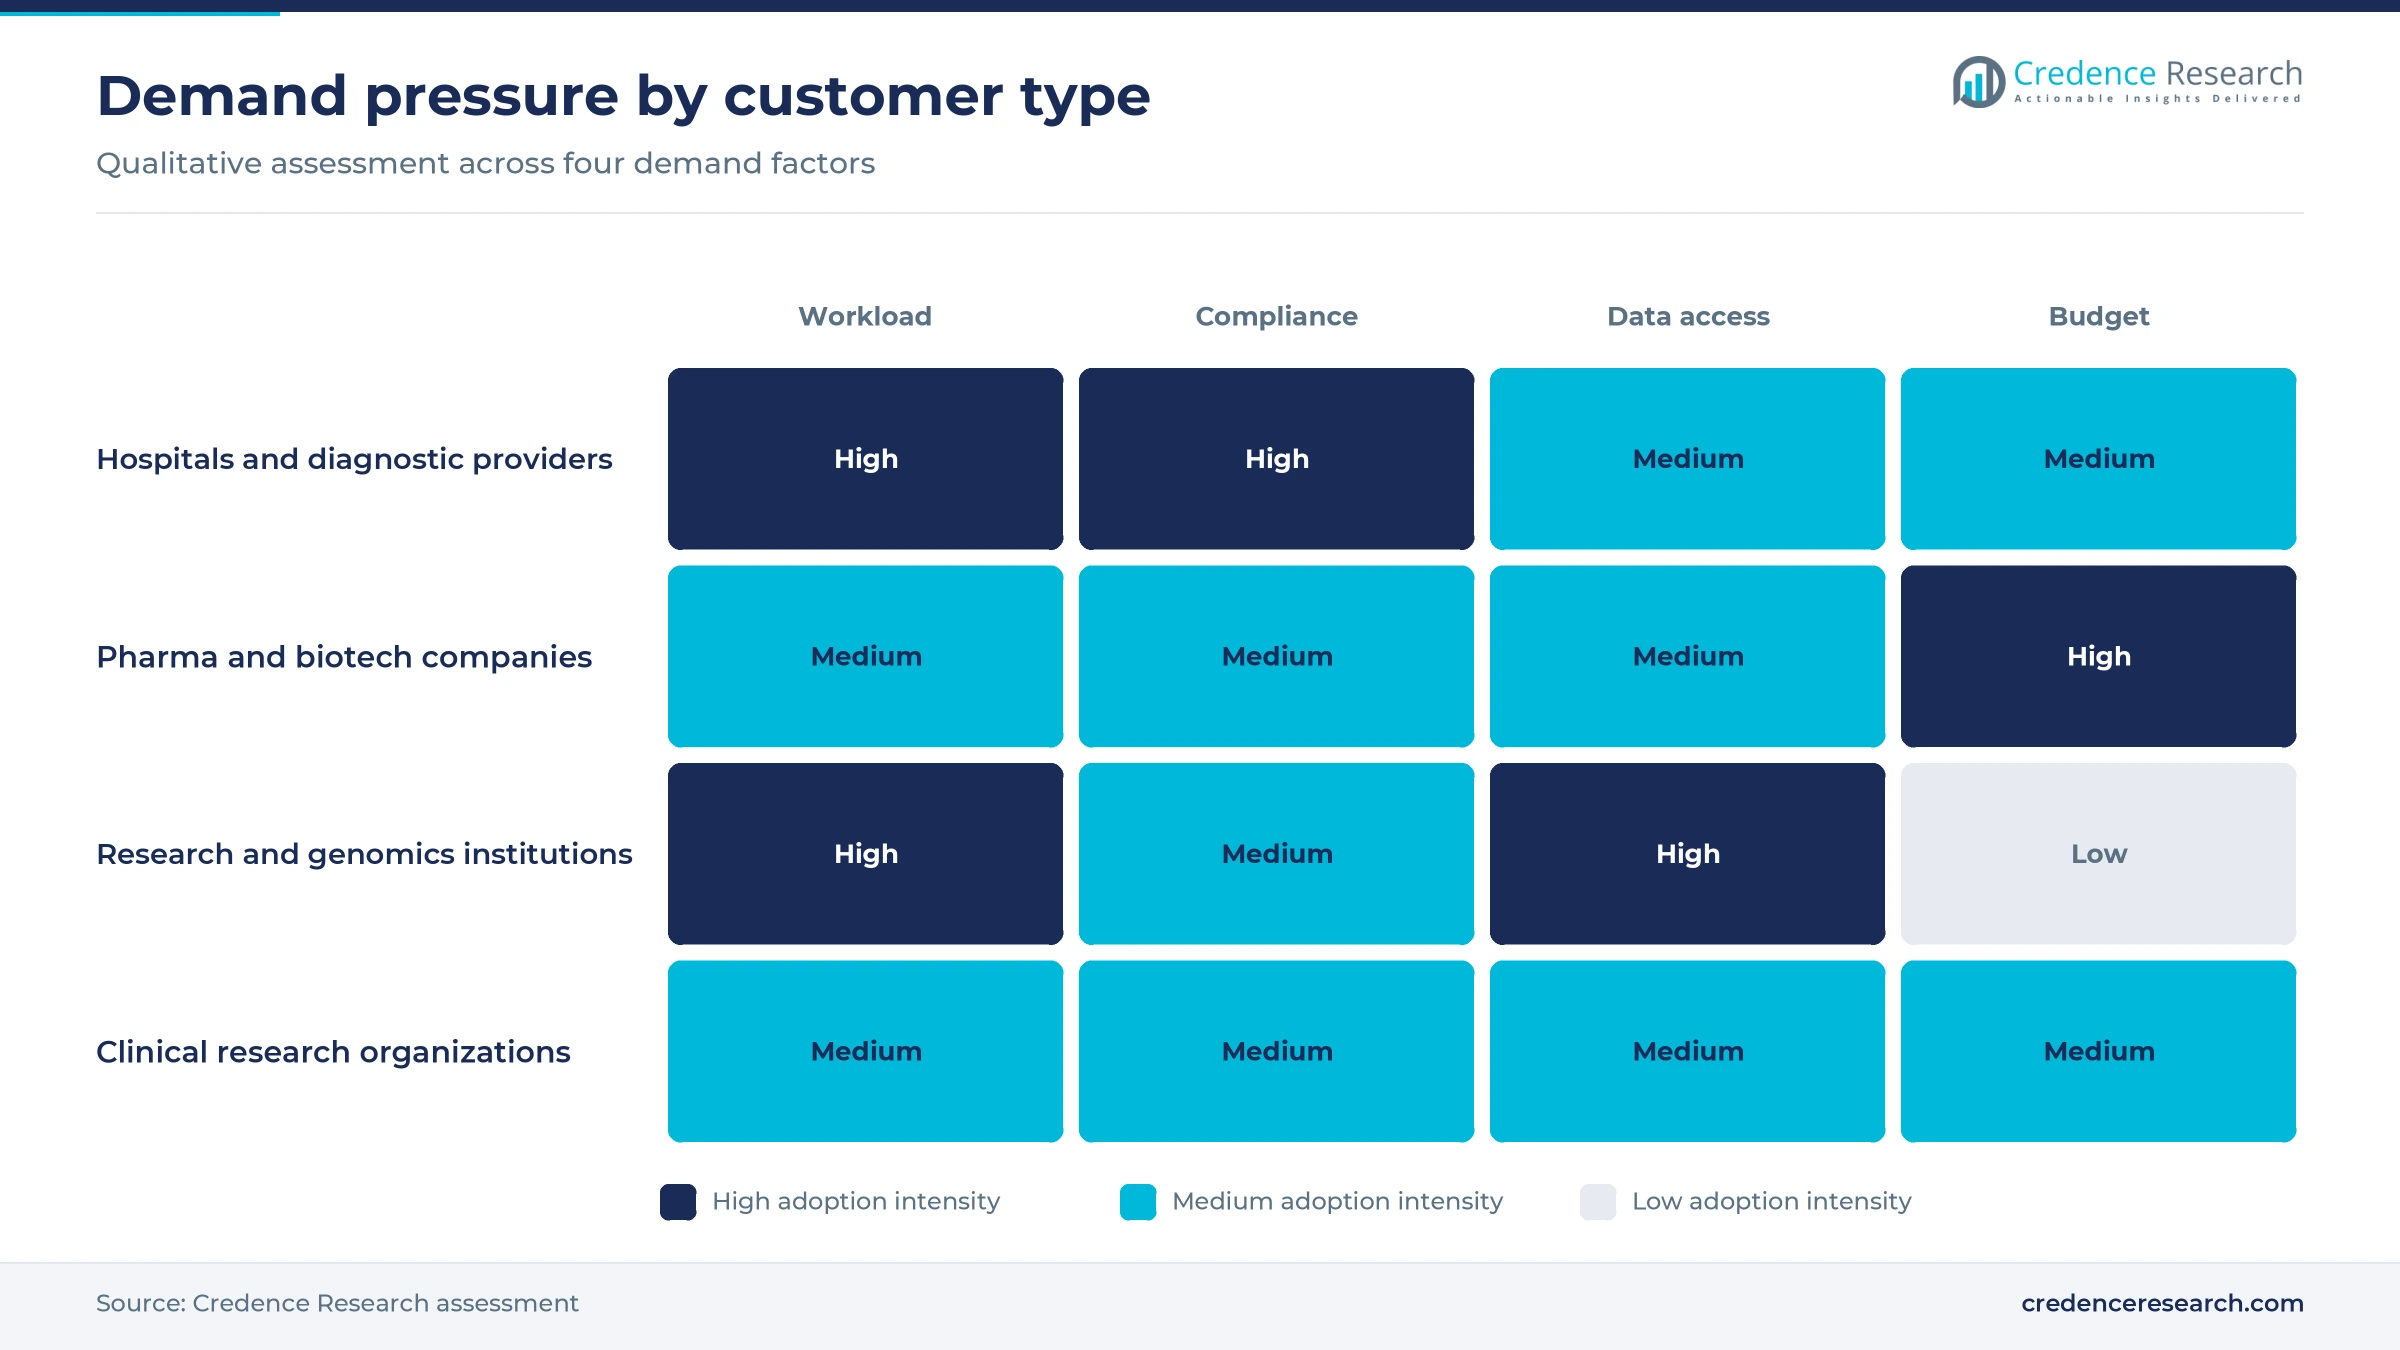
Based on customer type, the market is categorized into hospitals and diagnostic providers, pharmaceutical and biotechnology companies, research and genomics institutions, and clinical research organizations. Hospitals and Diagnostic Providers led with 46.0% of 2025 value because NSW Health is connecting nine record platforms, 10 patient administration systems and five pathology laboratory systems through its Single Digital Patient Record, according to Healthcare IT News. Clinical Research Organizations grow fastest at 19.53% a year as Medicines Australia counted 54% growth in early-phase trials between 2016 and 2022, which increases feasibility and recruitment work for contract groups.
Cloud hosting leads as hybrid estates keep expanding
Based on deployment model, the market is categorized into cloud-hosted SaaS platforms, on-premise enterprise platforms and hybrid enterprise platforms. Cloud-Hosted SaaS Platforms led with 58.0% of 2025 value because local capacity is growing quickly, with Amazon committing A$20 billion between 2025 and 2029 on June 14, 2025, according to W.Media. Hybrid Enterprise Platforms grow fastest at 19.26% a year as hospital data remains spread across legacy systems, and NSW Health alone must integrate nine record platforms during its statewide program, according to Healthcare IT News, which favors a mixed architecture.
| Segment Group | Leading Sub-segment | Share, 2025 | Fastest-growing Sub-segment | CAGR, 2026–2035 |
|---|---|---|---|---|
| By Solution Type | Analytics Software Platforms | 52.0% | Embedded AI Decision Support | 19.64% |
| By Application | Clinical & Diagnostic AI Analytics | 31.0% | Genomics & Precision Medicine Analytics | 19.88% |
| By Customer Type | Hospitals and Diagnostic Providers | 46.0% | Clinical Research Organizations | 19.53% |
| By Deployment Model | Cloud-Hosted SaaS Platforms | 58.0% | Hybrid Enterprise Platforms | 19.26% |
Request a Free Sample
Fill in your details and we'll send you a free sample report.
- Sample data tables & charts
- Research methodology
Upload mandates and trial volume are lifting budgets
Diagnostic workflow expansion under imaging and screening strain
Diagnostic services are the clearest source of demand because reading capacity has not kept pace with routine volume, and World Bank data put Australian health spending at 10.4% of GDP in 2023. Gold Coast University Hospital had a backlog of more than 50,000 images in July 2023 and later went to tender for an AI radiology trial, according to AAP. BreastScreen NSW screens up to 350,000 women a year, and Lunit reports a retrospective study of 650,000 mammograms. Harrison.ai also raised US$112 million in February 2025, with its radiology product available to about one in two Australian radiologists, according to BioSpectrum Asia. As a result, Hospitals and Diagnostic Providers held 46.0% of 2025 value, and diagnostic groups now treat these tools as capacity.
Clinical development automation across a busy trial base
Trial sponsors are adopting analytics because Australia competes on speed in early-phase studies. Medicines Australia reported that industry started more than 640 clinical trials in 2022, involving about 90,000 participants, and the same fact sheet shows Phase 1 and Phase 2 activity grew 54% between 2016 and 2022. The federal government has also committed A$18.8 million to a National One Stop Shop for clinical trials, which should standardize the data sponsors need. Meanwhile, the CSIRO Oscar search engine covers more than 300,000 clinical trials and 25 million medical articles, according to its 2024-25 annual report. Together these figures support the 19.53% annual growth expected from Clinical Research Organizations, whose trial management systems and recruitment work depend on faster data review.
Interoperability investment that makes clinical data usable
Federal interoperability spending matters because analytics tools can only scale when clinical data arrives in a consistent form. Under sharing-by-default reforms described by the Australian Digital Health Agency, pathology and diagnostic imaging providers must upload written reports by default once rules are made and a six-month delay has passed. Non-compliant providers could be told to repay Medicare payments for the service, and civil penalties may also apply, according to the Australian Digital Health Agency. The Australian Digital Health Agency also awarded Telstra Health an A$33 million contract in August 2025 to modernize My Health Record around FHIR standards, according to HLTH. In addition, the CSIRO-backed Sparked community passed 1,200 members and released AU Core v1.0.0 in 2024-25, which gives vendors a shared national specification.
Public genomics funding that creates new analytical workloads
Genomics is a growing analytics workload because public funding is producing data sets that clinicians cannot interpret manually. The Department of Health said Genomics Australia received more than A$30 million for its first four years, with ongoing funding committed, and that the Medical Research Future Fund has invested more than half a billion dollars across 190 genomics projects. Omico expected its PrOSPeCT program to provide free genomic profiling to more than 23,000 Australians by the end of 2025, according to its Feb. 6, 2025 update. Federal funding also gave UNSW A$2.95 million to predict antidepressant response using AI and genomic data, according to Healthcare IT News. These programs support Genomics & Precision Medicine Analytics growth of 19.88% a year.
Regulators and cloud builders are reshaping the buying case
A shift toward device-grade evidence for clinical software
Buyers are shifting toward products with device-grade evidence because the regulator has narrowed the gray area around clinical software. In its July 2025 report on medical device software, the Therapeutic Goods Administration made 14 findings after 53 consultation responses and sessions with 305 stakeholders. It then found eight of 12 reviewed digital scribes likely meet the medical device definition, and none of the 12 suppliers had identified its software as a device, according to Medical Republic in October 2026. CSIRO also achieved ISO 13485 certification for software as a medical device in 2024-25, according to its annual report. Consequently, Embedded AI Decision Support, growing at 19.64% a year, increasingly needs documented intended use and post-market monitoring.
The rise of local cloud capacity for regulated health workloads
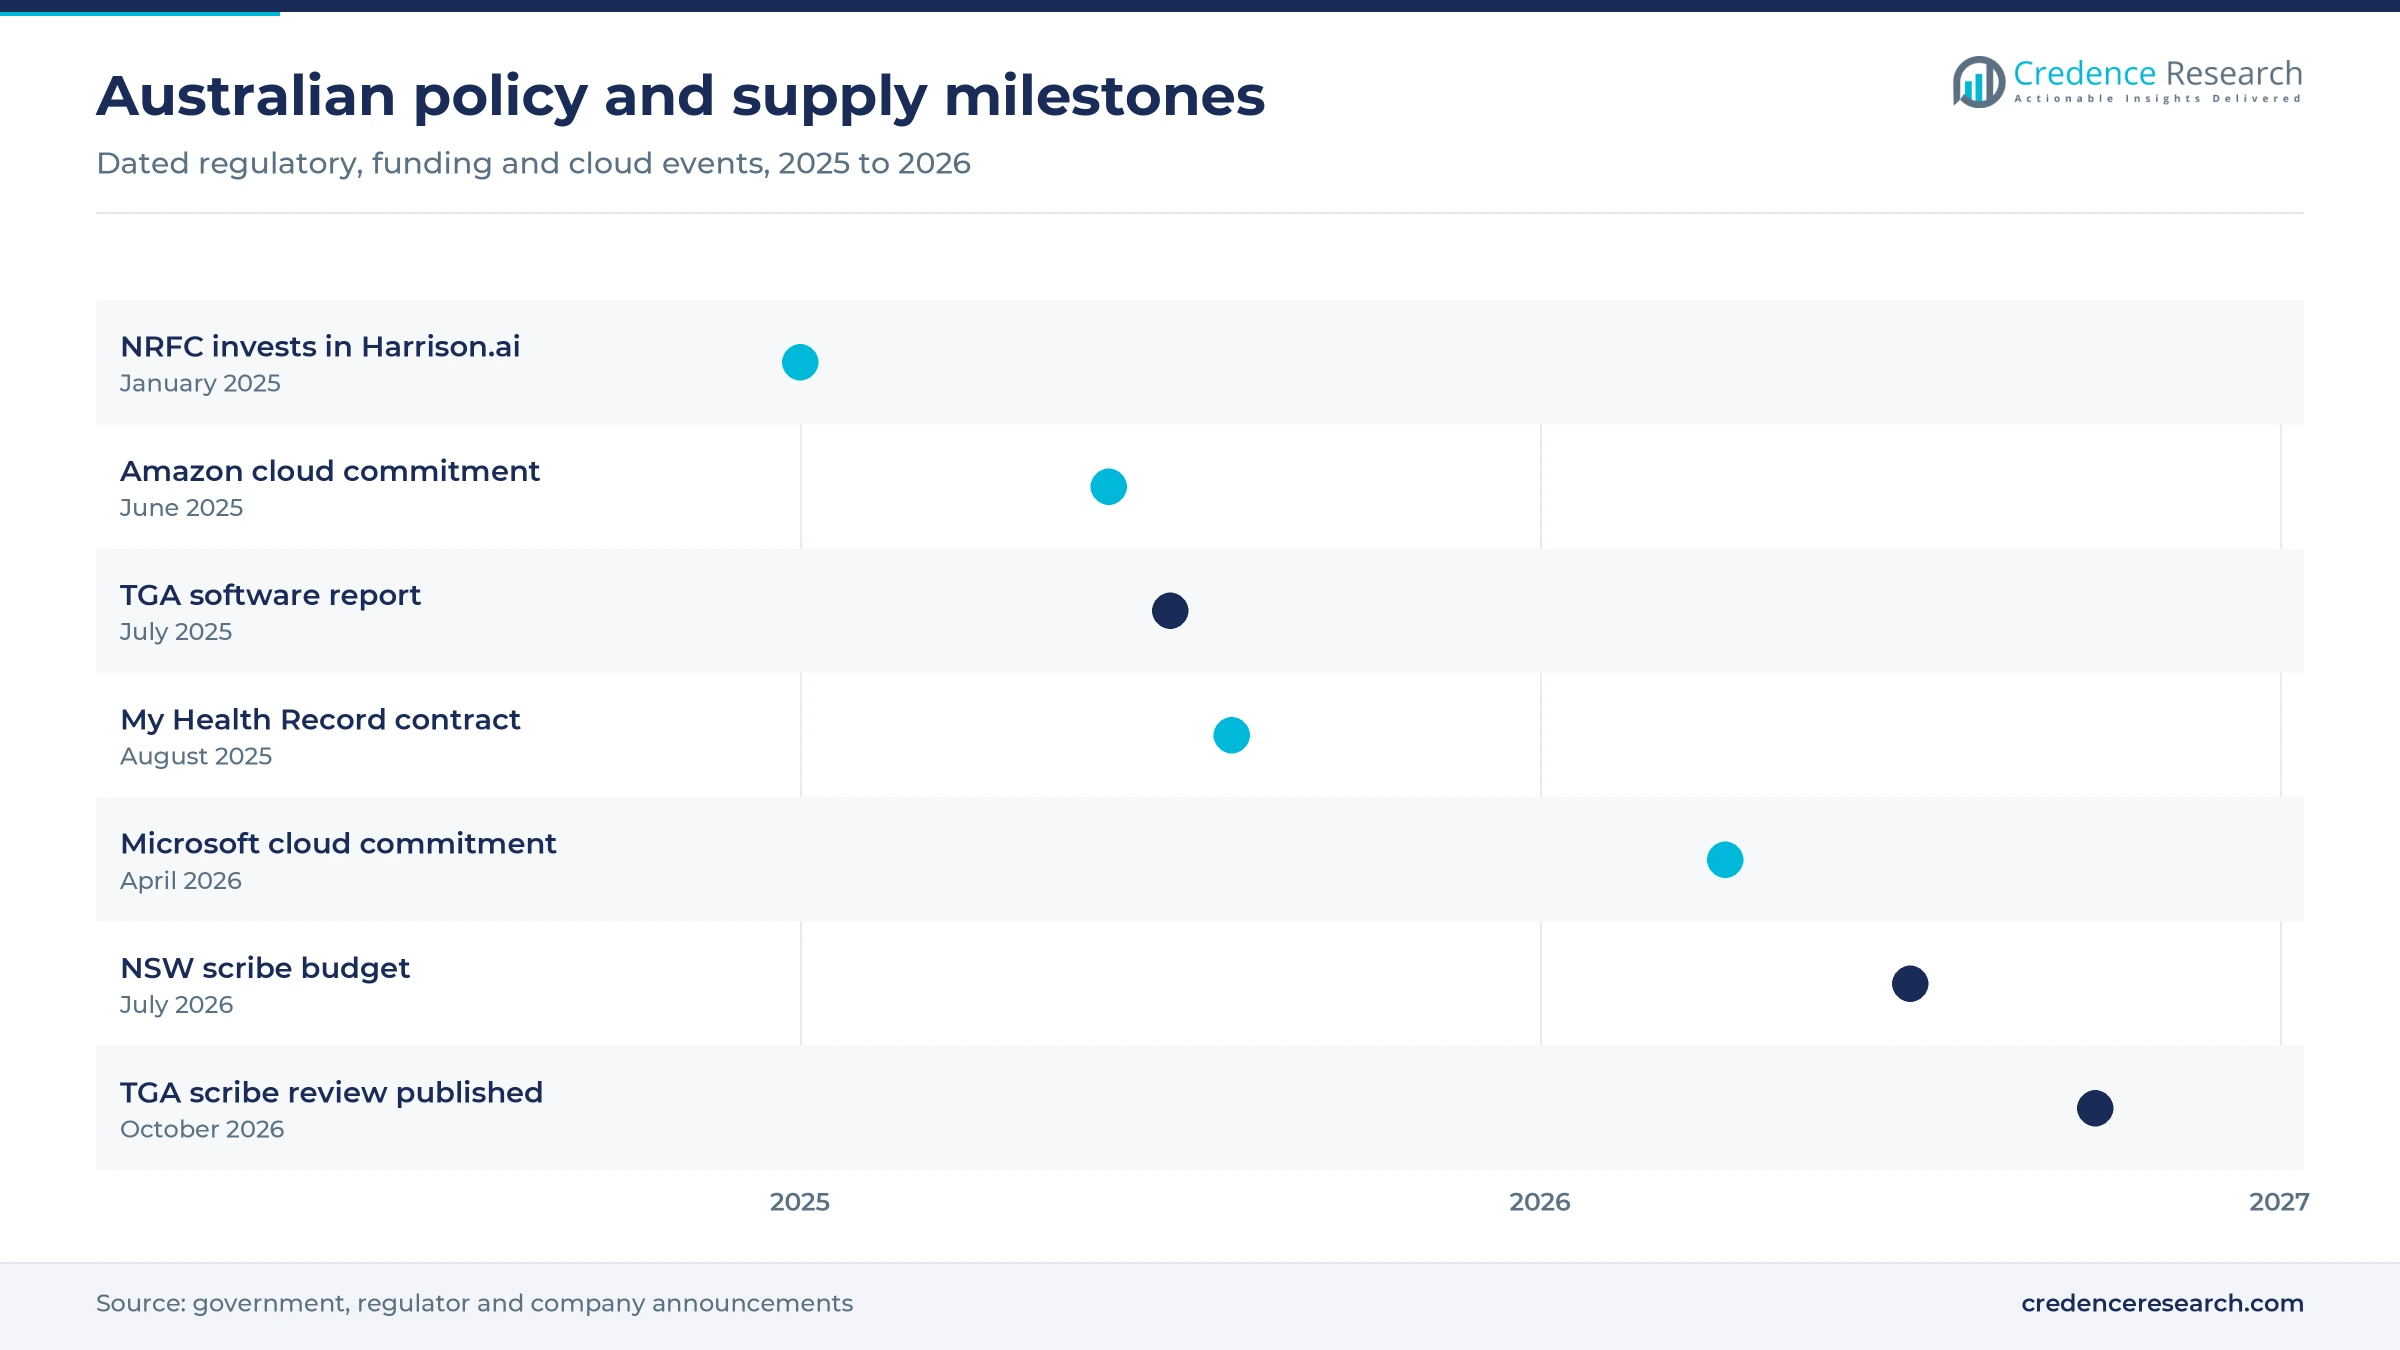
Local cloud capacity is rising fast, which makes hosted analytics easier to approve for sensitive clinical and research data. Microsoft committed A$25 billion through the end of 2029 on April 23, 2026, and said its Australian cloud footprint would expand to more than 140% of current levels, according to W.Media. Amazon separately committed A$20 billion for 2025 to 2029, according to IT Brief Australia. CSL then said on Sept. 29, 2026, that it would use Amazon Web Services across its research and clinical development pipeline, according to iTnews. These commitments help explain why Cloud-Hosted SaaS Platforms held 58.0% of 2025 value, because buyers no longer have to choose between scale and domestic hosting.
Opportunity in population-scale genomic interpretation tools
Genomic interpretation offers a clear opening for specialist vendors because public programs are generating more results than specialists can review. Omico reported referrals from more than 1,300 clinicians and programs reaching more than 22,300 Australians since 2016, according to its February 2025 update. On March 31, 2026, Anthropic also named the Garvan Institute of Medical Research and Murdoch Children's Research Institute as partners using its Claude model for rare disease and genomic discovery work. In addition, precision medicine programs need reporting that clinicians can act on quickly. Vendors that connect variant interpretation with trial matching could therefore win work that general imaging suppliers do not yet serve.
Opportunity in pharma analytics built on national medicine data
Commercial and access analytics offer another opening because Australian reimbursement generates dense national data and long access timelines. The Pharmaceutical Benefits Scheme recorded 226 million subsidized prescriptions and A$19.1 billion in government spending during 2024-25, covering 949 listed medicines, according to the Department of Health. Medicines Australia also reports an average wait of 466 days between regulatory approval and subsidized access, which gives sponsors a reason to model evidence earlier. Sydney-founded Prospection already serves this need with real-world data platforms for drug makers and researchers. Local tools for drug discovery could extend the same real-world evidence into earlier research decisions.
Device rules and siloed data slow enterprise rollouts
Medical device classification raises supplier compliance costs
The regulator signaled closer oversight in October 2026 when it said its scribe review would guide further compliance work and clarification of obligations, according to Medical Republic. Suppliers whose tools suggest diagnoses or treatments therefore face new documentation and possible registration costs. Smaller vendors are most exposed because few have regulatory teams. Early classification advice and clearer intended-use statements reduce this risk, although they lengthen product release cycles for scribe and decision support tools.
Siloed health data limits model training and scale
The Productivity Commission said in December 2024 that Australian health data remains siloed, disconnected and short of shared standards. Vendors therefore spend heavily on integration, and NSW alone is linking nine record platforms and 10 patient administration systems through its statewide program. Hospital networks feel this as slower deployment and higher project costs. National FHIR specifications should ease the burden gradually, although older systems will keep many projects bespoke for several more years.
Overseas models and approvals may not fit local patients
The Productivity Commission warned in December 2024 that overseas-trained models may under-represent some groups and mislead in Australian settings. The regulator also reported that more than 85% of devices supplied locally, excluding self-certified products, rely on overseas certification. Hospitals consequently need local validation before relying on imported tools, which adds time and cost. BreastScreen NSW shows the scale involved, because its implementation spanned nearly five years after an initial 2019 tender, according to Lunit.
Scarce dual-skilled staff and privacy concerns slow adoption
Peter van Wijngaarden of The Florey told iTnews that clinical and AI skills together remain rare, describing a huge capability gap in Australian medical research. Public trust adds further pressure, because the Productivity Commission cited research showing 74% of Australians would share data for medical research, with willingness falling when a private company profits. Research institutes and smaller buyers feel both of these limits most directly. Managed services and clear data governance can partly offset them, although specialist staff remain costly.
New South Wales leads while Queensland gains fastest
| Region | Value, 2025 (USD million) | Share, 2025 | CAGR, 2026–2035 |
|---|---|---|---|
| New South Wales and Australian Capital Territory | 57.1 | 33.7% | 18.95% |
| Victoria and Tasmania | 41.7 | 24.6% | 18.55% |
| Western Australia, South Australia and Northern Territory | 38.5 | 22.7% | 18.30% |
| Queensland | 32.2 | 19.0% | 19.40% |
New South Wales and Australian Capital Territory lead on statewide programs
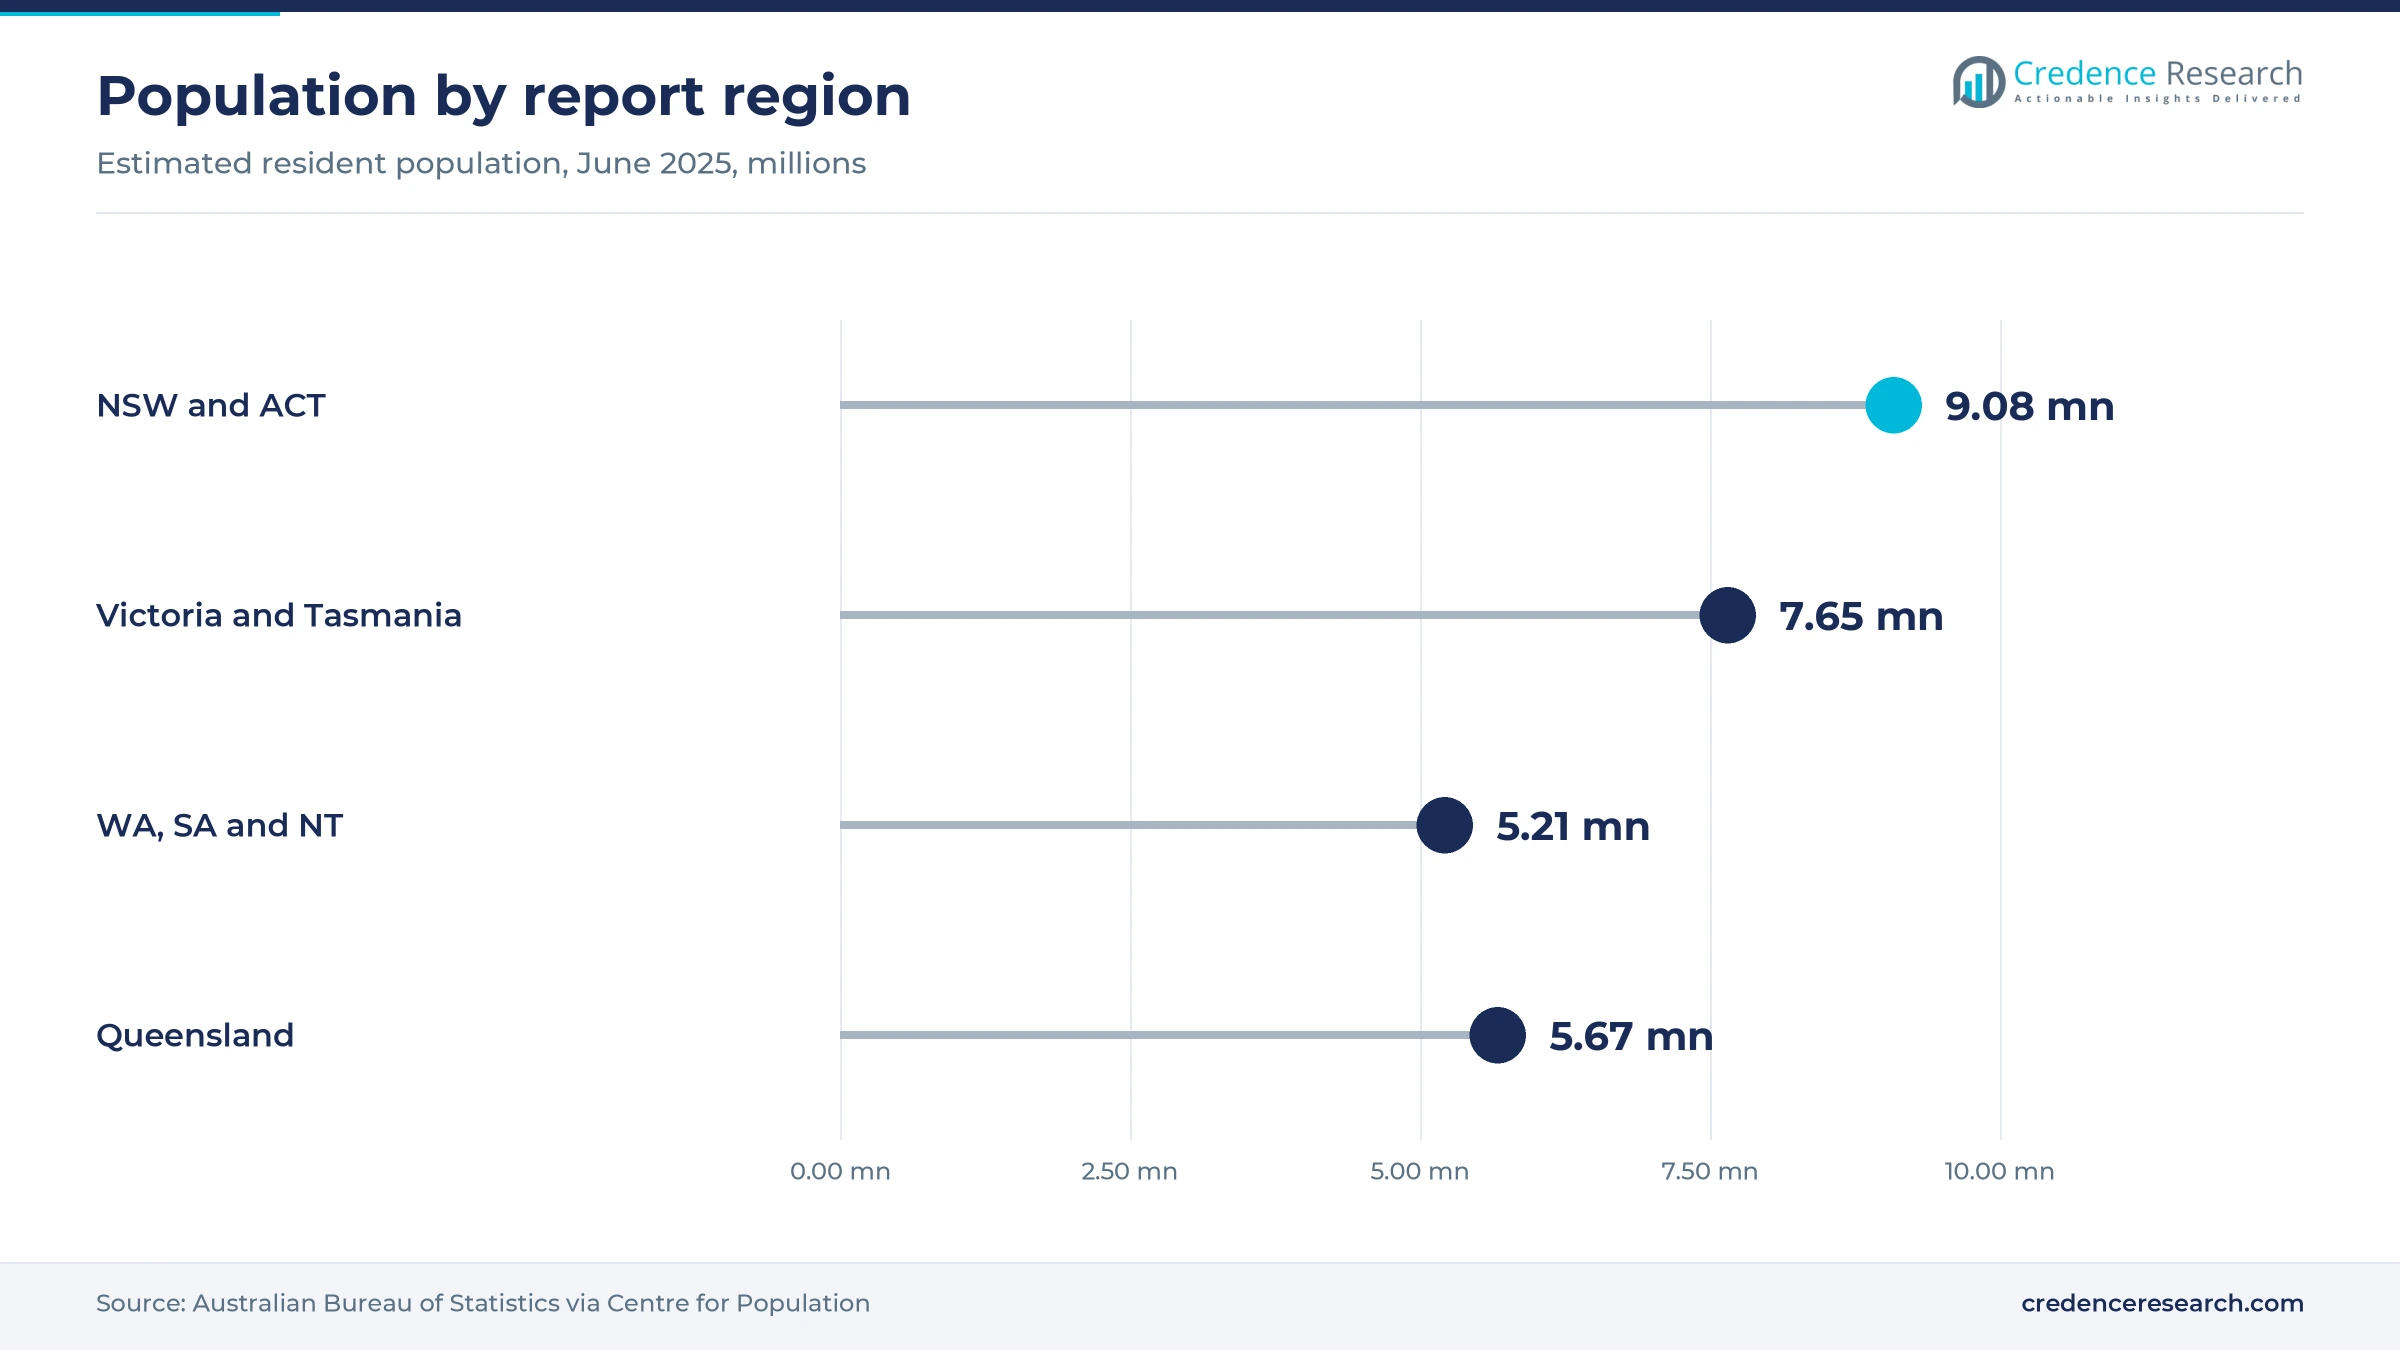
New South Wales and Australian Capital Territory held 33.7% of 2025 value and grows at 18.95% a year. The zone had about 9.08 million residents at June 2025, according to the Australian Bureau of Statistics, but its share also reflects unusually large programs. BreastScreen NSW, the Single Digital Patient Record and an A$38.7 million scribe budget all sit here. Sydney also hosts Harrison.ai and Franklin.ai, so buyers and vendors work closely together on validation.
Victoria and Tasmania draw on research institutes
Victoria and Tasmania held 24.6% of 2025 value and grow at 18.55% a year. The zone had about 7.65 million residents at June 2025, according to the Australian Bureau of Statistics, and its demand leans toward research and imaging software. Pro Medicus is based in Richmond, Victoria and describes itself as a gateway for image-based AI. Peter MacCallum Cancer Centre was assigned testing and trials for PrOSPeCT, while Ambulance Victoria launched a telestroke service for regional patients.
Queensland gains fastest through public partnerships
Queensland held 19.0% of 2025 value and grows at 19.40% a year, the fastest pace among the four zones. Queensland Health renewed its CSIRO e-health partnership in 2022, and the Medtex language platform now supports state cancer notifications, according to the CSIRO annual report. Its M♡THer tool has been adopted by eight Queensland hospitals. Gold Coast University Hospital also moved to tender for AI radiology after a backlog above 50,000 images, which shows direct operational demand.
Western and southern states build from targeted projects
Western Australia, South Australia and Northern Territory held 22.7% of 2025 value and grow at 18.30% a year. These jurisdictions had about 5.21 million residents at June 2025, according to the Australian Bureau of Statistics, so spending is more project-led. Western Australia awarded nearly A$1 million to 19 generative AI health projects, according to Healthcare IT News. In 2021, SA Pathology data supported AI research with the Australian Institute for Machine Learning, and CSIRO keeps offices in both Adelaide and Perth.
Funding, cloud and regulatory moves from 2025 to 2026
| Development | Status and market relevance |
|---|---|
| In January 2025, the National Reconstruction Fund Corporation invested A$32 million in Harrison.ai, according to Startup Daily. | Completed; the funding partly supports expansion into more Australian hospitals and facilities. |
| In April 2026, Microsoft committed A$25 billion to Australian cloud, AI and cybersecurity capacity through 2029. | Announced; it expands the hosted capacity available to health and research workloads. |
| In June 2026, Pro Medicus agreed to a A$10 million investment in Echo IQ, after investing A$10 million in 4DX during July 2025. | Agreed; the Victorian company plans to resell algorithms where applicable. |
| In July 2026, the NSW Budget allocated A$38.7 million for scribe technology covering up to 6,000 public clinicians. | Funded; NSW Health has not named a supplier or a rollout date. |
| In October 2026, the Therapeutic Goods Administration published its digital scribe review, finding eight of 12 products likely to be devices. | Published; targeted compliance work and further guidance are planned. |
Models, standards and gateways shape product choices
- Imaging models flag findings on chest X-rays and head CT scans, and Startup Daily reported that Harrison.ai covers up to 124 and 130 findings respectively.
- Pathology assistants act as a second reviewer in digital pathology, which is the role of the Sonic Healthcare and Harrison.ai venture Franklin.ai.
- FHIR specifications give vendors common structures for electronic health records, and Sparked released AU Core v1.0.0 during 2024-25.
- Language models turn free text into usable data, and CSIRO reported a 92% F1-score for identifying emergency department pain from 2,000 samples.
Need a Custom Version of This Report?
Tailor the scope, geography, or segments to your exact requirements.
- Custom geography or segment scope
- Direct access to our analyst team
Sydney and Melbourne vendors compete with global platforms
Competition in life science analytics splits between Australian specialists and global platforms that host or distribute their tools. Harrison.ai and its pathology venture Franklin.ai compete on local validation and clinical reach, while Pro Medicus uses its imaging software position to host its own and third-party algorithms. Lunit competes through population screening evidence, with BreastScreen NSW as its reference program. Telstra Health is strongest in national infrastructure after winning the My Health Record modernization contract, whereas Prospection and Novotech address pharmaceutical evidence and late-phase studies through a partnership announced in February 2022. Cloud suppliers shape the field indirectly because their capacity and research agreements influence where workloads run. Buyers increasingly compare vendors on regulatory status, integration effort and local evidence rather than headline accuracy, which favors companies with published validation and experienced clinical governance teams. As a result, partnerships between diagnostic groups and developers remain a common route to scale.
Companies profiled and their roles in this market
| Company | Type | Role in the market |
|---|---|---|
| Harrison.ai | Sydney developer | Radiology AI through Annalise.ai, available to about one in two Australian radiologists |
| Franklin.ai | Pathology venture | Sonic Healthcare and Harrison.ai joint venture building AI tools for pathologists |
| Pro Medicus | Imaging software company | Richmond-based imaging software company positioning as a gateway for image-based AI outputs |
| Telstra Health | Digital health integrator | A$33 million contract to modernize My Health Record around FHIR |
| Prospection | Pharma analytics developer | Sydney-founded real-world data platforms for drug makers and researchers |
| Novotech | Contract research organization | Partner and investor in Prospection for real-world evidence in late-phase trials |
| Lunit | Imaging AI supplier | AI platform supplier to the BreastScreen NSW program |
| Sonic Healthcare | Pathology group | Joint venture partner in Franklin.ai |
| Amazon Web Services | Cloud provider | Amazon committed A$20 billion for 2025 to 2029, and CSL uses AWS across its pipeline |
| Microsoft | Cloud provider | Committed A$25 billion through 2029 to Australian cloud and AI capacity |
Evidence and compliance will decide the next vendor winners
Credence Research's view is that evidence and compliance will separate life science analytics vendors more sharply than model performance through 2030. The Therapeutic Goods Administration review means many clinical tools must now justify their intended use, while mandatory upload rules should improve the data available for validation. Hospital buyers should expect longer procurement cycles but lower deployment risk once products clear these checks. Vendors with local clinical studies and FHIR-ready integration are best placed. The most uncertain assumption is how quickly public networks convert funded pilots into recurring budgets, because state allocations remain uneven and supplier decisions are often undisclosed.
How the Australian estimates were built
The report on life science analytics uses 2025 as the base year and forecasts values through 2035. Market values come from the Credence Research model, and regional and segment splits are Credence Research estimates informed by public data. Sources include government budgets, regulator reports, official population and medicine statistics, company announcements, annual reports and named trade publications. No interviews or surveys were conducted for this edition, and readers should treat segment shares and growth tilts as modeled estimates rather than reported statistics.
Genomics and embedded tools will carry growth to 2035
From USD 208.0 million in 2026, the market is forecast to reach USD 980.0 million by 2035 as life science analytics moves into routine diagnostic, genomic and trial work. Genomic interpretation and embedded decision support should gain share, while on-premise deployments should lose ground as hybrid and hosted systems mature. Upload obligations and FHIR specifications should steadily widen the usable data base during the period. However, device enforcement could slow some scribe and decision products in the near term. The strongest long-term position should belong to vendors that combine Australian validation with clear governance and dependable integration.
Frequently Asked Questions
How big is the Australia AI life science analytics market?
Which region leads the market?
Which region grows fastest?
Which customers spend the most?
Which application grows fastest?
How does regulation affect suppliers?
Why does interoperability matter here?
Which companies are active in Australia?
Table of Content
Chapter 1 Market Segmentation
- 1.1 Segmentation Framework
- 1.1.1 Product and Service Classification
- 1.1.2 Application and End-Use Classification
- 1.1.3 Technology and Solution Classification
- 1.1.4 Customer and Distribution Channel Classification
- 1.1.5 Geographic Segmentation
- 1.1.6 Market Segment Definitions and Boundaries
- 1.2 By Solution Type
- 1.2.1 Analytics Software Platforms
- 1.2.2 Embedded AI Decision Support
- 1.2.3 Managed Analytics Services
- 1.3 By Application
- 1.3.1 Clinical & Diagnostic AI Analytics
- 1.3.2 Medical Imaging AI Analytics
- 1.3.3 Drug Discovery & Pharma R&D Analytics
- 1.3.4 Genomics & Precision Medicine Analytics
- 1.3.5 Commercial Pharma & Market Analytics
- 1.4 By Customer Type
- 1.4.1 Hospitals and Diagnostic Providers
- 1.4.2 Pharmaceutical and Biotechnology Companies
- 1.4.3 Research and Genomics Institutions
- 1.4.4 Clinical Research Organizations
- 1.5 By Deployment Model
- 1.5.1 Cloud-Hosted SaaS Platforms
- 1.5.2 Hybrid Enterprise Platforms
- 1.5.3 On-Premise Enterprise Platforms
Chapter 2 Introduction
- 2.1 Report Objectives and Scope
- 2.2 Product Definition and Industry Terminology
- 2.3 Market Inclusions and Exclusions
- 2.4 Research Process
- 2.4.1 Primary Research and Expert Interviews
- 2.4.2 Secondary Research and Source Review
- 2.4.3 Top-Down and Bottom-Up Estimation
- 2.4.4 Data Triangulation and Verification
- 2.5 Market Size Measurement Basis
- 2.5.1 2025: USD 169.5 million → 2035: USD 980.0 million
- 2.6 Historical and Forecast Reference Periods
- 2.6.1 Historical Period: 2018-2025
- 2.6.2 Base Year: 2025
- 2.6.3 Forecast Period: 2025-2035
- 2.7 Research Assumptions and Limitations
Chapter 3 Executive Summary
- 3.1 Market Snapshot and Key Findings
- 3.2 Base-Year Market Size, 2025
- 3.3 Forecast Market Size, 2035
- 3.4 Revenue and Volume Growth Outlook
- 3.5 Key Demand and Supply Indicators
- 3.6 Leading Market Segments
- 3.7 Fastest-Growing Market Opportunities
- 3.8 Regional Performance Highlights
- 3.9 Technology and Industry Transformation
- 3.10 Competitive Landscape Summary
- 3.11 Analyst View and Strategic Implications
Chapter 4 Australia AI Life Science Analytics Market Trends and Developments
- 4.1 Historical Industry Development, 2018-2025
- 4.2 Recent Market Trends and Developments
- 4.3 Demand and Customer Behavior Trends
- 4.4 Technology and Product Innovation
- 4.5 Artificial Intelligence, Automation and Digitalization
- 4.6 Local Manufacturing and Supply Chain Realignment
- 4.7 Industry Partnerships, Mergers and Acquisitions
- 4.8 Sustainability and Circular Economy Developments
- 4.9 Government and Private Sector Investment Trends
- 4.10 Emerging Business Models and Commercialization
- 4.11 Industry Developments and Announcements
Chapter 5 Australia AI Life Science Analytics Market Supply and Demand Analysis
- 5.1 Demand Trend and Consumption Analysis, 2018-2025
- 5.2 Demand Forecast, 2025-2035
- 5.3 Supply Chain Structure and Procurement Trends
- 5.4 Supply-Demand Gap and Bottlenecks
- 5.5 Import Dependence and Sourcing Structure
- 5.6 Regional Supply and Demand Concentration
Chapter 6 Australia AI Life Science Analytics Market Pricing Analysis
- 6.1 Pricing Structure and Measurement
- 6.2 Historical Pricing Trends, 2018-2025
- 6.3 Pricing Outlook, 2025-2035
- 6.4 Pricing by Product and Market Segment
- 6.5 Geographic Pricing Differences
- 6.6 Key Input, Energy, Labor and Logistics Costs
- 6.7 Contract Pricing and Purchasing Models
- 6.8 Pricing Sensitivity and Competitive Positioning
- 6.9 Price, Margin and Profitability Implications
Chapter 7 Australia AI Life Science Analytics Market Dynamics
- 7.1 Market Growth Drivers
- 7.1.1 Demand-Side Drivers
- 7.1.2 Technology and Innovation Drivers
- 7.1.3 Infrastructure and Investment Drivers
- 7.1.4 Regulatory and Policy Drivers
- 7.2 Market Restraints
- 7.2.1 Cost and Affordability Constraints
- 7.2.2 Technology and Adoption Barriers
- 7.2.3 Supply Chain and Operational Constraints
- 7.3 Market Challenges
- 7.3.1 Competitive Pressure and Margin Erosion
- 7.3.2 Skills, Infrastructure and Implementation Gaps
- 7.4 Emerging Market Opportunities
- 7.5 Market Dynamics Impact and Time-Horizon Assessment
Chapter 8 Australia AI Life Science Analytics Value Chain Analysis
- 8.1 Industry Value Chain Overview
- 8.2 Upstream Suppliers and Critical Inputs
- 8.3 Technology and Component Providers
- 8.4 Manufacturing or Service Delivery
- 8.5 Distribution, Channel Partners and Integrators
- 8.6 Downstream Applications and End Users
- 8.7 Value Addition and Profit Pools
- 8.8 Vertical Integration and Outsourcing
- 8.9 Supplier Concentration and Risk
- 8.10 Supply Chain Localization and Resilience
Chapter 9 Australia AI Life Science Analytics Market Regulations and Policies
- 9.1 Relevant Laws, Standards and Compliance Frameworks
- 9.2 Product, Service, Safety and Quality Requirements
- 9.3 Government Policies, Incentives and Subsidies
- 9.4 Imports, Exports and Trade Barriers
- 9.5 Public Procurement and Local Content Requirements
- 9.6 Data Protection, AI and Cybersecurity Compliance
- 9.7 Upcoming Policy Changes and Market Implications
Chapter 10 Australia AI Life Science Analytics Market Hotspots and Opportunities
- 10.1 Market Opportunity Mapping and Growth Hotspots
- 10.2 High-Growth Applications and Customer Groups
- 10.3 Underserved Markets and White-Space Opportunities
- 10.4 Emerging Technology and Product Opportunities
- 10.5 New Capacity and Investment Hotspots
- 10.6 Market Entry and Expansion Opportunities
- 10.7 Distribution and Partnership Opportunities
- 10.8 Near-Term and Long-Term Commercial Potential
- 10.9 Opportunity Attractiveness and Execution Risks
Chapter 11 Australia AI Life Science Analytics Market Outlook, 2025-2035
- 11.1 Market Size and Analysis
- 11.1.1 Revenue (Market Measurement: 2025: USD 169.5 million → 2035: USD 980.0 million)
- 11.1.2 Historical Market Size, 2018-2025
- 11.1.3 Base-Year Market Size, 2025
- 11.2 Market Forecast, 2025-2035
- 11.2.1 Revenue Forecast to 2035
- 11.2.2 CAGR and Year-on-Year Growth
- 11.2.3 Incremental Revenue Opportunity
- 11.3 Forecast Assumptions and Scenario Analysis
- 11.3.1 Base-Case Forecast
- 11.3.2 Optimistic and Conservative Scenarios
- 11.3.3 Technology, Pricing and Policy Sensitivities
- 11.4 Market Attractiveness and Growth Outlook
Chapter 12 Australia AI Life Science Analytics Market Segmentation and Outlook
- 12.1 Segmentation Summary and Market Shares, 2025
- 12.2 Largest and Fastest-Growing Segments
- 12.3 By Solution Type - Market Size and Forecast, 2025-2035
- 12.3.1 Segment Definition and Scope
- 12.3.2 Historical Market Size, 2018-2025
- 12.3.3 Revenue Forecast, 2025-2035
- 12.3.4 Base-Year Market Share, 2025
- 12.3.5 Segment CAGR and Growth Drivers
- 12.3.6 Subsegment Market Size and Forecast
- 12.3.6.1 Analytics Software Platforms
- 12.3.6.2 Embedded AI Decision Support
- 12.3.6.3 Managed Analytics Services
- 12.3.7 Subsegment Pricing and Adoption Trends
- 12.3.8 Leading Suppliers and Competition
- 12.3.9 Regional Demand and Opportunities
- 12.4 By Application - Market Size and Forecast, 2025-2035
- 12.4.1 Segment Definition and Scope
- 12.4.2 Historical Market Size, 2018-2025
- 12.4.3 Revenue Forecast, 2025-2035
- 12.4.4 Base-Year Market Share, 2025
- 12.4.5 Segment CAGR and Growth Drivers
- 12.4.6 Subsegment Market Size and Forecast
- 12.4.6.1 Clinical & Diagnostic AI Analytics
- 12.4.6.2 Medical Imaging AI Analytics
- 12.4.6.3 Drug Discovery & Pharma R&D Analytics
- 12.4.6.4 Genomics & Precision Medicine Analytics
- 12.4.6.5 Commercial Pharma & Market Analytics
- 12.4.7 Subsegment Pricing and Adoption Trends
- 12.4.8 Leading Suppliers and Competition
- 12.4.9 Regional Demand and Opportunities
- 12.5 By Customer Type - Market Size and Forecast, 2025-2035
- 12.5.1 Segment Definition and Scope
- 12.5.2 Historical Market Size, 2018-2025
- 12.5.3 Revenue Forecast, 2025-2035
- 12.5.4 Base-Year Market Share, 2025
- 12.5.5 Segment CAGR and Growth Drivers
- 12.5.6 Subsegment Market Size and Forecast
- 12.5.6.1 Hospitals and Diagnostic Providers
- 12.5.6.2 Pharmaceutical and Biotechnology Companies
- 12.5.6.3 Research and Genomics Institutions
- 12.5.6.4 Clinical Research Organizations
- 12.5.7 Subsegment Pricing and Adoption Trends
- 12.5.8 Leading Suppliers and Competition
- 12.5.9 Regional Demand and Opportunities
- 12.6 By Deployment Model - Market Size and Forecast, 2025-2035
- 12.6.1 Segment Definition and Scope
- 12.6.2 Historical Market Size, 2018-2025
- 12.6.3 Revenue Forecast, 2025-2035
- 12.6.4 Base-Year Market Share, 2025
- 12.6.5 Segment CAGR and Growth Drivers
- 12.6.6 Subsegment Market Size and Forecast
- 12.6.6.1 Cloud-Hosted SaaS Platforms
- 12.6.6.2 Hybrid Enterprise Platforms
- 12.6.6.3 On-Premise Enterprise Platforms
- 12.6.7 Subsegment Pricing and Adoption Trends
- 12.6.8 Leading Suppliers and Competition
- 12.6.9 Regional Demand and Opportunities
- 12.7 Segment Growth Comparison
- 12.8 Segment Attractiveness and Priority Matrix
Chapter 13 Australia AI Life Science Analytics End-Use and Application Market Outlook
- 13.1 End-Use Industry and Customer Demand Structure
- 13.2 Leading Applications and Customer Groups
- 13.3 End-Use Market Size, Share and Forecast
- 13.4 Major End-Use Industry Deep Dives
- 13.4.1 Customer Requirements and Use Cases
- 13.4.2 Demand and Replacement Cycles
- 13.4.3 Technical and Regulatory Considerations
- 13.4.4 Purchasing and Procurement Models
- 13.4.5 Leading Vendors and Distribution Channels
- 13.4.6 Forecast and Commercial Opportunities
- 13.5 Emerging Applications and Cross-Segment Demand
- 13.6 End-Use Industry Investment Priorities
Chapter 14 Australia AI Life Science Analytics Geographic Market Outlook, 2025-2035
- 14.1 Domestic Market Distribution and Demand Clusters
- 14.2 State- or Province-Wise Market Size and Forecast, 2025-2035
- 14.3 City and Metropolitan Market Outlook
- 14.4 Industrial, Manufacturing and Commercial Clusters
- 14.5 Geographic Concentration of Key End Users
- 14.6 Local Pricing and Purchasing Differences
- 14.7 Domestic Production Facilities and Capacity Map
- 14.8 Local Infrastructure and Project Pipeline
- 14.9 State-Level Policy and Incentive Differences
- 14.10 Subnational Investment Hotspots and Opportunities
- 14.11 Distribution and Logistics Networks
- 14.12 Domestic Competitive Footprint
Chapter 15 Australia AI Life Science Analytics Technology, Innovation and Sustainability Outlook
- 15.1 Technology Landscape and Maturity
- 15.2 Product, Process and Service Innovation
- 15.3 AI, Automation and Digital Tools in the Industry
- 15.4 Technology Adoption and Performance Benchmarking
- 15.5 Innovation Pipeline and R&D Investment
- 15.6 Patent and Intellectual Property Trends
- 15.7 Energy Efficiency and Resource Management
- 15.8 Sustainability, Recycling and Circularity
- 15.9 Technology Roadmap, 2025-2035
- 15.10 Risks of Obsolescence and Technology Substitution
Chapter 16 Australia AI Life Science Analytics Market Key Strategic Imperatives
- 16.1 Growth and Market Entry Priorities
- 16.2 High-Return Products and Segments
- 16.3 Pricing, Profitability and Cost Optimization
- 16.4 Technology Investment and Product Differentiation
- 16.5 Supply Chain Localization and Resilience
- 16.6 Distribution and Customer Acquisition
- 16.7 Partnership, Acquisition and Capacity Strategy
- 16.8 Regional Expansion Priorities
- 16.9 Short-, Medium- and Long-Term Actions
Chapter 17 Competition Outlook
- 17.1 Industry Competition Characteristics
- 17.2 Market Structure and Concentration
- 17.3 Market Share and Competitive Positioning, 2025
- 17.4 Company-Wise Revenue and Product Benchmarking
- 17.5 Production and Service Capacity Benchmarking
- 17.6 Technology, Pricing and Differentiation
- 17.7 Regional Footprint and Distribution Strength
- 17.8 Mergers, Acquisitions and Strategic Alliances
- 17.9 New Entrants and Competitive Threats
- 17.10 Porter's Five Forces and Industry Attractiveness
- 17.11 Competitive Outlook, 2025-2035
Chapter 18 Company Profiles
- 18.1 Company Coverage and Selection Criteria
- 18.2 Harrison.ai
- 18.2.1 Business Description
- 18.2.2 Company Ownership and Geographic Presence
- 18.2.3 Product and Service Portfolio
- 18.2.4 Manufacturing and Operating Footprint
- 18.2.5 Financial Performance and Investment
- 18.2.6 Market Share and Competitive Position
- 18.2.7 Technology and Innovation Capabilities
- 18.2.8 Strategic Alliances or Partnerships
- 18.2.9 Recent Developments
- 18.2.10 Growth Strategy and Outlook
- 18.3 Franklin.ai
- 18.4 Pro Medicus
- 18.5 Telstra Health
- 18.6 Prospection
- 18.7 Novotech
- 18.8 Lunit
- 18.9 Sonic Healthcare
- 18.10 Amazon Web Services
- 18.11 Microsoft
- 18.12 Other Relevant Market Participants
Note: Every listed company is profiled on the structure shown under the first company. The company list is preliminary and may change based on research findings, market developments, data availability and client requirements.
Chapter 19 Disclaimer
- 19.1 Research and Forecast Disclaimer
- 19.2 Data Source and Estimation Limitations
Note: The depth of individual sections depends on data availability for this market. Volume, capacity, trade and other unit-based metrics are included where applicable.

