
Quiet-vehicle sound rules and EV noise lift test demand
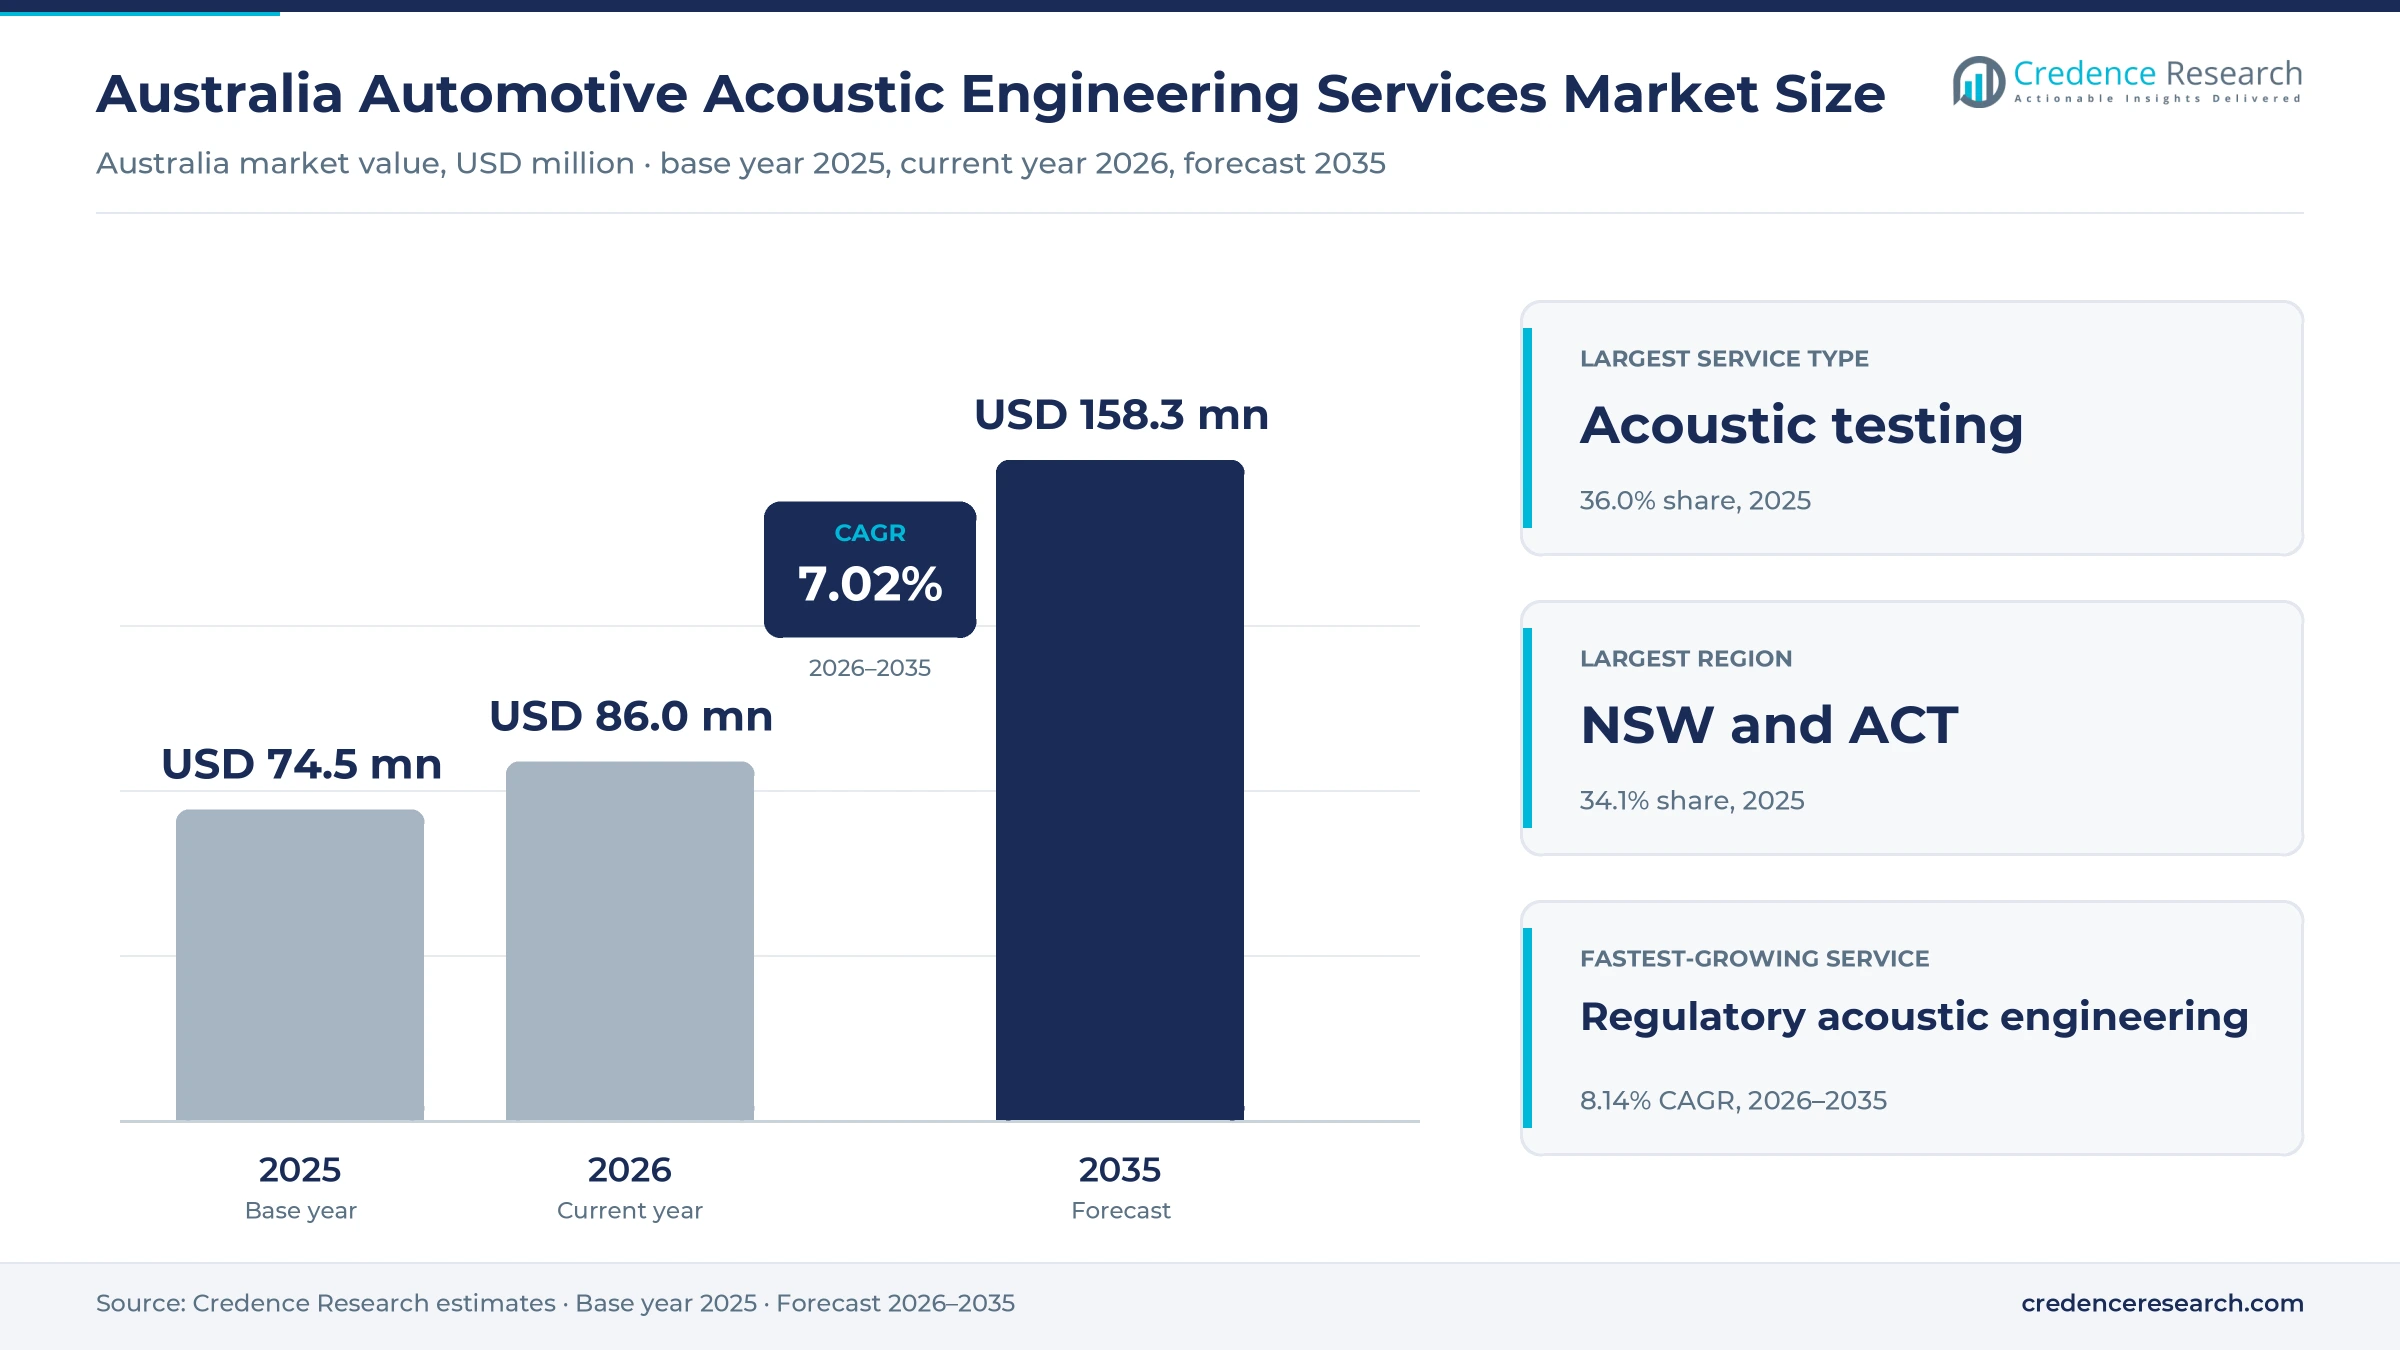
The Australia automotive acoustic engineering services market was valued at USD 74.5 million in 2025 and is projected to increase from USD 86.0 million in 2026 to USD 158.3 million by 2035, registering a CAGR of 7.02% during 2026–2035. Demand comes from carmakers, importers, component suppliers and specialist vehicle businesses that must simulate, test and certify vehicle noise, because electric and hybrid models bring new sound and vibration problems. New South Wales and the Australian Capital Territory held the largest regional share, 34.1% in 2025, because Sydney hosts many test equipment and engineering suppliers. Victoria is the fastest-growing region at 7.71% a year, as local vehicle development, proving grounds and remanufacturing sites expand. However, a new design rule for acoustic vehicle alerting systems, applied to new electric and hybrid models from November 2025, changed the approval work that every importer and carmaker must complete.
Which noise services and buyers does the estimate cover?
The estimate measures fees paid for noise, vibration and harshness simulation, acoustic testing, regulatory sound engineering and acoustic design advice for road vehicles developed, adapted or certified in Australia. Buyers include carmakers, importers, component suppliers, public-sector fleet buyers and businesses that convert or remanufacture vehicles for local sale.
The estimate excludes sales of sound-absorbing parts, test equipment purchases, warranty repairs and building acoustics. The value chain runs from simulation software and test sites through engineering service providers to vehicle programs, which then pass certification and enter the Australian market.
Australia Automotive Acoustic Engineering Services Market Insights
- The Australia automotive acoustic engineering services market was valued at USD 74.5 million in 2025 and is projected to reach USD 158.3 million by 2035, registering a CAGR of 7.02% during 2026–2035.
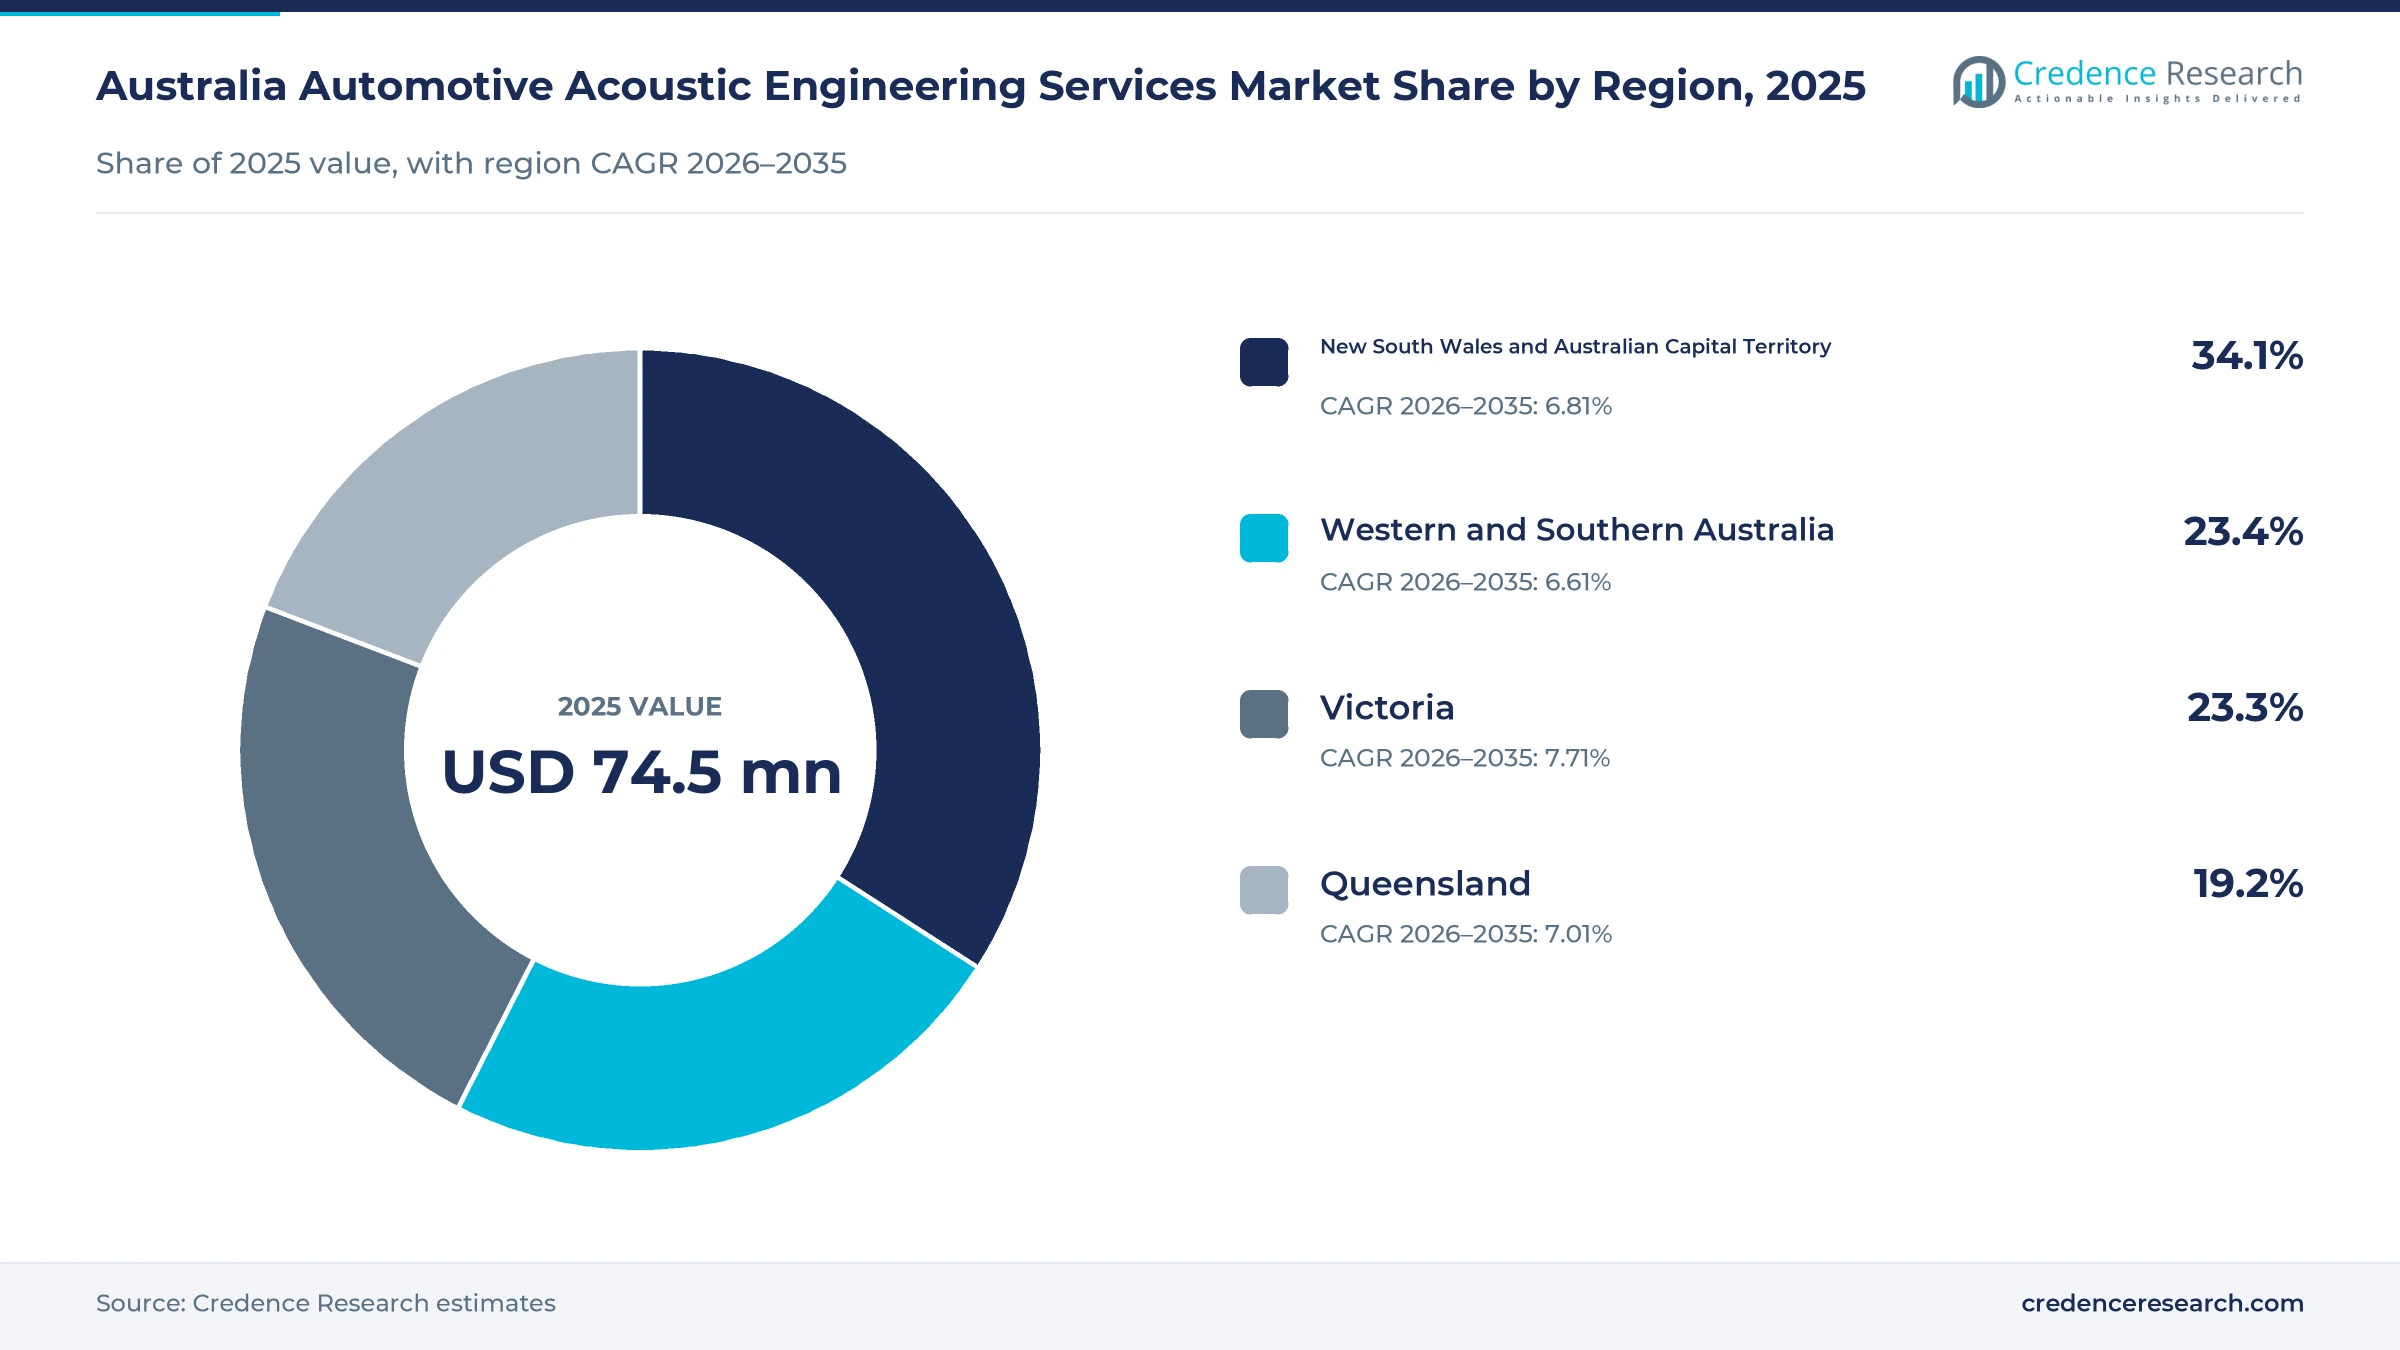
- New South Wales and the Australian Capital Territory held a 34.1% share of 2025 value, because Sydney hosts many test equipment and engineering suppliers.
- Acoustic testing led with a 36.0% share of 2025 value, because every new program needs pass-by, cabin and alert sound measurements before approval.
- Australian Design Rule 113/00 applies to new electric, hybrid and fuel cell models from November 2025, and models already on sale must comply by Nov. 1, 2026.
- Regulatory acoustic engineering grows fastest at 8.14% a year during 2026–2035, as importers and carmakers update alert sounds and approval files.
Testing leads while regulatory sound work grows fastest
Why does acoustic testing hold the largest service share?
Based on service type, the market is categorized into NVH simulation, acoustic testing, regulatory acoustic engineering and acoustic design advisory. Acoustic Testing led with a 36.0% share of 2025 value, because every program needs pass-by, cabin and alert sound measurements before approval. Regulatory Acoustic Engineering grows fastest at 8.14% a year, as alert sound rules add approval work.
How do vehicle OEMs shape demand for noise services?
Based on customer type, the market is categorized into vehicle OEMs, component suppliers, public-sector buyers and specialist vehicle businesses. Vehicle OEMs led with a 38.0% share of 2025 value, because local product development teams buy test, simulation and approval work. Specialist Vehicle Businesses grow fastest at 7.75% a year, as conversion and remanufacturing programs expand.
Which vehicle types generate the most noise engineering?
Based on application, the market is categorized into passenger vehicles, light commercial vehicles, heavy commercial vehicles and specialist vehicle programs. Passenger Vehicles led with a 44.0% share of 2025 value, because they make up most new electric and hybrid models. Light Commercial Vehicles grow fastest at 7.64% a year, as utes are developed, converted and electrified for local buyers.
| Segment Group | Leading Sub-segment | Share, 2025 | Fastest-growing Sub-segment | CAGR, 2026–2035 |
|---|---|---|---|---|
| By Service Type | Acoustic Testing | 36.0% | Regulatory Acoustic Engineering | 8.14% |
| By Customer Type | Vehicle OEMs | 38.0% | Specialist Vehicle Businesses | 7.75% |
| By Application | Passenger Vehicles | 44.0% | Light Commercial Vehicles | 7.64% |
Request a Free Sample
Fill in your details and we'll send you a free sample report.
- Sample data tables & charts
- Research methodology
AVAS approvals, EV noise and test depth drive engineering
How do AVAS approval requirements lift engineering demand?
AVAS approval requirements lift engineering demand, because every new electric and hybrid model must now emit a warning sound at low speed. The government introduced Australian Design Rule 113/00 in November 2025, and models already approved for sale must comply by Nov. 1, 2026, according to the Minister for Infrastructure. The rule is expected to prevent 68 deaths and 2,675 serious injuries by 2060, with community savings above $200 million. The sound must reach at least 50 decibels and stay below 75 decibels at speeds up to 20 km/h. As a result, regulatory acoustic engineering grows at 8.14% a year, as suppliers tune alerting system hardware and prepare test files.
Why does electrified-powertrain complexity raise noise work?
Electrified-powertrain complexity raises noise work, because electric drives remove engine sound and expose new tonal and road noise. Electric motors produce high-frequency tonal noise tied to motor whine and gear meshing, according to a May 2025 SAE technical review. The same review notes that road noise, wind noise and power electronics become more noticeable once engine noise is gone. Australians bought 103,300 battery electric cars and 53,484 plug-in hybrids in 2025, a 13.1% share of new car sales, according to the Electric Vehicle Council. In turn, NVH simulation grows faster than the market, as engineers test noise-damping materials and cabin designs before building prototypes.
How do three levels of testing widen service demand?
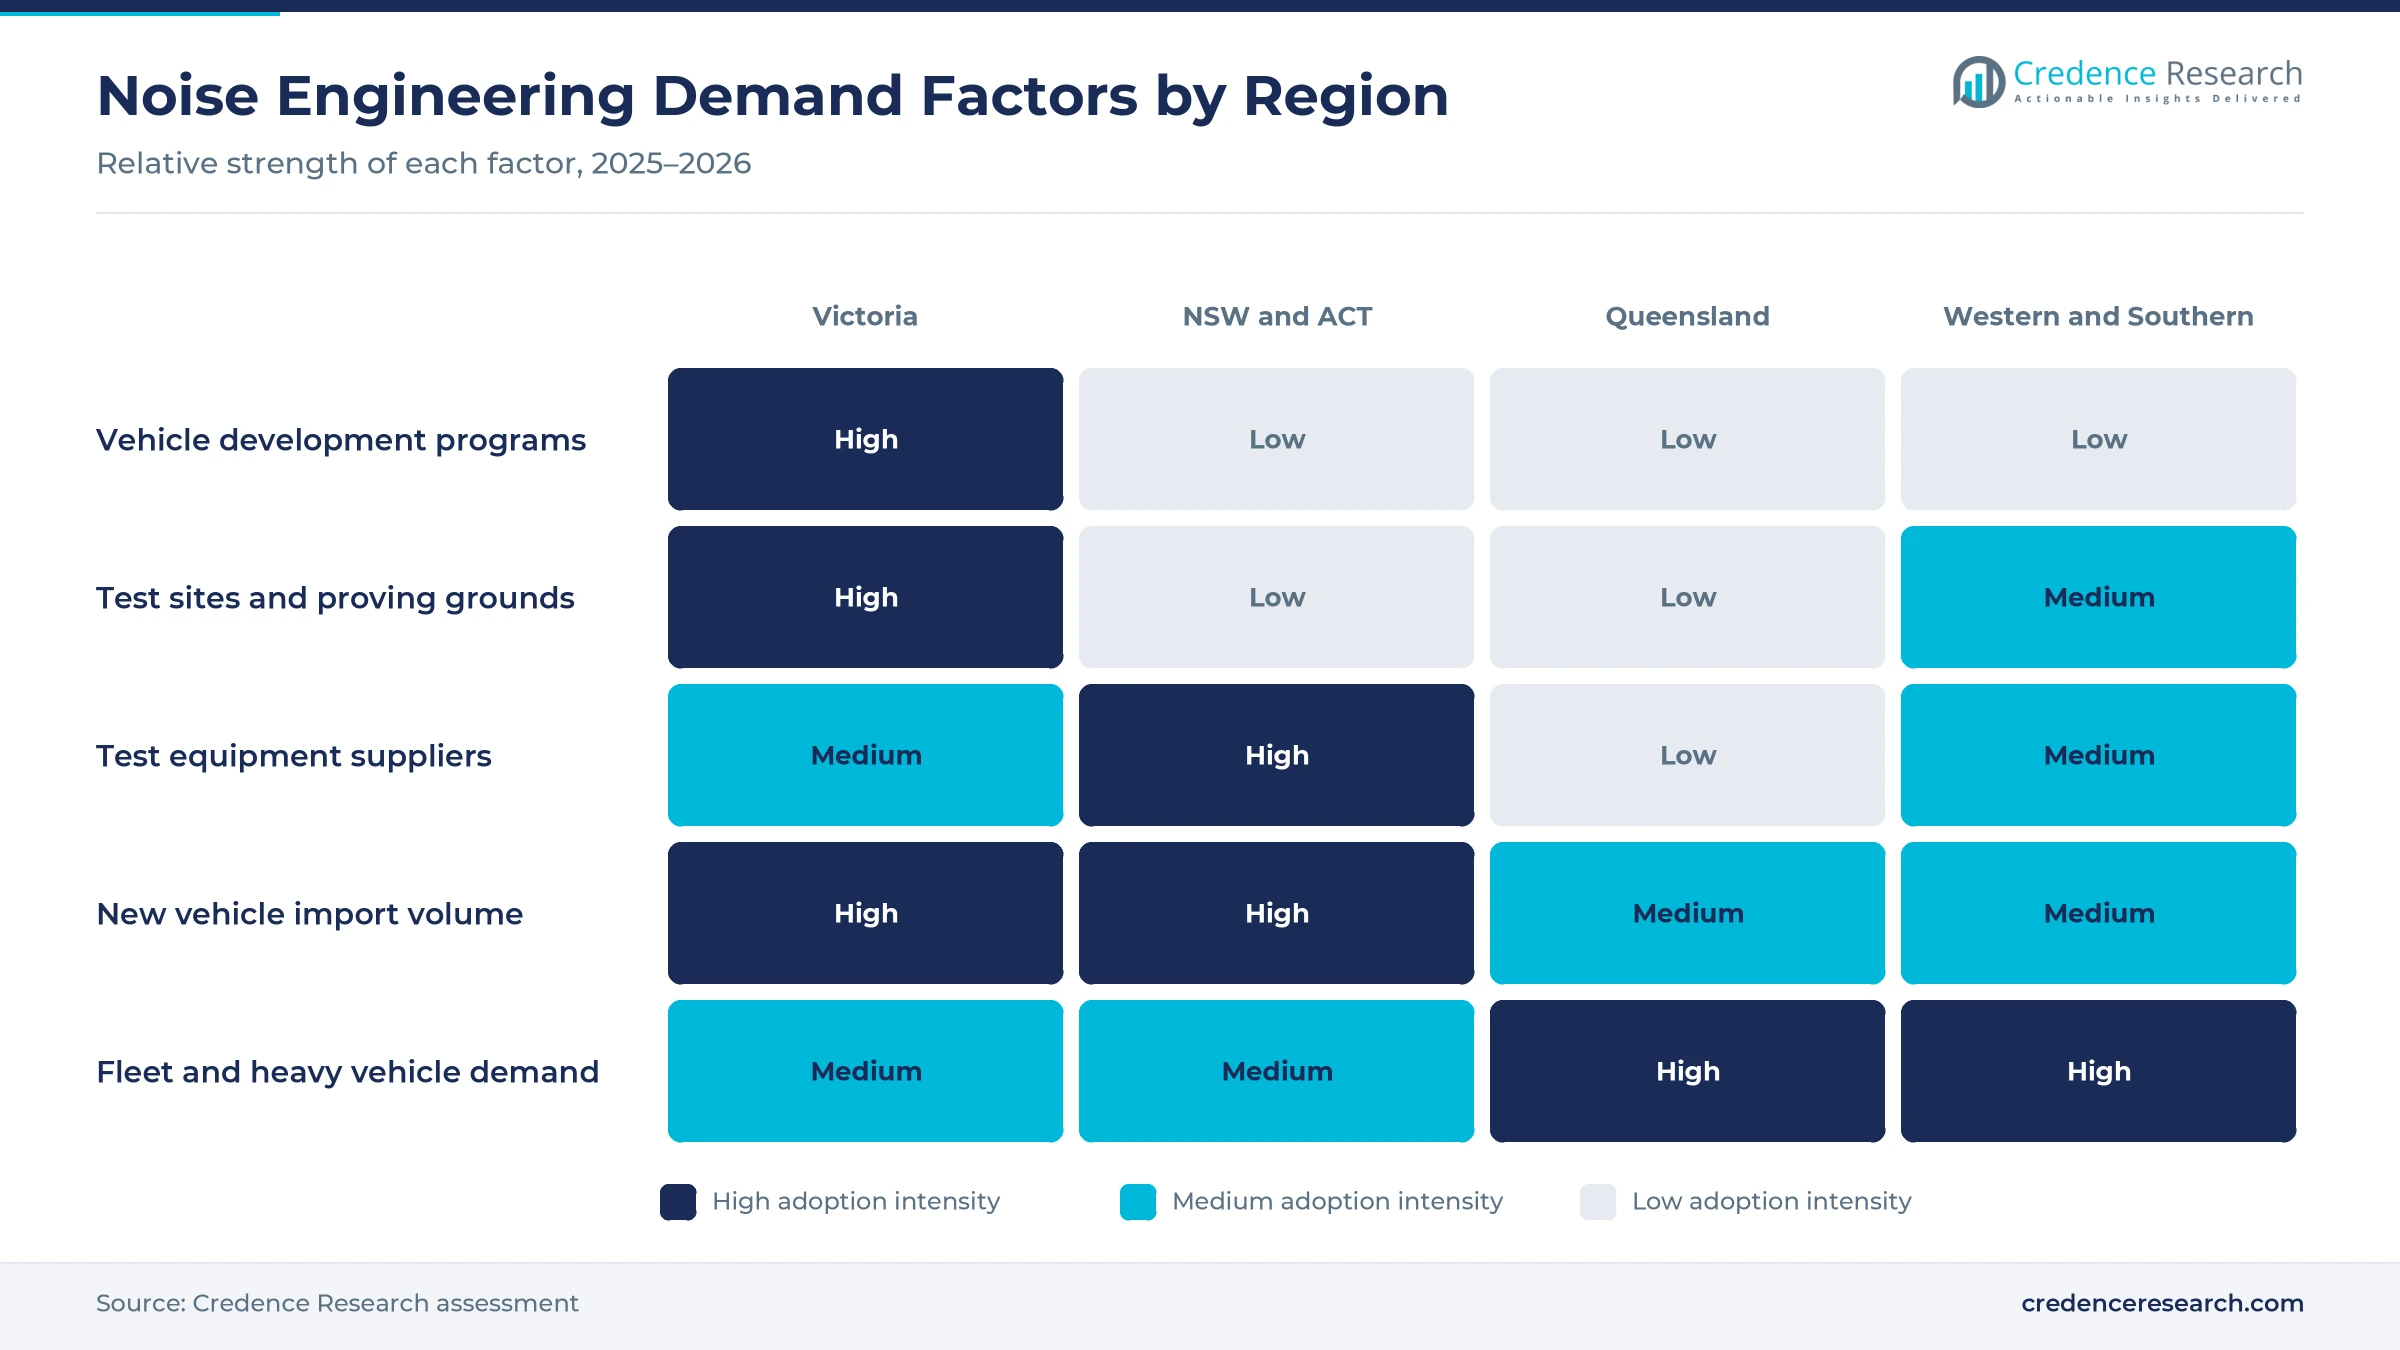
Testing at the component, subsystem and complete-vehicle levels widens service demand, because each level needs different rigs, sites and measurement skills. ISO 362-1, updated in 2022, sets the engineering method for measuring noise from accelerating passenger and goods vehicles and requires an extensive open space, according to the International Organization for Standardization. The Australian Automotive Research Centre at Anglesea covers 1,100 hectares with more than 100 km of tracks and more than 30 test facilities. Ford validates vehicles at its You Yangs Proving Ground with robotic drivers and three-axis simulators. As a result, acoustic testing holds 36.0% of 2025 value, because complete-vehicle checks still need physical sites.
Why does local vehicle development sustain noise engineering?
Local vehicle development sustains noise engineering, because programs designed or adapted in Australia must pass local noise checks before sale. Ford employs about 1,500 people in Australia, including a product development team of about 1,000, and its Ranger and Everest completed nearly two million km of durability testing, according to Ford. Walkinshaw opened a 100,000 square meter site at Dandenong South in February 2026, with about 800 staff and capacity for more than 10,000 units a year. Premcar has produced 12,755 Warrior vehicles for Nissan since late 2019. In turn, specialist vehicle businesses grow at 7.75% a year, as they buy outsourced development support.
UN rule alignment and plug-in growth reshape noise work
How is the shift to UN noise rules changing approval work?
The shift to UN noise rules is changing approval work, because Australian design rules now accept more international test methods and reports. A 2021 amendment to ADR 83/00 for external noise recognized UN Regulation No. 51, from the 02 series up to the 03 series, as equal for passenger and goods vehicles. The alert sound rule also adopts UN Regulation 138/01, after a public consultation that ran from March 28 to May 26, 2023. The impact analysis put average regulatory costs at $16.9 million to $19.3 million a year, depending on the option chosen. As a result, engineering providers spend more time on test reports that match global formats, which lifts regulatory acoustic engineering hours.
Why is the rise of plug-in models a shift for test programs?
The rise of plug-in models is a shift for test programs, because each new electric or hybrid variant needs its own alert sound, cabin noise and vibration checks. Battery electric sales rose 93.3% in January 2026 to 7,409 units, while plug-in hybrid sales rose 170.5% to 5,161 units. Conventional hybrid sales reached 15,121 units that month, which shows hybrids becoming a mainstream choice. Electric vehicles also reached a record 16.7% of new car sales in December 2025. In turn, light commercial vehicles grow at 7.64% a year, as plug-in utes and vans join the market and drive work on hub motors and other drive units.
Can heavy-vehicle alert sound rules open new work?
Heavy-vehicle alert sound rules can open new work, because electric buses and trucks are larger and quieter than the diesel models they replace. An exposure draft of ADR 113/00 in December 2023 added heavy vehicle categories MD, ME, NB and NC, with a proposed start in November 2025. The impact analysis listed an option covering light vehicles from January 2025 and heavy vehicles from November 2025, at about $17.6 million a year. The final rule covers new passenger cars, buses and trucks fitted with electric or hybrid drives. As a result, bus and truck makers need alert sound tuning and test reports, which widens work for providers that can test large vehicles.
Is there room for local measurement and test support?
Local measurement and test support offers room to grow, because providers with nearby staff can respond faster to vehicle programs and approval deadlines. Brüel & Kjær Australia runs its head office at Macquarie Park in New South Wales, while partner NVMS serves customers from West Leederville in Western Australia. AVL lists AVL NTC Powertrain at Castle Hill in New South Wales as its Australian subsidiary, and HORIBA lists HORIBA Australia at Kotara. Local engineering employers are also growing, as Premcar expanded from 25 staff in 2012 to about 200 in 2025. About 80% of the content added to its Warrior vehicles comes from Australian suppliers. As a result, providers with local staff win more quick-turn test and approval work from converters and suppliers.
Thin local programs and costly sites limit service growth
How do small local vehicle programs limit service volume?
Small local vehicle programs limit service volume, because most cars sold in Australia are designed and certified overseas. As a result, local providers win only parts of each program, such as local approval, conversion checks or final tuning. Providers respond by serving importers, converters and fleet buyers, which spreads work across more customers. This limit is strongest for passenger car programs from global brands, which rarely run full noise development in Australia.
Why do test site costs weigh on smaller providers?
Test site costs weigh on smaller providers, because pass-by tests need large open areas and controlled surfaces under ISO methods. In turn, firms without access to proving grounds must rent time at shared sites, which raises costs and lengthens schedules. Providers respond by using simulation earlier and booking shared tracks for final checks. This challenge favors groups with their own sites or long-term track agreements, because they can schedule tests around program deadlines.
How does a shortage of skilled engineers slow growth?
A shortage of skilled engineers slows growth, because acoustic work needs specialists in measurement, simulation and electric drive noise. As a result, providers compete with other industries for the same engineers, which raises wages and limits how many programs they can take on. Firms respond with graduate programs, remote simulation support and partnerships with overseas engineering centers. This shortage is most acute for electric drive noise specialists, because the skill set is still new in the local workforce.
Why can changing rules create uneven demand?
Changing rules can create uneven demand, because approval work peaks before deadlines and then falls once models comply. In turn, providers may see a rush of alert sound work before Nov. 1, 2026, followed by a quieter period. Providers respond by moving clients onto retained capacity and framework work orders, which smooth income across the year and keep teams busy between deadlines. This pattern favors providers with a broad and varied client base.
Sydney suppliers and victorian engineering set the split
| Region | Value, 2025 (USD million) | Share, 2025 | CAGR, 2026–2035 |
|---|---|---|---|
| New South Wales and Australian Capital Territory | 25.4 | 34.1% | 6.81% |
| Western and Southern Australia | 17.4 | 23.4% | 6.61% |
| Victoria | 17.4 | 23.3% | 7.71% |
| Queensland | 14.3 | 19.2% | 7.01% |
Why do New South Wales and the ACT hold the top share?
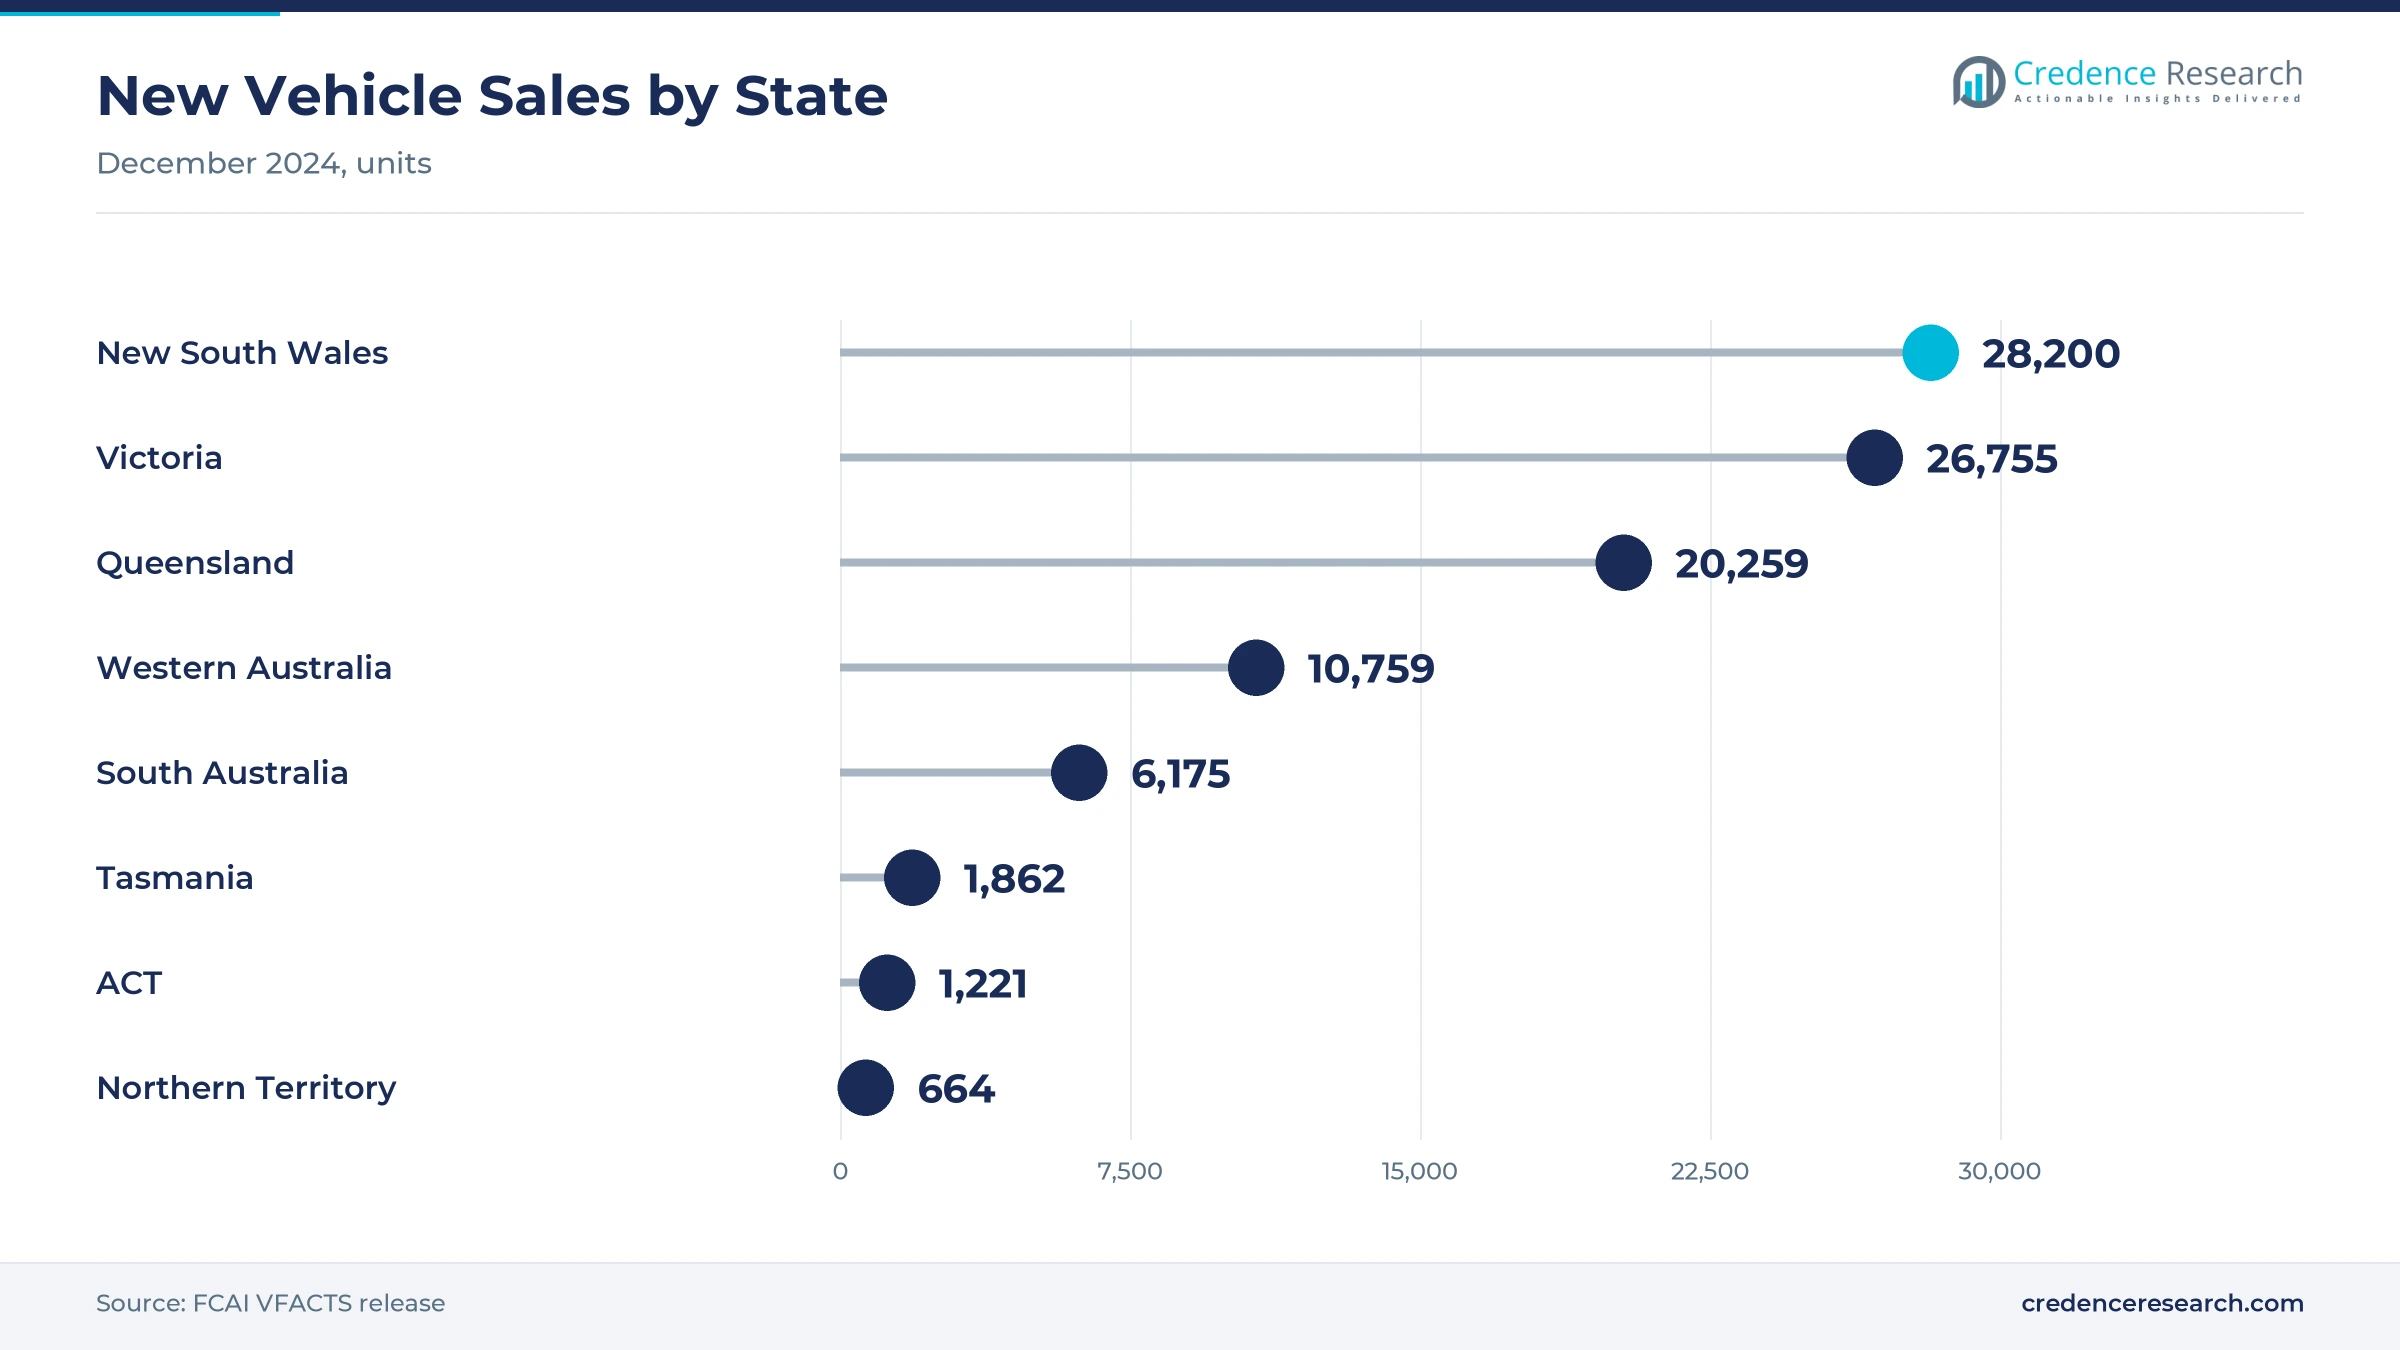
New South Wales and the Australian Capital Territory held a 34.1% share of 2025 value and grow at 6.81% a year, because Sydney hosts test equipment and engineering suppliers. New South Wales recorded 28,200 new vehicle sales in December 2024, the most of any state, while the ACT added 1,221. As a result, the zone combines large import volumes with nearby measurement and approval support.
How does Western and Southern Australia support demand?
Western and Southern Australia held a 23.4% share of 2025 value and grow at 6.61% a year, because mining fleets, utes and heavy vehicles need noise checks. Western Australia recorded 10,759 new vehicle sales in December 2024, up 9.2%, while South Australia added 6,175. In turn, Premcar tests its Warrior vehicles in remote areas such as Arkaroola and around Lake Eyre.
Why is Victoria the fastest-growing region?
Victoria held a 23.3% share of 2025 value and grows fastest at 7.71% a year, because it hosts the You Yangs Proving Ground, the Anglesea research center and several remanufacturing plants. Victoria recorded 26,755 new vehicle sales in December 2024, the second highest total. Walkinshaw moved its conversion work to Dandenong South, while Premcar builds Warrior vehicles at Epping. As a result, the state leads in development and complete-vehicle testing work.
What drives noise engineering demand in Queensland?
Queensland held a 19.2% share of 2025 value and grows at 7.01% a year, because buyers in the state favor utes, four-wheel drives and fleet vehicles. Queensland recorded 20,259 new vehicle sales in December 2024, the third highest total of any state. In turn, importers and converters need noise checks for accessories, conversions and electric fleet vehicles sold across the state.
Sound rules, new sites and local programs, 2024–2026
| Development | Status and market relevance |
|---|---|
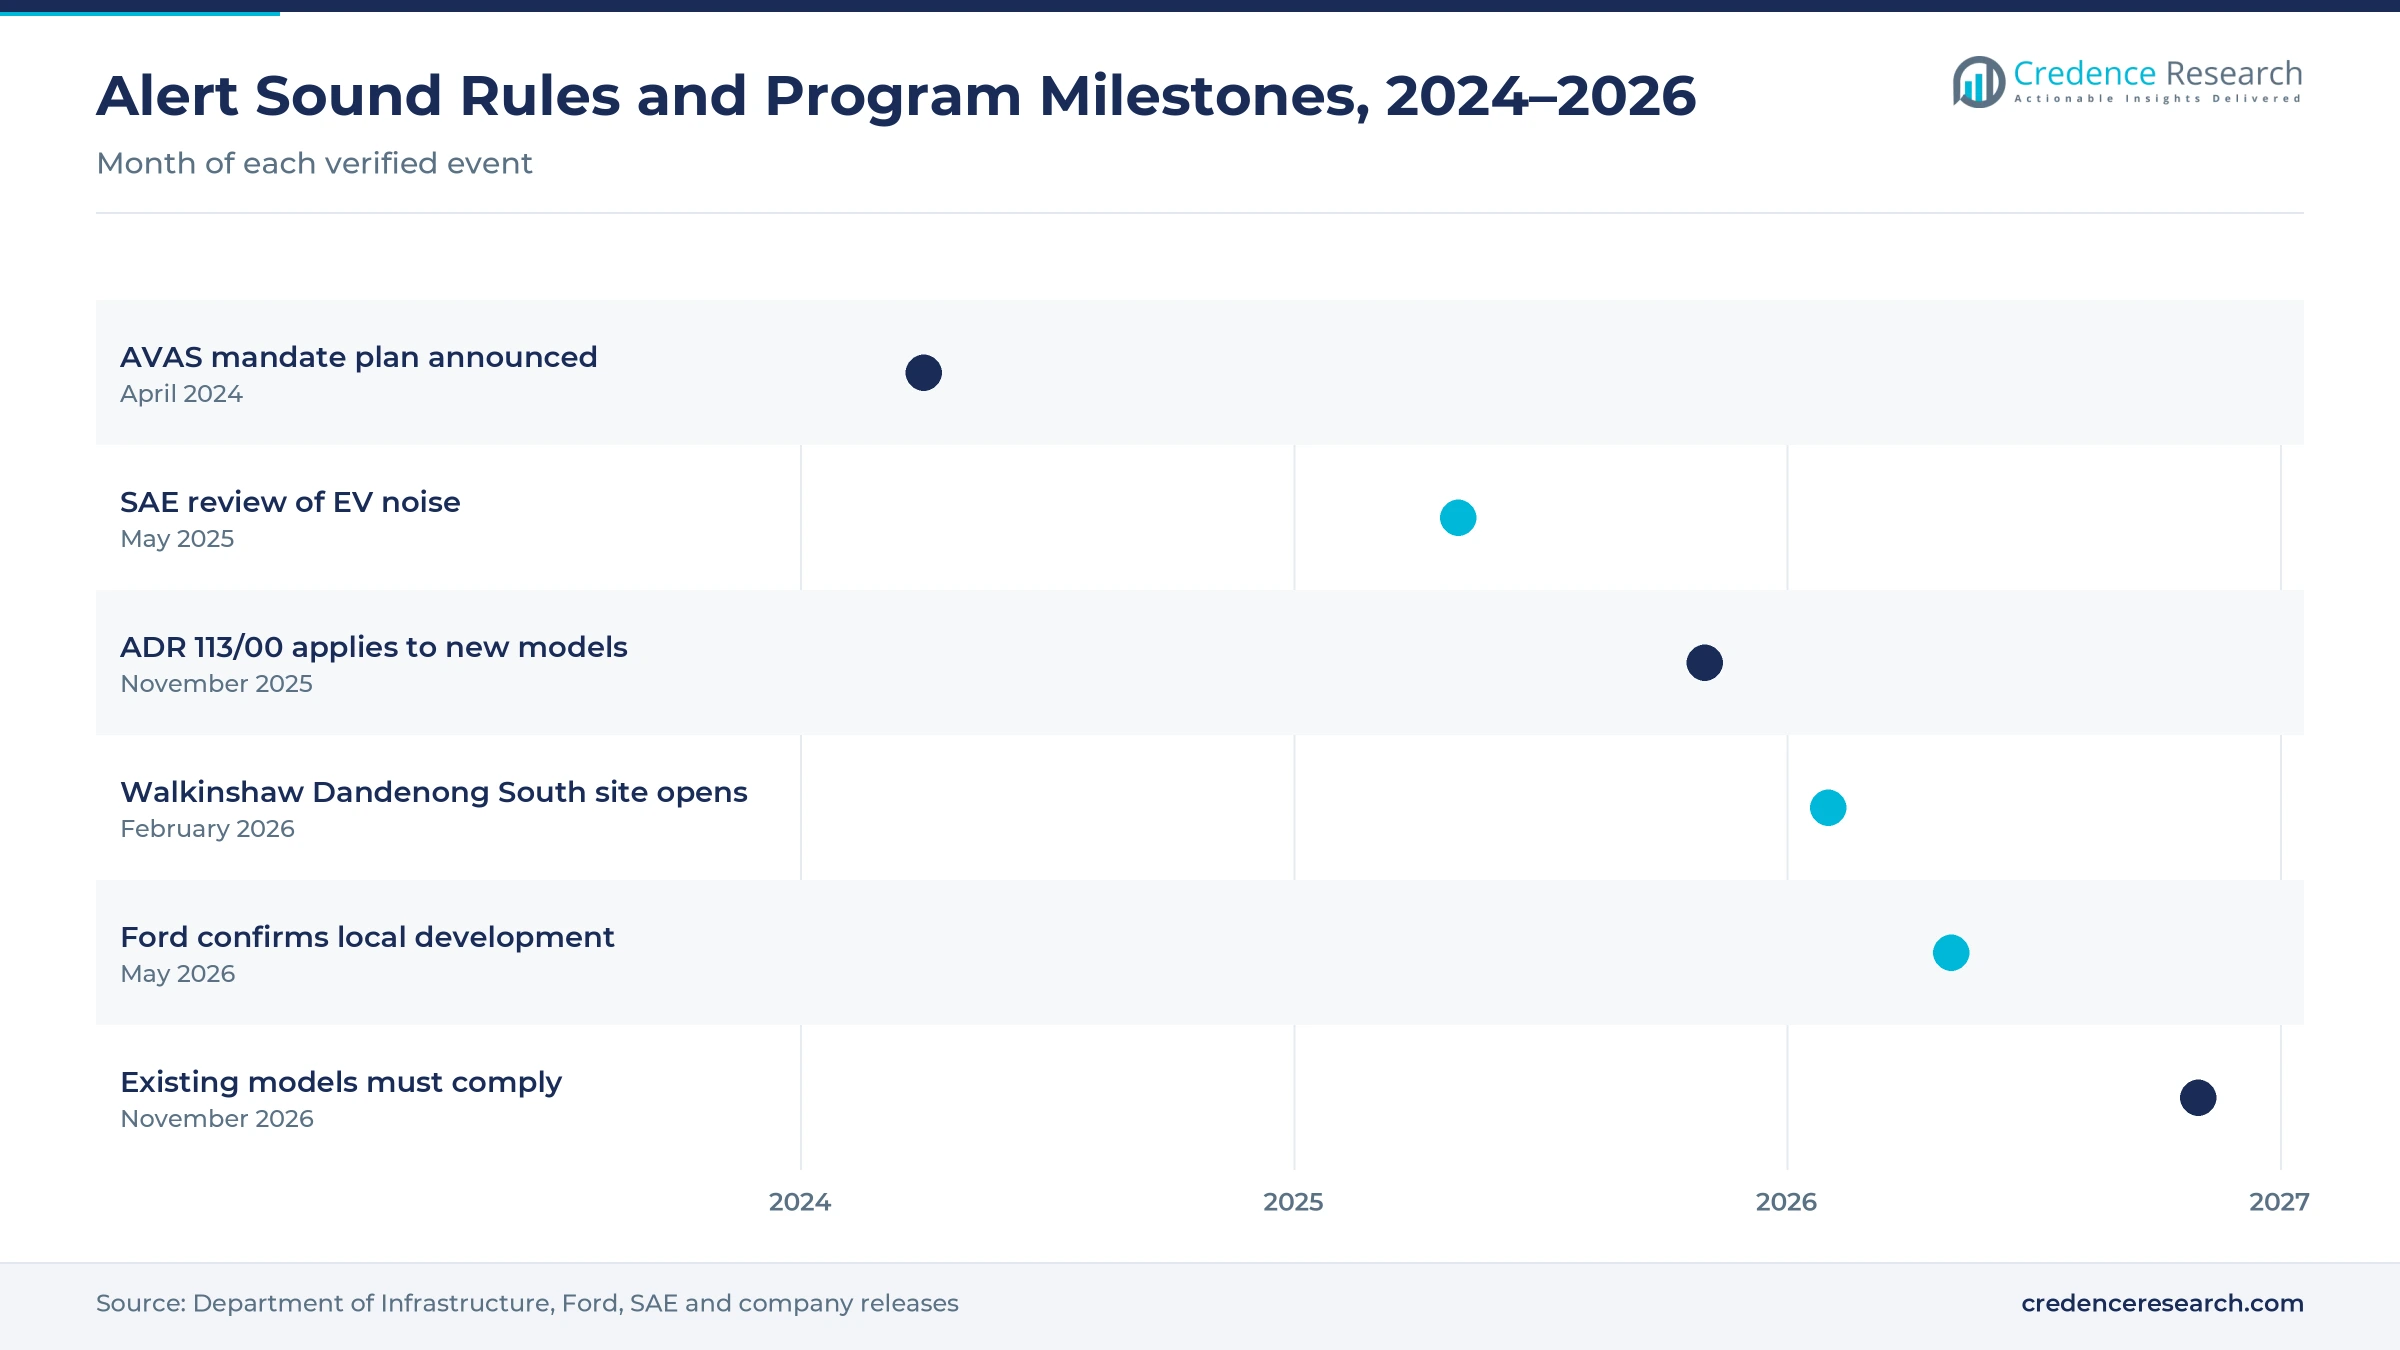
| In April 2024, the government announced its plan to mandate acoustic vehicle alerting systems under UN Regulation 138/01. | Set the path to the alert sound design rule |
| In May 2025, an SAE technical review highlighted high-frequency motor whine and road noise in electric vehicles. | Confirms the need for electric drive noise work |
| In November 2025, Australian Design Rule 113/00 began to apply to new electric, hybrid and fuel cell models. | Adds alert sound tests to every new approval |
| In February 2026, Walkinshaw opened its 100,000 square meter Dandenong South site with an engineering hub. | Expands local conversion and engineering capacity |
| In May 2026, Ford confirmed that Australia will keep developing the Ranger and Everest locally. | Supports long-term local test and noise work |
Simulation, pass-by tests and alert sound design lead
- NVH simulation models cabin noise, motor whine and structural vibration before prototypes exist, which cuts the number of physical test rounds.
- Pass-by noise testing measures sound from accelerating vehicles under ISO 362-1 methods on large open sites, which supports design rule approval.
- Alert sound design creates and tunes warning sounds between 50 and 75 decibels at low speed, which meets the new design rule.
- Vibration and durability rigs use robotic drivers and three-axis simulators to repeat road loads, which links noise checks with durability work.
Need a Custom Version of This Report?
Tailor the scope, geography, or segments to your exact requirements.
- Custom geography or segment scope
- Direct access to our analyst team
Engineering groups compete on test sites and local reach
Competition combines global engineering groups with local converters and test equipment suppliers. AVL lists AVL NTC Powertrain at Castle Hill as its Australian subsidiary, which gives it a local base for test and development work. HBK serves Australian customers through Brüel & Kjær Australia at Macquarie Park and partner NVMS in Western Australia. HORIBA lists HORIBA Australia at Kotara, while its HORIBA MIRA unit runs engineering and test services from the United Kingdom. Walkinshaw opened a 100,000 square meter site at Dandenong South in February 2026, and Premcar has built 12,755 Warrior vehicles for Nissan at Epping. Providers compete on test site access, local staff, simulation tools and the ability to deliver approval files on time.
Which engineering and test providers serve local programs?
| Company | Type | Role in the market |
|---|---|---|
| Walkinshaw Automotive Group | Vehicle converter and engineer | Runs a 100,000 square meter site at Dandenong South |
| AVL List GmbH | Engineering and test group | Operates AVL NTC Powertrain at Castle Hill |
| HBK | Measurement and test supplier | Serves buyers through Brüel & Kjær Australia and NVMS |
| HORIBA MIRA | Engineering and test group | Parent group lists HORIBA Australia at Kotara |
| Premcar | Vehicle engineer and remanufacturer | Has built 12,755 Warrior vehicles for Nissan since 2019 |
Credence Research view on vehicle noise engineering
Credence Research's view is that Australian vehicle noise engineering will grow steadily because alert sound rules, electric drives and local conversion programs all add test and approval work. Acoustic testing remains the largest service, yet regulatory sound engineering adds the fastest growth as models must comply by Nov. 1, 2026. Small local programs and costly test sites limit some smaller providers. Groups that combine simulation, test site access and approval skills should gain the most share by 2035.
How the vehicle noise engineering estimate was built
The report uses 2025 as the base year on a calendar basis, and market values come from the Credence Research model. That model combines published vehicle sales, design rule requirements, test site capacity and company information on local engineering programs. Segment splits and zone growth rates are Credence Research estimates, while zone shares follow the client-provided split. Sources used are government releases, standards bodies, industry association data, technical papers and company releases, and no interviews or surveys were used.
Alert sound rules and plug-in models sustain work to 2035
The Australia automotive acoustic engineering services market is expected to reach USD 158.3 million by 2035, a 7.02% CAGR during 2026–2035, as alert sound rules and plug-in models add test and approval work. Growth should be strongest in regulatory acoustic engineering, light commercial vehicles and Victoria, because these areas gain most from new rules, utes and local development. Small local programs and skills gaps could slow some years, while new electric buses and trucks should support demand after 2030.
Frequently Asked Questions
How big is the Australia automotive acoustic engineering services market?
Which service type leads vehicle noise engineering?
Which region leads the market?
What does Australian Design Rule 113/00 require?
Why do electric vehicles need more noise engineering?
How many electric vehicles were sold in Australia in 2025?
Who are the leading companies in the market?
What are the main challenges for noise engineering providers?
Table of Content
Chapter 1 Market Segmentation
- 1.1 Segmentation Framework
- 1.1.1 Product and Service Classification
- 1.1.2 Application and End-Use Classification
- 1.1.3 Technology and Solution Classification
- 1.1.4 Customer and Distribution Channel Classification
- 1.1.5 Geographic Segmentation
- 1.1.6 Market Segment Definitions and Boundaries
- 1.2 By Service Type
- 1.2.1 Acoustic Testing
- 1.2.2 NVH Simulation
- 1.2.3 Regulatory Acoustic Engineering
- 1.2.4 Acoustic Design Advisory
- 1.3 By Customer Type
- 1.3.1 Vehicle OEMs
- 1.3.2 Component Suppliers
- 1.3.3 Public-Sector Buyers
- 1.3.4 Specialist Vehicle Businesses
- 1.4 By Application
- 1.4.1 Passenger Vehicles
- 1.4.2 Light Commercial Vehicles
- 1.4.3 Heavy Commercial Vehicles
- 1.4.4 Specialist Vehicle Programs
Chapter 2 Introduction
- 2.1 Report Objectives and Scope
- 2.2 Product Definition and Industry Terminology
- 2.3 Market Inclusions and Exclusions
- 2.4 Research Process
- 2.4.1 Primary Research and Expert Interviews
- 2.4.2 Secondary Research and Source Review
- 2.4.3 Top-Down and Bottom-Up Estimation
- 2.4.4 Data Triangulation and Verification
- 2.5 Market Size Measurement Basis
- 2.5.1 2025: USD 74.5 million → 2035: USD 158.3 million
- 2.6 Historical and Forecast Reference Periods
- 2.6.1 Historical Period: 2018-2025
- 2.6.2 Base Year: 2025
- 2.6.3 Forecast Period: 2025-2035
- 2.7 Research Assumptions and Limitations
Chapter 3 Executive Summary
- 3.1 Market Snapshot and Key Findings
- 3.2 Base-Year Market Size, 2025
- 3.3 Forecast Market Size, 2035
- 3.4 Revenue and Volume Growth Outlook
- 3.5 Key Demand and Supply Indicators
- 3.6 Leading Market Segments
- 3.7 Fastest-Growing Market Opportunities
- 3.8 Regional Performance Highlights
- 3.9 Technology and Industry Transformation
- 3.10 Competitive Landscape Summary
- 3.11 Analyst View and Strategic Implications
Chapter 4 Australia Automotive Acoustic Engineering Services Market Trends and Developments
- 4.1 Historical Industry Development, 2018-2025
- 4.2 Recent Market Trends and Developments
- 4.3 Demand and Customer Behavior Trends
- 4.4 Technology and Product Innovation
- 4.5 Artificial Intelligence, Automation and Digitalization
- 4.6 Local Manufacturing and Supply Chain Realignment
- 4.7 Industry Partnerships, Mergers and Acquisitions
- 4.8 Sustainability and Circular Economy Developments
- 4.9 Government and Private Sector Investment Trends
- 4.10 Emerging Business Models and Commercialization
- 4.11 Industry Developments and Announcements
Chapter 5 Australia Automotive Acoustic Engineering Services Market Supply and Demand Analysis
- 5.1 Demand Trend and Consumption Analysis, 2018-2025
- 5.2 Demand Forecast, 2025-2035
- 5.3 Supply Chain Structure and Procurement Trends
- 5.4 Supply-Demand Gap and Bottlenecks
- 5.5 Import Dependence and Sourcing Structure
- 5.6 Regional Supply and Demand Concentration
Chapter 6 Australia Automotive Acoustic Engineering Services Market Pricing Analysis
- 6.1 Pricing Structure and Measurement
- 6.2 Historical Pricing Trends, 2018-2025
- 6.3 Pricing Outlook, 2025-2035
- 6.4 Pricing by Product and Market Segment
- 6.5 Geographic Pricing Differences
- 6.6 Key Input, Energy, Labor and Logistics Costs
- 6.7 Contract Pricing and Purchasing Models
- 6.8 Pricing Sensitivity and Competitive Positioning
- 6.9 Price, Margin and Profitability Implications
Chapter 7 Australia Automotive Acoustic Engineering Services Market Dynamics
- 7.1 Market Growth Drivers
- 7.1.1 Demand-Side Drivers
- 7.1.2 Technology and Innovation Drivers
- 7.1.3 Infrastructure and Investment Drivers
- 7.1.4 Regulatory and Policy Drivers
- 7.2 Market Restraints
- 7.2.1 Cost and Affordability Constraints
- 7.2.2 Technology and Adoption Barriers
- 7.2.3 Supply Chain and Operational Constraints
- 7.3 Market Challenges
- 7.3.1 Competitive Pressure and Margin Erosion
- 7.3.2 Skills, Infrastructure and Implementation Gaps
- 7.4 Emerging Market Opportunities
- 7.5 Market Dynamics Impact and Time-Horizon Assessment
Chapter 8 Australia Automotive Acoustic Engineering Services Value Chain Analysis
- 8.1 Industry Value Chain Overview
- 8.2 Upstream Suppliers and Critical Inputs
- 8.3 Technology and Component Providers
- 8.4 Manufacturing or Service Delivery
- 8.5 Distribution, Channel Partners and Integrators
- 8.6 Downstream Applications and End Users
- 8.7 Value Addition and Profit Pools
- 8.8 Vertical Integration and Outsourcing
- 8.9 Supplier Concentration and Risk
- 8.10 Supply Chain Localization and Resilience
Chapter 9 Australia Automotive Acoustic Engineering Services Market Regulations and Policies
- 9.1 Relevant Laws, Standards and Compliance Frameworks
- 9.2 Product, Service, Safety and Quality Requirements
- 9.3 Government Policies, Incentives and Subsidies
- 9.4 Imports, Exports and Trade Barriers
- 9.5 Public Procurement and Local Content Requirements
- 9.6 Data Protection, AI and Cybersecurity Compliance
- 9.7 Upcoming Policy Changes and Market Implications
Chapter 10 Australia Automotive Acoustic Engineering Services Market Hotspots and Opportunities
- 10.1 Market Opportunity Mapping and Growth Hotspots
- 10.2 High-Growth Applications and Customer Groups
- 10.3 Underserved Markets and White-Space Opportunities
- 10.4 Emerging Technology and Product Opportunities
- 10.5 New Capacity and Investment Hotspots
- 10.6 Market Entry and Expansion Opportunities
- 10.7 Distribution and Partnership Opportunities
- 10.8 Near-Term and Long-Term Commercial Potential
- 10.9 Opportunity Attractiveness and Execution Risks
Chapter 11 Australia Automotive Acoustic Engineering Services Market Outlook, 2025-2035
- 11.1 Market Size and Analysis
- 11.1.1 Revenue (Market Measurement: 2025: USD 74.5 million → 2035: USD 158.3 million)
- 11.1.2 Historical Market Size, 2018-2025
- 11.1.3 Base-Year Market Size, 2025
- 11.2 Market Forecast, 2025-2035
- 11.2.1 Revenue Forecast to 2035
- 11.2.2 CAGR and Year-on-Year Growth
- 11.2.3 Incremental Revenue Opportunity
- 11.3 Forecast Assumptions and Scenario Analysis
- 11.3.1 Base-Case Forecast
- 11.3.2 Optimistic and Conservative Scenarios
- 11.3.3 Technology, Pricing and Policy Sensitivities
- 11.4 Market Attractiveness and Growth Outlook
Chapter 12 Australia Automotive Acoustic Engineering Services Market Segmentation and Outlook
- 12.1 Segmentation Summary and Market Shares, 2025
- 12.2 Largest and Fastest-Growing Segments
- 12.3 By Service Type - Market Size and Forecast, 2025-2035
- 12.3.1 Segment Definition and Scope
- 12.3.2 Historical Market Size, 2018-2025
- 12.3.3 Revenue Forecast, 2025-2035
- 12.3.4 Base-Year Market Share, 2025
- 12.3.5 Segment CAGR and Growth Drivers
- 12.3.6 Subsegment Market Size and Forecast
- 12.3.6.1 Acoustic Testing
- 12.3.6.2 NVH Simulation
- 12.3.6.3 Regulatory Acoustic Engineering
- 12.3.6.4 Acoustic Design Advisory
- 12.3.7 Subsegment Pricing and Adoption Trends
- 12.3.8 Leading Suppliers and Competition
- 12.3.9 Regional Demand and Opportunities
- 12.4 By Customer Type - Market Size and Forecast, 2025-2035
- 12.4.1 Segment Definition and Scope
- 12.4.2 Historical Market Size, 2018-2025
- 12.4.3 Revenue Forecast, 2025-2035
- 12.4.4 Base-Year Market Share, 2025
- 12.4.5 Segment CAGR and Growth Drivers
- 12.4.6 Subsegment Market Size and Forecast
- 12.4.6.1 Vehicle OEMs
- 12.4.6.2 Component Suppliers
- 12.4.6.3 Public-Sector Buyers
- 12.4.6.4 Specialist Vehicle Businesses
- 12.4.7 Subsegment Pricing and Adoption Trends
- 12.4.8 Leading Suppliers and Competition
- 12.4.9 Regional Demand and Opportunities
- 12.5 By Application - Market Size and Forecast, 2025-2035
- 12.5.1 Segment Definition and Scope
- 12.5.2 Historical Market Size, 2018-2025
- 12.5.3 Revenue Forecast, 2025-2035
- 12.5.4 Base-Year Market Share, 2025
- 12.5.5 Segment CAGR and Growth Drivers
- 12.5.6 Subsegment Market Size and Forecast
- 12.5.6.1 Passenger Vehicles
- 12.5.6.2 Light Commercial Vehicles
- 12.5.6.3 Heavy Commercial Vehicles
- 12.5.6.4 Specialist Vehicle Programs
- 12.5.7 Subsegment Pricing and Adoption Trends
- 12.5.8 Leading Suppliers and Competition
- 12.5.9 Regional Demand and Opportunities
- 12.6 Segment Growth Comparison
- 12.7 Segment Attractiveness and Priority Matrix
Chapter 13 Australia Automotive Acoustic Engineering Services End-Use and Application Market Outlook
- 13.1 End-Use Industry and Customer Demand Structure
- 13.2 Leading Applications and Customer Groups
- 13.3 End-Use Market Size, Share and Forecast
- 13.4 Major End-Use Industry Deep Dives
- 13.4.1 Customer Requirements and Use Cases
- 13.4.2 Demand and Replacement Cycles
- 13.4.3 Technical and Regulatory Considerations
- 13.4.4 Purchasing and Procurement Models
- 13.4.5 Leading Vendors and Distribution Channels
- 13.4.6 Forecast and Commercial Opportunities
- 13.5 Emerging Applications and Cross-Segment Demand
- 13.6 End-Use Industry Investment Priorities
Chapter 14 Australia Automotive Acoustic Engineering Services Geographic Market Outlook, 2025-2035
- 14.1 Domestic Market Distribution and Demand Clusters
- 14.2 State- or Province-Wise Market Size and Forecast, 2025-2035
- 14.3 City and Metropolitan Market Outlook
- 14.4 Industrial, Manufacturing and Commercial Clusters
- 14.5 Geographic Concentration of Key End Users
- 14.6 Local Pricing and Purchasing Differences
- 14.7 Domestic Production Facilities and Capacity Map
- 14.8 Local Infrastructure and Project Pipeline
- 14.9 State-Level Policy and Incentive Differences
- 14.10 Subnational Investment Hotspots and Opportunities
- 14.11 Distribution and Logistics Networks
- 14.12 Domestic Competitive Footprint
Chapter 15 Australia Automotive Acoustic Engineering Services Technology, Innovation and Sustainability Outlook
- 15.1 Technology Landscape and Maturity
- 15.2 Product, Process and Service Innovation
- 15.3 AI, Automation and Digital Tools in the Industry
- 15.4 Technology Adoption and Performance Benchmarking
- 15.5 Innovation Pipeline and R&D Investment
- 15.6 Energy Efficiency and Resource Management
- 15.7 Sustainability, Recycling and Circularity
- 15.8 Technology Roadmap, 2025-2035
- 15.9 Risks of Obsolescence and Technology Substitution
Chapter 16 Australia Automotive Acoustic Engineering Services Market Key Strategic Imperatives
- 16.1 Growth and Market Entry Priorities
- 16.2 High-Return Products and Segments
- 16.3 Pricing, Profitability and Cost Optimization
- 16.4 Technology Investment and Product Differentiation
- 16.5 Supply Chain Localization and Resilience
- 16.6 Distribution and Customer Acquisition
- 16.7 Partnership, Acquisition and Capacity Strategy
- 16.8 Regional Expansion Priorities
- 16.9 Short-, Medium- and Long-Term Actions
Chapter 17 Competition Outlook
- 17.1 Industry Competition Characteristics
- 17.2 Market Structure and Concentration
- 17.3 Market Share and Competitive Positioning, 2025
- 17.4 Company-Wise Revenue and Product Benchmarking
- 17.5 Production and Service Capacity Benchmarking
- 17.6 Technology, Pricing and Differentiation
- 17.7 Regional Footprint and Distribution Strength
- 17.8 Mergers, Acquisitions and Strategic Alliances
- 17.9 New Entrants and Competitive Threats
- 17.10 Porter's Five Forces and Industry Attractiveness
- 17.11 Competitive Outlook, 2025-2035
Chapter 18 Company Profiles
- 18.1 Company Coverage and Selection Criteria
- 18.2 AVL List GmbH
- 18.2.1 Business Description
- 18.2.2 Company Ownership and Geographic Presence
- 18.2.3 Product and Service Portfolio
- 18.2.4 Manufacturing and Operating Footprint
- 18.2.5 Financial Performance and Investment
- 18.2.6 Market Share and Competitive Position
- 18.2.7 Technology and Innovation Capabilities
- 18.2.8 Strategic Alliances or Partnerships
- 18.2.9 Recent Developments
- 18.2.10 Growth Strategy and Outlook
- 18.3 Continental Engineering Services
- 18.4 Walkinshaw Automotive Group
- 18.5 HORIBA MIRA
- 18.6 HBK
- 18.7 Other Relevant Market Participants
Note: Every listed company is profiled on the structure shown under the first company. The company list is preliminary and may change based on research findings, market developments, data availability and client requirements.
Chapter 19 Disclaimer
- 19.1 Research and Forecast Disclaimer
- 19.2 Data Source and Estimation Limitations
Note: The depth of individual sections depends on data availability for this market. Volume, capacity, trade and other unit-based metrics are included where applicable.

