
Outsourced freight and storage scale up across India
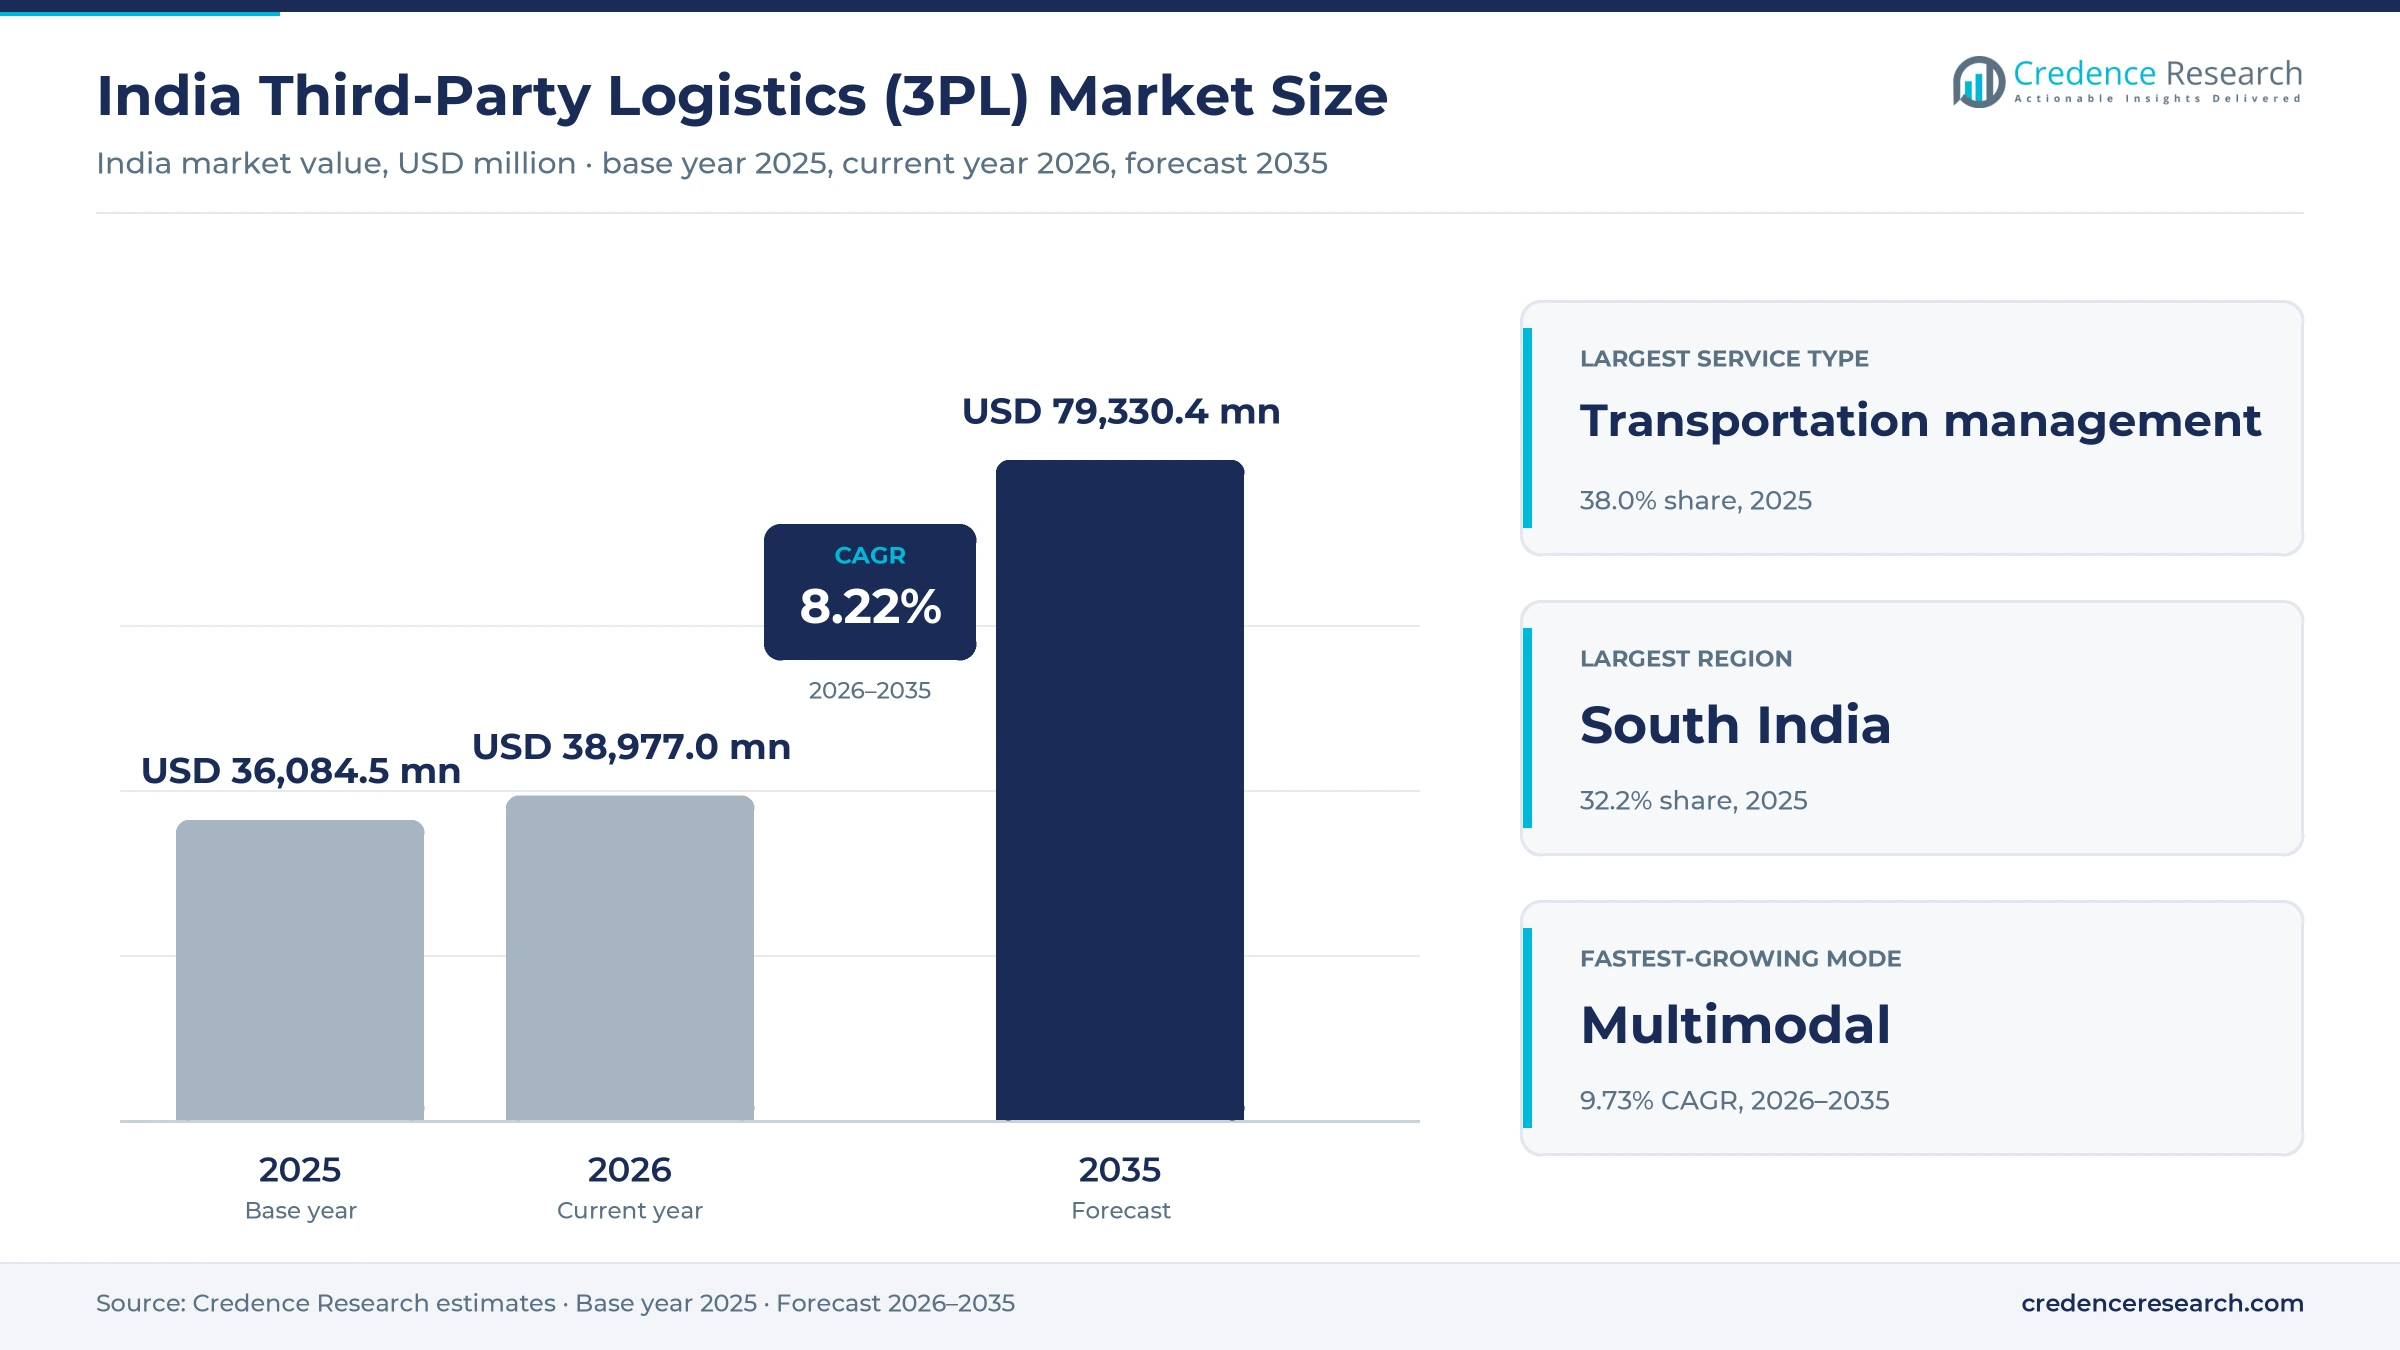
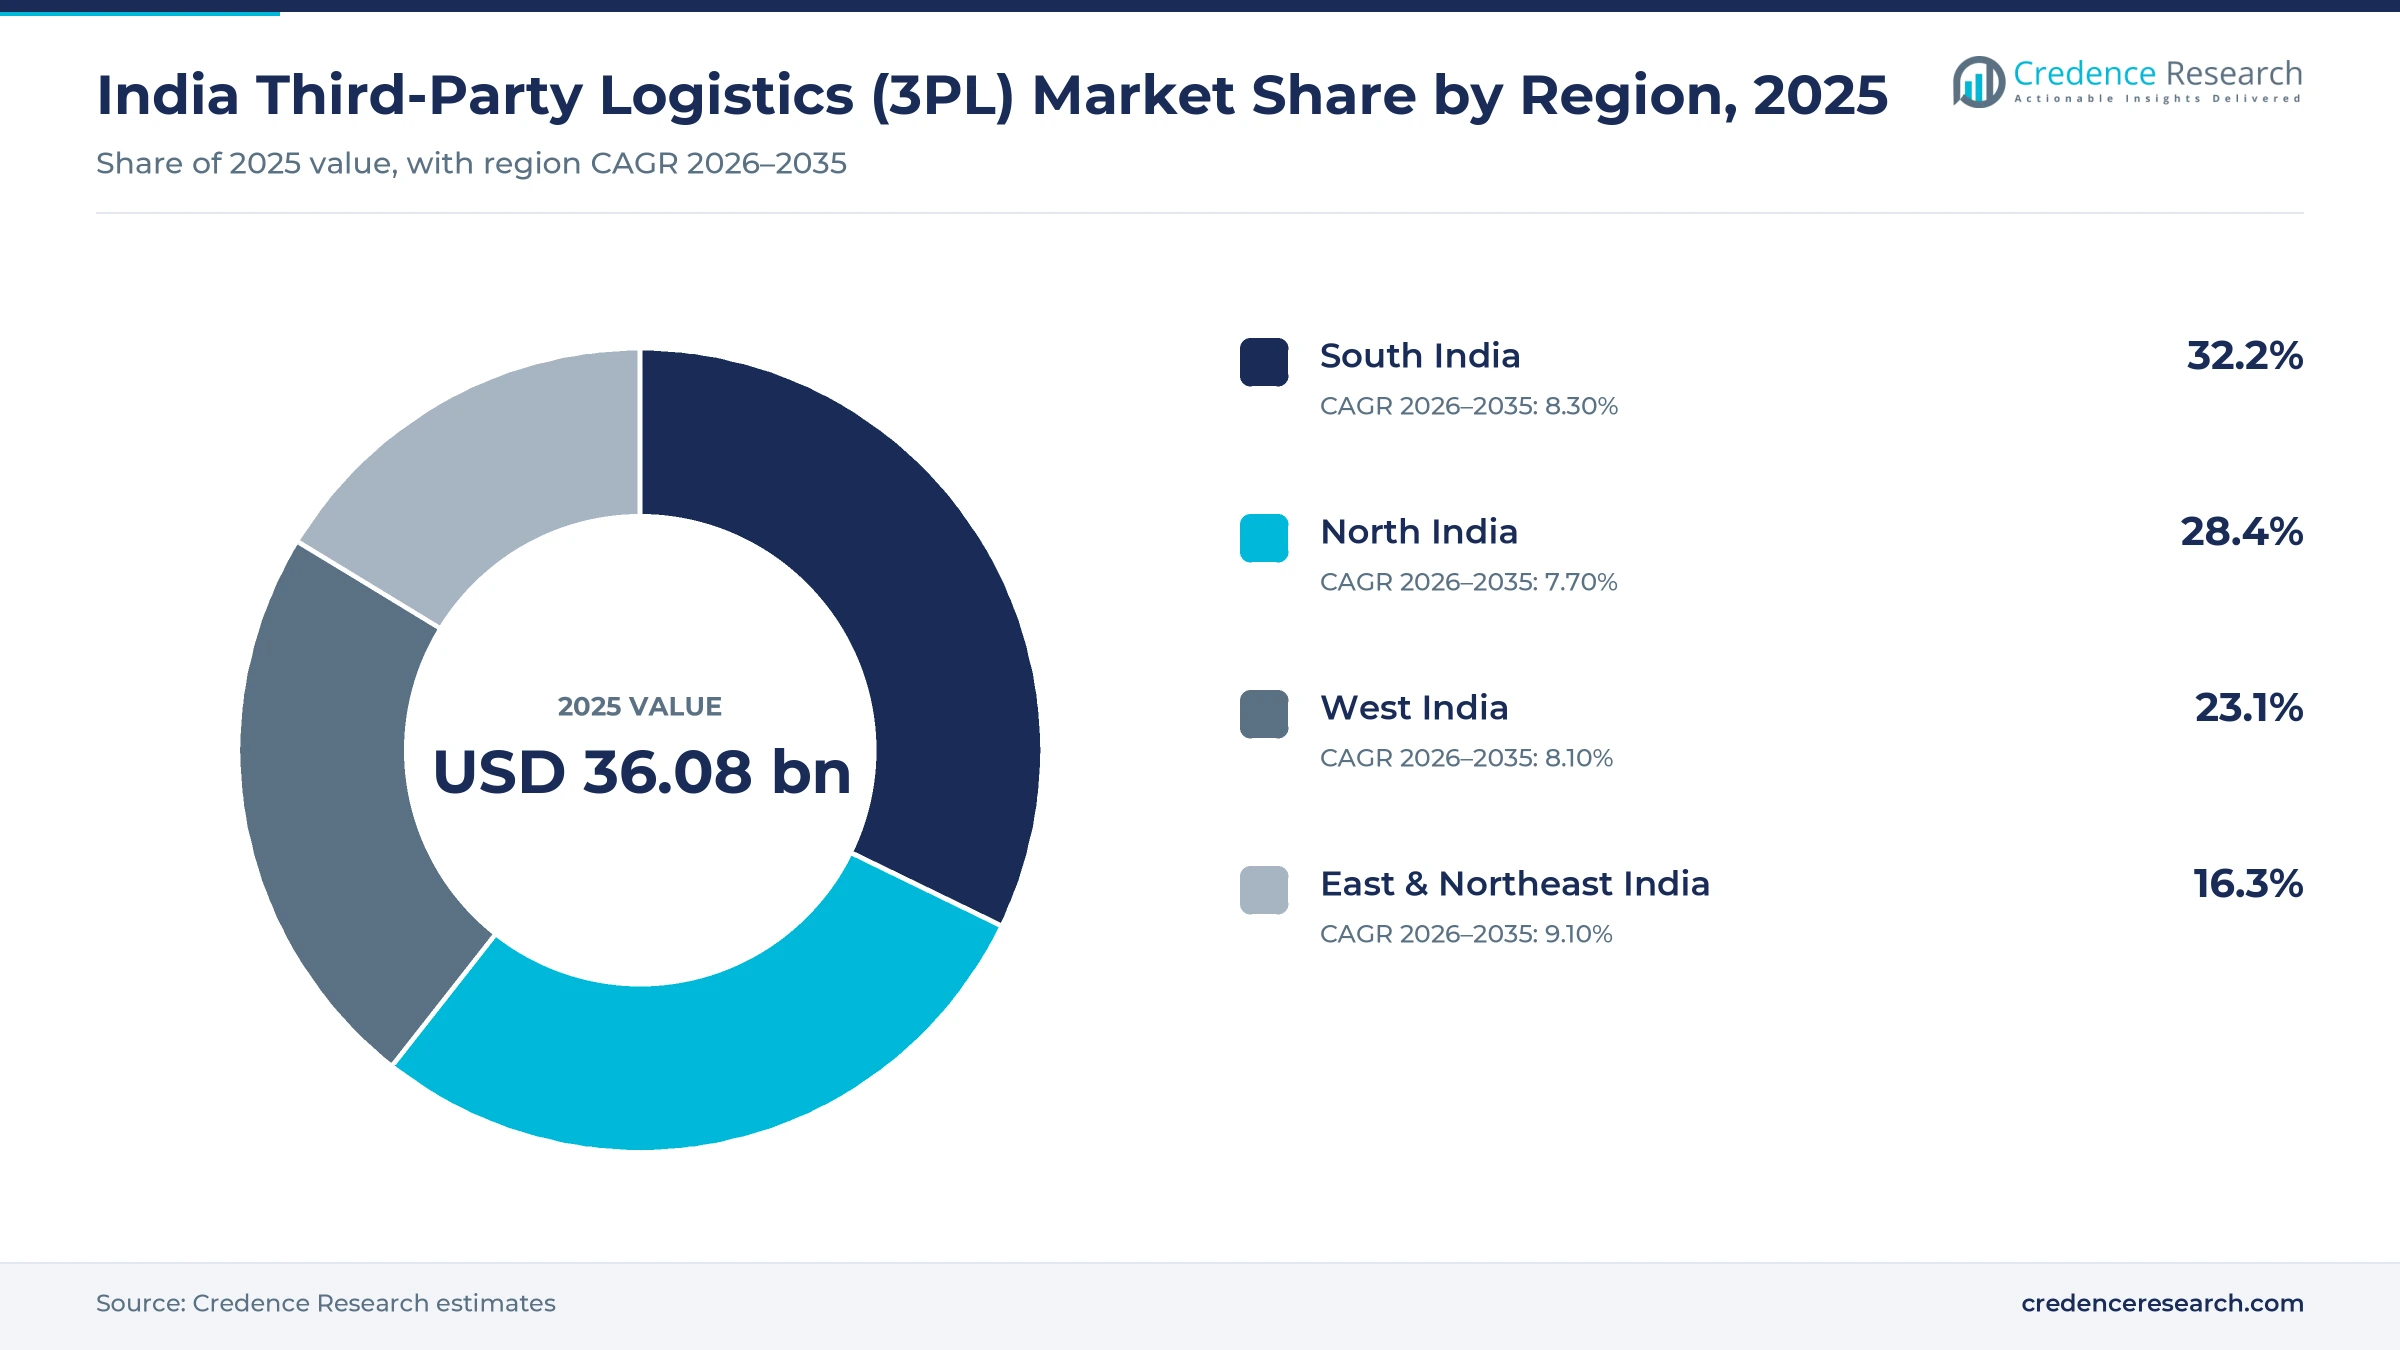
The India third-party logistics (3PL) market was valued at USD 36.08 billion in 2025 and is projected to increase from USD 38.98 billion in 2026 to USD 79.33 billion by 2035, registering a CAGR of 8.22% during 2026–2035. Demand comes from manufacturers, retailers, online sellers and pharmaceutical firms that hand trucking, warehousing, customs and returns to specialist providers instead of running their own fleets and sites. South India held the largest regional share, 32.2% in 2025, because its ports, automotive plants and electronics clusters generate steady contract volumes. East & Northeast India is the fastest-growing region at 9.10% a year, as providers open multi-client warehouses in Assam and Tripura. In turn, the policy setting has shifted toward cheaper freight, and an official assessment released in September 2025 placed national logistics costs at 7.97% of GDP for 2023-24.
Which outsourced freight and warehouse services does the estimate count?
The estimate measures revenue that third-party providers earn in India for managing transport, running warehouses and fulfillment centers, adding services such as kitting and labeling, and arranging freight forwarding and customs clearance. It covers road, rail, air, coastal and multimodal moves for domestic, export, import and returns flows.
The estimate excludes in-house fleets and warehouses that shippers run themselves, the value of the goods carried and passenger transport. The value chain runs from shippers and their contracts through providers, subcontracted truck owners, rail terminals and warehouses to the factories, stores and households that receive each consignment.
India Third-Party Logistics (3PL) Market Insights
- The India third-party logistics (3PL) market was valued at USD 36.08 billion in 2025 and is projected to reach USD 79.33 billion by 2035, registering a CAGR of 8.22% during 2026–2035.
- South India held a 32.2% share of 2025 value, because its ports, automotive plants and electronics clusters create steady contract volumes for outside providers.
- Transportation management led with a 38.0% share of 2025 value, because road trucking remains the main way goods move between Indian factories and cities.
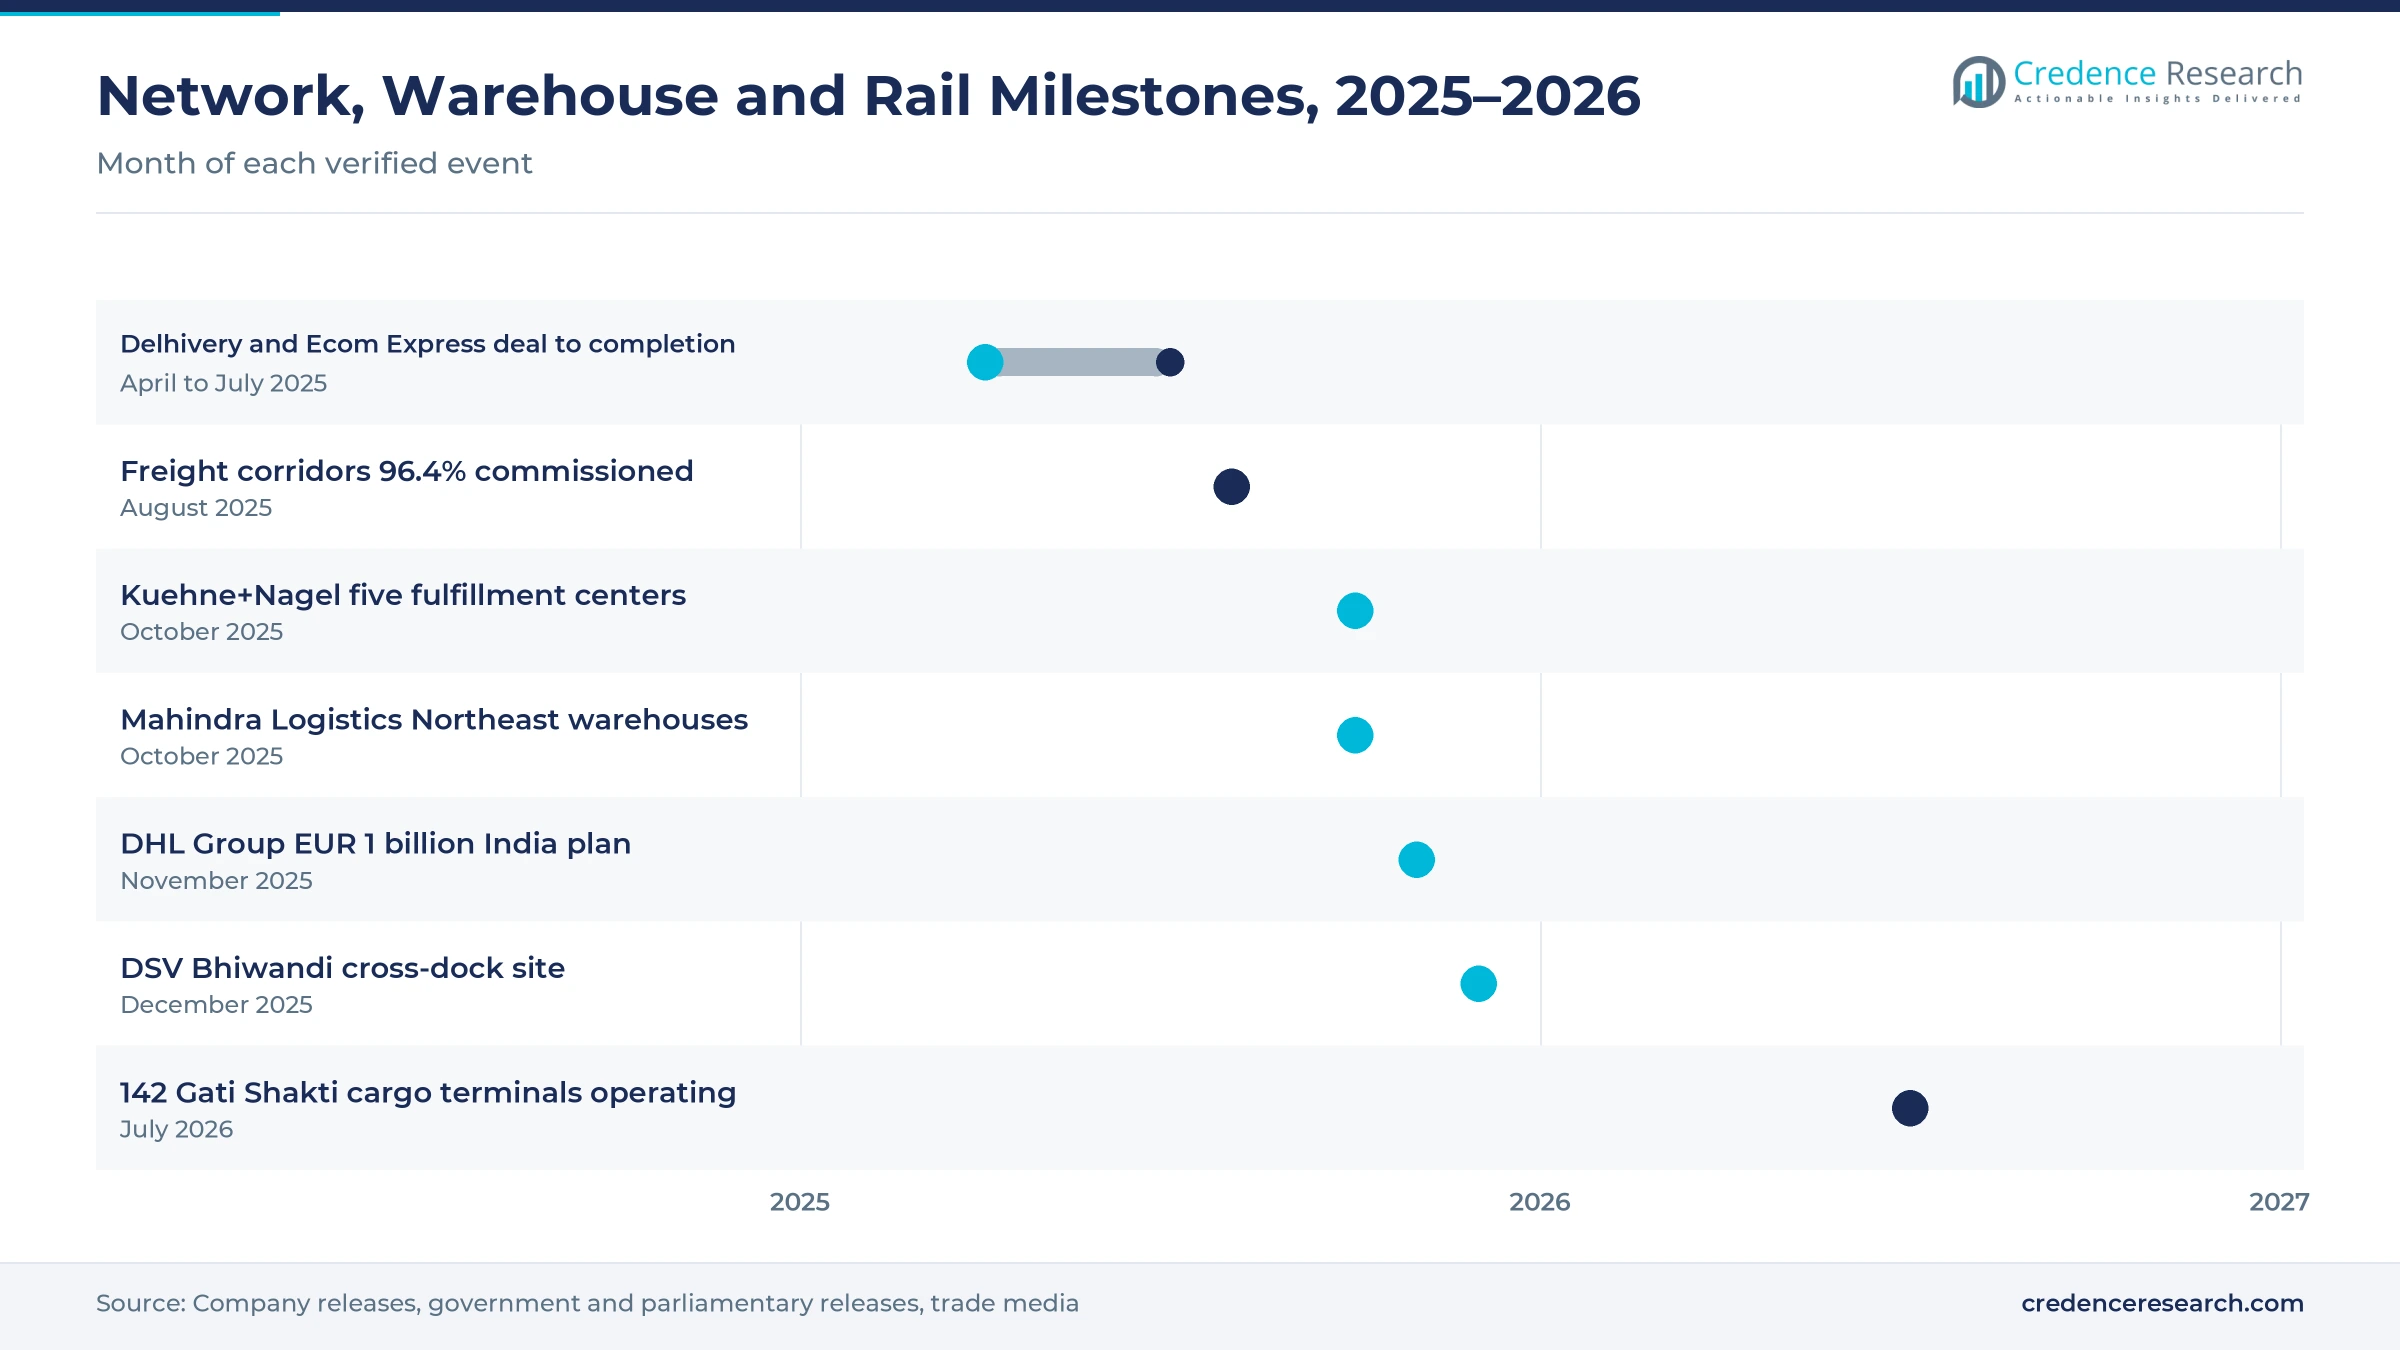
- Indian Railways had commissioned 2,741 km of the 2,843 km Eastern and Western Dedicated Freight Corridors by August 2025, or 96.4% of the network.
- Delhivery raised its holding in Ecom Express to 99.87% in July 2025, after agreeing in April 2025 to buy the parcel carrier for up to Rs 1,407 crore.
Trucking contracts lead as warehousing gains pace
Why does transportation management hold the largest share?
Based on service type, the market is categorized into transportation management, warehousing and fulfillment, value-added logistics and freight forwarding and customs. Transportation Management led with a 38.0% share of 2025 value, because most contracts start with trucking between plants, depots and cities. Warehousing & Fulfillment grows fastest at 9.03% a year, as shippers move stock into shared, automated warehouses run by outside providers.
How do road, rail and multimodal moves compare?
Based on mode of transport, the market is categorized into road, rail, air, ocean and coastal, and multimodal moves. Road led with a 62.0% share of 2025 value, because trucks reach almost every district and handle short trips. Multimodal grows fastest at 9.73% a year, as freight corridors and cargo terminals make rail and road combinations cheaper for long hauls.
Which shippers buy the most outsourced services?
Based on customer type, the market is categorized into contracted enterprise accounts, mid-market shippers, MSME and D2C shippers, and institutional and public-sector buyers. Contracted Enterprise Accounts led with a 48.0% share of 2025 value, because large manufacturers sign multi-year contracts. MSME & D2C Shippers grow fastest at 9.31% a year, as small online brands rent shared warehouse space and pay per order.
Which industries generate the most outsourced volume?
Based on end-use industry, the market is categorized into automotive and industrial manufacturing, retail and e-commerce, FMCG and consumer goods, pharmaceuticals and healthcare, and electronics and high-tech. Automotive & Industrial Manufacturing led with a 27.0% share of 2025 value, because plants need inbound parts and outbound vehicle moves. Retail & E-Commerce grows fastest at 9.02% a year, as online orders and returns keep rising.
| Segment Group | Leading Sub-segment | Share, 2025 | Fastest-growing Sub-segment | CAGR, 2026–2035 |
|---|---|---|---|---|
| By Service Type | Transportation Management | 38.0% | Warehousing & Fulfillment | 9.03% |
| By Mode of Transport | Road | 62.0% | Multimodal | 9.73% |
| By Customer Type | Contracted Enterprise Accounts | 48.0% | MSME & D2C Shippers | 9.31% |
| By End-Use Industry | Automotive & Industrial Manufacturing | 27.0% | Retail & E-Commerce | 9.02% |
Request a Free Sample
Fill in your details and we'll send you a free sample report.
- Sample data tables & charts
- Research methodology
Outsourcing, rail corridors and digital links drive demand
How do outsourcing and frequent fulfillment lift contract volumes?
Enterprise outsourcing and high-frequency fulfillment lift contract volumes, because shippers now want smaller, faster deliveries that in-house fleets struggle to run at low cost. GST e-way bills, which track goods moved by road, reached a record 138.39 million in December 2025, up 23.6% from a year earlier. Kuehne+Nagel added 100,000 square meters across five Indian fulfillment centers in October 2025, according to Kuehne+Nagel, and raised peak order handling capacity by 75%. Nippon Express ran 60 warehouses with about 44.9 lakh square feet in June 2025 and plans to double that space by 2028. As a result, warehousing and fulfillment grows at 9.03% a year during 2026–2035.
Why does the multimodal infrastructure build-out matter?
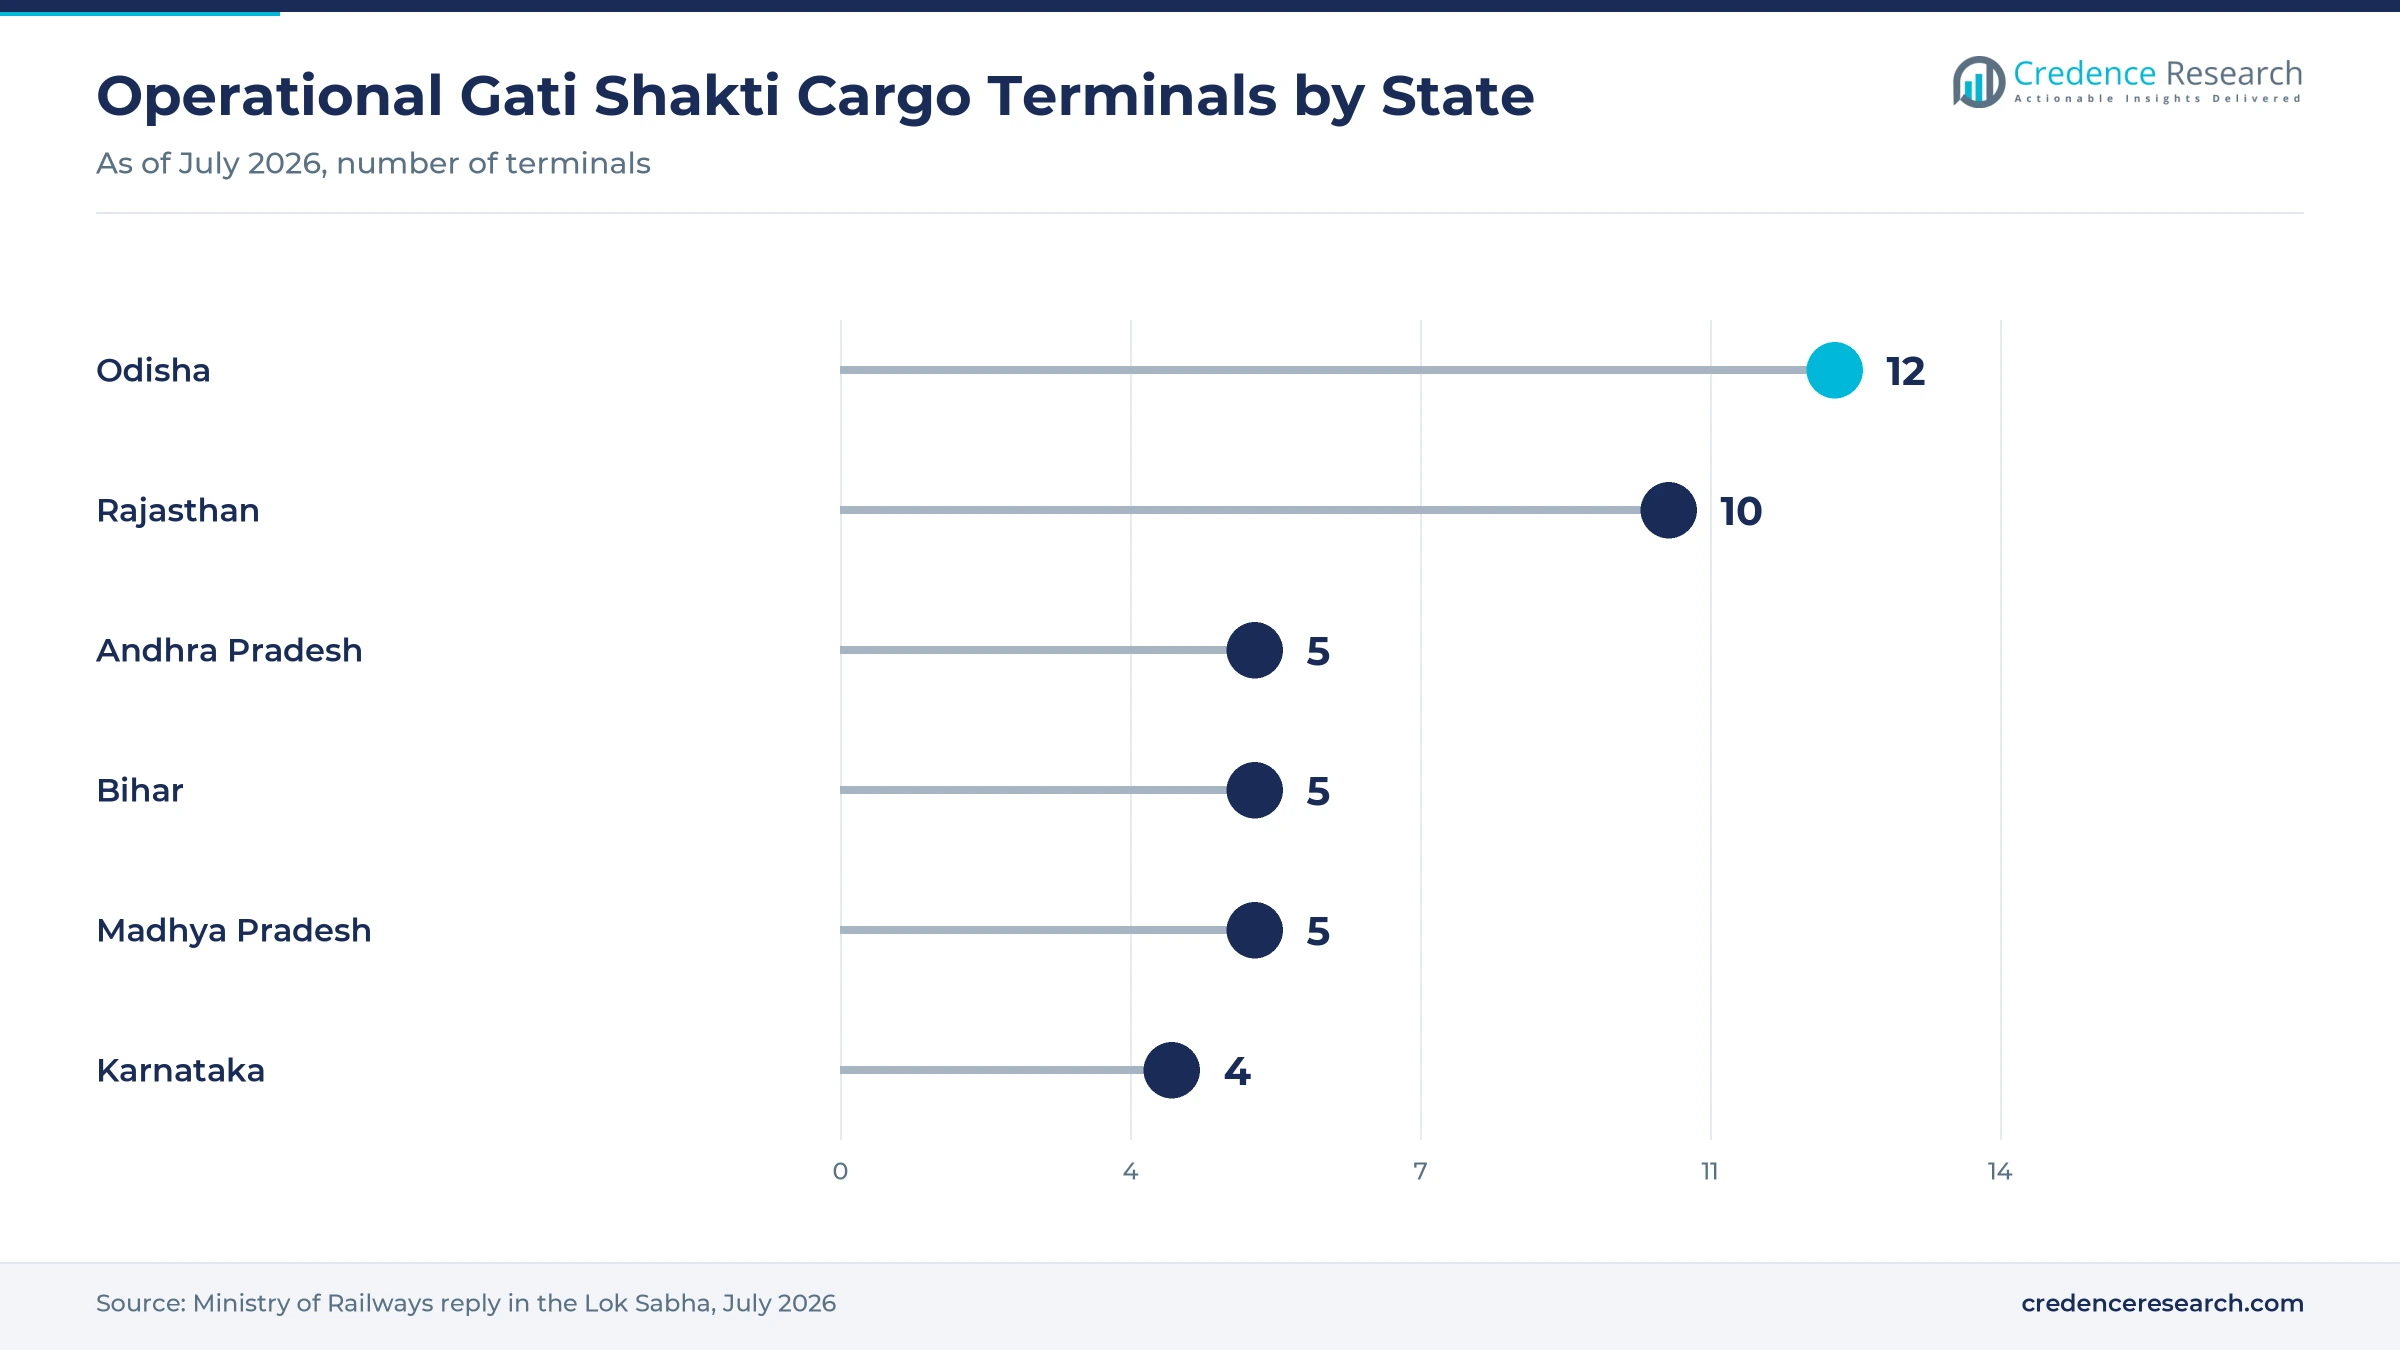
The multimodal infrastructure build-out matters, because new rail corridors and cargo terminals cut the cost of moving goods over long distances. Indian Railways had commissioned 2,741 km of the 2,843 km Eastern and Western Dedicated Freight Corridors by August 2025, according to India Shipping News. Railway freight loading reached about 1,617.38 million metric tons in 2024-25, and domestic container loading rose 19.72% from the previous year. By July 2026, 142 Gati Shakti cargo terminals were operating, with capacity of 224 million metric tons a year and about Rs 10,000 crore of private investment. In turn, multimodal moves grow at 9.73% a year, the fastest of all transport modes.
How does national digital integration help outside providers?
National digital integration helps outside providers, because shared data links let them track cargo and clear paperwork without manual checks at each step. The Unified Logistics Interface Platform launched on Sept. 17, 2022, under the National Logistics Policy, and it has since passed 100 crore API transactions. The platform connects 43 systems from 11 ministries through 129 APIs, and more than 1,300 companies have registered to use it. India also climbed to 38th of 139 countries in the 2023 Logistics Performance Index, up from 44th in 2018. As a result, providers with digital control towers can offer real-time visibility to enterprise accounts, which hold 48.0% of 2025 value.
Why do falling costs and steady growth draw new investment?
Falling logistics costs and steady economic growth draw new investment, because global and domestic providers see room to expand contracts across manufacturing and retail. An assessment prepared by NCAER for DPIIT placed logistics costs at 7.97% of GDP in 2023-24, according to Maritime Gateway. India's real GDP grew 7.8% in 2025 and is projected to grow 7.0% in 2026, according to IMF data. DHL Group said in November 2025 that it would invest around EUR 1 billion in India by 2030, according to DHL Group. In turn, providers are adding warehouse space, fleets and technology, which supports steady growth for the market through 2035.
Consolidation, eastern hubs and specialist services
How is the shift toward consolidation reshaping express networks?
The shift toward consolidation is reshaping express networks, because larger carriers can spread hub and technology costs over more parcels. Delhivery agreed on April 5, 2025, to buy Ecom Express for up to Rs 1,407 crore in cash, and its holding reached 99.87% in July 2025. Delhivery already served more than 18,700 pin codes before the deal, which gives the combined network wide reach. Allcargo Gati reported direct delivery to more than 5,400 pin codes and coverage of 735 of India's 739 districts in late 2024. As a result, fewer and larger networks now compete for parcel contracts, which supports the use of automated sorting systems at major hubs.
Why is the rise of warehouses beyond the metros significant?
The rise of warehouses beyond the metros is significant, because shippers want stock closer to buyers in smaller cities and new consumption centers. Mahindra Logistics opened facilities of 3 lakh square feet in Guwahati and 1.3 lakh square feet in Agartala in October 2025. The company already ran more than 1 million square feet of multi-client space in eastern India under its Go-East plan. Kuehne+Nagel also placed new fulfillment centers in tier-2 and tier-3 locations such as Nagpur and Rajpura in October 2025. In turn, East & Northeast India is the fastest-growing region, because new shared sites shorten delivery times to buyers in the Northeast.
Can healthcare and EV supply chains open specialist contracts?
Healthcare and electric vehicle supply chains can open specialist contracts, because these goods need temperature control, safety handling and strict tracking. DHL Group plans its first Health Logistics hub for DHL Supply Chain India in Bhiwandi, as part of the investment plan it announced in November 2025. The same EUR 1 billion plan includes EV and battery logistics centers of excellence in Chennai and Mumbai, and DHL already employs more than 1,300 digital and logistics experts in India. CEVA Logistics opened a corporate office in Mumbai in 2025 and employs nearly 10,000 people across India, with a focus on technology, aerospace and retail flows. As a result, pharmaceuticals and healthcare is a valuable niche, and providers with certified sites can charge higher rates than for general storage.
Is warehouse automation an opening for MSME and D2C contracts?
Shared, automated warehouses offer an opening for MSME and D2C contracts, because small sellers cannot afford their own sites, software and staff. MSME and D2C shippers grow at 9.31% a year, the fastest of all customer types during 2026–2035. DSV opened a 25,000-square-foot cross-dock site in Bhiwandi in December 2025 and added seven trucks, including two electric vehicles. Nippon Express also plans to double its Indian warehouse footprint by 2028, which adds shared capacity for smaller clients. In turn, providers that invest in warehouse automation can serve many small brands from one site and still meet next-day delivery promises.
Road dependence, land costs and uneven digital uptake
How does heavy road dependence limit margins?
Heavy road dependence limits margins, because most freight still moves by truck and many trucks belong to small owners with old vehicles. As a result, fuel prices, driver shortages and empty return trips raise costs for providers that subcontract fleets. Providers respond by shifting long hauls to rail and by planning loads with route software. In turn, firms that combine road freight with rail terminals protect margins better than pure truck brokers.
Why do land and labor costs slow warehouse expansion?
Land and labor costs slow warehouse expansion, because sites near large cities are scarce and building approvals can take many months. As a result, providers face higher rents and longer payback periods for new multi-client centers. Many firms respond by building in tier-2 and tier-3 towns where land is cheaper. In turn, these locations need trained staff and good road links, which some districts still lack. This gap means that warehouse growth in smaller towns depends on parallel road and rail investment.
How do uneven digital skills hold back small shippers?
Uneven digital skills hold back small shippers, because many MSMEs still book trucks by phone and track loads manually. As a result, these firms struggle to connect with provider platforms and national data systems. Providers respond with simple apps, onboarding support and pay-per-use pricing. In turn, adoption is rising, but the gap between large and small shippers remains wide in many states. This divide slows the spread of shared warehousing and visibility tools outside the main industrial corridors.
Why does price competition squeeze contract renewals?
Price competition squeezes contract renewals, because many providers offer similar trucking and storage services and shippers often re-tender every year. As a result, providers face pressure to cut rates even as wages and rents rise. Larger firms respond with bundled services such as customs, freight forwarding and returns handling. In turn, providers that offer integrated services and data reporting keep clients on longer contracts than rivals.
South India leads as the Northeast adds warehouse space
| Region | Value, 2025 (USD billion) | Share, 2025 | CAGR, 2026–2035 |
|---|---|---|---|
| South India | 11.62 | 32.2% | 8.30% |
| North India | 10.25 | 28.4% | 7.70% |
| West India | 8.34 | 23.1% | 8.10% |
| East & Northeast India | 5.88 | 16.3% | 9.10% |
Why do southern ports and plants lead outsourced volumes?
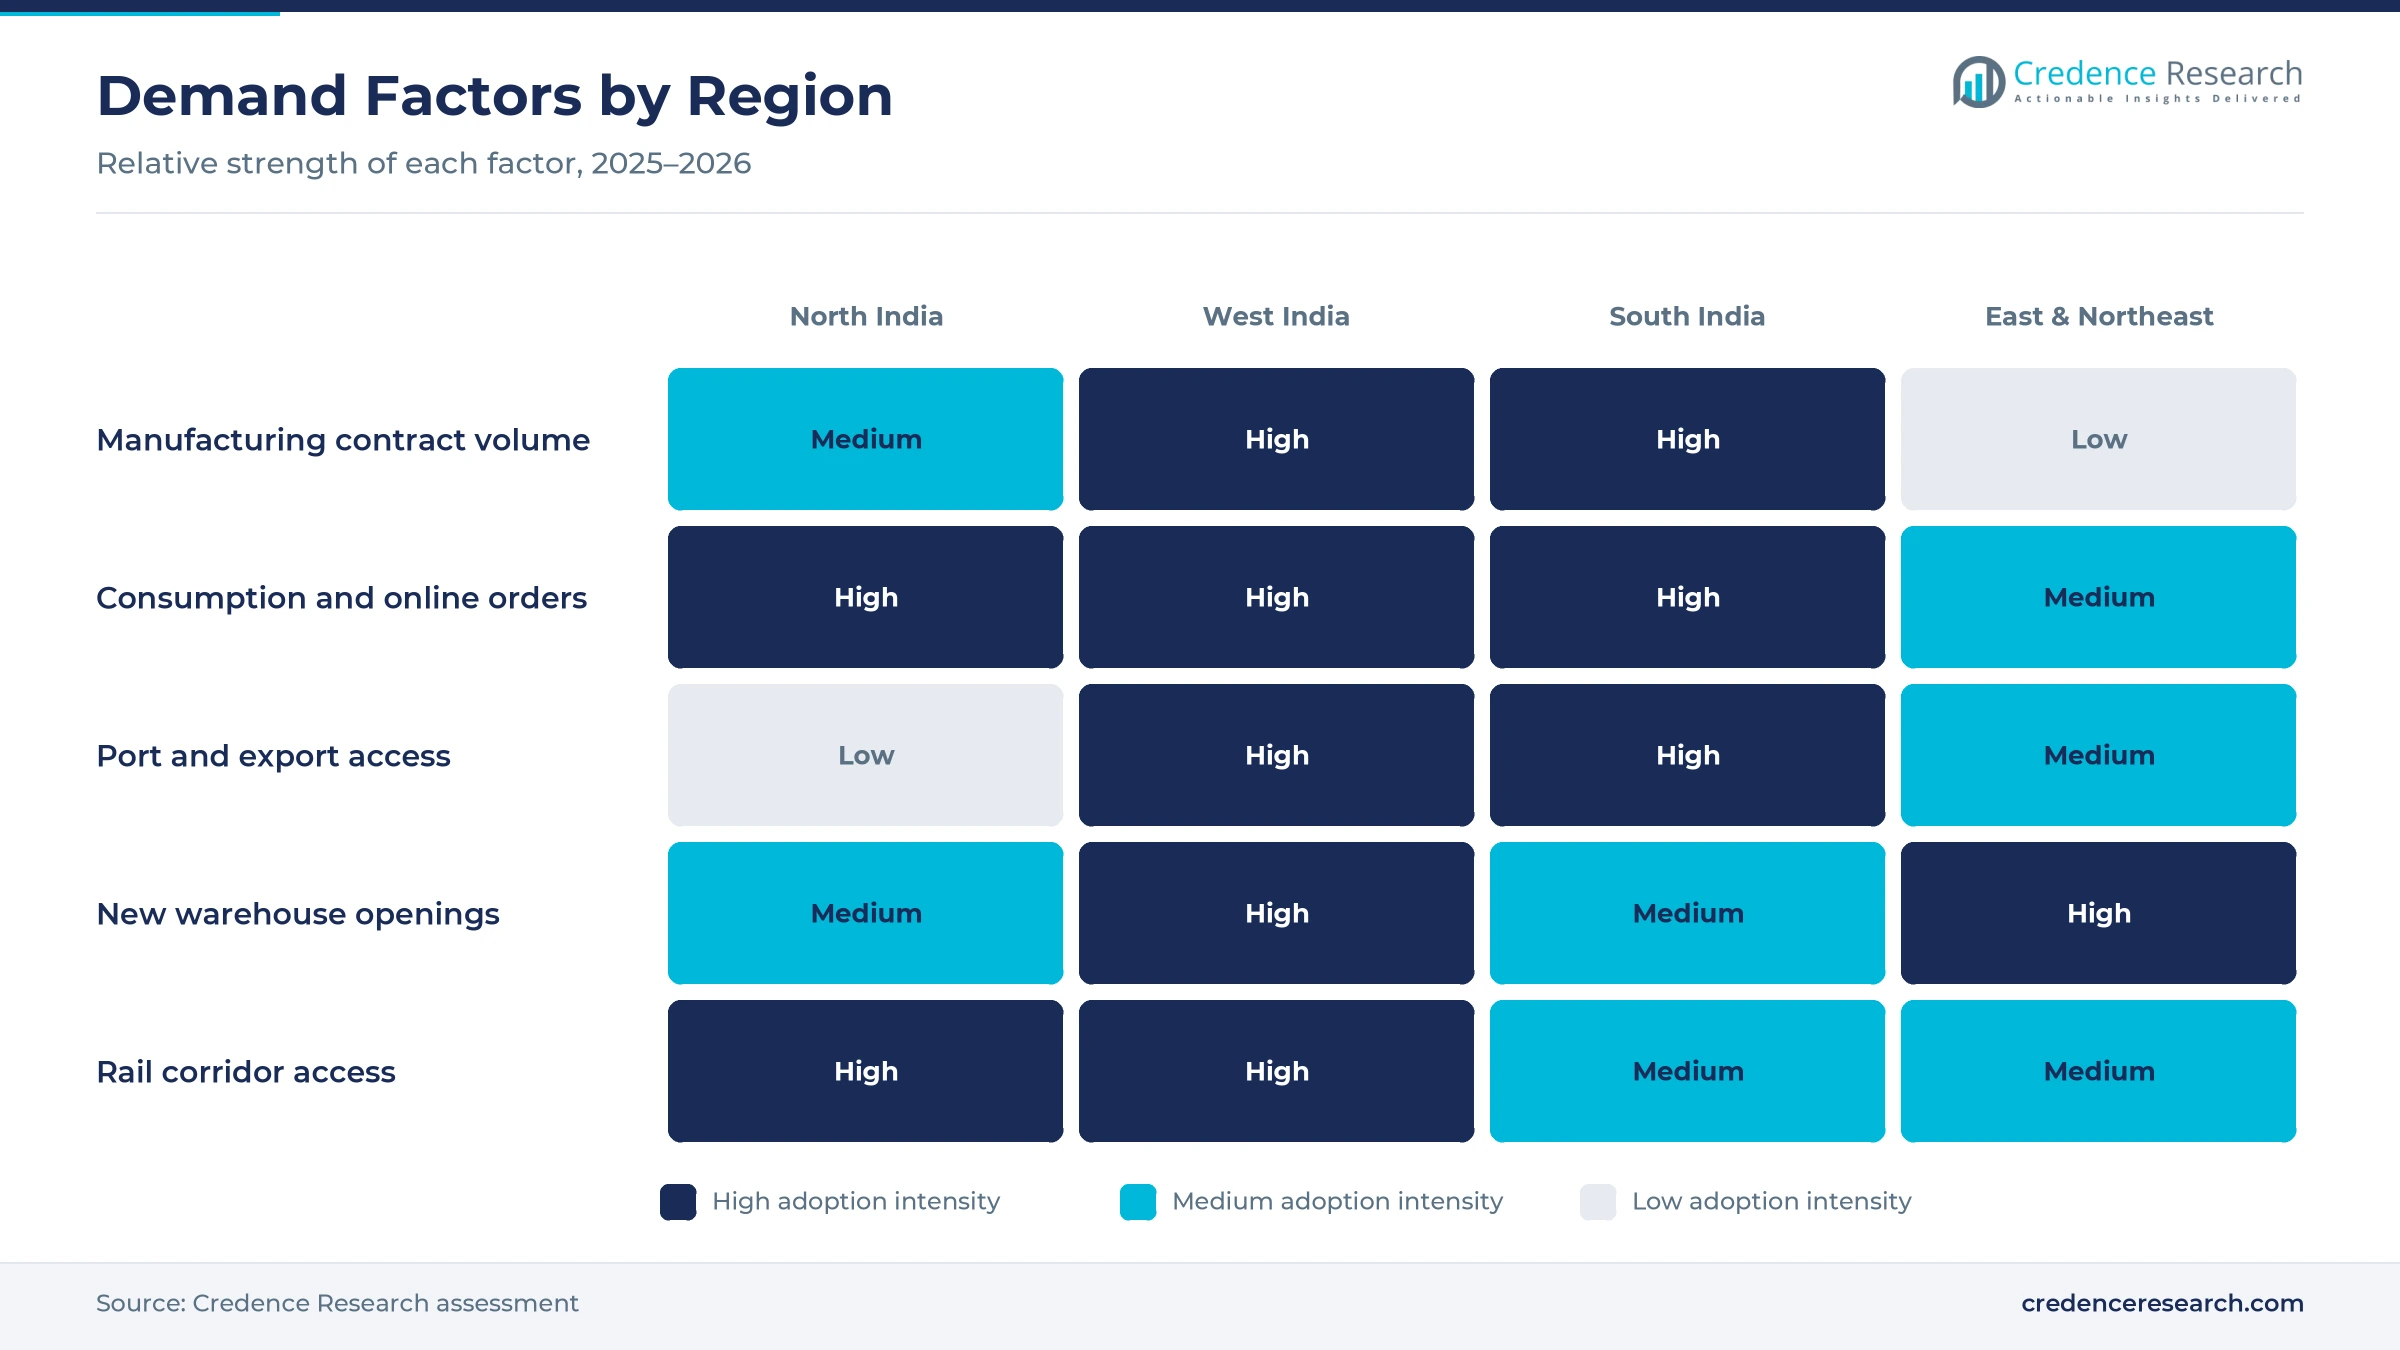
South India held a 32.2% share of 2025 value and grows at 8.30% a year, because Chennai, Bengaluru and Hyderabad host automotive, electronics and pharmaceutical plants with heavy contract needs. Ports on both coasts support export and import flows for these clusters. DHL Group also plans an EV and battery logistics center in Chennai under its India investment program. As a result, the region keeps the largest share of outsourced freight and storage spending.
How does the northern consumption belt add demand?
North India held a 28.4% share of 2025 value and grows at 7.70% a year, because Delhi-NCR and nearby states form a large consumption and distribution belt. The Eastern Dedicated Freight Corridor links Punjab with eastern states and supports long-haul rail moves. Kuehne+Nagel placed new fulfillment centers in Gurgaon and Rajpura in October 2025. In turn, the region attracts large distribution centers for FMCG, retail and online orders.
Why are western warehouse clusters around Mumbai growing?
West India held a 23.1% share of 2025 value and grows at 8.10% a year, because Mumbai, Pune and Gujarat combine ports, factories and large warehouse clusters. Bhiwandi near Mumbai hosts new sites from DSV and the planned DHL Health Logistics hub. The Western Dedicated Freight Corridor also links the JNPT port with northern markets. As a result, the region remains a key gateway for import, export and pharmaceutical flows.
How are eastern and northeastern states adding capacity?
East & Northeast India held a 16.3% share of 2025 value and grows fastest at 9.10% a year, because providers are opening new warehouses in Assam and Tripura. Mahindra Logistics added more than 4 lakh square feet across Guwahati and Agartala in October 2025. Eastern Railway also posted a 16.11% rise in freight loading in 2024-25, the highest of any railway zone. In turn, the region gains share from a smaller base.
Acquisitions, hubs and rail milestones in 2025–2026
| Development | Status and market relevance |
|---|---|
| In April 2025, Delhivery agreed to buy Ecom Express for up to Rs 1,407 crore in cash, and its holding reached 99.87% in July 2025. | Consolidates two large parcel networks |
| In August 2025, Indian Railways reported that 2,741 km of the 2,843 km Eastern and Western Dedicated Freight Corridors were commissioned. | Shifts long-haul freight toward rail |
| In October 2025, Kuehne+Nagel added 100,000 square meters across five fulfillment centers in Mumbai, Kolkata, Gurgaon, Nagpur and Rajpura. | Raises peak order handling capacity by 75% |
| In October 2025, Mahindra Logistics opened multi-client warehouses of 3 lakh square feet in Guwahati and 1.3 lakh square feet in Agartala. | Expands shared storage in the Northeast |
| In November 2025, DHL Group announced plans to invest around EUR 1 billion in India by 2030, including a Health Logistics hub in Bhiwandi. | Adds healthcare and EV logistics capacity |
Control towers, sorters and data links lift service
- Control tower platforms combine order, truck and warehouse data in one view, which lets enterprise accounts track every consignment and spot delays early.
- Automated sorters scan and route parcels at large hubs, which cuts manual handling and supports next-day delivery for online orders.
- Warehouse management systems track stock, picking and packing for each client, which lets many small brands share one multi-client site.
- National data links connect provider systems with government platforms for documents and cargo status, which reduces paperwork at each handover.
Need a Custom Version of This Report?
Tailor the scope, geography, or segments to your exact requirements.
- Custom geography or segment scope
- Direct access to our analyst team
Express networks and global contract providers compete
Competition is shaped by domestic express networks, contract providers with dedicated warehouses and global firms that bring freight forwarding and specialist services. Delhivery now controls Ecom Express and serves a nationwide parcel network. Mahindra Logistics competes for automotive, consumer goods and online accounts with multi-client warehouses, including new sites in the Northeast. Kuehne+Nagel, DHL Supply Chain India, CEVA Logistics, DSV and Nippon Express compete for multinational clients with fulfillment centers, customs and international freight. Allcargo Gati and Transport Corporation of India compete in surface express, rail and coastal moves. Rivals compete on coverage, delivery speed, warehouse quality, technology and price. Because large shippers judge providers on reliability and data reporting, firms with dense networks and strong control towers usually win the biggest contracts.
Which providers manage outsourced freight and storage in India?
| Company | Type | Role in the market |
|---|---|---|
| Delhivery Limited | Domestic express and contract provider | Raised its holding in Ecom Express to 99.87% in July 2025 |
| Mahindra Logistics Limited | Domestic contract provider | Opened Guwahati and Agartala warehouses in October 2025 |
| Kuehne+Nagel India | Global contract and freight provider | Added 100,000 square meters across five fulfillment centers in 2025 |
| DHL Supply Chain India | Global contract provider | Plans a Health Logistics hub in Bhiwandi under a EUR 1 billion group plan |
| Nippon Express India | Global contract and freight provider | Ran 60 warehouses with about 44.9 lakh square feet in June 2025 |
| Allcargo Gati Limited | Surface express provider | Covers 735 of 739 districts with direct delivery to 5,400 pin codes |
| DSV India | Global freight and contract provider | Opened a 25,000-square-foot cross-dock site in Bhiwandi in December 2025 |
Credence Research view on Indian outsourced supply chains
Credence Research's view is that Indian outsourced freight and storage will keep growing faster than the economy, because shippers want lower costs, faster delivery and better tracking than in-house teams can offer. Transportation management remains the largest value pool, while warehousing and fulfillment, multimodal moves and MSME and D2C shippers add the fastest growth. Rail corridors, cargo terminals and national data links will lower costs per metric ton. Providers that combine dense networks, shared warehouses and digital control towers should gain the most, while price competition and land costs keep pressure on margins.
How the Indian outsourced freight estimate was built
The report uses 2025 as the base year on a calendar basis, and market values come from the Credence Research model. That model combines official freight and rail statistics, GST e-way bill data, IMF growth data and company releases on warehouses, acquisitions and networks. Regional shares follow the client's zone definitions, while segment splits and growth rates are Credence Research estimates. Sources used are official statistics, government and parliamentary releases, IMF data and company releases reported in trade media, and no interviews or surveys were used.
Rail, warehousing and data integration carry growth to 2035
The India third-party logistics (3PL) market is expected to reach USD 79.33 billion by 2035, an 8.22% CAGR during 2026–2035, as shippers outsource more freight, storage and returns. Growth should be strongest in warehousing and fulfillment, multimodal moves, MSME and D2C shippers and East & Northeast India, because these areas gain most from new terminals, shared warehouses and digital links. Rail corridors and data platforms will raise speed and control, while road dependence, land costs and price competition could slow some providers.
Frequently Asked Questions
How big is the India third-party logistics (3PL) market?
Which service type leads Indian outsourced freight spending?
Which region leads the Indian market?
How do freight corridors affect outsourced transport?
What role does the Unified Logistics Interface Platform play?
Which customer type is growing fastest?
Who are the leading companies in the Indian market?
What are the main challenges for providers in India?
Table of Content
Chapter 1 Market Segmentation
- 1.1 Segmentation Framework
- 1.1.1 Product and Service Classification
- 1.1.2 Application and End-Use Classification
- 1.1.3 Technology and Solution Classification
- 1.1.4 Customer and Distribution Channel Classification
- 1.1.5 Geographic Segmentation
- 1.1.6 Market Segment Definitions and Boundaries
- 1.2 By Service Type
- 1.2.1 Transportation Management
- 1.2.2 Warehousing & Fulfillment
- 1.2.3 Value-Added Logistics
- 1.2.4 Freight Forwarding & Customs
- 1.3 By Mode of Transport
- 1.3.1 Road
- 1.3.2 Rail
- 1.3.3 Air
- 1.3.4 Ocean & Coastal
- 1.3.5 Multimodal
- 1.4 By Customer Type
- 1.4.1 Contracted Enterprise Accounts
- 1.4.2 Mid-Market Shippers
- 1.4.3 MSME & D2C Shippers
- 1.4.4 Institutional & Public-Sector Buyers
- 1.5 By End-Use Industry
- 1.5.1 Automotive & Industrial Manufacturing
- 1.5.2 Retail & E-Commerce
- 1.5.3 FMCG & Consumer Goods
- 1.5.4 Pharmaceuticals & Healthcare
- 1.5.5 Electronics & High-Tech
Chapter 2 Introduction
- 2.1 Report Objectives and Scope
- 2.2 Product Definition and Industry Terminology
- 2.3 Market Inclusions and Exclusions
- 2.4 Research Process
- 2.4.1 Primary Research and Expert Interviews
- 2.4.2 Secondary Research and Source Review
- 2.4.3 Top-Down and Bottom-Up Estimation
- 2.4.4 Data Triangulation and Verification
- 2.5 Market Size Measurement Basis
- 2.5.1 2025: USD 36.08 billion → 2035: USD 79.33 billion
- 2.6 Historical and Forecast Reference Periods
- 2.6.1 Historical Period: 2018-2025
- 2.6.2 Base Year: 2025
- 2.6.3 Forecast Period: 2025-2035
- 2.7 Research Assumptions and Limitations
Chapter 3 Executive Summary
- 3.1 Market Snapshot and Key Findings
- 3.2 Base-Year Market Size, 2025
- 3.3 Forecast Market Size, 2035
- 3.4 Revenue and Volume Growth Outlook
- 3.5 Key Demand and Supply Indicators
- 3.6 Leading Market Segments
- 3.7 Fastest-Growing Market Opportunities
- 3.8 Regional Performance Highlights
- 3.9 Technology and Industry Transformation
- 3.10 Competitive Landscape Summary
- 3.11 Analyst View and Strategic Implications
Chapter 4 India Third-Party Logistics (3PL) Market Trends and Developments
- 4.1 Historical Industry Development, 2018-2025
- 4.2 Recent Market Trends and Developments
- 4.3 Demand and Customer Behavior Trends
- 4.4 Technology and Product Innovation
- 4.5 Artificial Intelligence, Automation and Digitalization
- 4.6 Local Manufacturing and Supply Chain Realignment
- 4.7 Industry Partnerships, Mergers and Acquisitions
- 4.8 Sustainability and Circular Economy Developments
- 4.9 Government and Private Sector Investment Trends
- 4.10 Emerging Business Models and Commercialization
- 4.11 Industry Developments and Announcements
Chapter 5 India Third-Party Logistics (3PL) Market Production, Supply and Demand Analysis
- 5.1 Demand Trend and Consumption Analysis, 2018-2025
- 5.2 Demand Forecast, 2025-2035
- 5.3 Production and Output Trend, 2018-2025
- 5.4 Production and Output Forecast, 2025-2035
- 5.5 Installed Capacity and Capacity Utilization
- 5.6 Company-Wise Production Plants and Statistics
- 5.6.1 Installed Production Capacity
- 5.6.2 Actual Production
- 5.6.3 Planned Capacity and Expansion Targets
- 5.7 Supply Chain Structure and Procurement Trends
- 5.8 Supply-Demand Gap and Bottlenecks
- 5.9 Import Dependence and Sourcing Structure
- 5.10 Contract Manufacturing and Outsourcing
- 5.11 Regional Supply and Demand Concentration
Chapter 6 India Third-Party Logistics (3PL) Market Pricing Analysis
- 6.1 Pricing Structure and Measurement
- 6.2 Historical Pricing Trends, 2018-2025
- 6.3 Pricing Outlook, 2025-2035
- 6.4 Average Selling Price and Unit Economics
- 6.5 Pricing by Product and Market Segment
- 6.6 Geographic Pricing Differences
- 6.7 Key Input, Energy, Labor and Logistics Costs
- 6.8 Contract Pricing and Purchasing Models
- 6.9 Pricing Sensitivity and Competitive Positioning
- 6.10 Price, Margin and Profitability Implications
Chapter 7 India Third-Party Logistics (3PL) Market Dynamics
- 7.1 Market Growth Drivers
- 7.1.1 Demand-Side Drivers
- 7.1.2 Technology and Innovation Drivers
- 7.1.3 Infrastructure and Investment Drivers
- 7.1.4 Regulatory and Policy Drivers
- 7.2 Market Restraints
- 7.2.1 Cost and Affordability Constraints
- 7.2.2 Technology and Adoption Barriers
- 7.2.3 Supply Chain and Operational Constraints
- 7.3 Market Challenges
- 7.3.1 Competitive Pressure and Margin Erosion
- 7.3.2 Skills, Infrastructure and Implementation Gaps
- 7.4 Emerging Market Opportunities
- 7.5 Market Dynamics Impact and Time-Horizon Assessment
Chapter 8 India Third-Party Logistics (3PL) Value Chain Analysis
- 8.1 Industry Value Chain Overview
- 8.2 Upstream Suppliers and Critical Inputs
- 8.3 Technology and Component Providers
- 8.4 Manufacturing or Service Delivery
- 8.5 Distribution, Channel Partners and Integrators
- 8.6 Downstream Applications and End Users
- 8.7 Value Addition and Profit Pools
- 8.8 Vertical Integration and Outsourcing
- 8.9 Supplier Concentration and Risk
- 8.10 Supply Chain Localization and Resilience
Chapter 9 India Third-Party Logistics (3PL) Market Regulations and Policies
- 9.1 Relevant Laws, Standards and Compliance Frameworks
- 9.2 Product, Service, Safety and Quality Requirements
- 9.3 Government Policies, Incentives and Subsidies
- 9.4 Imports, Exports and Trade Barriers
- 9.5 Public Procurement and Local Content Requirements
- 9.6 Environmental and Sustainability Compliance
- 9.7 Upcoming Policy Changes and Market Implications
Chapter 10 India Third-Party Logistics (3PL) Market Hotspots and Opportunities
- 10.1 Market Opportunity Mapping and Growth Hotspots
- 10.2 High-Growth Applications and Customer Groups
- 10.3 Underserved Markets and White-Space Opportunities
- 10.4 Emerging Technology and Product Opportunities
- 10.5 New Capacity and Investment Hotspots
- 10.6 Market Entry and Expansion Opportunities
- 10.7 Distribution and Partnership Opportunities
- 10.8 Near-Term and Long-Term Commercial Potential
- 10.9 Opportunity Attractiveness and Execution Risks
Chapter 11 India Third-Party Logistics (3PL) Market Outlook, 2025-2035
- 11.1 Market Size and Analysis
- 11.1.1 Revenue (Market Measurement: 2025: USD 36.08 billion → 2035: USD 79.33 billion)
- 11.1.2 Market Volume and Quantity Sold
- 11.1.3 Historical Market Size, 2018-2025
- 11.1.4 Base-Year Market Size, 2025
- 11.2 Market Forecast, 2025-2035
- 11.2.1 Revenue Forecast to 2035
- 11.2.2 Volume Forecast to 2035
- 11.2.3 CAGR and Year-on-Year Growth
- 11.2.4 Incremental Revenue Opportunity
- 11.3 Forecast Assumptions and Scenario Analysis
- 11.3.1 Base-Case Forecast
- 11.3.2 Optimistic and Conservative Scenarios
- 11.3.3 Technology, Pricing and Policy Sensitivities
- 11.4 Market Attractiveness and Growth Outlook
Chapter 12 India Third-Party Logistics (3PL) Market Segmentation and Outlook
- 12.1 Segmentation Summary and Market Shares, 2025
- 12.2 Largest and Fastest-Growing Segments
- 12.3 By Service Type - Market Size and Forecast, 2025-2035
- 12.3.1 Segment Definition and Scope
- 12.3.2 Historical Market Size, 2018-2025
- 12.3.3 Revenue Forecast, 2025-2035
- 12.3.4 Volume Forecast, 2025-2035
- 12.3.5 Base-Year Market Share, 2025
- 12.3.6 Segment CAGR and Growth Drivers
- 12.3.7 Subsegment Market Size and Forecast
- 12.3.7.1 Transportation Management
- 12.3.7.2 Warehousing & Fulfillment
- 12.3.7.3 Value-Added Logistics
- 12.3.7.4 Freight Forwarding & Customs
- 12.3.8 Subsegment Pricing and Adoption Trends
- 12.3.9 Leading Suppliers and Competition
- 12.3.10 Regional Demand and Opportunities
- 12.4 By Mode of Transport - Market Size and Forecast, 2025-2035
- 12.4.1 Segment Definition and Scope
- 12.4.2 Historical Market Size, 2018-2025
- 12.4.3 Revenue Forecast, 2025-2035
- 12.4.4 Volume Forecast, 2025-2035
- 12.4.5 Base-Year Market Share, 2025
- 12.4.6 Segment CAGR and Growth Drivers
- 12.4.7 Subsegment Market Size and Forecast
- 12.4.7.1 Road
- 12.4.7.2 Rail
- 12.4.7.3 Air
- 12.4.7.4 Ocean & Coastal
- 12.4.7.5 Multimodal
- 12.4.8 Subsegment Pricing and Adoption Trends
- 12.4.9 Leading Suppliers and Competition
- 12.4.10 Regional Demand and Opportunities
- 12.5 By Customer Type - Market Size and Forecast, 2025-2035
- 12.5.1 Segment Definition and Scope
- 12.5.2 Historical Market Size, 2018-2025
- 12.5.3 Revenue Forecast, 2025-2035
- 12.5.4 Volume Forecast, 2025-2035
- 12.5.5 Base-Year Market Share, 2025
- 12.5.6 Segment CAGR and Growth Drivers
- 12.5.7 Subsegment Market Size and Forecast
- 12.5.7.1 Contracted Enterprise Accounts
- 12.5.7.2 Mid-Market Shippers
- 12.5.7.3 MSME & D2C Shippers
- 12.5.7.4 Institutional & Public-Sector Buyers
- 12.5.8 Subsegment Pricing and Adoption Trends
- 12.5.9 Leading Suppliers and Competition
- 12.5.10 Regional Demand and Opportunities
- 12.6 By End-Use Industry - Market Size and Forecast, 2025-2035
- 12.6.1 Segment Definition and Scope
- 12.6.2 Historical Market Size, 2018-2025
- 12.6.3 Revenue Forecast, 2025-2035
- 12.6.4 Volume Forecast, 2025-2035
- 12.6.5 Base-Year Market Share, 2025
- 12.6.6 Segment CAGR and Growth Drivers
- 12.6.7 Subsegment Market Size and Forecast
- 12.6.7.1 Automotive & Industrial Manufacturing
- 12.6.7.2 Retail & E-Commerce
- 12.6.7.3 FMCG & Consumer Goods
- 12.6.7.4 Pharmaceuticals & Healthcare
- 12.6.7.5 Electronics & High-Tech
- 12.6.8 Subsegment Pricing and Adoption Trends
- 12.6.9 Leading Suppliers and Competition
- 12.6.10 Regional Demand and Opportunities
- 12.7 Segment Growth Comparison
- 12.8 Segment Attractiveness and Priority Matrix
Chapter 13 India Third-Party Logistics (3PL) End-Use and Application Market Outlook
- 13.1 End-Use Industry and Customer Demand Structure
- 13.2 Leading Applications and Customer Groups
- 13.3 End-Use Market Size, Share and Forecast
- 13.4 Major End-Use Industry Deep Dives
- 13.4.1 Customer Requirements and Use Cases
- 13.4.2 Demand and Replacement Cycles
- 13.4.3 Technical and Regulatory Considerations
- 13.4.4 Purchasing and Procurement Models
- 13.4.5 Leading Vendors and Distribution Channels
- 13.4.6 Forecast and Commercial Opportunities
- 13.5 Emerging Applications and Cross-Segment Demand
- 13.6 End-Use Industry Investment Priorities
Chapter 14 India Third-Party Logistics (3PL) Geographic Market Outlook, 2025-2035
- 14.1 Domestic Market Distribution and Demand Clusters
- 14.2 State- or Province-Wise Market Size and Forecast, 2025-2035
- 14.3 City and Metropolitan Market Outlook
- 14.4 Industrial, Manufacturing and Commercial Clusters
- 14.5 Geographic Concentration of Key End Users
- 14.6 Local Pricing and Purchasing Differences
- 14.7 Domestic Production Facilities and Capacity Map
- 14.8 Local Infrastructure and Project Pipeline
- 14.9 State-Level Policy and Incentive Differences
- 14.10 Subnational Investment Hotspots and Opportunities
- 14.11 Distribution and Logistics Networks
- 14.12 Domestic Competitive Footprint
Chapter 15 India Third-Party Logistics (3PL) Technology, Innovation and Sustainability Outlook
- 15.1 Technology Landscape and Maturity
- 15.2 Product, Process and Service Innovation
- 15.3 AI, Automation and Digital Tools in the Industry
- 15.4 Technology Adoption and Performance Benchmarking
- 15.5 Innovation Pipeline and R&D Investment
- 15.6 Patent and Intellectual Property Trends
- 15.7 Energy Efficiency and Resource Management
- 15.8 Sustainability, Recycling and Circularity
- 15.9 Technology Roadmap, 2025-2035
- 15.10 Risks of Obsolescence and Technology Substitution
Chapter 16 India Third-Party Logistics (3PL) Market Key Strategic Imperatives
- 16.1 Growth and Market Entry Priorities
- 16.2 High-Return Products and Segments
- 16.3 Pricing, Profitability and Cost Optimization
- 16.4 Technology Investment and Product Differentiation
- 16.5 Supply Chain Localization and Resilience
- 16.6 Distribution and Customer Acquisition
- 16.7 Partnership, Acquisition and Capacity Strategy
- 16.8 Regional Expansion Priorities
- 16.9 Short-, Medium- and Long-Term Actions
Chapter 17 Competition Outlook
- 17.1 Industry Competition Characteristics
- 17.2 Market Structure and Concentration
- 17.3 Market Share and Competitive Positioning, 2025
- 17.4 Company-Wise Revenue and Product Benchmarking
- 17.5 Production and Service Capacity Benchmarking
- 17.6 Technology, Pricing and Differentiation
- 17.7 Regional Footprint and Distribution Strength
- 17.8 Mergers, Acquisitions and Strategic Alliances
- 17.9 New Entrants and Competitive Threats
- 17.10 Porter's Five Forces and Industry Attractiveness
- 17.11 Competitive Outlook, 2025-2035
Chapter 18 Company Profiles
- 18.1 Company Coverage and Selection Criteria
- 18.2 Delhivery Limited
- 18.2.1 Business Description
- 18.2.2 Company Ownership and Geographic Presence
- 18.2.3 Product and Service Portfolio
- 18.2.4 Manufacturing and Operating Footprint
- 18.2.5 Production Capacity and Expansion Plans
- 18.2.6 Financial Performance and Investment
- 18.2.7 Market Share and Competitive Position
- 18.2.8 Technology and Innovation Capabilities
- 18.2.9 Strategic Alliances or Partnerships
- 18.2.10 Recent Developments
- 18.2.11 Growth Strategy and Outlook
- 18.3 Mahindra Logistics Limited
- 18.4 Transport Corporation of India Limited
- 18.5 Allcargo Gati Limited
- 18.6 DHL Supply Chain India
- 18.7 Safexpress Private Limited
- 18.8 Kuehne+Nagel India
- 18.9 CEVA Logistics India
- 18.10 DSV India
- 18.11 Nippon Express India
- 18.12 Other Relevant Market Participants
Note: Every listed company is profiled on the structure shown under the first company. The company list is preliminary and may change based on research findings, market developments, data availability and client requirements.
Chapter 19 Disclaimer
- 19.1 Research and Forecast Disclaimer
- 19.2 Data Source and Estimation Limitations
Note: The depth of individual sections depends on data availability for this market. Volume, capacity, trade and other unit-based metrics are included where applicable.

