
Mobile shoppers and new hubs lift Egyptian parcel volumes
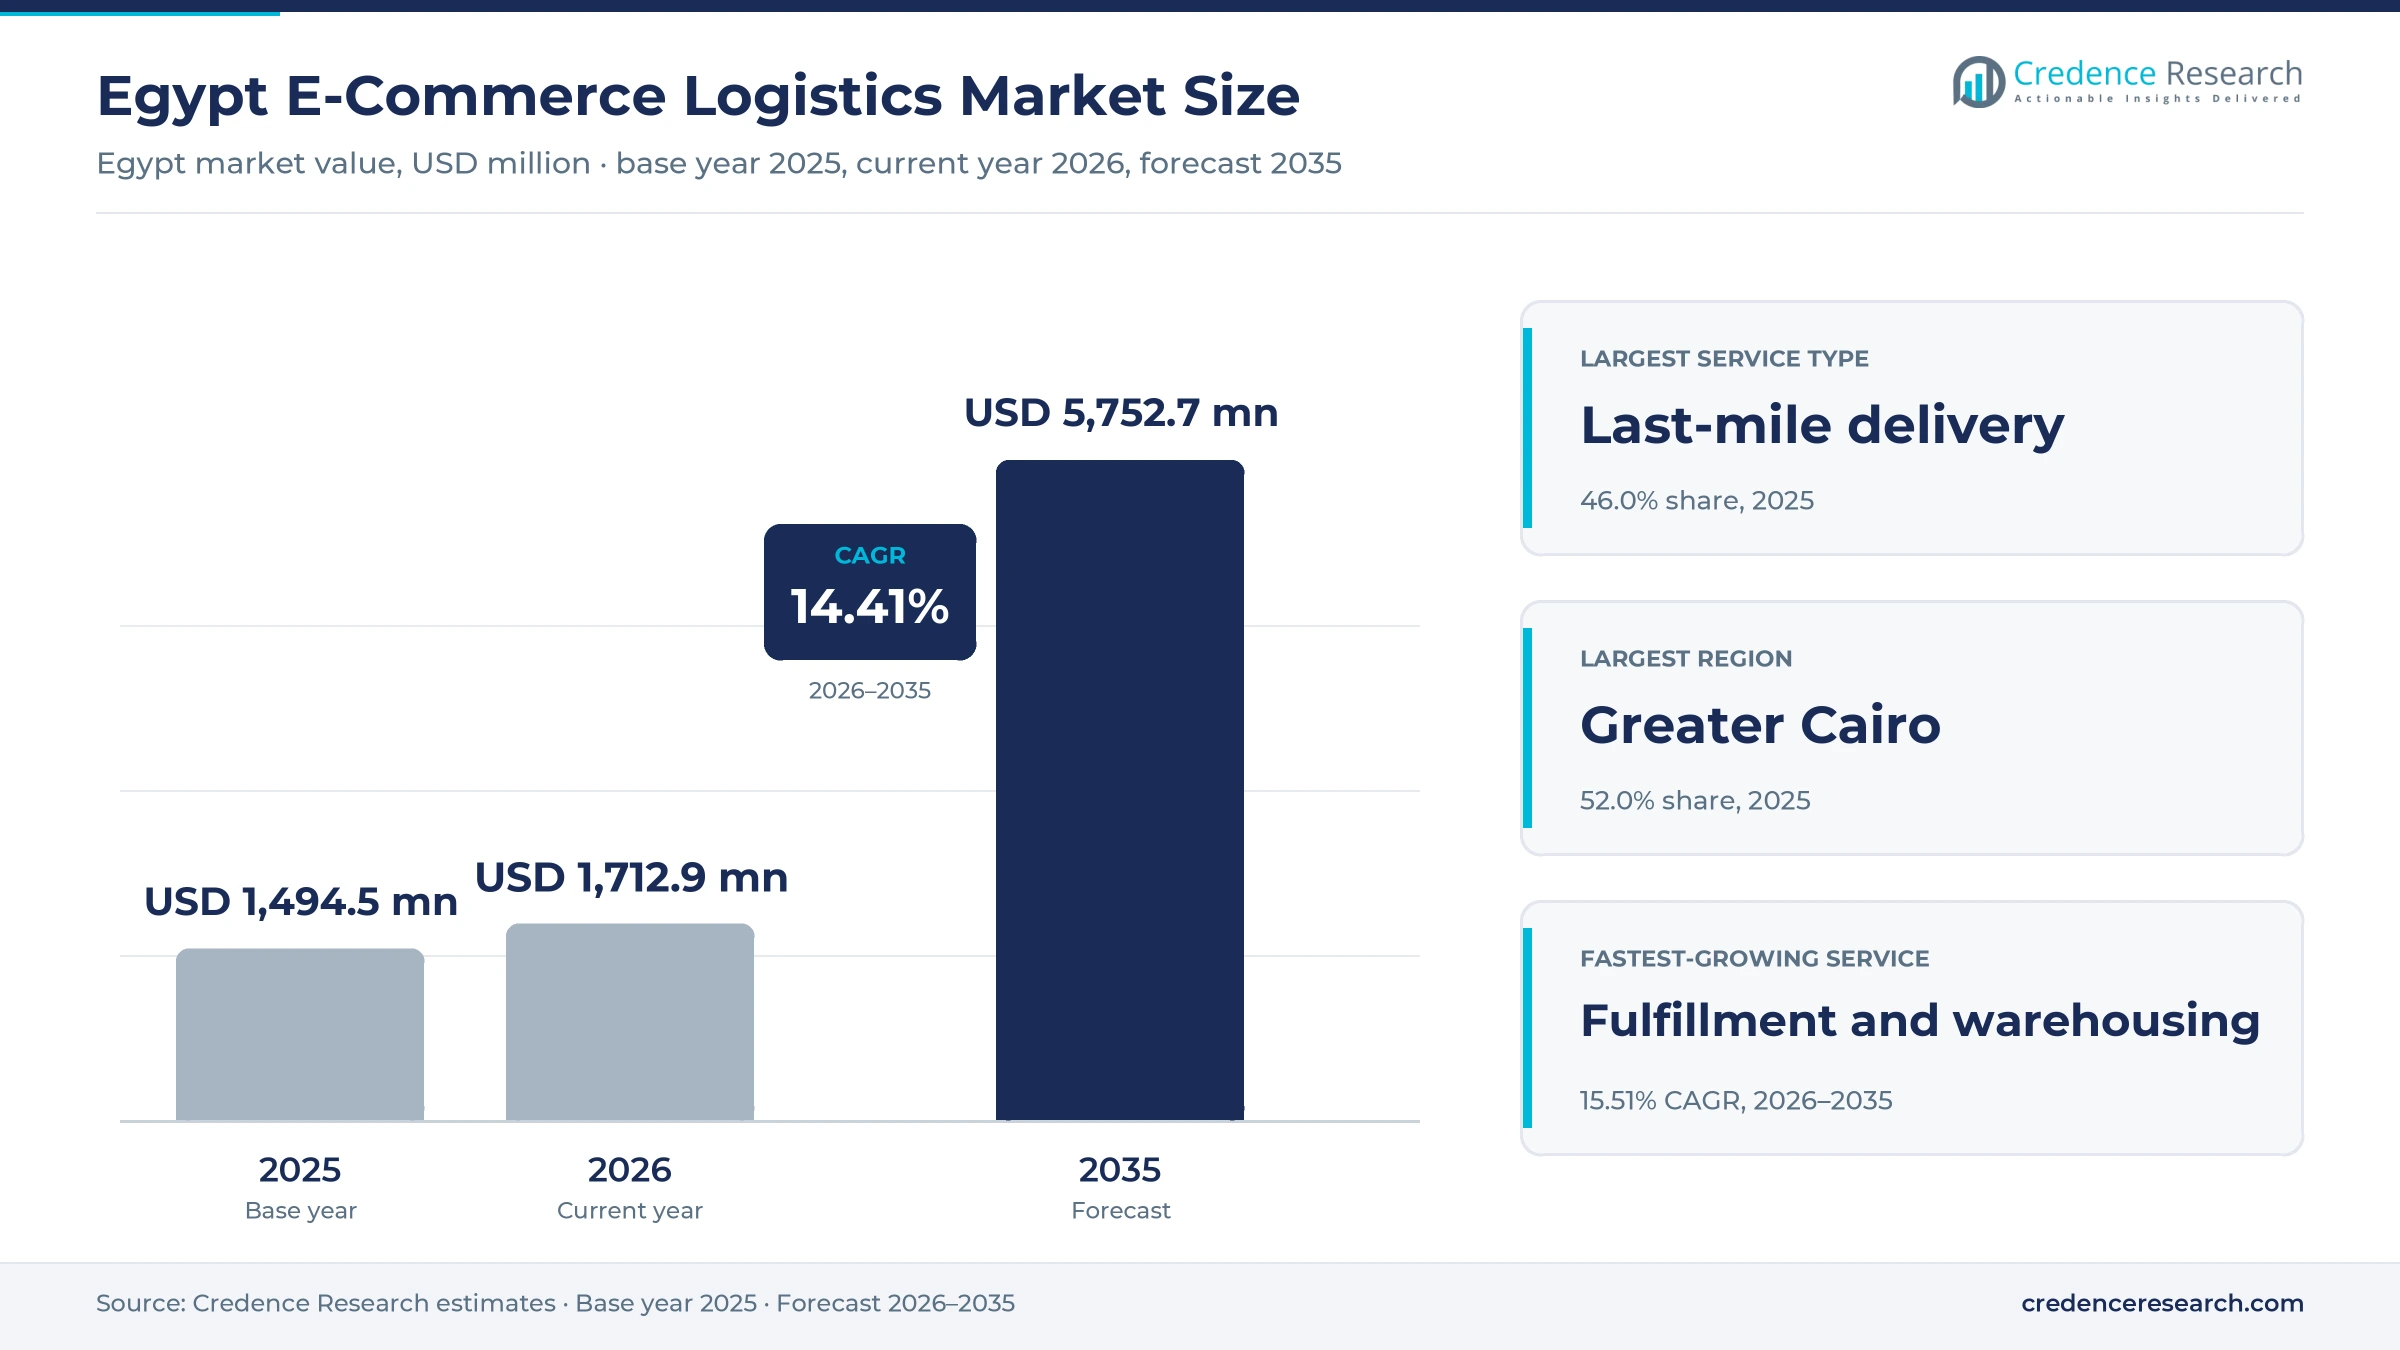
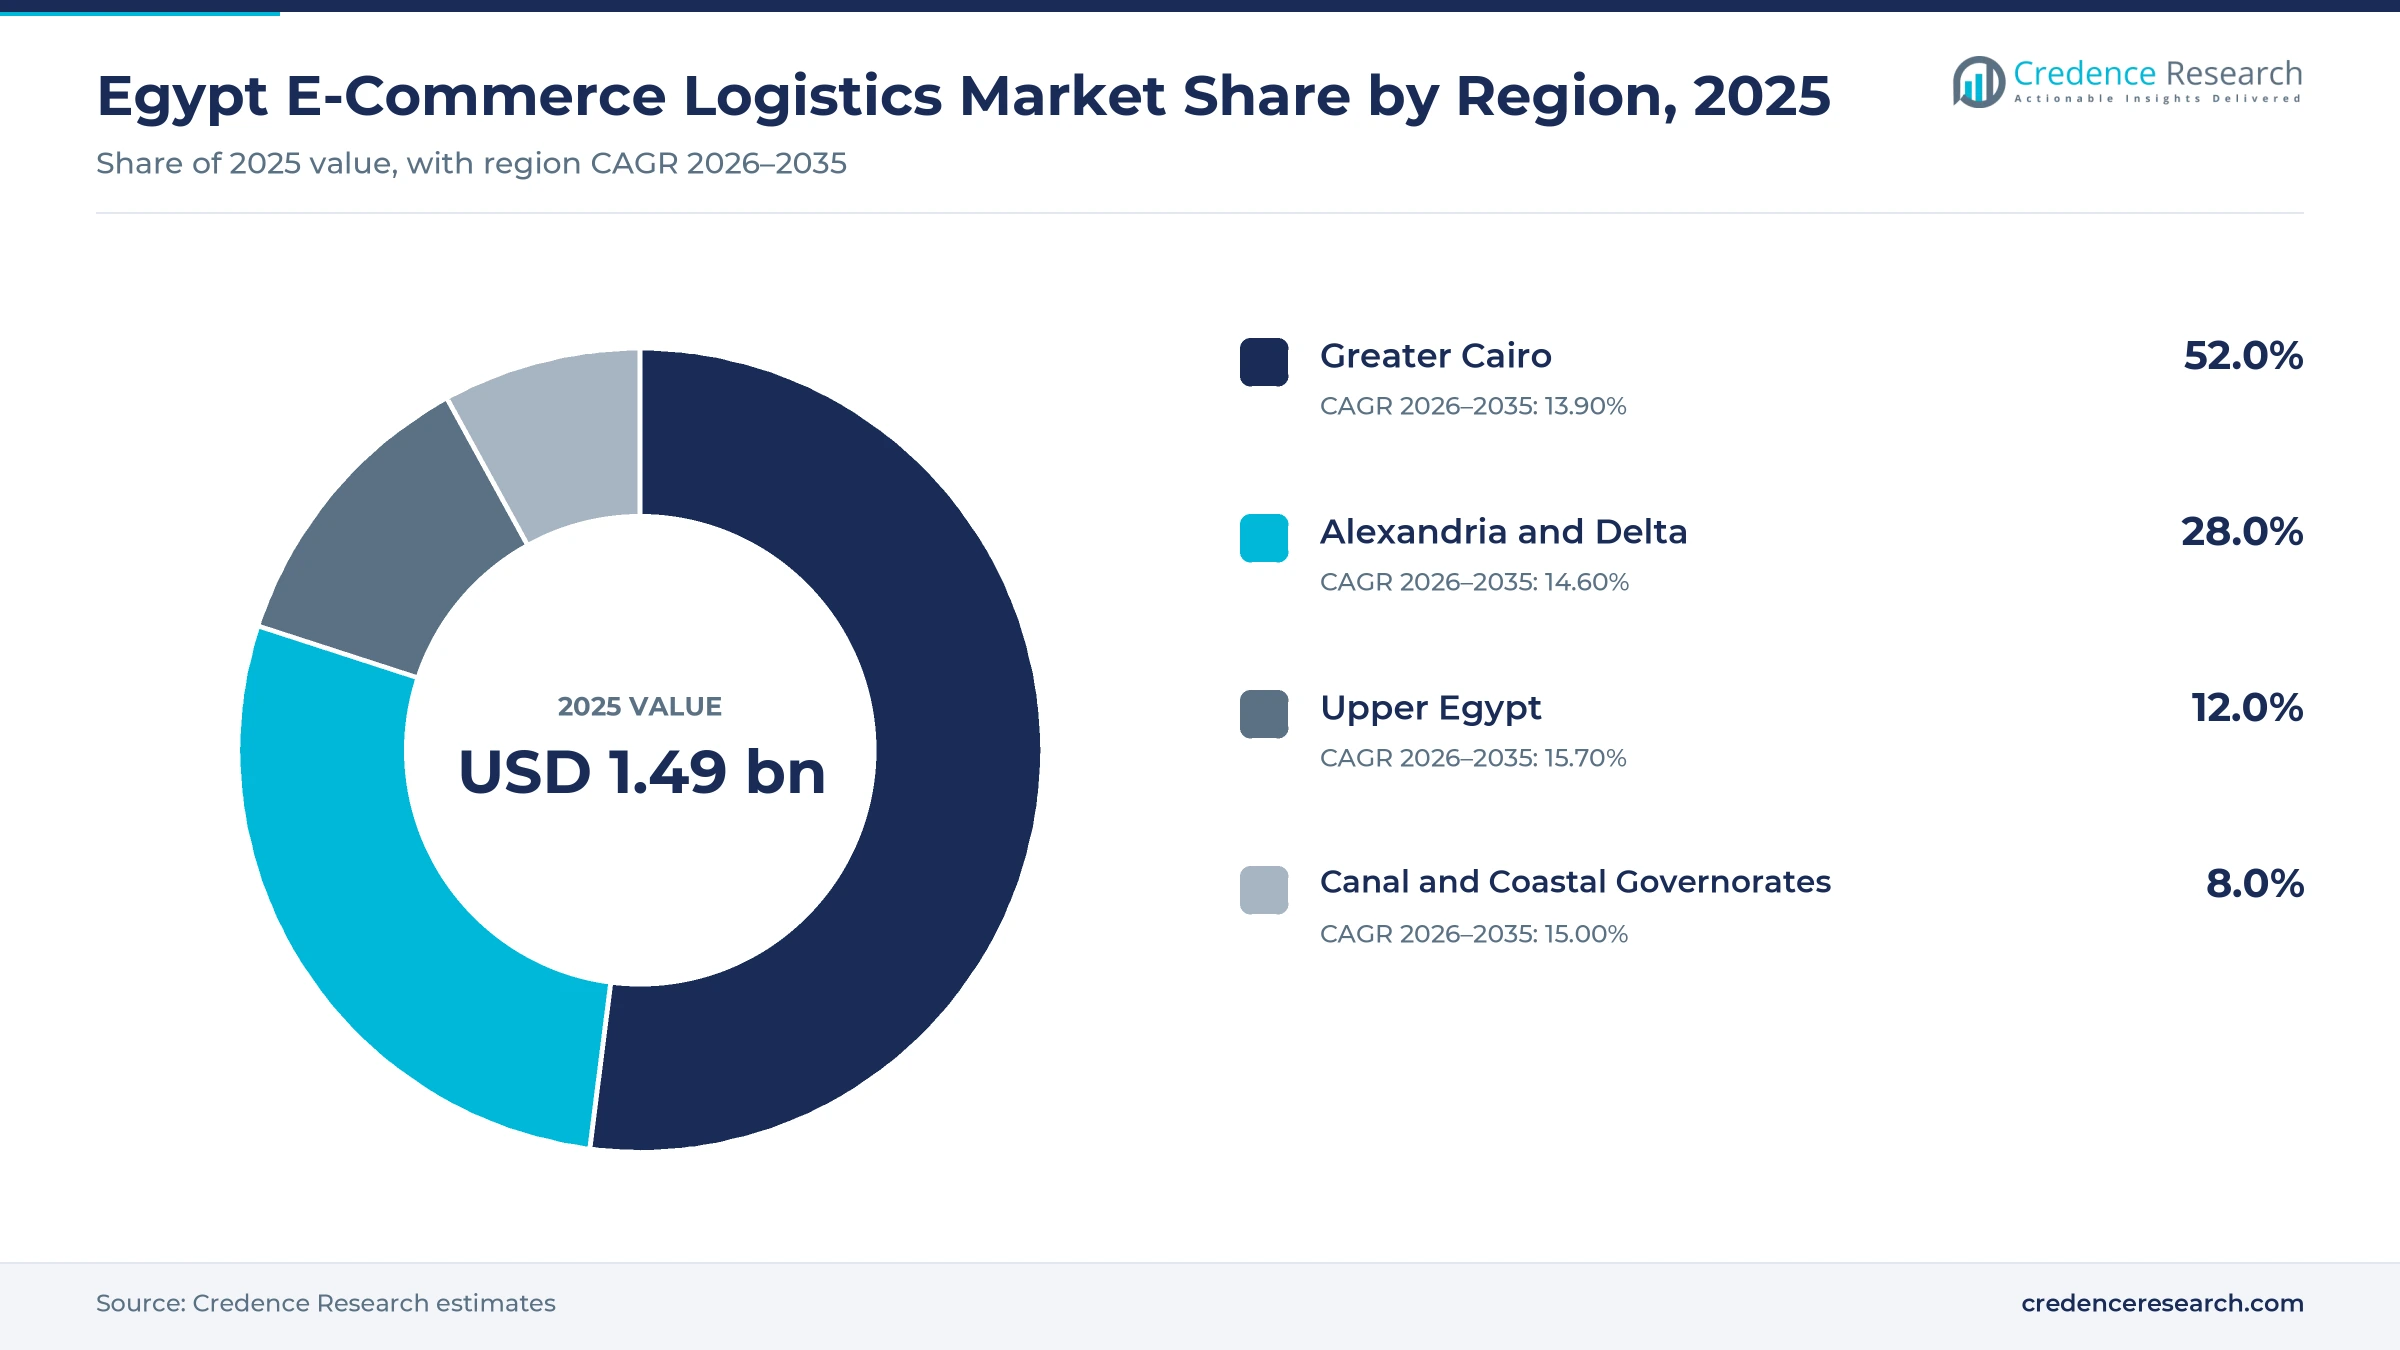
The Egypt e-commerce logistics market was valued at USD 1.49 billion in 2025 and is projected to increase from USD 1.71 billion in 2026 to USD 5.75 billion by 2035, registering a CAGR of 14.41% during 2026–2035. Demand comes from online marketplaces, social sellers and brands that need parcels picked, packed, delivered and returned across a young, phone-first population of about 119 million people. Greater Cairo held the largest regional share, 52.0% in 2025, because most warehouses, sorting hubs and online buyers sit in the capital region. Upper Egypt is the fastest-growing region at 15.70% a year, as carriers extend hubs and delivery routes into southern governorates. In turn, carriers are investing in automation, and one Cairo delivery company opened a sorting machine able to handle 11,000 parcels an hour in January 2026.
Which parcel, warehouse and returns services does the estimate cover?
The estimate measures revenue earned by carriers, couriers, postal operators and third-party providers for moving and storing goods sold online to buyers in Egypt. It covers last-mile delivery, fulfillment and warehousing, cross-border shipping and returns handling for marketplaces, brands, social sellers and large retailers.
The estimate excludes freight that is not tied to online orders, food delivery from restaurants and the value of the goods themselves. The value chain runs from sellers and marketplaces through warehouses, sorting hubs and courier fleets to the households and businesses that receive each parcel.
Egypt E-Commerce Logistics Market Insights
- The Egypt e-commerce logistics market was valued at USD 1.49 billion in 2025 and is projected to reach USD 5.75 billion by 2035, registering a CAGR of 14.41% during 2026–2035.
- Greater Cairo held a 52.0% share of 2025 value, because most warehouses, sorting hubs and online buyers are located in the capital region.
- Last-mile delivery led with a 46.0% share of 2025 value, because almost every online order in Egypt ends with a courier visit to the buyer.
- Bosta handled 37 million parcels in 2025 and opened an automated sorting machine in Cairo in January 2026, with a target above 80 million parcels in 2026.
- Fulfillment and warehousing grows fastest at 15.51% a year during 2026–2035, as sellers hand storage, packing and stock control to outside providers.
Courier visits dominate as sellers outsource packing
Why does last-mile delivery take the largest share?
Based on service type, the market is categorized into last-mile delivery, fulfillment and warehousing, cross-border logistics and reverse logistics. Last-Mile Delivery led with a 46.0% share of 2025 value, because every online order ends with a courier visit and often a cash collection. Fulfillment and Warehousing grows fastest at 15.51% a year, as sellers outsource storage and packing to larger warehouses.
How do domestic and cross-border flows compare?
Based on shipment flow, the market is categorized into domestic B2C, domestic B2B, cross-border inbound and cross-border outbound shipments. Domestic B2C led with a 58.0% share of 2025 value, because most orders move from local sellers to households. Cross-Border Outbound grows fastest at 16.02% a year, as Egyptian brands start selling to buyers in the Gulf and Africa.
Which sellers buy the most delivery services?
Based on customer type, the market is categorized into e-commerce marketplaces, direct-to-consumer brands, social-commerce sellers and enterprise retailers. E-Commerce Marketplaces led with a 42.0% share of 2025 value, because large platforms ship the highest parcel volumes. Social-Commerce Sellers grow fastest at 15.41% a year, as small sellers on social apps hand delivery and cash collection to couriers.
Which product categories generate the most parcels?
Based on end-use industry, the market is categorized into fashion and apparel, consumer electronics, food and grocery, and beauty, health and home goods. Fashion and Apparel led with a 30.0% share of 2025 value, because clothing orders are frequent and often returned. Food and Grocery grows fastest at 15.56% a year, as shoppers buy household essentials online more often.
| Segment Group | Leading Sub-segment | Share, 2025 | Fastest-growing Sub-segment | CAGR, 2026–2035 |
|---|---|---|---|---|
| By Service Type | Last-Mile Delivery | 46.0% | Fulfillment and Warehousing | 15.51% |
| By Shipment Flow | Domestic B2C | 58.0% | Cross-Border Outbound | 16.02% |
| By Customer Type | E-Commerce Marketplaces | 42.0% | Social-Commerce Sellers | 15.41% |
| By End-Use Industry | Fashion and Apparel | 30.0% | Food and Grocery | 15.56% |
Request a Free Sample
Fill in your details and we'll send you a free sample report.
- Sample data tables & charts
- Research methodology
Phones, instant payments and outsourcing drive parcels
How does mobile-first commerce expand the parcel base?
Mobile-first commerce expands the parcel base, because most Egyptians now browse and buy on phones rather than computers. Egypt had 98.2 million internet users in October 2025, or 82.7% of the population, according to DataReportal. The same source counts 121 million cellular connections at the end of 2025, equal to 102% of the population, and a median age of 24.5 years. This young, connected base buys clothing, phones and household goods through apps and social pages that rely on couriers for every order. As a result, domestic B2C shipments hold 58.0% of 2025 value, because most online purchases move from local sellers straight to households.
Why do digital payments improve delivery economics?
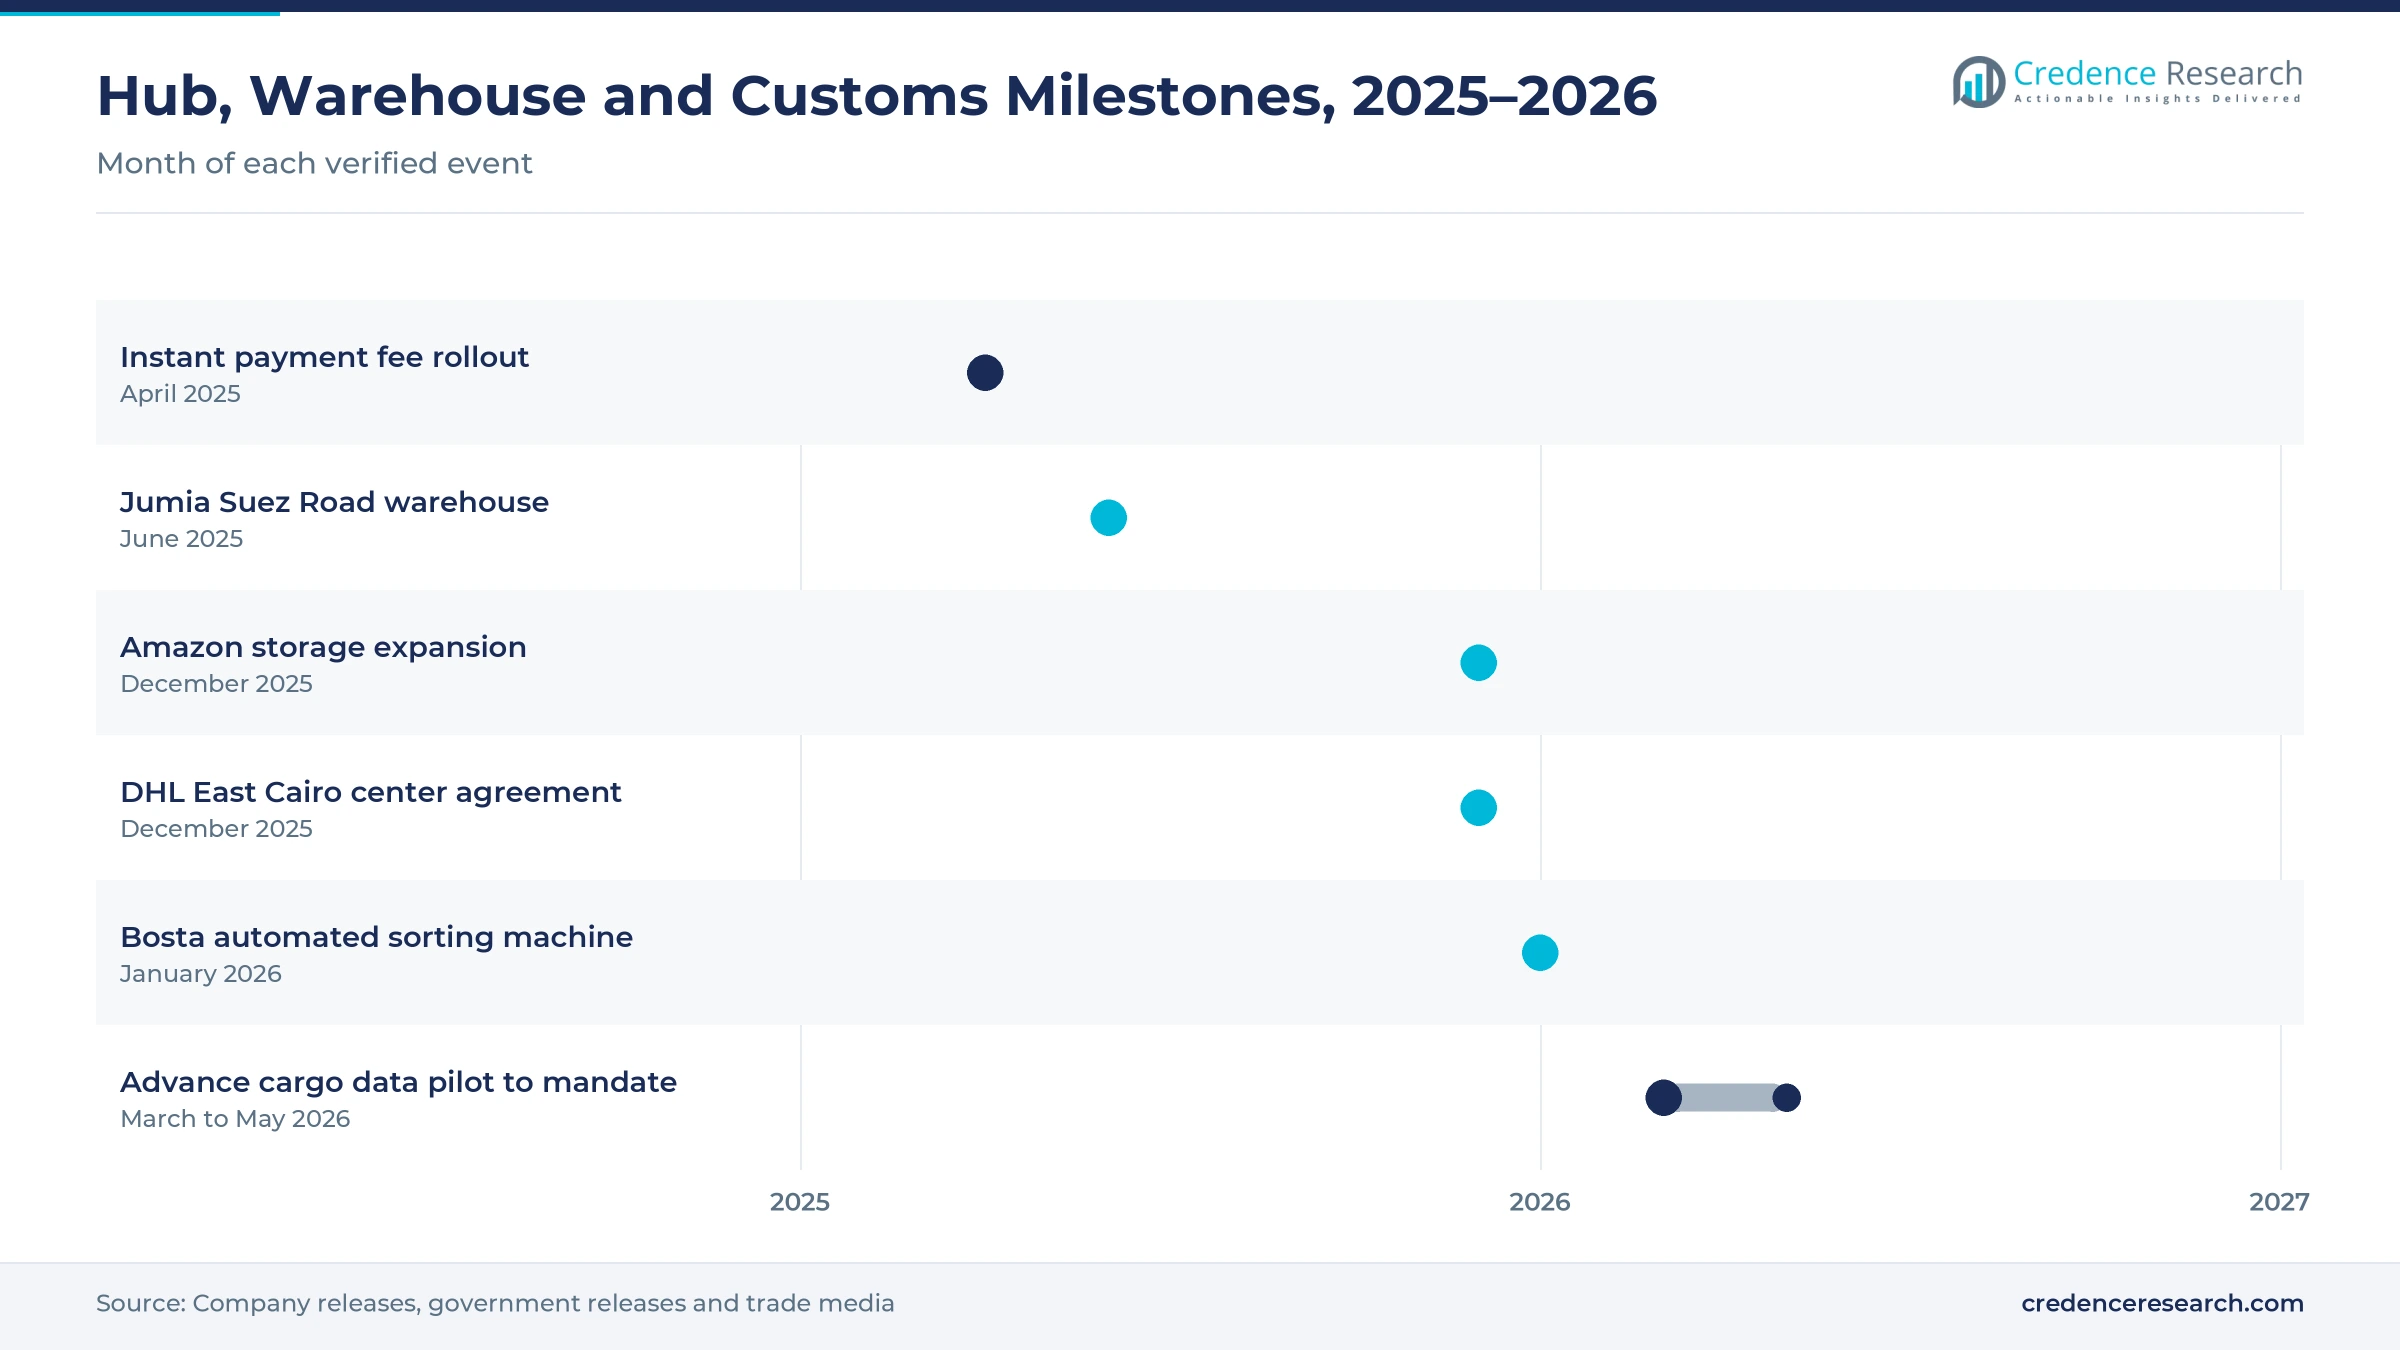
Digital payments improve delivery economics, because prepaid orders cut the cash handling, failed deliveries and reconciliation that raise courier costs. The national instant payment network handled 263 million transactions worth more than EGP 1.2 trillion in the first quarter of 2025, according to Zawya. About 65% of incoming transfers went to mobile wallets, which shows how quickly phone payments are spreading. The InstaPay app behind the network launched only in April 2022, yet it now carries daily payments for many online shoppers. In turn, couriers can shorten cash remittance cycles to sellers, which helps social-commerce sellers grow at 15.41% a year.
How does fulfillment outsourcing raise revenue per merchant?
Fulfillment outsourcing raises revenue per merchant, because sellers that hand over storage, packing and stock control pay for several services instead of delivery alone. Jumia opened a warehouse of more than 27,000 square meters on the Suez Road in Cairo in June 2025, its largest integrated warehouse in Egypt. Amazon expanded its Egyptian storage capacity to more than 100,000 cubic meters in December 2025, with main centers in 10th of Ramadan City and on the Suez Road. Bosta also offers warehousing, fulfillment and order management to small merchants. As a result, fulfillment and warehousing grows at 15.51% a year during 2026–2035.
Why are express carriers investing in bigger hubs?
Express carriers are investing in bigger hubs, because rising parcel volumes have outgrown older depots in Greater Cairo. DHL Express and Yanmu agreed in December 2025 to build a EUR 24 million center of 13,000 square meters in the East Cairo Logistics Park, according to EnterpriseAM. The facility is expected to double DHL's operating capacity in Egypt once it is completed. Bosta reported total investment of $27 million and more than 50 hubs nationwide in January 2026. In turn, carriers with larger hubs can accept more same-day and next-day orders from marketplaces, because new hubs cluster around the capital's ring roads and industrial zones.
Automated sorting, customs data and mega-warehouses
How is the rise of automated sorting changing hubs?
The rise of automated sorting is changing hubs, because machines can handle peak volumes that manual teams cannot sort in time. Bosta launched a sorting machine able to process 11,000 parcels an hour in Cairo in January 2026, at a cost of more than $5 million, according to STAT Times. The company said daily capacity would rise from 100,000 parcels to more than 250,000, or over 6 million a month. Bosta handled 37 million parcels in 2025 and aims to exceed 80 million in 2026. As a result, carriers that use automated sortation can promise faster next-day delivery across Greater Cairo.
Why is the shift to advance customs data significant?
The shift to advance customs data is significant, because cross-border parcels now need shipment details before they land in Egypt. The finance ministry began a pilot of the Advanced Cargo Information system for express couriers on March 31, 2026. The requirement became mandatory for all airport-based courier firms from May 1, 2026, and parcels over 50 kilograms need a unique ACID number. The Nafeza platform is also evolving into a single trade hub for all Egyptian ports. In turn, cross-border inbound shipments face more paperwork, while carriers with strong data systems clear parcels faster and win more marketplace contracts from foreign sellers.
Can wider rural coverage open new delivery routes?
Wider rural coverage can open new delivery routes, because most Egyptians still live outside large cities and many rural buyers remain underserved. About 56.5% of the population lived in rural areas in late 2025, while only 43.5% lived in urban centers. Egypt Post signed a protocol with Jumia in December 2020 that gave the platform access to nationwide post offices for payment and delivery. Bosta also reports more than 50 hubs across the country, which shortens trips to smaller towns. As a result, carriers in southern governorates now reach more villages at lower cost, because they combine last-mile delivery fleets with post office pickup points and local agents.
Is returns handling an opening for third-party providers?
Returns handling offers an opening for third-party providers, because fashion buyers often refuse or send back parcels after trying them on at the door. Fashion and apparel holds 30.0% of 2025 value, which makes it the largest source of returned parcels in Egypt. Reverse logistics grows at a faster pace than the market as sellers look for faster refunds and restocking. Large warehouses opened by Jumia and Amazon in 2025 also give sellers space to inspect and resell returned goods quickly. In turn, providers that offer returns management and quick restocking can charge higher fees per order and keep sellers on longer contracts.
Cash handling, inflation and rural reach strain carriers
How does cash on delivery raise courier costs?
Cash on delivery raises courier costs, because drivers must collect, count, store and remit cash for many orders every day. As a result, failed deliveries and refused parcels add extra trips and slow payments to sellers. Carriers respond with prepaid discounts, wallet payments at the door and faster remittance tools. In turn, sellers that switch buyers to prepaid orders lower their delivery costs and return rates. This shift also helps couriers pay sellers faster, which builds trust in online channels.
Why does high inflation squeeze delivery margins?
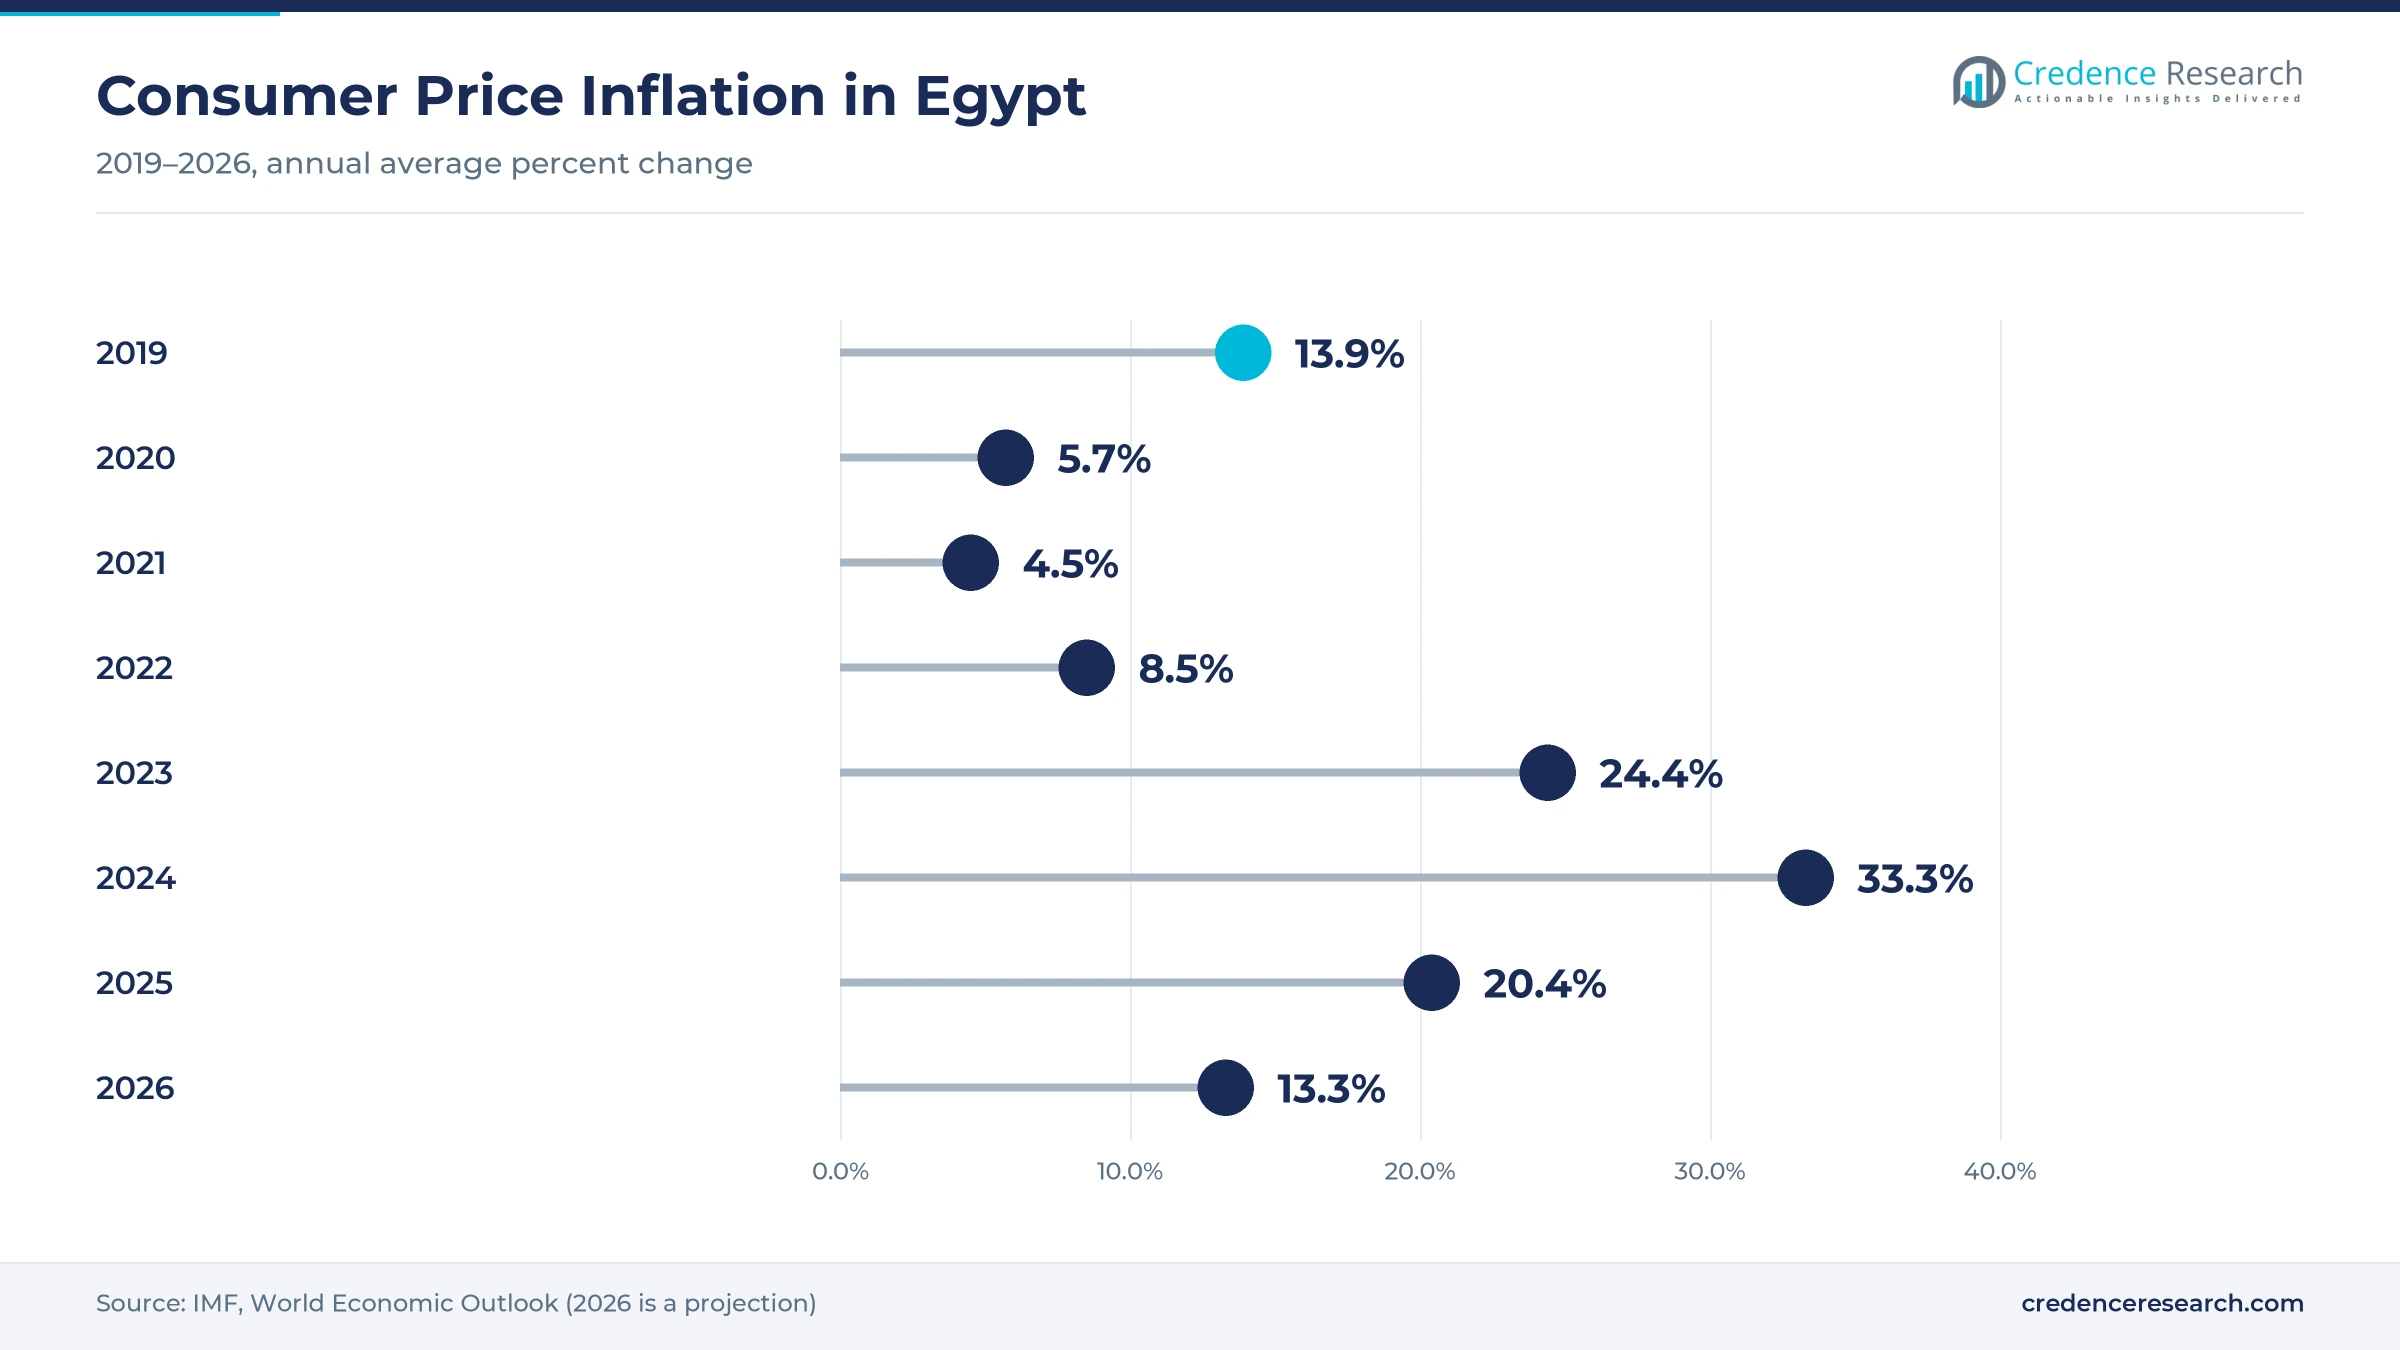
High inflation squeezes delivery margins, because fuel, vehicle parts and wages rise faster than carriers can lift prices. Consumer prices in Egypt rose 33.3% in 2024 and 20.4% in 2025, according to the IMF. As a result, couriers face pressure from sellers that resist higher rates. Carriers respond with route planning, denser hubs and fee updates tied to fuel costs. In turn, larger carriers with automated hubs absorb cost increases better than small couriers.
How do long rural routes limit service levels?
Long rural routes limit service levels, because villages in Upper Egypt and the Delta are spread out and roads can be slow. In turn, delivery times stretch to several days and each parcel costs more to deliver. Carriers respond with regional hubs, partner agents and post office pickup points. As a result, coverage improves, but margins in remote areas stay lower than in Greater Cairo. This gap pushes carriers to group rural orders into fewer, fuller delivery runs each week.
Why do customs checks slow cross-border parcels?
Customs checks slow cross-border parcels, because new data rules require detailed shipment information before goods arrive. As a result, small sellers and buyers who import goods face delays when paperwork is incomplete. Express carriers respond by linking their systems to the customs platform and checking data before flights depart. In turn, firms with strong data tools clear parcels faster than rivals. This advantage matters most for marketplaces that import electronics and fashion from Asia.
Cairo hubs dominate as southern parcel routes expand
| Region | Value, 2025 (USD billion) | Share, 2025 | CAGR, 2026–2035 |
|---|---|---|---|
| Greater Cairo | 0.78 | 52.0% | 13.90% |
| Alexandria and Delta | 0.42 | 28.0% | 14.60% |
| Upper Egypt | 0.18 | 12.0% | 15.70% |
| Canal and Coastal Governorates | 0.12 | 8.0% | 15.00% |
Why do Cairo warehouses anchor national parcel flows?
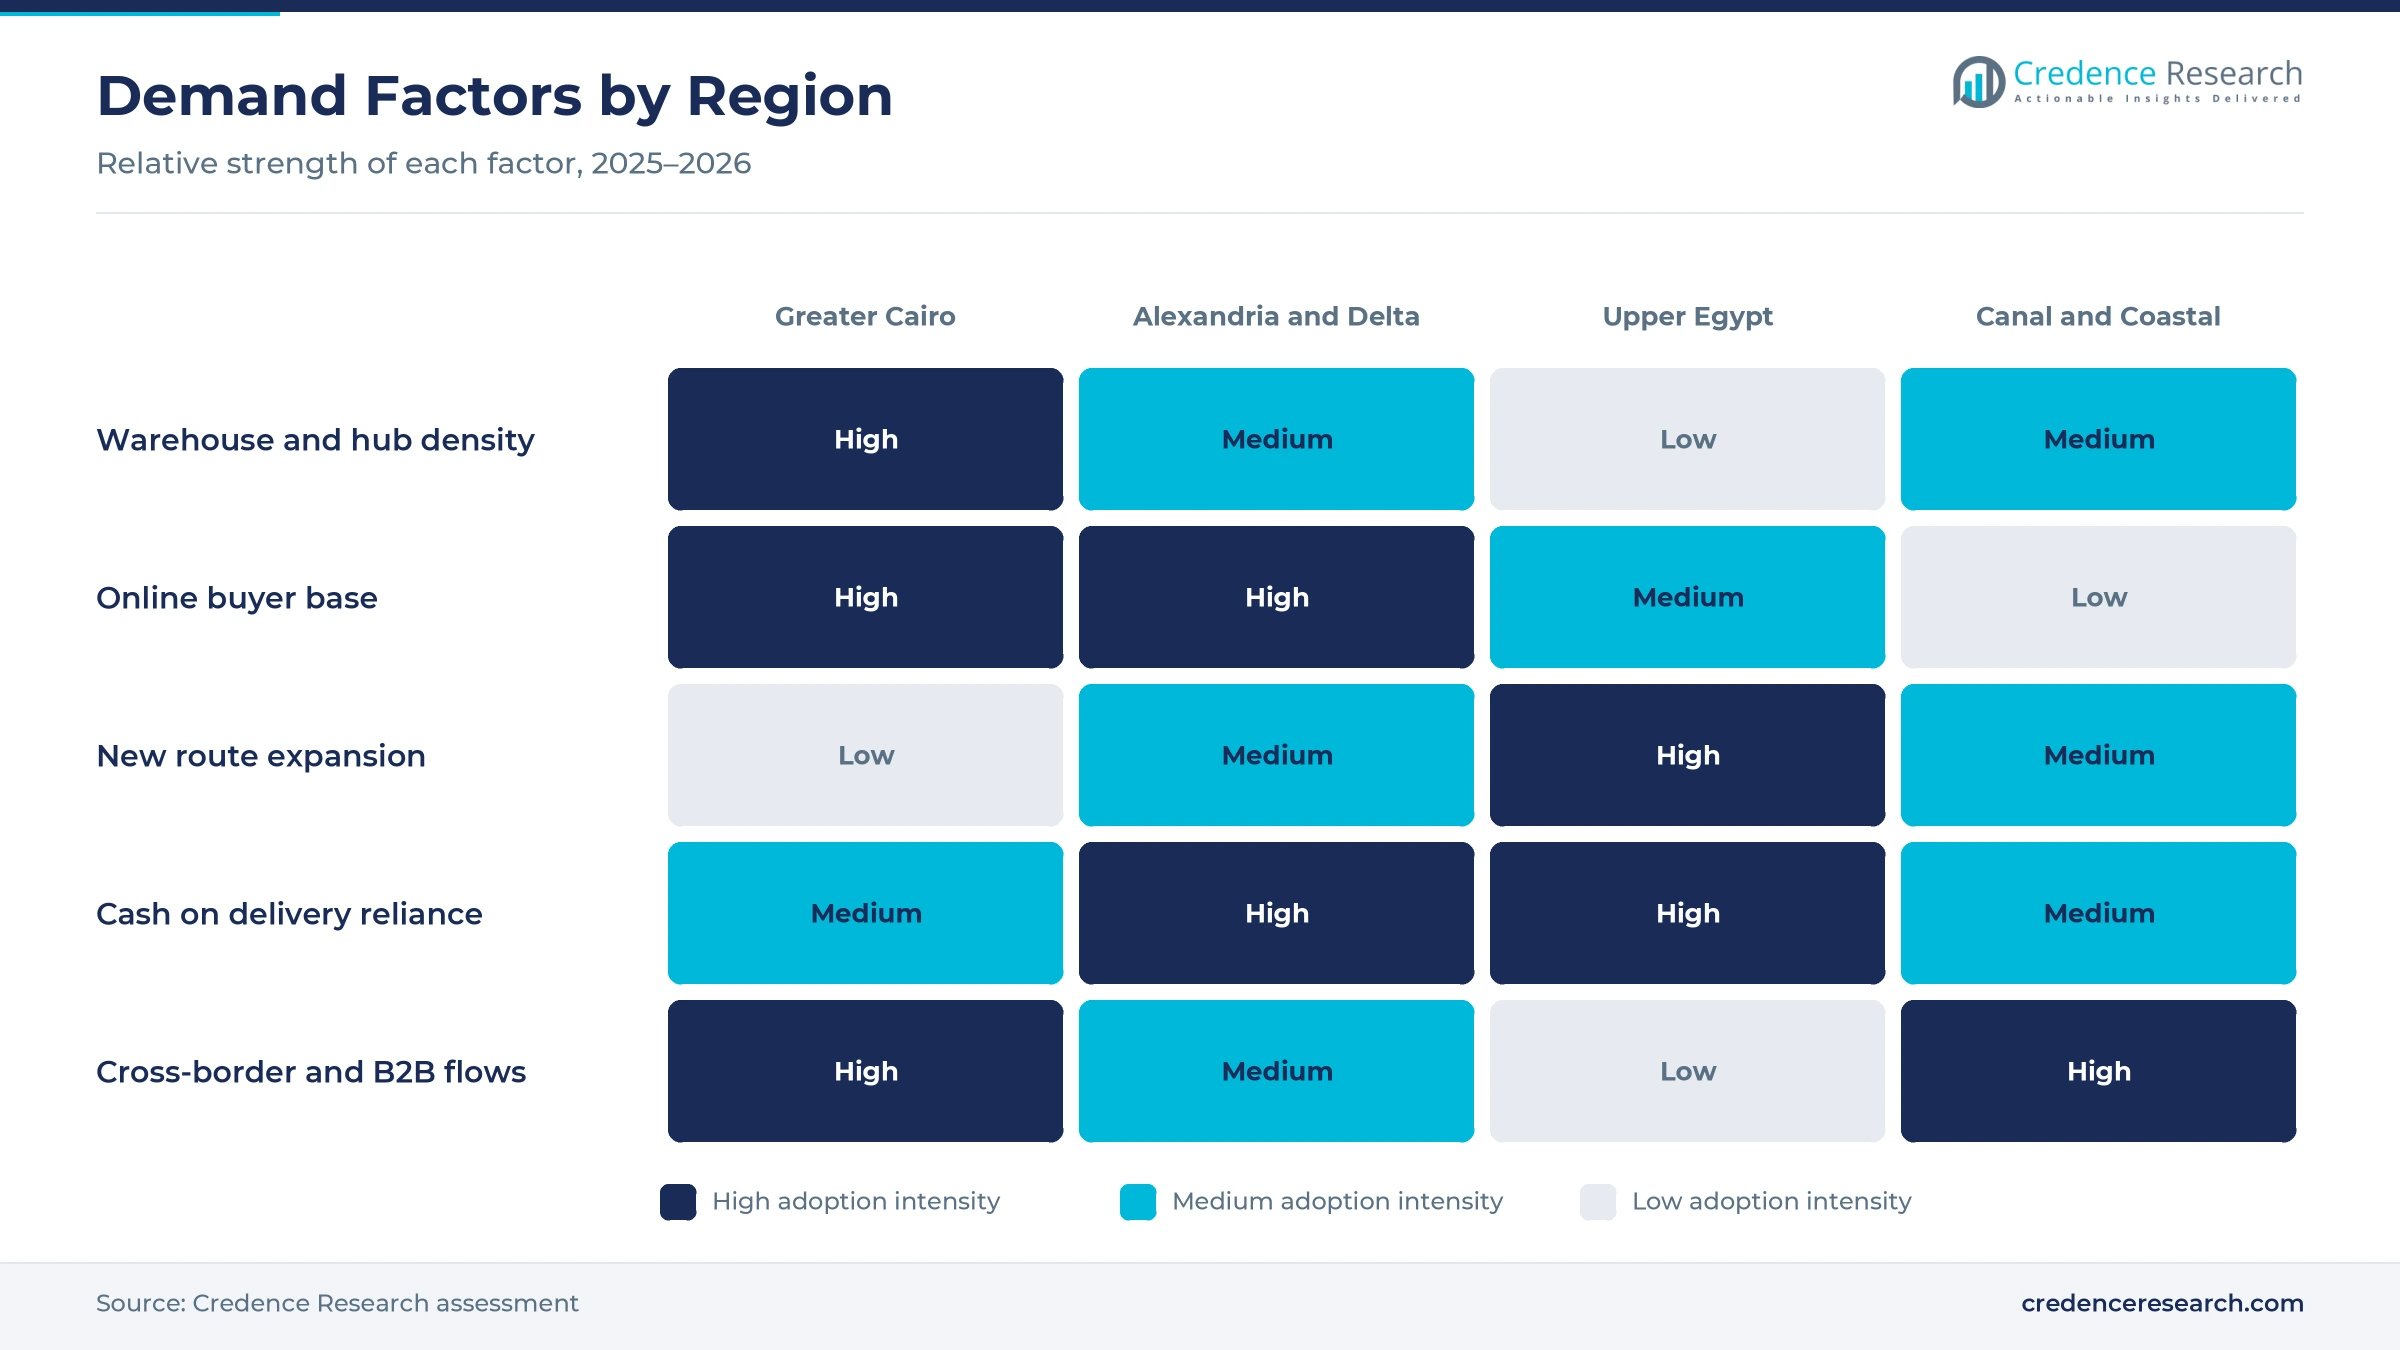
Greater Cairo held a 52.0% share of 2025 value and grows at 13.90% a year, because most online buyers, warehouses and sorting hubs are located in the capital region. Jumia and Amazon run their largest warehouses on the Suez Road and in 10th of Ramadan City, while Bosta sorts parcels in Cairo. DHL Express is also building its largest center in East Cairo. As a result, Greater Cairo remains the main hub for parcel flows across the country.
How do Alexandria and the Delta add parcel volume?
Alexandria and Delta held a 28.0% share of 2025 value and grows at 14.60% a year, because the region has dense towns and a large base of online shoppers. Alexandria is a major port and commercial city, which supports both domestic and cross-border flows. Couriers serve Delta towns from regional hubs linked to Cairo by highways. In turn, the region adds steady volume from fashion, electronics and grocery orders.
Why are southern governorates adding delivery routes?
Upper Egypt held a 12.0% share of 2025 value and grows fastest at 15.70% a year, because carriers are adding hubs and routes in southern governorates that were once poorly served. Many rural buyers now shop on phones and pay through wallets or cash at the door. Post office pickup points also help couriers reach villages at lower cost. As a result, the region gains share from a smaller base.
Why do the Canal and coastal governorates matter?
Canal and Coastal Governorates held 8.0% of 2025 value and grow at 15.00% a year, because port cities, industrial zones and resort towns create mixed demand. The Suez Canal zone hosts factories and logistics parks that support B2B and cross-border shipments. Coastal resorts also see seasonal spikes in orders during summer. In turn, carriers add temporary capacity in these areas during peak months.
Sorting, warehouse and customs milestones in 2025–2026
| Development | Status and market relevance |
|---|---|
| In June 2025, Jumia opened a warehouse of more than 27,000 square meters on the Suez Road in Cairo, its largest integrated warehouse in Egypt. | Adds fulfillment space for marketplace sellers |
| In December 2025, Amazon expanded its Egyptian storage capacity to more than 100,000 cubic meters, with main centers in 10th of Ramadan City and on the Suez Road. | Raises storage for essentials and local products |
| In December 2025, DHL Express and Yanmu agreed to build a EUR 24 million center of 13,000 square meters in the East Cairo Logistics Park. | Expected to double DHL operating capacity in Egypt |
| In January 2026, Bosta launched an automated sorting machine in Cairo able to process 11,000 parcels an hour. | Lifts daily capacity above 250,000 parcels |
| In March 2026, the finance ministry began piloting the Advanced Cargo Information system for express couriers, mandatory from May 1, 2026. | Requires advance data for cross-border parcels |
Sorters, tracking apps and data links speed parcels
- Automated sorters scan and route thousands of parcels an hour, which cuts manual handling at peak times such as Ramadan and annual sales events, when order volumes jump sharply.
- Warehouse management systems track stock, picking and packing for each seller, which supports outsourced fulfillment and lets many small merchants share one large warehouse.
- Driver and tracking apps plan routes, record proof of delivery and share live status with buyers, which lowers failed deliveries and refused parcels in busy urban districts.
- Customs data links send shipment details to the customs platform before arrival, which speeds clearance of cross-border parcels and meets the new advance cargo rules.
Need a Custom Version of This Report?
Tailor the scope, geography, or segments to your exact requirements.
- Custom geography or segment scope
- Direct access to our analyst team
Marketplaces, express carriers and startups compete
Competition is shaped by marketplaces with their own delivery networks, global express carriers, the national postal operator and local delivery startups. Amazon and Jumia run large warehouses around Cairo and control delivery for many of their own orders. DHL Express competes in cross-border and premium express shipments and is building a larger East Cairo center. Bosta competes for small and midsize merchants with delivery, warehousing, fulfillment and order tools, backed by more than 50 hubs. Egypt Post offers a nationwide office network that marketplaces can use for payment and pickup. Rivals compete on coverage, delivery speed, cash remittance times, returns handling and price. Because sellers judge carriers on successful first-attempt delivery, providers with dense hubs and strong tracking tools usually win the largest accounts.
Which carriers and platforms move Egyptian online orders?
| Company | Type | Role in the market |
|---|---|---|
| Bosta | Local delivery and fulfillment provider | Handled 37 million parcels in 2025 through more than 50 hubs |
| Amazon Egypt | Marketplace with own fulfillment | Runs main fulfillment centers in 10th of Ramadan City and on the Suez Road |
| Jumia Egypt | Marketplace with own logistics | Opened a 27,000-square-meter warehouse on the Suez Road in 2025 |
| DHL Express Egypt | Global express carrier | Building a EUR 24 million center in the East Cairo Logistics Park |
| Egypt Post | National postal operator | Offers nationwide post offices for marketplace payment and delivery |
Credence Research view on Egyptian parcel networks
Credence Research's view is that Egyptian online order delivery will keep growing quickly because a young, phone-first population is buying more goods online each year. Last-mile delivery remains the largest value pool, while fulfillment, cross-border outbound shipments and social-commerce sellers add the fastest growth. Automated sorting and larger warehouses will lower costs per parcel and raise service levels. Carriers that combine dense hubs, digital payments and returns handling should gain the most, while inflation and cash handling keep pressure on margins.
How the Egyptian parcel and fulfillment estimate was built
The report uses 2025 as the base year on a calendar basis, and market values come from the Credence Research model. That model combines population and internet statistics, payment data, inflation data and company releases on parcel volumes, hubs and warehouses. Regional shares, segment splits and growth rates are Credence Research estimates, because the client sheet gave regions without shares. Sources used are official statistics, IMF data, government releases and company releases reported in trade media, and no interviews or surveys were used.
Automation and wider coverage carry growth to 2035
The Egypt e-commerce logistics market is expected to reach USD 5.75 billion by 2035, a 14.41% CAGR during 2026–2035, as online orders spread from Cairo to smaller towns and villages. Growth should be strongest in fulfillment, cross-border outbound shipments, social-commerce sellers and Upper Egypt, because these areas gain most from new hubs and digital payments. Automated sorting and advance customs data will raise speed and control, while inflation, cash handling and long rural routes could slow some carriers.
Frequently Asked Questions
How big is the Egypt e-commerce logistics market?
Which service type leads Egyptian parcel spending?
Which region leads the Egyptian market?
How many parcels do leading Egyptian carriers handle?
How do digital payments affect delivery costs?
Which customer type is growing fastest?
Who are the leading companies in the Egyptian market?
What are the main challenges for carriers in Egypt?
Table of Content
Chapter 1 Market Segmentation
- 1.1 Segmentation Framework
- 1.1.1 Product and Service Classification
- 1.1.2 Application and End-Use Classification
- 1.1.3 Technology and Solution Classification
- 1.1.4 Customer and Distribution Channel Classification
- 1.1.5 Geographic Segmentation
- 1.1.6 Market Segment Definitions and Boundaries
- 1.2 By Service Type
- 1.2.1 Last-Mile Delivery
- 1.2.2 Fulfillment and Warehousing
- 1.2.3 Cross-Border Logistics
- 1.2.4 Reverse Logistics
- 1.3 By Shipment Flow
- 1.3.1 Domestic B2C
- 1.3.2 Domestic B2B
- 1.3.3 Cross-Border Inbound
- 1.3.4 Cross-Border Outbound
- 1.4 By Customer Type
- 1.4.1 E-Commerce Marketplaces
- 1.4.2 Direct-to-Consumer Brands
- 1.4.3 Social-Commerce Sellers
- 1.4.4 Enterprise Retailers
- 1.5 By End-Use Industry
- 1.5.1 Fashion and Apparel
- 1.5.2 Consumer Electronics
- 1.5.3 Food and Grocery
- 1.5.4 Beauty, Health and Home
Chapter 2 Introduction
- 2.1 Report Objectives and Scope
- 2.2 Product Definition and Industry Terminology
- 2.3 Market Inclusions and Exclusions
- 2.4 Research Process
- 2.4.1 Primary Research and Expert Interviews
- 2.4.2 Secondary Research and Source Review
- 2.4.3 Top-Down and Bottom-Up Estimation
- 2.4.4 Data Triangulation and Verification
- 2.5 Market Size Measurement Basis
- 2.5.1 2025: USD 1.49 billion → 2035: USD 5.75 billion
- 2.6 Historical and Forecast Reference Periods
- 2.6.1 Historical Period: 2018-2025
- 2.6.2 Base Year: 2025
- 2.6.3 Forecast Period: 2025-2035
- 2.7 Research Assumptions and Limitations
Chapter 3 Executive Summary
- 3.1 Market Snapshot and Key Findings
- 3.2 Base-Year Market Size, 2025
- 3.3 Forecast Market Size, 2035
- 3.4 Revenue and Volume Growth Outlook
- 3.5 Key Demand and Supply Indicators
- 3.6 Leading Market Segments
- 3.7 Fastest-Growing Market Opportunities
- 3.8 Regional Performance Highlights
- 3.9 Technology and Industry Transformation
- 3.10 Competitive Landscape Summary
- 3.11 Analyst View and Strategic Implications
Chapter 4 Egypt E-Commerce Logistics Market Trends and Developments
- 4.1 Historical Industry Development, 2018-2025
- 4.2 Recent Market Trends and Developments
- 4.3 Demand and Customer Behavior Trends
- 4.4 Technology and Product Innovation
- 4.5 Artificial Intelligence, Automation and Digitalization
- 4.6 Local Manufacturing and Supply Chain Realignment
- 4.7 Industry Partnerships, Mergers and Acquisitions
- 4.8 Sustainability and Circular Economy Developments
- 4.9 Government and Private Sector Investment Trends
- 4.10 Emerging Business Models and Commercialization
- 4.11 Industry Developments and Announcements
Chapter 5 Egypt E-Commerce Logistics Market Production, Supply and Demand Analysis
- 5.1 Demand Trend and Consumption Analysis, 2018-2025
- 5.2 Demand Forecast, 2025-2035
- 5.3 Production and Output Trend, 2018-2025
- 5.4 Production and Output Forecast, 2025-2035
- 5.5 Installed Capacity and Capacity Utilization
- 5.6 Company-Wise Production Plants and Statistics
- 5.6.1 Installed Production Capacity
- 5.6.2 Actual Production
- 5.6.3 Planned Capacity and Expansion Targets
- 5.7 Supply Chain Structure and Procurement Trends
- 5.8 Supply-Demand Gap and Bottlenecks
- 5.9 Import Dependence and Sourcing Structure
- 5.10 Contract Manufacturing and Outsourcing
- 5.11 Regional Supply and Demand Concentration
Chapter 6 Egypt E-Commerce Logistics Market Pricing Analysis
- 6.1 Pricing Structure and Measurement
- 6.2 Historical Pricing Trends, 2018-2025
- 6.3 Pricing Outlook, 2025-2035
- 6.4 Average Selling Price and Unit Economics
- 6.5 Pricing by Product and Market Segment
- 6.6 Geographic Pricing Differences
- 6.7 Key Input, Energy, Labor and Logistics Costs
- 6.8 Contract Pricing and Purchasing Models
- 6.9 Pricing Sensitivity and Competitive Positioning
- 6.10 Price, Margin and Profitability Implications
Chapter 7 Egypt E-Commerce Logistics Market Dynamics
- 7.1 Market Growth Drivers
- 7.1.1 Demand-Side Drivers
- 7.1.2 Technology and Innovation Drivers
- 7.1.3 Infrastructure and Investment Drivers
- 7.1.4 Regulatory and Policy Drivers
- 7.2 Market Restraints
- 7.2.1 Cost and Affordability Constraints
- 7.2.2 Technology and Adoption Barriers
- 7.2.3 Supply Chain and Operational Constraints
- 7.3 Market Challenges
- 7.3.1 Competitive Pressure and Margin Erosion
- 7.3.2 Skills, Infrastructure and Implementation Gaps
- 7.4 Emerging Market Opportunities
- 7.5 Market Dynamics Impact and Time-Horizon Assessment
Chapter 8 Egypt E-Commerce Logistics Value Chain Analysis
- 8.1 Industry Value Chain Overview
- 8.2 Upstream Suppliers and Critical Inputs
- 8.3 Technology and Component Providers
- 8.4 Manufacturing or Service Delivery
- 8.5 Distribution, Channel Partners and Integrators
- 8.6 Downstream Applications and End Users
- 8.7 Value Addition and Profit Pools
- 8.8 Vertical Integration and Outsourcing
- 8.9 Supplier Concentration and Risk
- 8.10 Supply Chain Localization and Resilience
Chapter 9 Egypt E-Commerce Logistics Market Regulations and Policies
- 9.1 Relevant Laws, Standards and Compliance Frameworks
- 9.2 Product, Service, Safety and Quality Requirements
- 9.3 Government Policies, Incentives and Subsidies
- 9.4 Imports, Exports and Trade Barriers
- 9.5 Public Procurement and Local Content Requirements
- 9.6 Environmental and Sustainability Compliance
- 9.7 Upcoming Policy Changes and Market Implications
Chapter 10 Egypt E-Commerce Logistics Market Hotspots and Opportunities
- 10.1 Market Opportunity Mapping and Growth Hotspots
- 10.2 High-Growth Applications and Customer Groups
- 10.3 Underserved Markets and White-Space Opportunities
- 10.4 Emerging Technology and Product Opportunities
- 10.5 New Capacity and Investment Hotspots
- 10.6 Market Entry and Expansion Opportunities
- 10.7 Distribution and Partnership Opportunities
- 10.8 Near-Term and Long-Term Commercial Potential
- 10.9 Opportunity Attractiveness and Execution Risks
Chapter 11 Egypt E-Commerce Logistics Market Outlook, 2025-2035
- 11.1 Market Size and Analysis
- 11.1.1 Revenue (Market Measurement: 2025: USD 1.49 billion → 2035: USD 5.75 billion)
- 11.1.2 Market Volume and Quantity Sold
- 11.1.3 Historical Market Size, 2018-2025
- 11.1.4 Base-Year Market Size, 2025
- 11.2 Market Forecast, 2025-2035
- 11.2.1 Revenue Forecast to 2035
- 11.2.2 Volume Forecast to 2035
- 11.2.3 CAGR and Year-on-Year Growth
- 11.2.4 Incremental Revenue Opportunity
- 11.3 Forecast Assumptions and Scenario Analysis
- 11.3.1 Base-Case Forecast
- 11.3.2 Optimistic and Conservative Scenarios
- 11.3.3 Technology, Pricing and Policy Sensitivities
- 11.4 Market Attractiveness and Growth Outlook
Chapter 12 Egypt E-Commerce Logistics Market Segmentation and Outlook
- 12.1 Segmentation Summary and Market Shares, 2025
- 12.2 Largest and Fastest-Growing Segments
- 12.3 By Service Type - Market Size and Forecast, 2025-2035
- 12.3.1 Segment Definition and Scope
- 12.3.2 Historical Market Size, 2018-2025
- 12.3.3 Revenue Forecast, 2025-2035
- 12.3.4 Volume Forecast, 2025-2035
- 12.3.5 Base-Year Market Share, 2025
- 12.3.6 Segment CAGR and Growth Drivers
- 12.3.7 Subsegment Market Size and Forecast
- 12.3.7.1 Last-Mile Delivery
- 12.3.7.2 Fulfillment and Warehousing
- 12.3.7.3 Cross-Border Logistics
- 12.3.7.4 Reverse Logistics
- 12.3.8 Subsegment Pricing and Adoption Trends
- 12.3.9 Leading Suppliers and Competition
- 12.3.10 Regional Demand and Opportunities
- 12.4 By Shipment Flow - Market Size and Forecast, 2025-2035
- 12.4.1 Segment Definition and Scope
- 12.4.2 Historical Market Size, 2018-2025
- 12.4.3 Revenue Forecast, 2025-2035
- 12.4.4 Volume Forecast, 2025-2035
- 12.4.5 Base-Year Market Share, 2025
- 12.4.6 Segment CAGR and Growth Drivers
- 12.4.7 Subsegment Market Size and Forecast
- 12.4.7.1 Domestic B2C
- 12.4.7.2 Domestic B2B
- 12.4.7.3 Cross-Border Inbound
- 12.4.7.4 Cross-Border Outbound
- 12.4.8 Subsegment Pricing and Adoption Trends
- 12.4.9 Leading Suppliers and Competition
- 12.4.10 Regional Demand and Opportunities
- 12.5 By Customer Type - Market Size and Forecast, 2025-2035
- 12.5.1 Segment Definition and Scope
- 12.5.2 Historical Market Size, 2018-2025
- 12.5.3 Revenue Forecast, 2025-2035
- 12.5.4 Volume Forecast, 2025-2035
- 12.5.5 Base-Year Market Share, 2025
- 12.5.6 Segment CAGR and Growth Drivers
- 12.5.7 Subsegment Market Size and Forecast
- 12.5.7.1 E-Commerce Marketplaces
- 12.5.7.2 Direct-to-Consumer Brands
- 12.5.7.3 Social-Commerce Sellers
- 12.5.7.4 Enterprise Retailers
- 12.5.8 Subsegment Pricing and Adoption Trends
- 12.5.9 Leading Suppliers and Competition
- 12.5.10 Regional Demand and Opportunities
- 12.6 By End-Use Industry - Market Size and Forecast, 2025-2035
- 12.6.1 Segment Definition and Scope
- 12.6.2 Historical Market Size, 2018-2025
- 12.6.3 Revenue Forecast, 2025-2035
- 12.6.4 Volume Forecast, 2025-2035
- 12.6.5 Base-Year Market Share, 2025
- 12.6.6 Segment CAGR and Growth Drivers
- 12.6.7 Subsegment Market Size and Forecast
- 12.6.7.1 Fashion and Apparel
- 12.6.7.2 Consumer Electronics
- 12.6.7.3 Food and Grocery
- 12.6.7.4 Beauty, Health and Home
- 12.6.8 Subsegment Pricing and Adoption Trends
- 12.6.9 Leading Suppliers and Competition
- 12.6.10 Regional Demand and Opportunities
- 12.7 Segment Growth Comparison
- 12.8 Segment Attractiveness and Priority Matrix
Chapter 13 Egypt E-Commerce Logistics End-Use and Application Market Outlook
- 13.1 End-Use Industry and Customer Demand Structure
- 13.2 Leading Applications and Customer Groups
- 13.3 End-Use Market Size, Share and Forecast
- 13.4 Major End-Use Industry Deep Dives
- 13.4.1 Customer Requirements and Use Cases
- 13.4.2 Demand and Replacement Cycles
- 13.4.3 Technical and Regulatory Considerations
- 13.4.4 Purchasing and Procurement Models
- 13.4.5 Leading Vendors and Distribution Channels
- 13.4.6 Forecast and Commercial Opportunities
- 13.5 Emerging Applications and Cross-Segment Demand
- 13.6 End-Use Industry Investment Priorities
Chapter 14 Egypt E-Commerce Logistics Geographic Market Outlook, 2025-2035
- 14.1 Domestic Market Distribution and Demand Clusters
- 14.2 State- or Province-Wise Market Size and Forecast, 2025-2035
- 14.3 City and Metropolitan Market Outlook
- 14.4 Industrial, Manufacturing and Commercial Clusters
- 14.5 Geographic Concentration of Key End Users
- 14.6 Local Pricing and Purchasing Differences
- 14.7 Domestic Production Facilities and Capacity Map
- 14.8 Local Infrastructure and Project Pipeline
- 14.9 State-Level Policy and Incentive Differences
- 14.10 Subnational Investment Hotspots and Opportunities
- 14.11 Distribution and Logistics Networks
- 14.12 Domestic Competitive Footprint
Chapter 15 Egypt E-Commerce Logistics Technology, Innovation and Sustainability Outlook
- 15.1 Technology Landscape and Maturity
- 15.2 Product, Process and Service Innovation
- 15.3 AI, Automation and Digital Tools in the Industry
- 15.4 Technology Adoption and Performance Benchmarking
- 15.5 Innovation Pipeline and R&D Investment
- 15.6 Patent and Intellectual Property Trends
- 15.7 Energy Efficiency and Resource Management
- 15.8 Sustainability, Recycling and Circularity
- 15.9 Technology Roadmap, 2025-2035
- 15.10 Risks of Obsolescence and Technology Substitution
Chapter 16 Egypt E-Commerce Logistics Market Key Strategic Imperatives
- 16.1 Growth and Market Entry Priorities
- 16.2 High-Return Products and Segments
- 16.3 Pricing, Profitability and Cost Optimization
- 16.4 Technology Investment and Product Differentiation
- 16.5 Supply Chain Localization and Resilience
- 16.6 Distribution and Customer Acquisition
- 16.7 Partnership, Acquisition and Capacity Strategy
- 16.8 Regional Expansion Priorities
- 16.9 Short-, Medium- and Long-Term Actions
Chapter 17 Competition Outlook
- 17.1 Industry Competition Characteristics
- 17.2 Market Structure and Concentration
- 17.3 Market Share and Competitive Positioning, 2025
- 17.4 Company-Wise Revenue and Product Benchmarking
- 17.5 Production and Service Capacity Benchmarking
- 17.6 Technology, Pricing and Differentiation
- 17.7 Regional Footprint and Distribution Strength
- 17.8 Mergers, Acquisitions and Strategic Alliances
- 17.9 New Entrants and Competitive Threats
- 17.10 Porter's Five Forces and Industry Attractiveness
- 17.11 Competitive Outlook, 2025-2035
Chapter 18 Company Profiles
- 18.1 Company Coverage and Selection Criteria
- 18.2 Amazon Egypt
- 18.2.1 Business Description
- 18.2.2 Company Ownership and Geographic Presence
- 18.2.3 Product and Service Portfolio
- 18.2.4 Manufacturing and Operating Footprint
- 18.2.5 Production Capacity and Expansion Plans
- 18.2.6 Financial Performance and Investment
- 18.2.7 Market Share and Competitive Position
- 18.2.8 Technology and Innovation Capabilities
- 18.2.9 Strategic Alliances or Partnerships
- 18.2.10 Recent Developments
- 18.2.11 Growth Strategy and Outlook
- 18.3 Jumia Egypt
- 18.4 Egypt Post
- 18.5 Aramex Egypt
- 18.6 DHL Express Egypt
- 18.7 FedEx Express Egypt
- 18.8 Bosta
- 18.9 Mylerz
- 18.10 ShipBlu
- 18.11 NAQEL Express
- 18.12 Other Relevant Market Participants
Note: Every listed company is profiled on the structure shown under the first company. The company list is preliminary and may change based on research findings, market developments, data availability and client requirements.
Chapter 19 Disclaimer
- 19.1 Research and Forecast Disclaimer
- 19.2 Data Source and Estimation Limitations
Note: The depth of individual sections depends on data availability for this market. Volume, capacity, trade and other unit-based metrics are included where applicable.

