
Efficiency rules and plug-in sales lift copper per new car
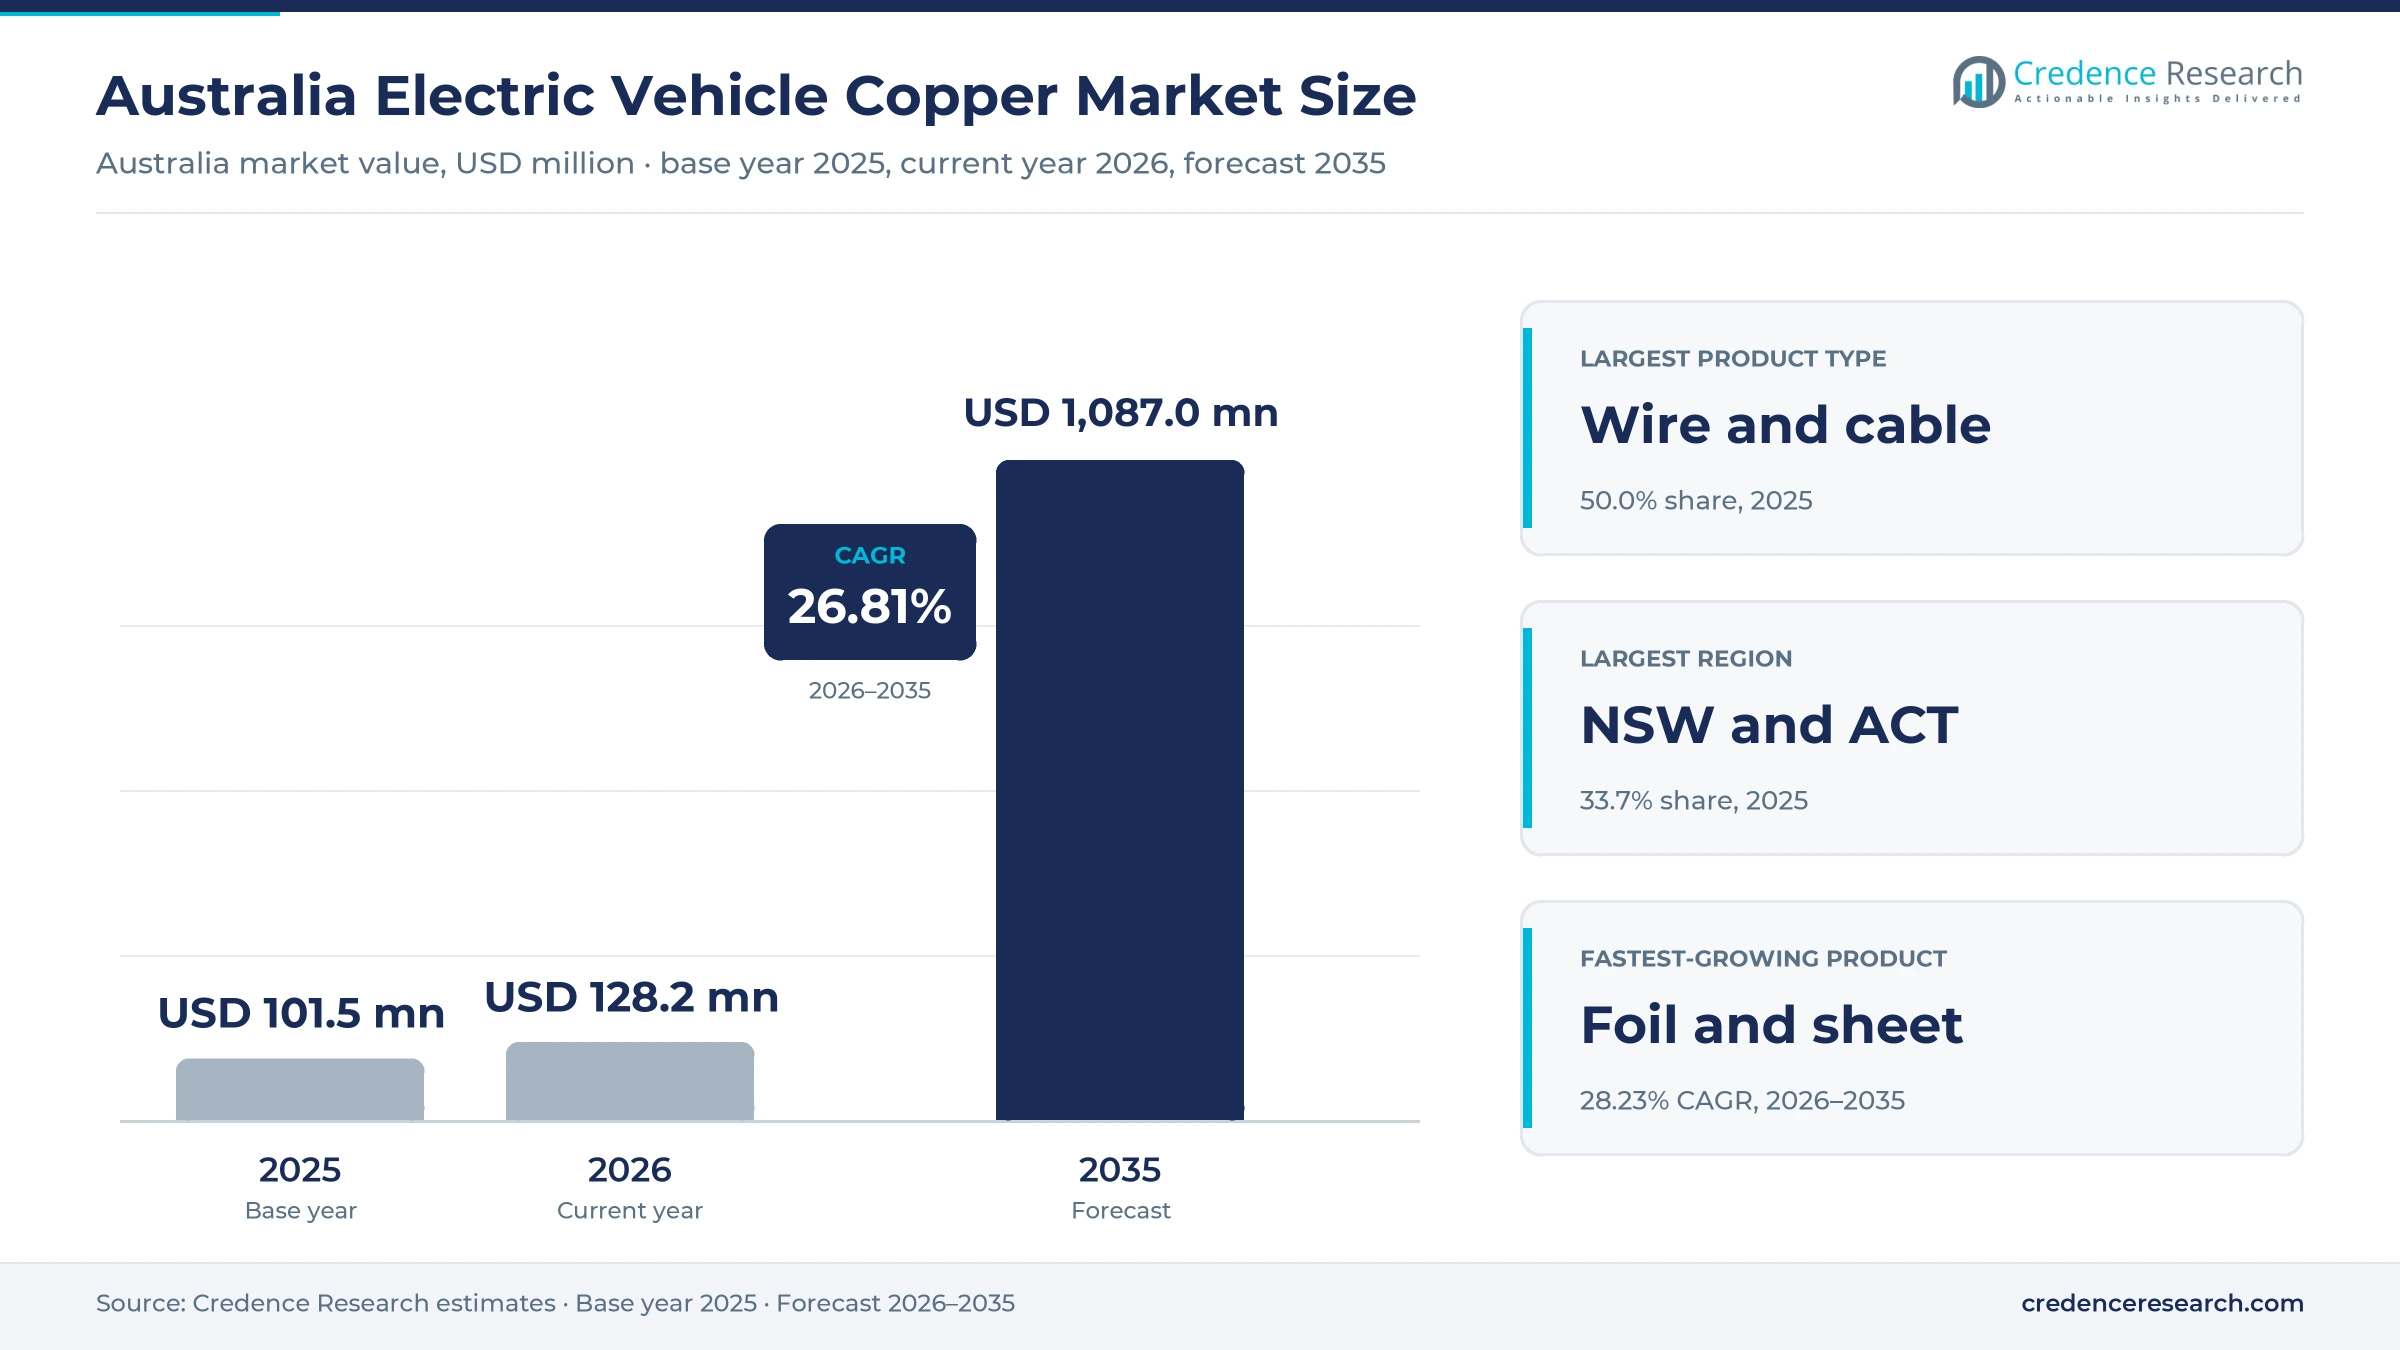
The Australia electric vehicle copper market was valued at USD 101.5 million in 2025 and is projected to increase from USD 128.2 million in 2026 to USD 1.09 billion by 2035, registering a CAGR of 26.81% during 2026–2035. Demand comes from battery electric cars, plug-in hybrids, electric utes and the fast chargers that serve them, because each of these products needs far more cable, foil and busbar than a petrol vehicle. New South Wales and the ACT held the largest regional share, 33.7% in 2025, because Sydney leads in electric car sales and charging locations. Queensland and the Northern Territory form the fastest-growing region at 27.29% a year, as charging corridors reach regional towns and fleets switch to electric models. However, the New Vehicle Efficiency Standard, which began on Jan. 1, 2025, changed the commercial case for suppliers by tying penalties to the average emissions of every new car they sell.
Which copper products and uses does the estimate count?
The estimate measures the value of copper wire and cable, foil and sheet, and busbars and connectors used in new battery electric cars, plug-in hybrids and electric light commercial vehicles sold in Australia. It also counts copper used in public and private charging equipment installed in the country during each year.
The estimate excludes copper in conventional hybrids, petrol and diesel vehicles, grid upgrades and mining equipment. The value chain runs from refined copper and rod through cable, foil and busbar makers to battery, harness and charger suppliers, which then sell to carmakers, importers and charging operators.
Australia Electric Vehicle Copper Market Insights
- The Australia electric vehicle copper market was valued at USD 101.5 million in 2025 and is projected to reach USD 1.09 billion by 2035, registering a CAGR of 26.81% during 2026–2035.
- New South Wales and the ACT held a 33.7% share of 2025 value, because Sydney leads in electric car sales and public charging locations.
- Wire and cable led with a 50.0% share of 2025 value, because harnesses, motor windings and high-voltage cables hold most of the copper in each vehicle.
- Australians bought more than 157,000 electric vehicles in 2025, up 38% on 2024, and battery electric sales passed 100,000 for the first time.
- Foil and sheet grow fastest at 28.23% a year during 2026–2035, as larger battery packs in electric SUVs and utes need more thin copper foil.
Wire and cable lead while thin battery foil grows fastest
Why do wire and cable hold the largest copper share?
Based on product type, the market is categorized into wire and cable, foil and sheet, and busbars and connectors. Wire and Cable led with a 50.0% share of 2025 value, because harnesses, motor windings and high-voltage cables use most of the copper in each electric vehicle. Foil and Sheet grow fastest at 28.23% a year, as bigger battery packs need more thin copper foil for each cell.
How does passenger mobility shape copper demand?
Based on end-use industry, the market is categorized into passenger mobility, light commercial mobility and EV charging infrastructure. Passenger Mobility led with a 72.0% share of 2025 value, because electric cars and SUVs make up most plug-in sales in Australia. Light Commercial Mobility grows fastest at 29.10% a year, as plug-in utes and electric vans reach trade and fleet buyers.
Which applications use the most copper per vehicle?
Based on application, the market is categorized into battery systems, vehicle electrical systems and charging equipment. Vehicle Electrical Systems led with a 46.0% share of 2025 value, because motors, inverters, harnesses and onboard chargers carry most of the copper in each car. Battery Systems grow fastest at 27.55% a year, as pack sizes rise and thin foil replaces thicker current collectors.
| Segment Group | Leading Sub-segment | Share, 2025 | Fastest-growing Sub-segment | CAGR, 2026–2035 |
|---|---|---|---|---|
| By Product Type | Wire and Cable | 50.0% | Foil and Sheet | 28.23% |
| By End-Use Industry | Passenger Mobility | 72.0% | Light Commercial Mobility | 29.10% |
| By Application | Vehicle Electrical Systems | 46.0% | Battery Systems | 27.55% |
Request a Free Sample
Fill in your details and we'll send you a free sample report.
- Sample data tables & charts
- Research methodology
Emissions limits, EV sales and fast chargers drive demand
How does vehicle efficiency compliance lift copper demand?
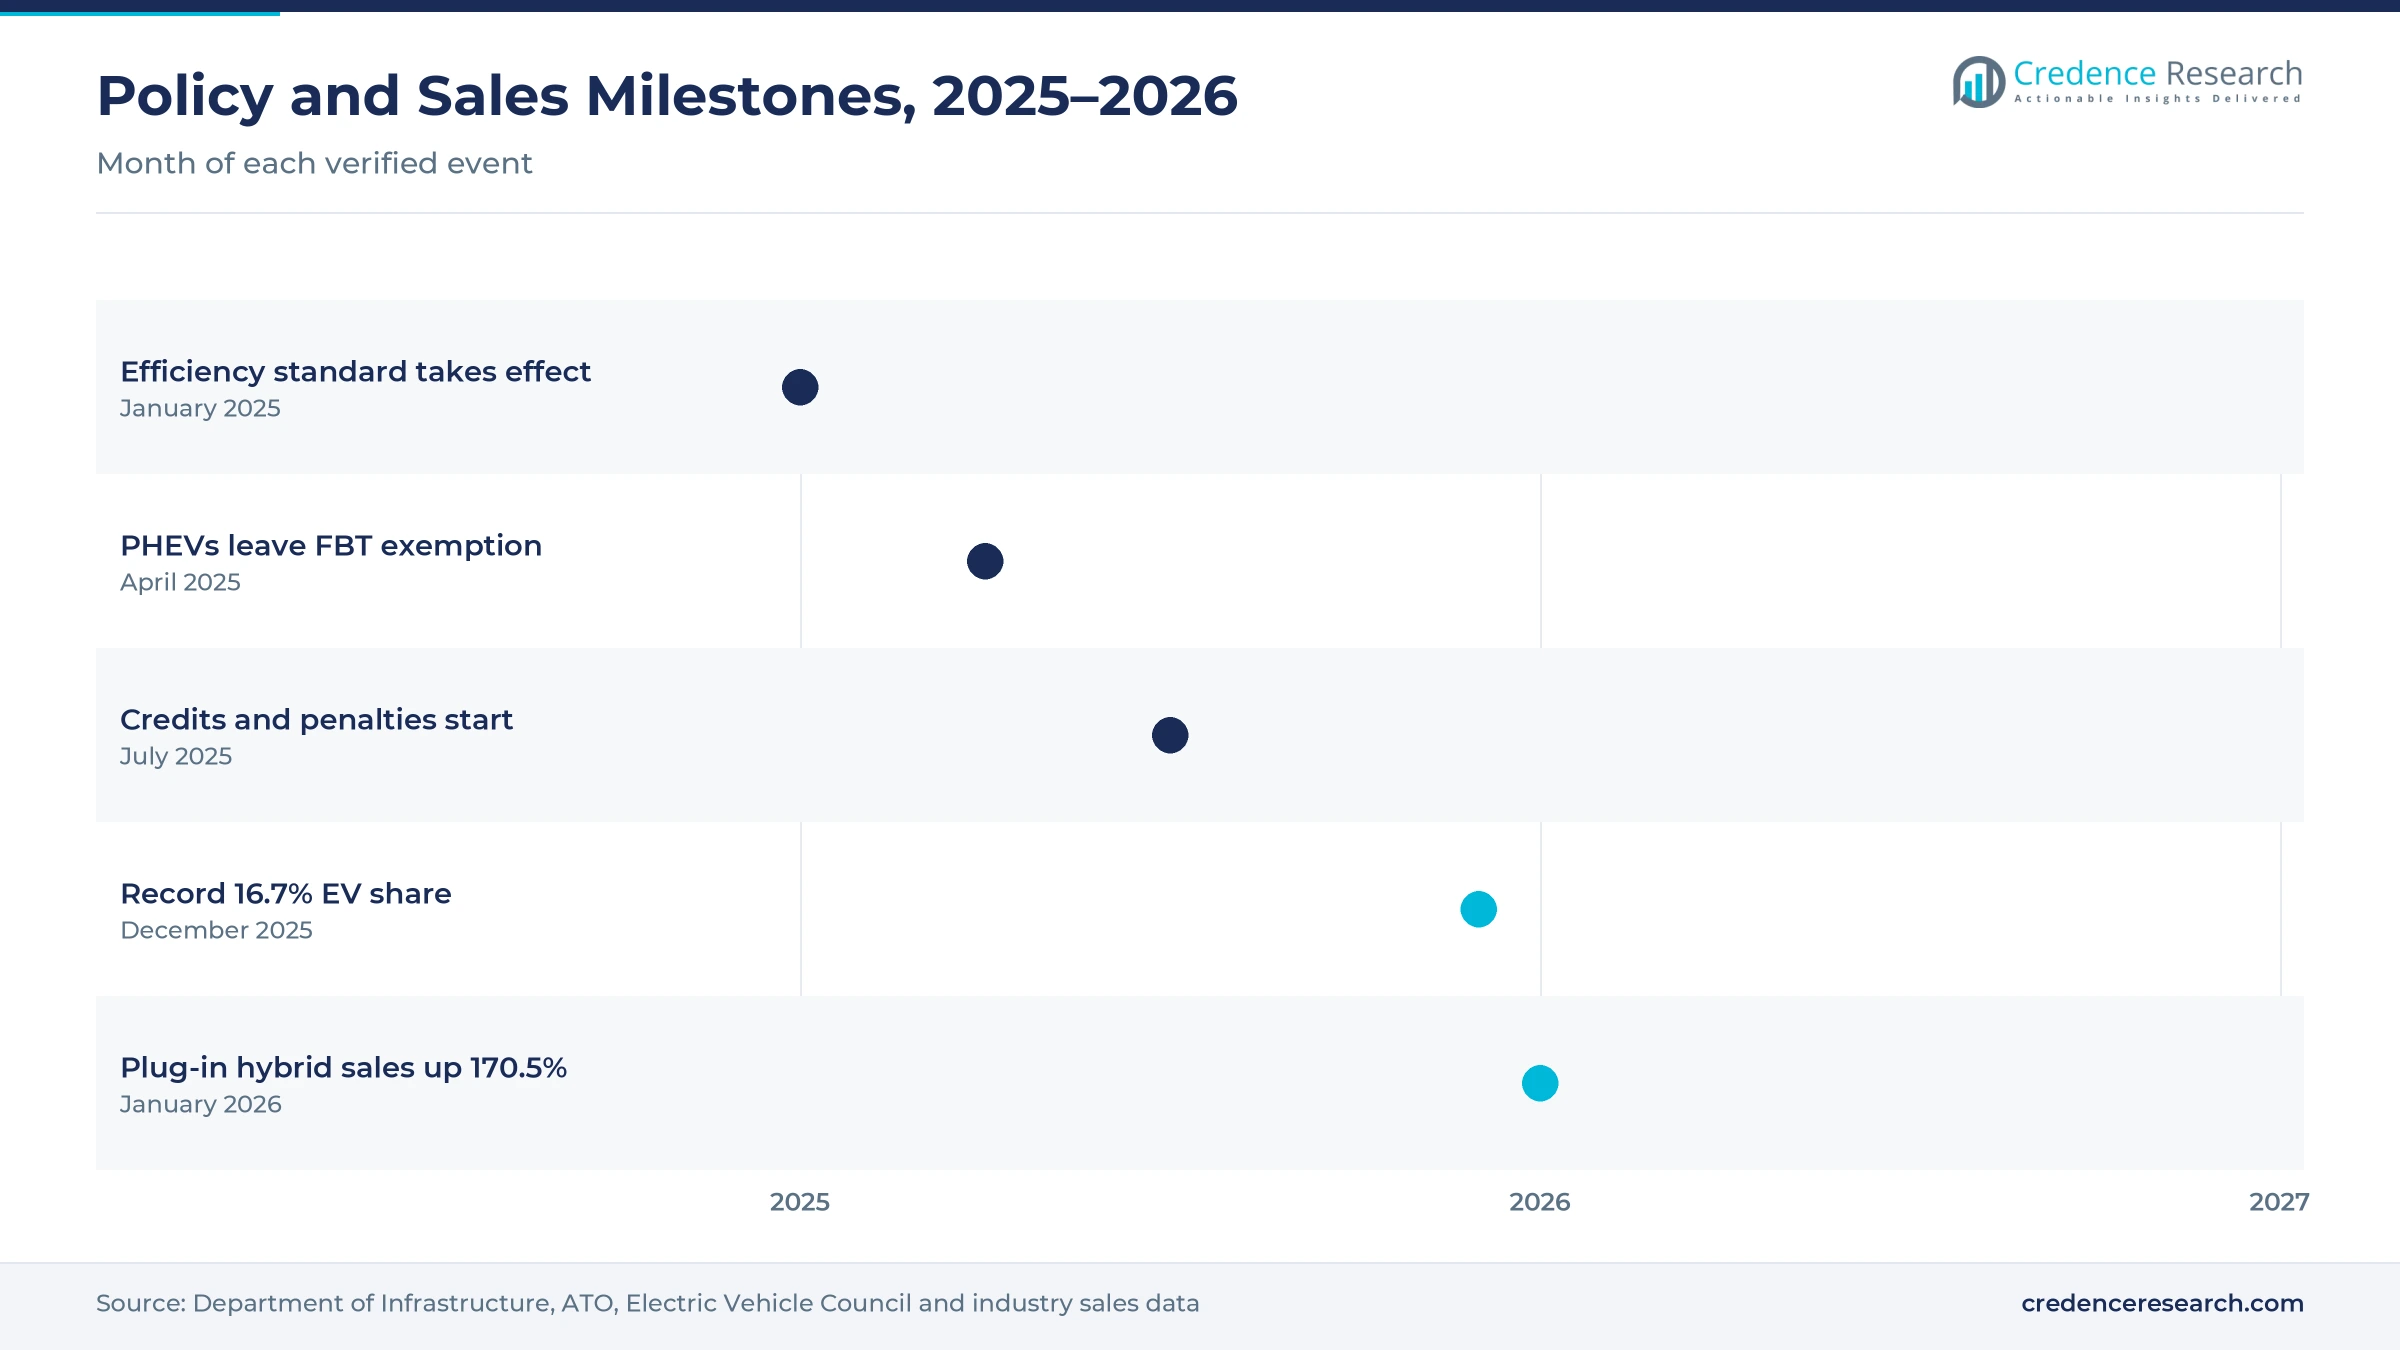
Vehicle efficiency compliance lifts copper demand, because suppliers must cut the average emissions of the new cars they sell or pay penalties. The government introduced the New Vehicle Efficiency Standard on Jan. 1, 2025, and suppliers started earning credits and penalties on July 1, 2025, according to the Department of Infrastructure. The headline limit for passenger vehicles falls from 141 grams of carbon dioxide per kilometer in 2025 to 58 grams in 2029, while the light commercial limit falls from 210 grams to 110 grams. The department expects new passenger vehicle emissions to fall by more than 60% by 2030. As a result, suppliers bring more battery electric and plug-in models, and passenger mobility holds 72.0% of 2025 value.
Why does broader plug-in vehicle adoption raise copper use?
Broader plug-in vehicle adoption raises copper use, because each battery electric or plug-in hybrid car carries far more conductor than a petrol model. Australians bought more than 157,000 electric vehicles in 2025, up 38% on 2024, according to the Electric Vehicle Council. Battery electric sales topped 100,000 for the first time at 103,300 units, while plug-in hybrid sales almost doubled to 53,484. Electric vehicles took 13.1% of new car sales in 2025, up from 9.6% a year earlier, and reached a record 16.7% in December. In turn, the national electric fleet passed 454,000 vehicles, which also lifts demand for replacement cables and connectors across older battery systems.
How does charging access expansion add copper demand?
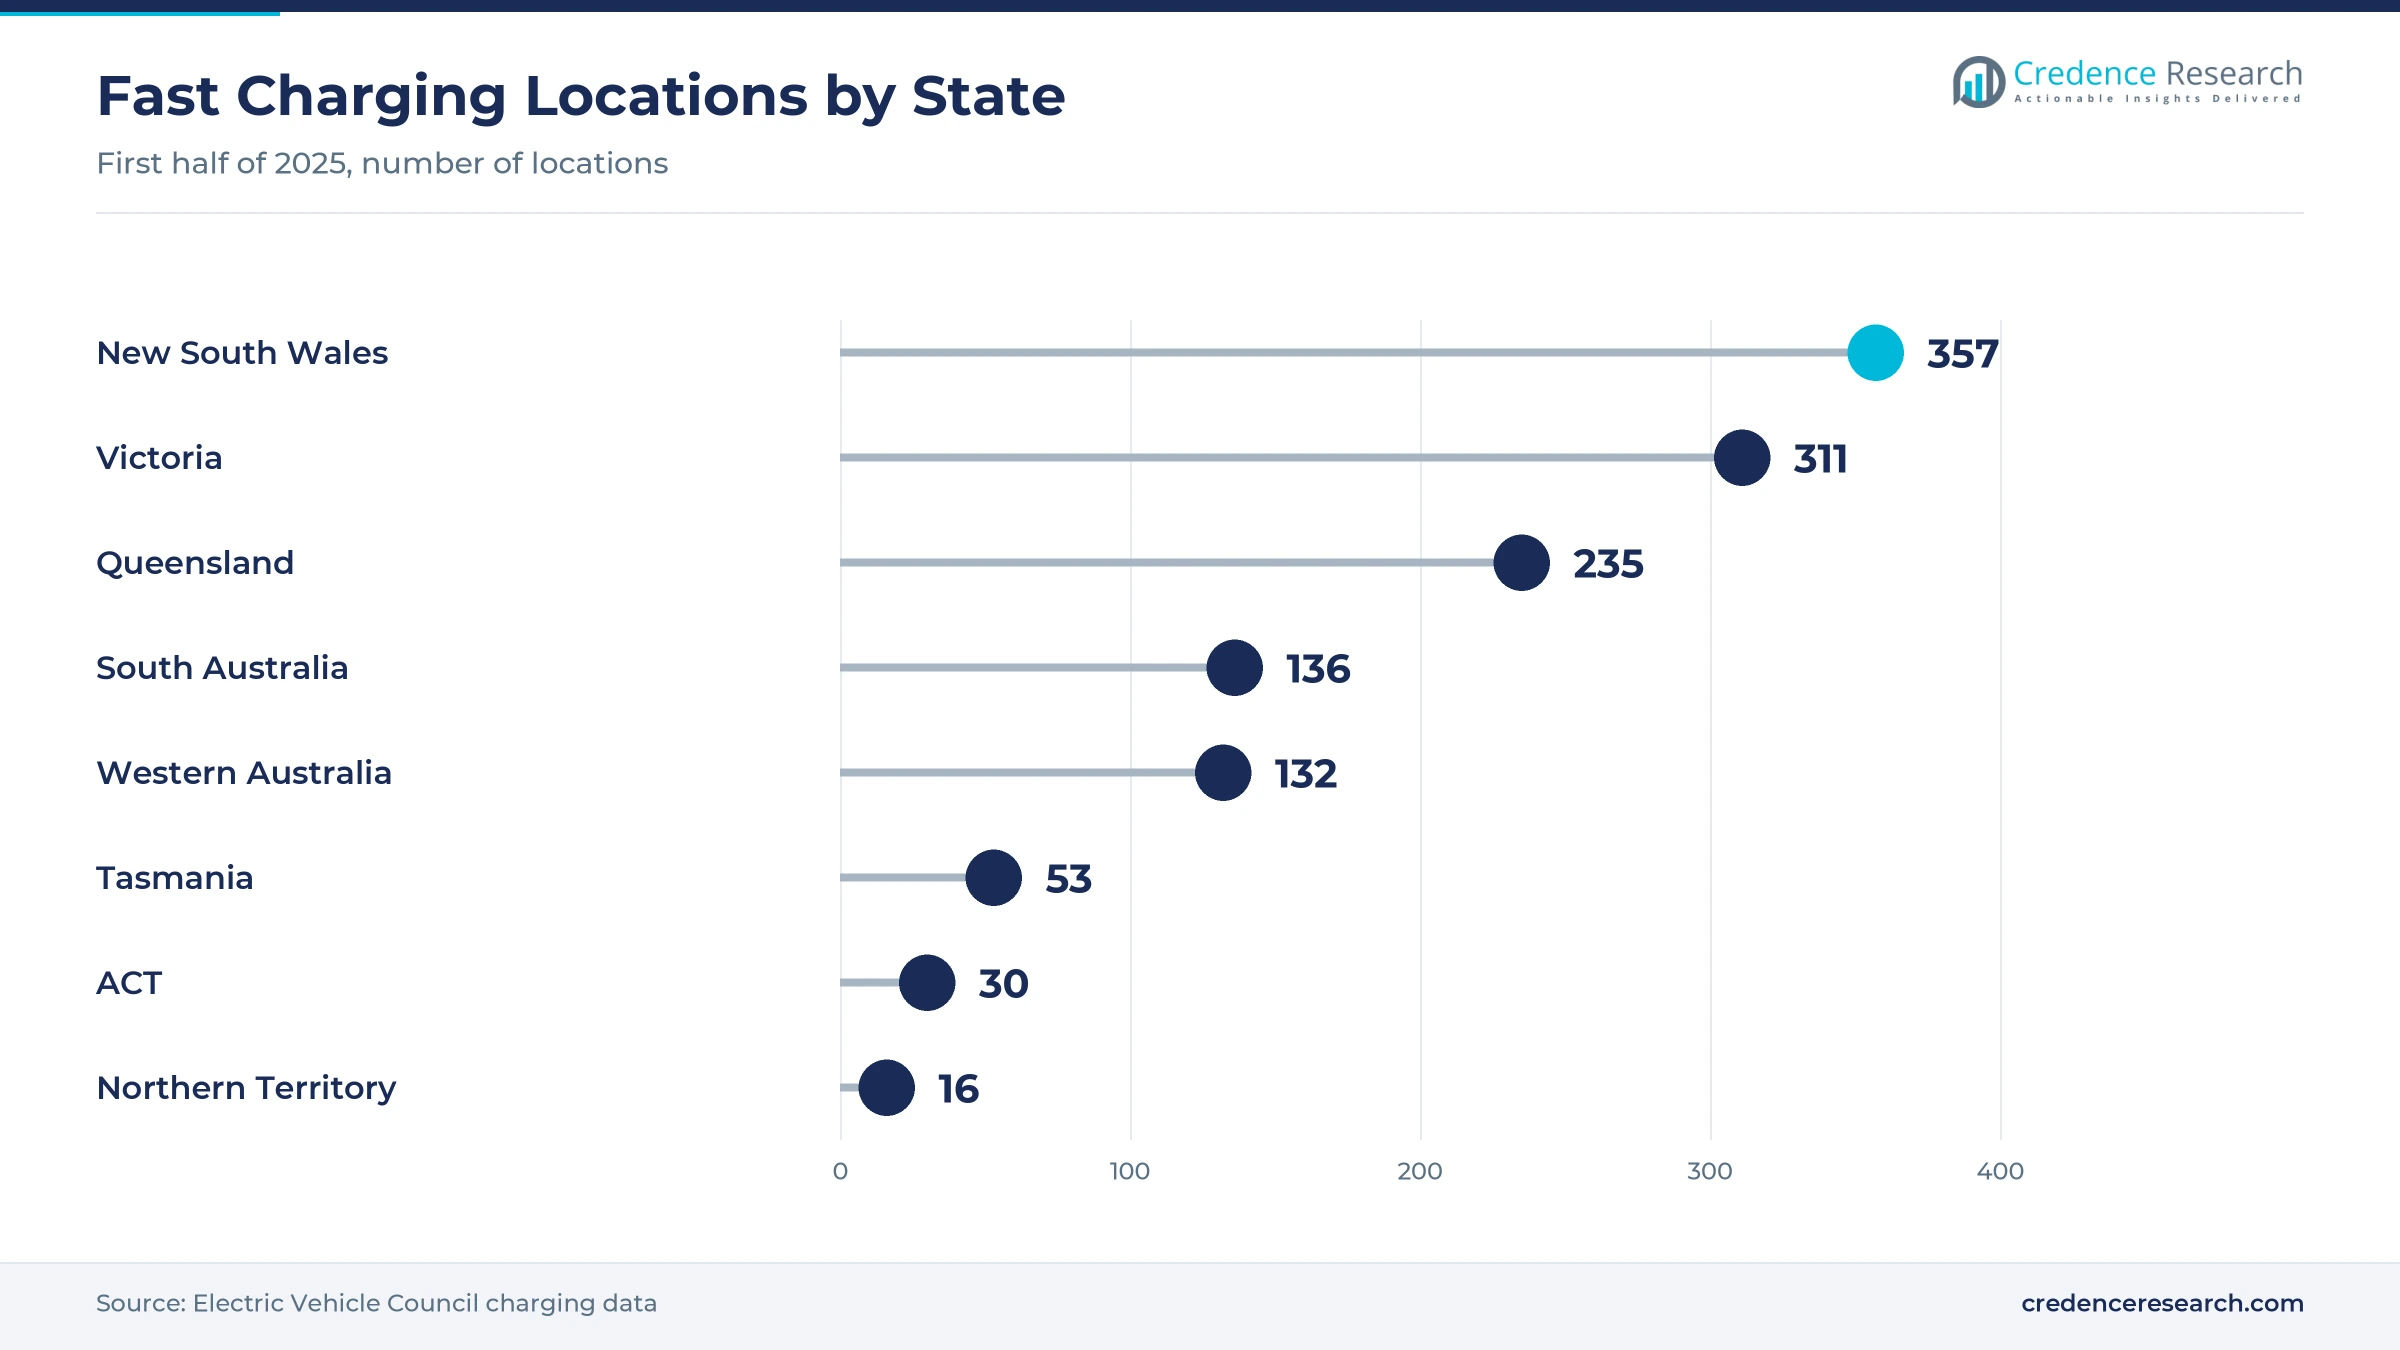
Charging access expansion adds a second copper demand stream, because every fast charger needs heavy cables, busbars and power connectors. Australia had 1,272 fast charging locations and more than 3,436 plugs by mid-2025, a 20% rise in locations from a year earlier, according to Electric Vehicle Council charging data. The government set aside $60 million to boost charging at car dealerships through the Driving the Nation fund. The same fund provides $39.3 million for 117 highway fast charging sites, about one every 150 kilometers. As a result, public charging networks spread into regional towns, which lifts copper demand for cabinets, cables and grid connections.
Why does higher copper intensity per vehicle multiply demand?
Higher copper intensity per vehicle multiplies demand, because electric drivetrains add motor windings, battery interconnects and high-voltage cabling. A battery electric car uses about 83 kg of copper, compared with 60 kg in a plug-in hybrid and 39 kg in a conventional hybrid, according to the International Copper Association. An electric bus can use between 224 kg and 369 kg, which raises demand from transit and fleet buyers. A 200 kW fast charger contains about 8 kg of copper, compared with 0.7 kg in a 3.3 kW home unit. As a result, wire and cable hold 50.0% of 2025 value, because wiring harnesses and motor windings account for most of the metal in each vehicle.
Plug-in utes, supply risk and ultrafast sites reshape demand
How is the rise of plug-in utes changing copper mix?
The rise of plug-in hybrids and electric utes is changing the copper mix, because larger vehicles carry longer cable runs and bigger battery interconnects. Plug-in hybrid sales in January 2026 rose 170.5% from a year earlier to 5,161 units, while battery electric sales rose 93.3% to 7,409 units. BYD expanded its range with 1,108 Shark 6 plug-in ute sales in January 2026, which shows electrification reaching the light commercial segment. Plug-in hybrids lost the fringe benefits tax exemption for electric cars on April 1, 2025, yet buyers still chose them for towing and range. As a result, light commercial mobility grows at 29.10% a year, the fastest end-use industry during 2026–2035.
Why is emerging copper supply risk a shift for buyers?
Emerging copper supply risk is a shift for buyers, because carmakers and cable suppliers now plan for tighter metal markets. The current mine pipeline points to a 30% global copper supply deficit by 2035, according to the International Energy Agency in May 2025. Australia holds the world's second-largest economic copper resources, about 11% of the world total, yet ranks eighth in output with 3% of world production. Copper export earnings reached about $13 billion in 2024-25 and are forecast to rise to $18.3 billion by 2030-31. In turn, local buyers favor suppliers with secure refined metal contracts and recycled content for wire, cable and busbar products.
Can ultrafast charging sites open room for busbars?
Ultrafast charging sites open room for busbars and connectors, because high-power units carry large currents through compact cabinets and cable sets. New South Wales had 143 ultrafast locations of 100 kW or more by mid-2025, the most of any state. South Australia had 89 ultrafast locations, more than its 47 fast sites, while Western Australia had 70 ultrafast locations out of 132 in total. Operators opened more than 800 high-powered plugs in the first half of 2025, and high-powered capacity expanded 22% in a year. In turn, suppliers of busbar assemblies and power connectors gain larger orders, because each new ultrafast site needs heavier conductors than a home wall unit.
Is thin battery foil a growth opening for suppliers?
Thin battery foil is a growth opening for suppliers, because the battery pack holds a large part of the copper in each electric car. The pack accounts for about 40 kg of copper, or 48% of the total, in a pure electric vehicle, according to copper industry data. Tesla sold 28,856 vehicles in Australia in 2025, led by 22,239 Model Y units, while BYD Sealion 7 sales reached 13,410. These mid-size SUVs carry large packs, which lifts foil demand per vehicle sold. As a result, foil and sheet grow at 28.23% a year, and battery systems grow at 27.55%, as cell makers use more electrodeposited foils in imported packs.
Price swings and slower uptake weigh on conductor demand
How do copper price swings affect conductor buyers?
Copper price swings affect conductor buyers, because cable, foil and busbar prices follow metal costs with only short delays. As a result, carmakers and charger suppliers face uneven input costs, which can squeeze margins on fixed-price fleet and project contracts. Suppliers respond with metal price adjustment clauses, hedging and longer supply agreements that share risk with buyers. This pressure is strongest for charging projects with long build times.
Why could slower EV uptake hold back copper demand?
Slower EV uptake could hold back copper demand, because each missed electric sale removes tens of kilograms of conductor from the market. The Electric Vehicle Council has announced that at least 240,000 new electric vehicles are needed in 2026 to stay on track, well above the 2025 result. In turn, a weaker year would cut orders for harnesses, packs and chargers. Suppliers respond by spreading sales across plug-in hybrids, utes and fleets.
How does aluminum substitution limit copper content?
Aluminum substitution limits copper content, because some carmakers use aluminum cable in large battery connections to save weight and cost. As a result, copper per vehicle may grow more slowly than battery size in some models, which reduces volume for wire and cable suppliers. Copper suppliers respond with thinner foils, smaller conductors and better joining methods that keep copper competitive. This challenge matters most in high-voltage cables and large battery busbars.
Why does reliance on imported components cap local value?
Reliance on imported components caps local value capture, because most electric vehicles, battery packs and chargers sold in Australia arrive fully built. In turn, Australian copper miners and cable makers supply only part of the conductor used in each new car, while overseas plants make most foil and windings. Local suppliers respond by focusing on charging cables, busbars, installation work and recycling, where domestic demand is growing.
Sydney charging density and western sites set the split
| Region | Value, 2025 (USD million) | Share, 2025 | CAGR, 2026–2035 |
|---|---|---|---|
| New South Wales and ACT | 34.2 | 33.7% | 26.69% |
| Victoria and Tasmania | 25.0 | 24.6% | 26.39% |
| Western Australia and South Australia | 21.8 | 21.5% | 26.99% |
| Queensland and Northern Territory | 20.5 | 20.2% | 27.29% |
Why do new South Wales and the ACT hold the top share?
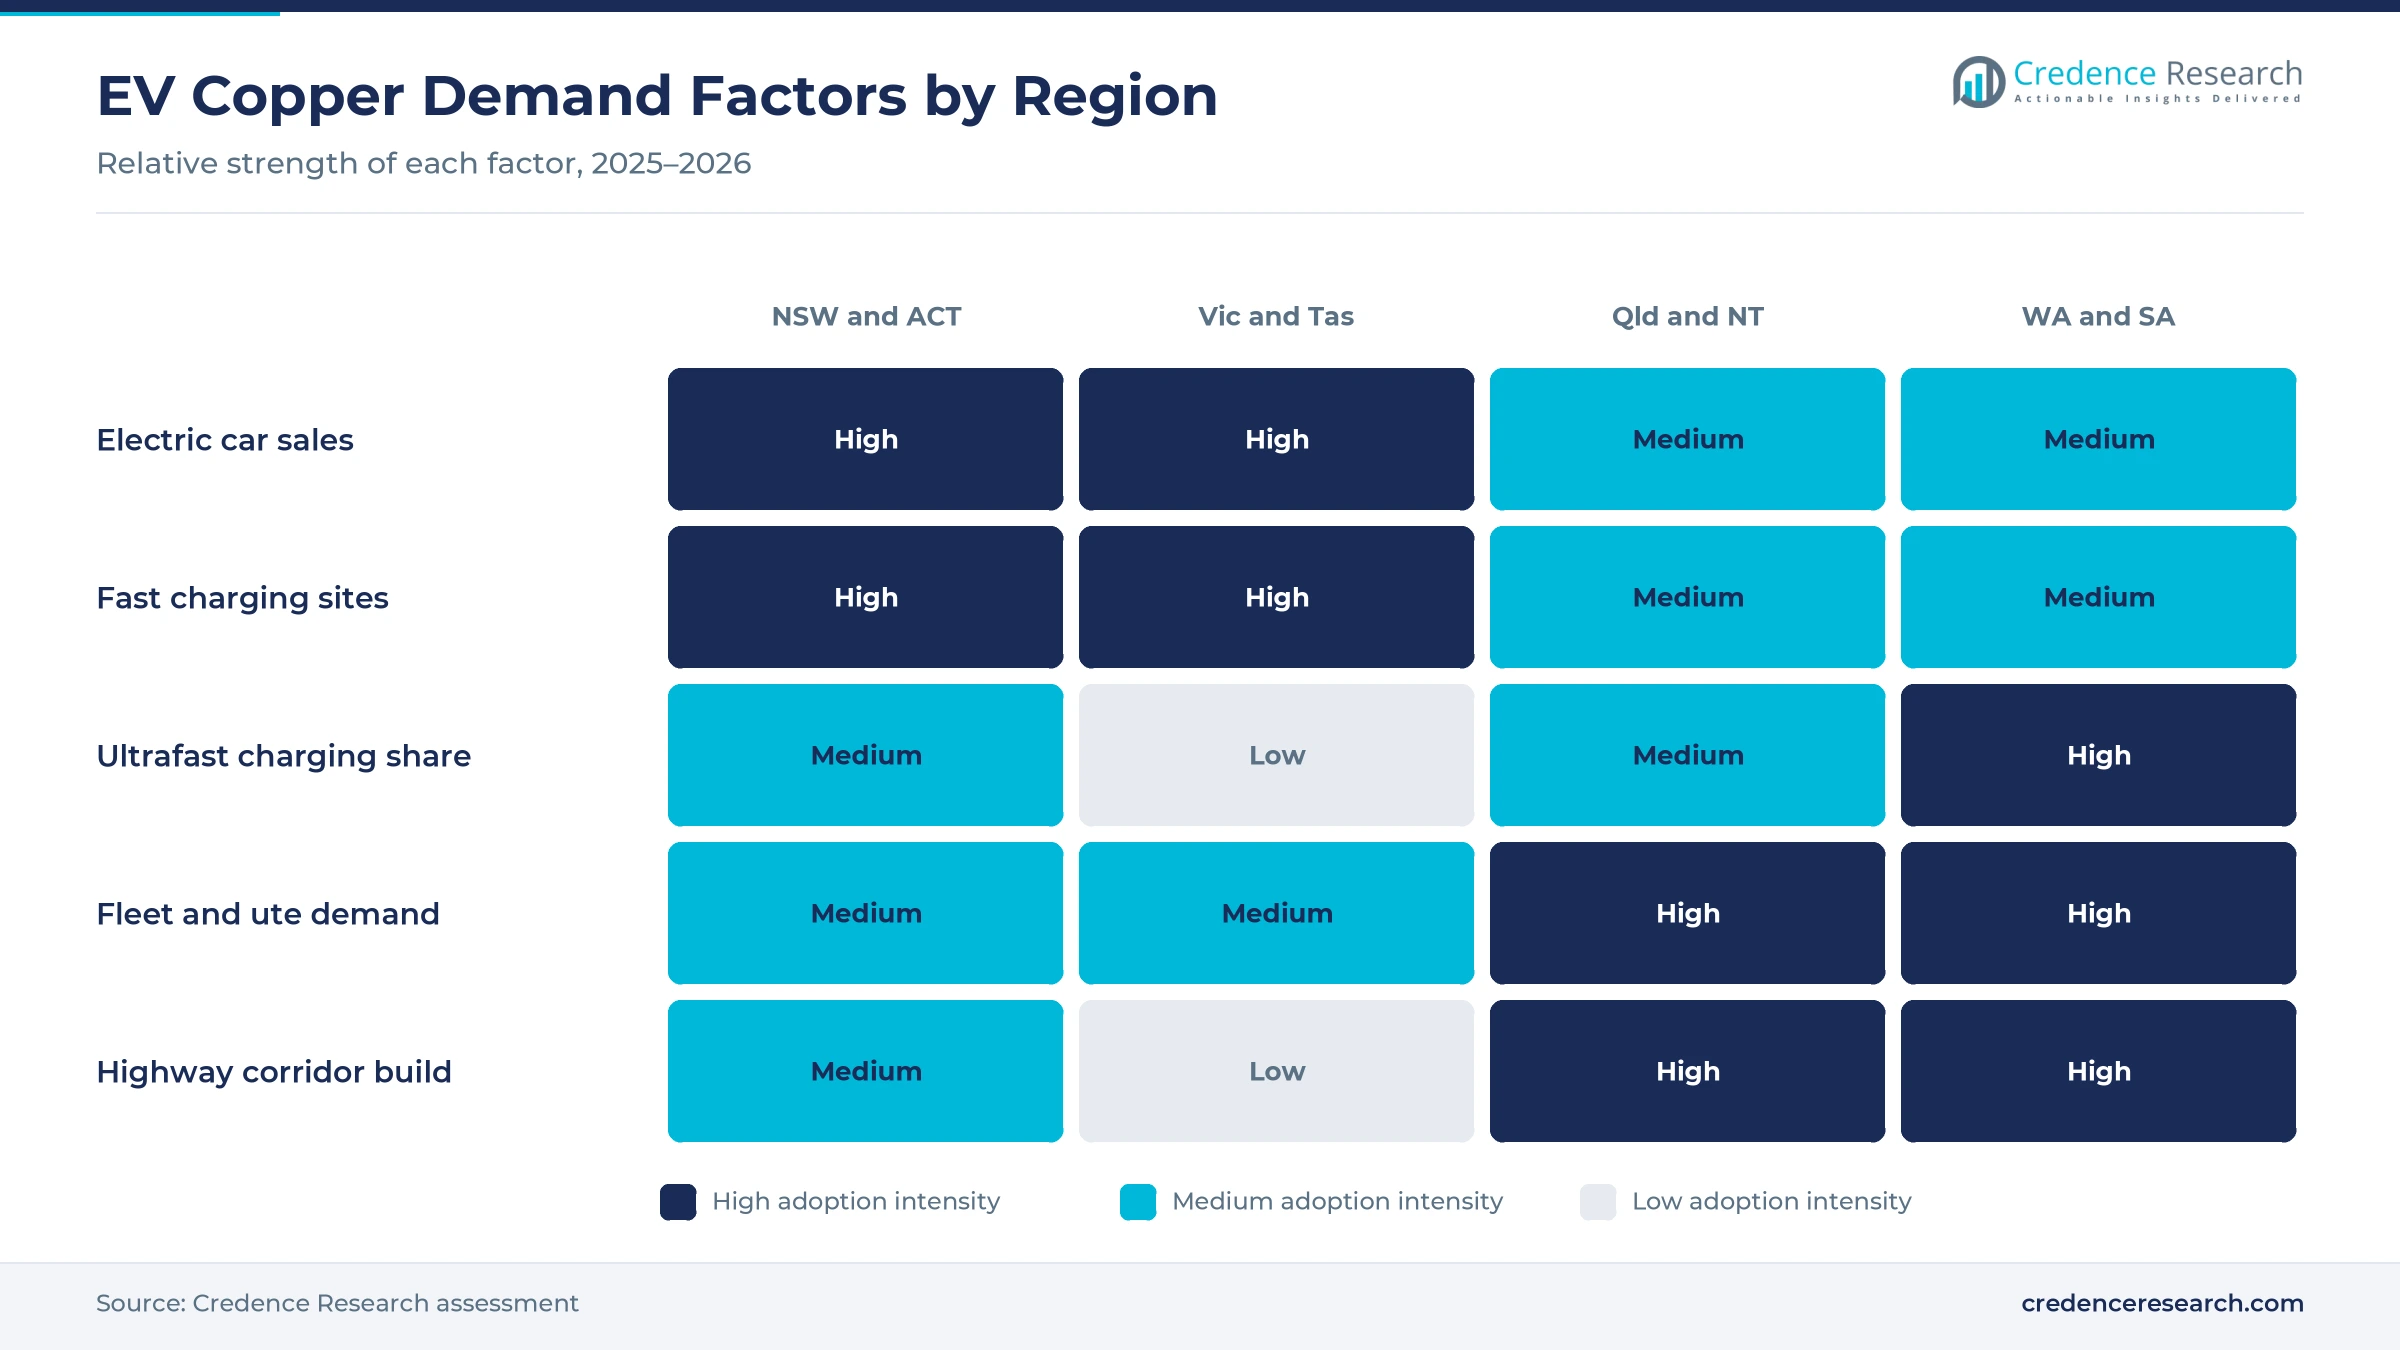
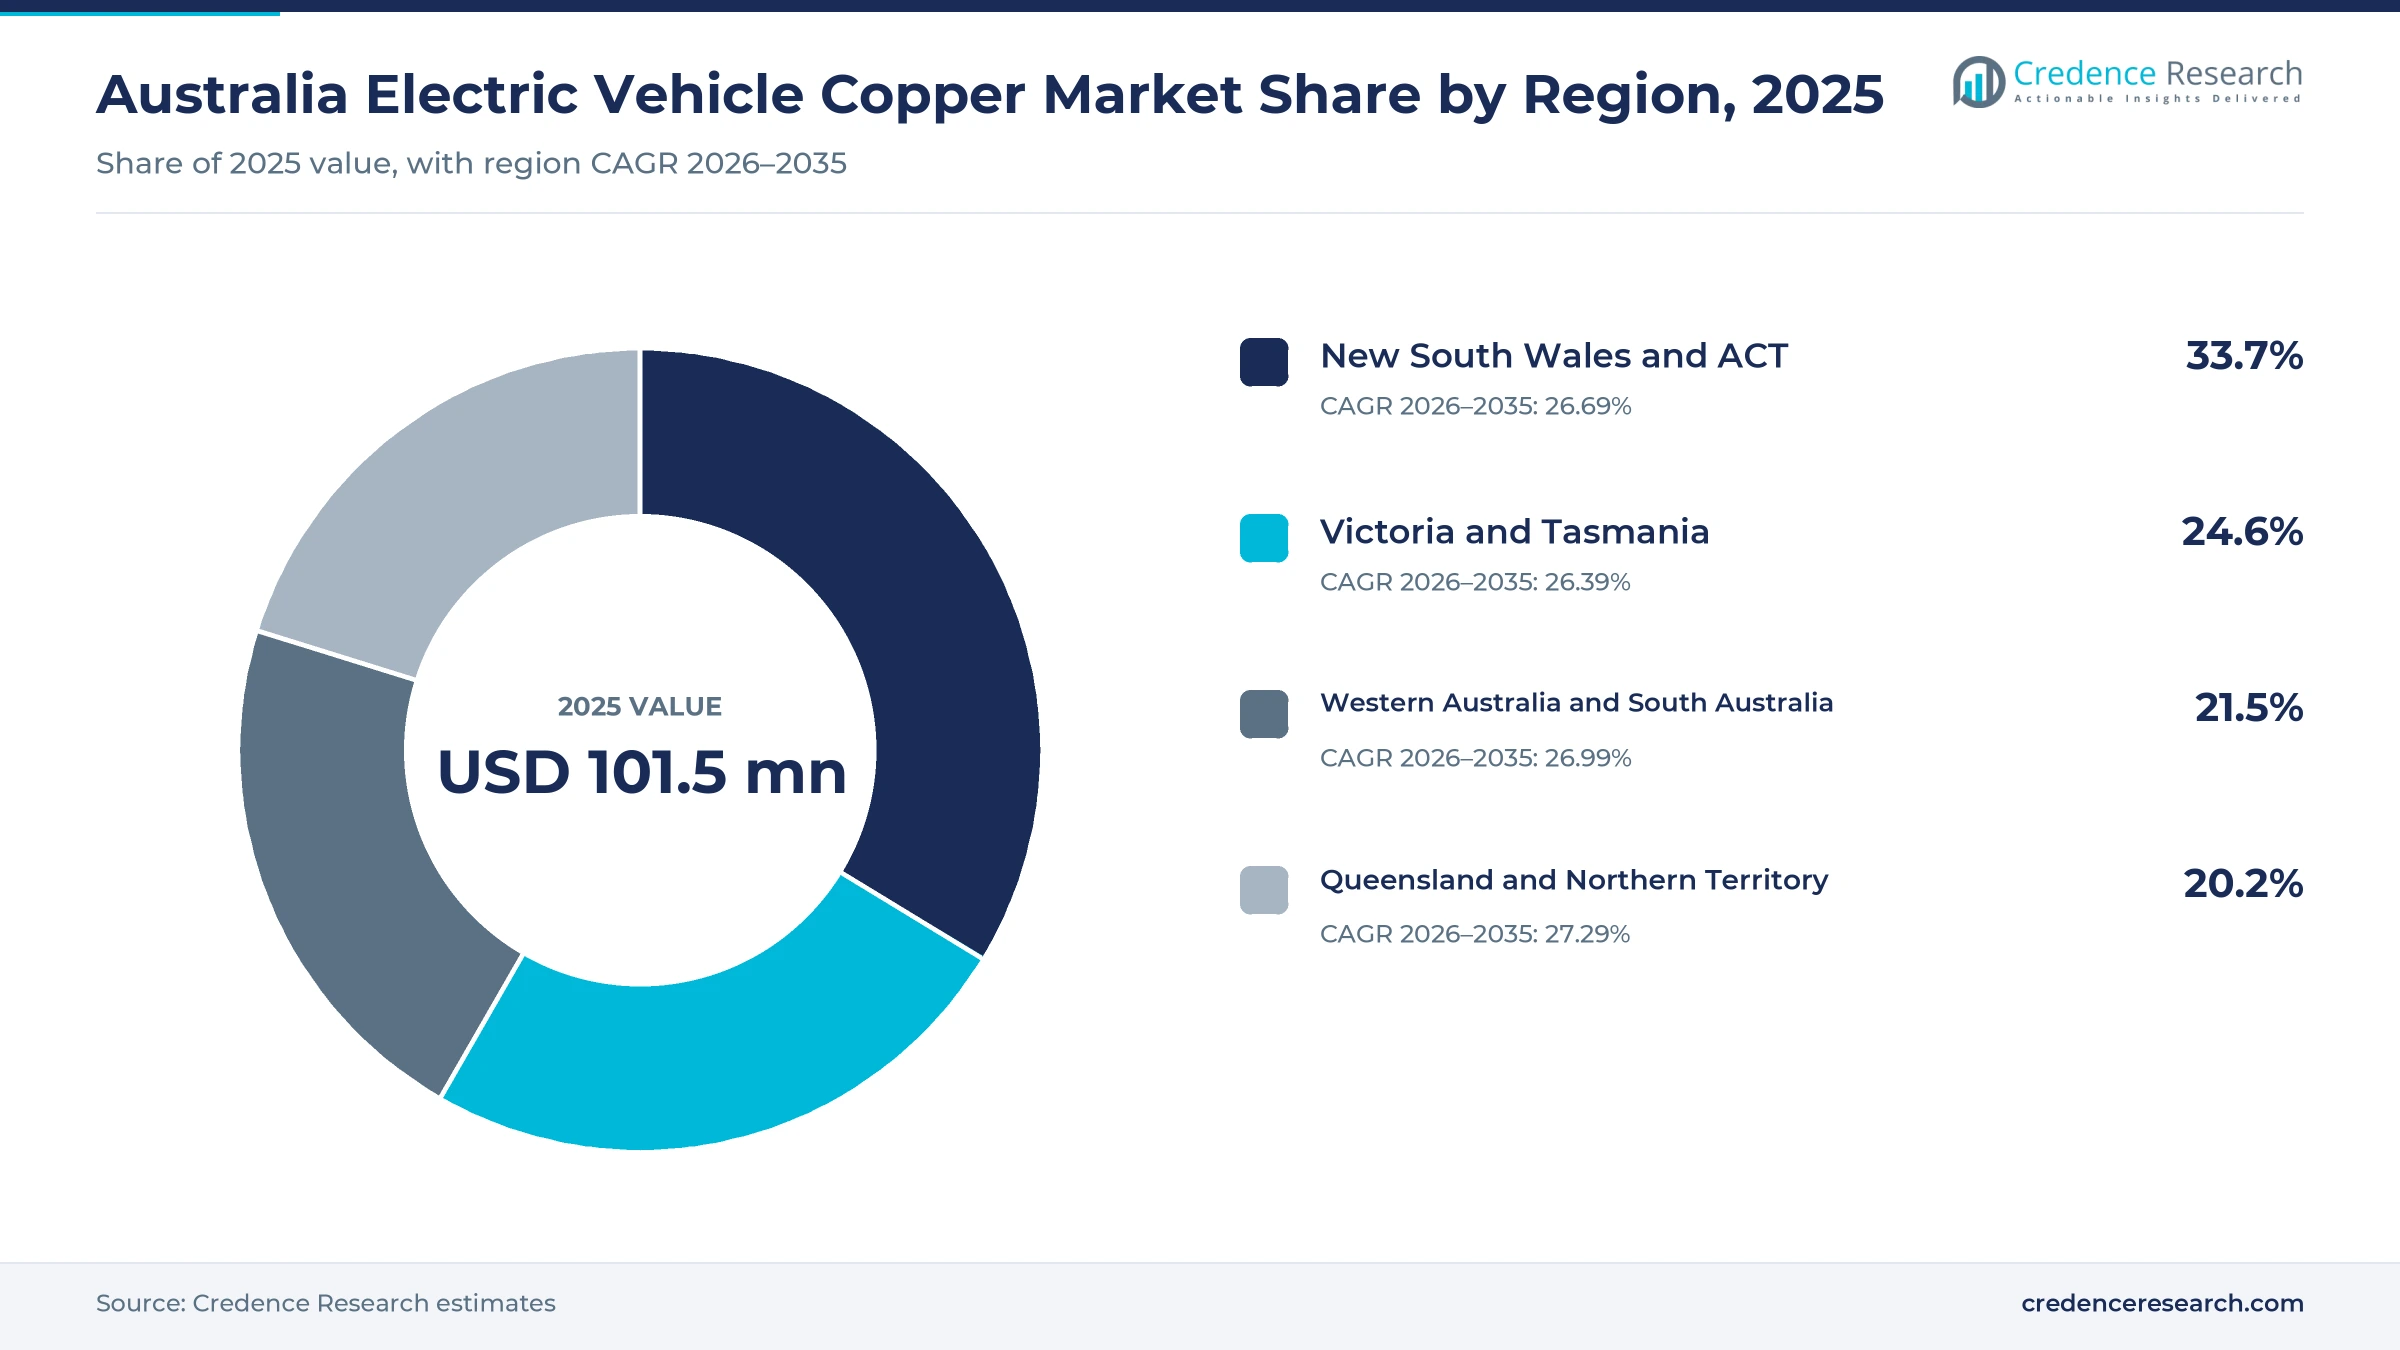
New South Wales and the ACT held a 33.7% share of 2025 value and grow at 26.69% a year, because Sydney and Canberra have the largest base of electric car buyers. New South Wales had 357 fast charging locations by mid-2025, including 143 ultrafast sites, while the ACT had 30 locations. As a result, the zone leads demand for both vehicle conductors and charging equipment.
How do Victoria and Tasmania support copper demand?
Victoria and Tasmania held a 24.6% share of 2025 value and grow at 26.39% a year, because Melbourne is a large market for electric cars and home chargers. Victoria had 311 fast charging locations by mid-2025, including 100 ultrafast sites, while Tasmania had 53 locations. In turn, this zone relies more on passenger cars than on fleet or mining vehicles.
What drives copper demand in Queensland and the NT?
Queensland and the Northern Territory held a 20.2% share of 2025 value and grow fastest at 27.29% a year, because charging corridors and fleets expand across long regional routes. Queensland had 235 fast charging locations by mid-2025, including 96 ultrafast sites. The Northern Territory had 16 locations, which leaves room for new highway sites. As a result, the zone adds charging copper faster than other regions.
Why do Western Australia and South Australia favor ultrafast sites?
Western Australia and South Australia held a 21.5% share of 2025 value and grow at 26.99% a year, because long distances push operators toward high-power chargers. South Australia had 136 fast charging locations by mid-2025, and 89 of them were ultrafast. Western Australia had 132 charging locations, including 70 ultrafast sites. In turn, the zone uses more copper per charging site than the national average.
Efficiency rules, tax changes and record EV sales
| Development | Status and market relevance |
|---|---|
| In January 2025, the New Vehicle Efficiency Standard took effect for new light vehicles sold in Australia. | Set falling emissions limits that favor plug-in models |
| In April 2025, plug-in hybrids lost eligibility for the fringe benefits tax exemption for electric cars. | Shifted fleet tax savings toward battery electric models |
| In July 2025, suppliers began earning credits and penalties under the efficiency standard. | Made emissions targets a direct cost for carmakers |
| In December 2025, electric vehicles took a record 16.7% of new car sales in Australia. | Confirms rising copper demand from new vehicles |
| In January 2026, BYD sold 1,108 Shark 6 plug-in utes as plug-in hybrid sales rose 170.5%. | Extends electrification into light commercial vehicles |
Conductors, thin foil and engineered parts carry current
- Conventional copper conductors form motor windings, low-voltage harnesses and high-voltage cables, which carry most of the copper in a battery electric car.
- Thin-foil battery conductors serve as the current collector for each anode, which makes foil thickness a key factor in pack weight and copper use.
- Engineered copper assemblies such as busbars and connectors link battery modules, inverters and charger cabinets in compact and heat-resistant layouts.
- High-power charging cables carry large currents from ultrafast cabinets to vehicles, which raises conductor size compared with home wall units.
Need a Custom Version of This Report?
Tailor the scope, geography, or segments to your exact requirements.
- Custom geography or segment scope
- Direct access to our analyst team
Carmakers compete on EV range that sets copper per vehicle
Competition among vehicle brands shapes copper demand, because each brand's mix of battery electric cars, plug-in hybrids and utes sets the conductor used per sale. Tesla led battery electric sales in 2025 with 28,856 vehicles, including 22,239 Model Y units. BYD sold about 24,303 battery electric vehicles across the Sealion 7, Atto 3, Seal and Dolphin, and it led January 2026 battery electric sales with 2,779 units. Kia sold 7,384 EV5 and EV3 units in 2025, while Geely sold 3,944 EX5 SUVs. MG4 sales fell 56.9% in 2025 as newer brands gained share. Brands compete on range, price, charging speed and towing, which pushes pack size, cable rating and copper content higher in each model cycle.
Which vehicle brands set copper demand?
| Company | Type | Role in the market |
|---|---|---|
| Tesla | Battery electric carmaker | Led 2025 battery electric sales with 28,856 vehicles |
| BYD | Battery electric and plug-in carmaker | Sold about 24,303 battery electric vehicles and launched the Shark 6 ute |
| Kia | Carmaker | Sold 7,384 EV5 and EV3 battery electric SUVs in 2025 |
| Geely Auto | Carmaker | Sold 3,944 EX5 battery electric SUVs in 2025 |
| MG Motor | Carmaker | Sells the MG4 battery electric hatch, whose sales fell 56.9% in 2025 |
Credence Research view on EV copper demand in Australia
Credence Research's view is that Australian electric vehicle copper demand will grow quickly because the efficiency standard keeps pushing suppliers toward plug-in models while charging networks spread. Wire and cable remain the largest product group, yet thin battery foil adds the fastest growth as pack sizes rise. Supply risk and aluminum substitution could raise costs for some buyers. Suppliers that secure refined metal, serve charging projects and support utes and fleets should gain the most share by 2035.
How the EV copper demand estimate was built
The report uses 2025 as the base year on a calendar basis, and market values come from the Credence Research model. That model combines published electric vehicle sales, charging location counts, copper content estimates per vehicle and charger, and government policy data. Segment splits and zone growth rates are Credence Research estimates, while zone shares follow the client-provided split. Sources used are government releases, industry association data, international agency publications and company sales data, and no interviews or surveys were used.
Tighter emissions limits keep copper use climbing to 2035
The Australia electric vehicle copper market is expected to reach USD 1.09 billion by 2035, a 26.81% CAGR during 2026–2035, as tighter emissions limits and wider charging access lift plug-in sales. Growth should be strongest in thin battery foil, light commercial mobility and Queensland and the Northern Territory, because these areas gain most from larger packs, plug-in utes and new highway sites. Price swings and slower uptake could slow some years, while falling emissions limits to 2029 should support demand through the forecast period.
Frequently Asked Questions
How big is the Australia electric vehicle copper market?
Which product type leads EV copper demand?
Which region leads the market?
How much copper does an electric car use?
How many electric vehicles were sold in Australia in 2025?
How does the New Vehicle Efficiency Standard affect demand?
Who are the leading companies in the market?
What are the main challenges for EV copper demand?
Table of Content
Chapter 1 Market Segmentation
- 1.1 Segmentation Framework
- 1.1.1 Product and Service Classification
- 1.1.2 Application and End-Use Classification
- 1.1.3 Technology and Solution Classification
- 1.1.4 Customer and Distribution Channel Classification
- 1.1.5 Geographic Segmentation
- 1.1.6 Market Segment Definitions and Boundaries
- 1.2 By Product Type
- 1.2.1 Wire and Cable
- 1.2.2 Foil and Sheet
- 1.2.3 Busbars and Connectors
- 1.3 By End-Use Industry
- 1.3.1 Passenger Mobility
- 1.3.2 Light Commercial Mobility
- 1.3.3 EV Charging Infrastructure
- 1.4 By Application
- 1.4.1 Battery Systems
- 1.4.2 Vehicle Electrical Systems
- 1.4.3 Charging Equipment
Chapter 2 Introduction
- 2.1 Report Objectives and Scope
- 2.2 Product Definition and Industry Terminology
- 2.3 Market Inclusions and Exclusions
- 2.4 Research Process
- 2.4.1 Primary Research and Expert Interviews
- 2.4.2 Secondary Research and Source Review
- 2.4.3 Top-Down and Bottom-Up Estimation
- 2.4.4 Data Triangulation and Verification
- 2.5 Market Size Measurement Basis
- 2.5.1 2025: USD 101.5 million → 2035: USD 1.09 billion
- 2.6 Historical and Forecast Reference Periods
- 2.6.1 Historical Period: 2018-2025
- 2.6.2 Base Year: 2025
- 2.6.3 Forecast Period: 2025-2035
- 2.7 Research Assumptions and Limitations
Chapter 3 Executive Summary
- 3.1 Market Snapshot and Key Findings
- 3.2 Base-Year Market Size, 2025
- 3.3 Forecast Market Size, 2035
- 3.4 Revenue and Volume Growth Outlook
- 3.5 Key Demand and Supply Indicators
- 3.6 Leading Market Segments
- 3.7 Fastest-Growing Market Opportunities
- 3.8 Regional Performance Highlights
- 3.9 Technology and Industry Transformation
- 3.10 Competitive Landscape Summary
- 3.11 Analyst View and Strategic Implications
Chapter 4 Australia Electric Vehicle Copper Market Trends and Developments
- 4.1 Historical Industry Development, 2018-2025
- 4.2 Recent Market Trends and Developments
- 4.3 Demand and Customer Behavior Trends
- 4.4 Technology and Product Innovation
- 4.5 Artificial Intelligence, Automation and Digitalization
- 4.6 Local Manufacturing and Supply Chain Realignment
- 4.7 Industry Partnerships, Mergers and Acquisitions
- 4.8 Sustainability and Circular Economy Developments
- 4.9 Government and Private Sector Investment Trends
- 4.10 Emerging Business Models and Commercialization
- 4.11 Industry Developments and Announcements
Chapter 5 Australia Electric Vehicle Copper Market Production, Supply and Demand Analysis
- 5.1 Demand Trend and Consumption Analysis, 2018-2025
- 5.2 Demand Forecast, 2025-2035
- 5.3 Production and Output Trend, 2018-2025
- 5.4 Production and Output Forecast, 2025-2035
- 5.5 Installed Capacity and Capacity Utilization
- 5.6 Company-Wise Production Plants and Statistics
- 5.6.1 Installed Production Capacity
- 5.6.2 Actual Production
- 5.6.3 Planned Capacity and Expansion Targets
- 5.7 Supply Chain Structure and Procurement Trends
- 5.8 Supply-Demand Gap and Bottlenecks
- 5.9 Import Dependence and Sourcing Structure
- 5.10 Contract Manufacturing and Outsourcing
- 5.11 Regional Supply and Demand Concentration
Chapter 6 Australia Electric Vehicle Copper Market Pricing Analysis
- 6.1 Pricing Structure and Measurement
- 6.2 Historical Pricing Trends, 2018-2025
- 6.3 Pricing Outlook, 2025-2035
- 6.4 Average Selling Price and Unit Economics
- 6.5 Pricing by Product and Market Segment
- 6.6 Geographic Pricing Differences
- 6.7 Key Input, Energy, Labor and Logistics Costs
- 6.8 Contract Pricing and Purchasing Models
- 6.9 Pricing Sensitivity and Competitive Positioning
- 6.10 Price, Margin and Profitability Implications
Chapter 7 Australia Electric Vehicle Copper Market Dynamics
- 7.1 Market Growth Drivers
- 7.1.1 Demand-Side Drivers
- 7.1.2 Technology and Innovation Drivers
- 7.1.3 Infrastructure and Investment Drivers
- 7.1.4 Regulatory and Policy Drivers
- 7.2 Market Restraints
- 7.2.1 Cost and Affordability Constraints
- 7.2.2 Technology and Adoption Barriers
- 7.2.3 Supply Chain and Operational Constraints
- 7.3 Market Challenges
- 7.3.1 Competitive Pressure and Margin Erosion
- 7.3.2 Skills, Infrastructure and Implementation Gaps
- 7.4 Emerging Market Opportunities
- 7.5 Market Dynamics Impact and Time-Horizon Assessment
Chapter 8 Australia Electric Vehicle Copper Value Chain Analysis
- 8.1 Industry Value Chain Overview
- 8.2 Upstream Suppliers and Critical Inputs
- 8.3 Technology and Component Providers
- 8.4 Manufacturing or Service Delivery
- 8.5 Distribution, Channel Partners and Integrators
- 8.6 Downstream Applications and End Users
- 8.7 Value Addition and Profit Pools
- 8.8 Vertical Integration and Outsourcing
- 8.9 Supplier Concentration and Risk
- 8.10 Supply Chain Localization and Resilience
Chapter 9 Australia Electric Vehicle Copper Market Regulations and Policies
- 9.1 Relevant Laws, Standards and Compliance Frameworks
- 9.2 Product, Service, Safety and Quality Requirements
- 9.3 Government Policies, Incentives and Subsidies
- 9.4 Imports, Exports and Trade Barriers
- 9.5 Public Procurement and Local Content Requirements
- 9.6 Environmental and Sustainability Compliance
- 9.7 Upcoming Policy Changes and Market Implications
Chapter 10 Australia Electric Vehicle Copper Market Hotspots and Opportunities
- 10.1 Market Opportunity Mapping and Growth Hotspots
- 10.2 High-Growth Applications and Customer Groups
- 10.3 Underserved Markets and White-Space Opportunities
- 10.4 Emerging Technology and Product Opportunities
- 10.5 New Capacity and Investment Hotspots
- 10.6 Market Entry and Expansion Opportunities
- 10.7 Distribution and Partnership Opportunities
- 10.8 Near-Term and Long-Term Commercial Potential
- 10.9 Opportunity Attractiveness and Execution Risks
Chapter 11 Australia Electric Vehicle Copper Market Outlook, 2025-2035
- 11.1 Market Size and Analysis
- 11.1.1 Revenue (Market Measurement: 2025: USD 101.5 million → 2035: USD 1.09 billion)
- 11.1.2 Market Volume and Quantity Sold
- 11.1.3 Historical Market Size, 2018-2025
- 11.1.4 Base-Year Market Size, 2025
- 11.2 Market Forecast, 2025-2035
- 11.2.1 Revenue Forecast to 2035
- 11.2.2 Volume Forecast to 2035
- 11.2.3 CAGR and Year-on-Year Growth
- 11.2.4 Incremental Revenue Opportunity
- 11.3 Forecast Assumptions and Scenario Analysis
- 11.3.1 Base-Case Forecast
- 11.3.2 Optimistic and Conservative Scenarios
- 11.3.3 Technology, Pricing and Policy Sensitivities
- 11.4 Market Attractiveness and Growth Outlook
Chapter 12 Australia Electric Vehicle Copper Market Segmentation and Outlook
- 12.1 Segmentation Summary and Market Shares, 2025
- 12.2 Largest and Fastest-Growing Segments
- 12.3 By Product Type - Market Size and Forecast, 2025-2035
- 12.3.1 Segment Definition and Scope
- 12.3.2 Historical Market Size, 2018-2025
- 12.3.3 Revenue Forecast, 2025-2035
- 12.3.4 Volume Forecast, 2025-2035
- 12.3.5 Base-Year Market Share, 2025
- 12.3.6 Segment CAGR and Growth Drivers
- 12.3.7 Subsegment Market Size and Forecast
- 12.3.7.1 Wire and Cable
- 12.3.7.2 Foil and Sheet
- 12.3.7.3 Busbars and Connectors
- 12.3.8 Subsegment Pricing and Adoption Trends
- 12.3.9 Leading Suppliers and Competition
- 12.3.10 Regional Demand and Opportunities
- 12.4 By End-Use Industry - Market Size and Forecast, 2025-2035
- 12.4.1 Segment Definition and Scope
- 12.4.2 Historical Market Size, 2018-2025
- 12.4.3 Revenue Forecast, 2025-2035
- 12.4.4 Volume Forecast, 2025-2035
- 12.4.5 Base-Year Market Share, 2025
- 12.4.6 Segment CAGR and Growth Drivers
- 12.4.7 Subsegment Market Size and Forecast
- 12.4.7.1 Passenger Mobility
- 12.4.7.2 Light Commercial Mobility
- 12.4.7.3 EV Charging Infrastructure
- 12.4.8 Subsegment Pricing and Adoption Trends
- 12.4.9 Leading Suppliers and Competition
- 12.4.10 Regional Demand and Opportunities
- 12.5 By Application - Market Size and Forecast, 2025-2035
- 12.5.1 Segment Definition and Scope
- 12.5.2 Historical Market Size, 2018-2025
- 12.5.3 Revenue Forecast, 2025-2035
- 12.5.4 Volume Forecast, 2025-2035
- 12.5.5 Base-Year Market Share, 2025
- 12.5.6 Segment CAGR and Growth Drivers
- 12.5.7 Subsegment Market Size and Forecast
- 12.5.7.1 Battery Systems
- 12.5.7.2 Vehicle Electrical Systems
- 12.5.7.3 Charging Equipment
- 12.5.8 Subsegment Pricing and Adoption Trends
- 12.5.9 Leading Suppliers and Competition
- 12.5.10 Regional Demand and Opportunities
- 12.6 Segment Growth Comparison
- 12.7 Segment Attractiveness and Priority Matrix
Chapter 13 Australia Electric Vehicle Copper End-Use and Application Market Outlook
- 13.1 End-Use Industry and Customer Demand Structure
- 13.2 Leading Applications and Customer Groups
- 13.3 End-Use Market Size, Share and Forecast
- 13.4 Major End-Use Industry Deep Dives
- 13.4.1 Customer Requirements and Use Cases
- 13.4.2 Demand and Replacement Cycles
- 13.4.3 Technical and Regulatory Considerations
- 13.4.4 Purchasing and Procurement Models
- 13.4.5 Leading Vendors and Distribution Channels
- 13.4.6 Forecast and Commercial Opportunities
- 13.5 Emerging Applications and Cross-Segment Demand
- 13.6 End-Use Industry Investment Priorities
Chapter 14 Australia Electric Vehicle Copper Geographic Market Outlook, 2025-2035
- 14.1 Domestic Market Distribution and Demand Clusters
- 14.2 State- or Province-Wise Market Size and Forecast, 2025-2035
- 14.3 City and Metropolitan Market Outlook
- 14.4 Industrial, Manufacturing and Commercial Clusters
- 14.5 Geographic Concentration of Key End Users
- 14.6 Local Pricing and Purchasing Differences
- 14.7 Domestic Production Facilities and Capacity Map
- 14.8 Local Infrastructure and Project Pipeline
- 14.9 State-Level Policy and Incentive Differences
- 14.10 Subnational Investment Hotspots and Opportunities
- 14.11 Distribution and Logistics Networks
- 14.12 Domestic Competitive Footprint
Chapter 15 Australia Electric Vehicle Copper Technology, Innovation and Sustainability Outlook
- 15.1 Technology Landscape and Maturity
- 15.2 Product, Process and Service Innovation
- 15.3 AI, Automation and Digital Tools in the Industry
- 15.4 Technology Adoption and Performance Benchmarking
- 15.5 Innovation Pipeline and R&D Investment
- 15.6 Patent and Intellectual Property Trends
- 15.7 Energy Efficiency and Resource Management
- 15.8 Sustainability, Recycling and Circularity
- 15.9 Technology Roadmap, 2025-2035
- 15.10 Risks of Obsolescence and Technology Substitution
Chapter 16 Australia Electric Vehicle Copper Market Key Strategic Imperatives
- 16.1 Growth and Market Entry Priorities
- 16.2 High-Return Products and Segments
- 16.3 Pricing, Profitability and Cost Optimization
- 16.4 Technology Investment and Product Differentiation
- 16.5 Supply Chain Localization and Resilience
- 16.6 Distribution and Customer Acquisition
- 16.7 Partnership, Acquisition and Capacity Strategy
- 16.8 Regional Expansion Priorities
- 16.9 Short-, Medium- and Long-Term Actions
Chapter 17 Competition Outlook
- 17.1 Industry Competition Characteristics
- 17.2 Market Structure and Concentration
- 17.3 Market Share and Competitive Positioning, 2025
- 17.4 Company-Wise Revenue and Product Benchmarking
- 17.5 Production and Service Capacity Benchmarking
- 17.6 Technology, Pricing and Differentiation
- 17.7 Regional Footprint and Distribution Strength
- 17.8 Mergers, Acquisitions and Strategic Alliances
- 17.9 New Entrants and Competitive Threats
- 17.10 Porter's Five Forces and Industry Attractiveness
- 17.11 Competitive Outlook, 2025-2035
Chapter 18 Company Profiles
- 18.1 Company Coverage and Selection Criteria
- 18.2 Tesla
- 18.2.1 Business Description
- 18.2.2 Company Ownership and Geographic Presence
- 18.2.3 Product and Service Portfolio
- 18.2.4 Manufacturing and Operating Footprint
- 18.2.5 Production Capacity and Expansion Plans
- 18.2.6 Financial Performance and Investment
- 18.2.7 Market Share and Competitive Position
- 18.2.8 Technology and Innovation Capabilities
- 18.2.9 Strategic Alliances or Partnerships
- 18.2.10 Recent Developments
- 18.2.11 Growth Strategy and Outlook
- 18.3 BYD
- 18.4 Kia
- 18.5 MG Motor
- 18.6 Geely Auto
- 18.7 Polestar
- 18.8 Jaecoo
- 18.9 Hyundai
- 18.10 BMW Group
- 18.11 Volvo Cars
- 18.12 Other Relevant Market Participants
Note: Every listed company is profiled on the structure shown under the first company. The company list is preliminary and may change based on research findings, market developments, data availability and client requirements.
Chapter 19 Disclaimer
- 19.1 Research and Forecast Disclaimer
- 19.2 Data Source and Estimation Limitations
Note: The depth of individual sections depends on data availability for this market. Volume, capacity, trade and other unit-based metrics are included where applicable.

