
Record kills and exports keep meat cold chains busy
The Australia cold chain and meat market was valued at USD 5.19 billion in 2025 and is projected to increase from USD 5.41 billion in 2026 to USD 7.70 billion by 2035, registering a CAGR of 3.99% during 2026–2035. Demand comes from beef, lamb, pork and chicken processors that chill carcasses within hours of slaughter, from exporters that freeze and containerize product for Asian and U.S. buyers, and from supermarket and foodservice distributors that restock chilled meat every day. New South Wales and the Australian Capital Territory held the largest regional share, 33.7% in 2025, because Sydney concentrates the largest consumer base and several large freezer stores. Queensland and the Northern Territory form the fastest-growing region at 4.49% a year, as the state hosts most of the national beef processing base. Storage operators are opening automated freezer capacity in western Sydney, while processors are expanding chillers and cold rooms at plants in Queensland and Victoria.
Which meat cold chain services does the estimate count?
The estimate measures revenue from refrigerated storage, refrigerated transport and value-added cold chain services used for beef and veal, sheep meat, poultry and pork in Australia. It covers chilled and frozen warehousing, blast freezing, linehaul and urban delivery, port container handling, repacking, labeling and inventory services billed to processors, distributors and specialist shippers.
The estimate excludes the value of the meat itself, the sale of refrigerated trucks and cold room equipment, and in-house costs that are not billed to customers. The value chain runs from farms and feedlots through processing plants and third-party cold stores to supermarkets, foodservice outlets and export terminals.
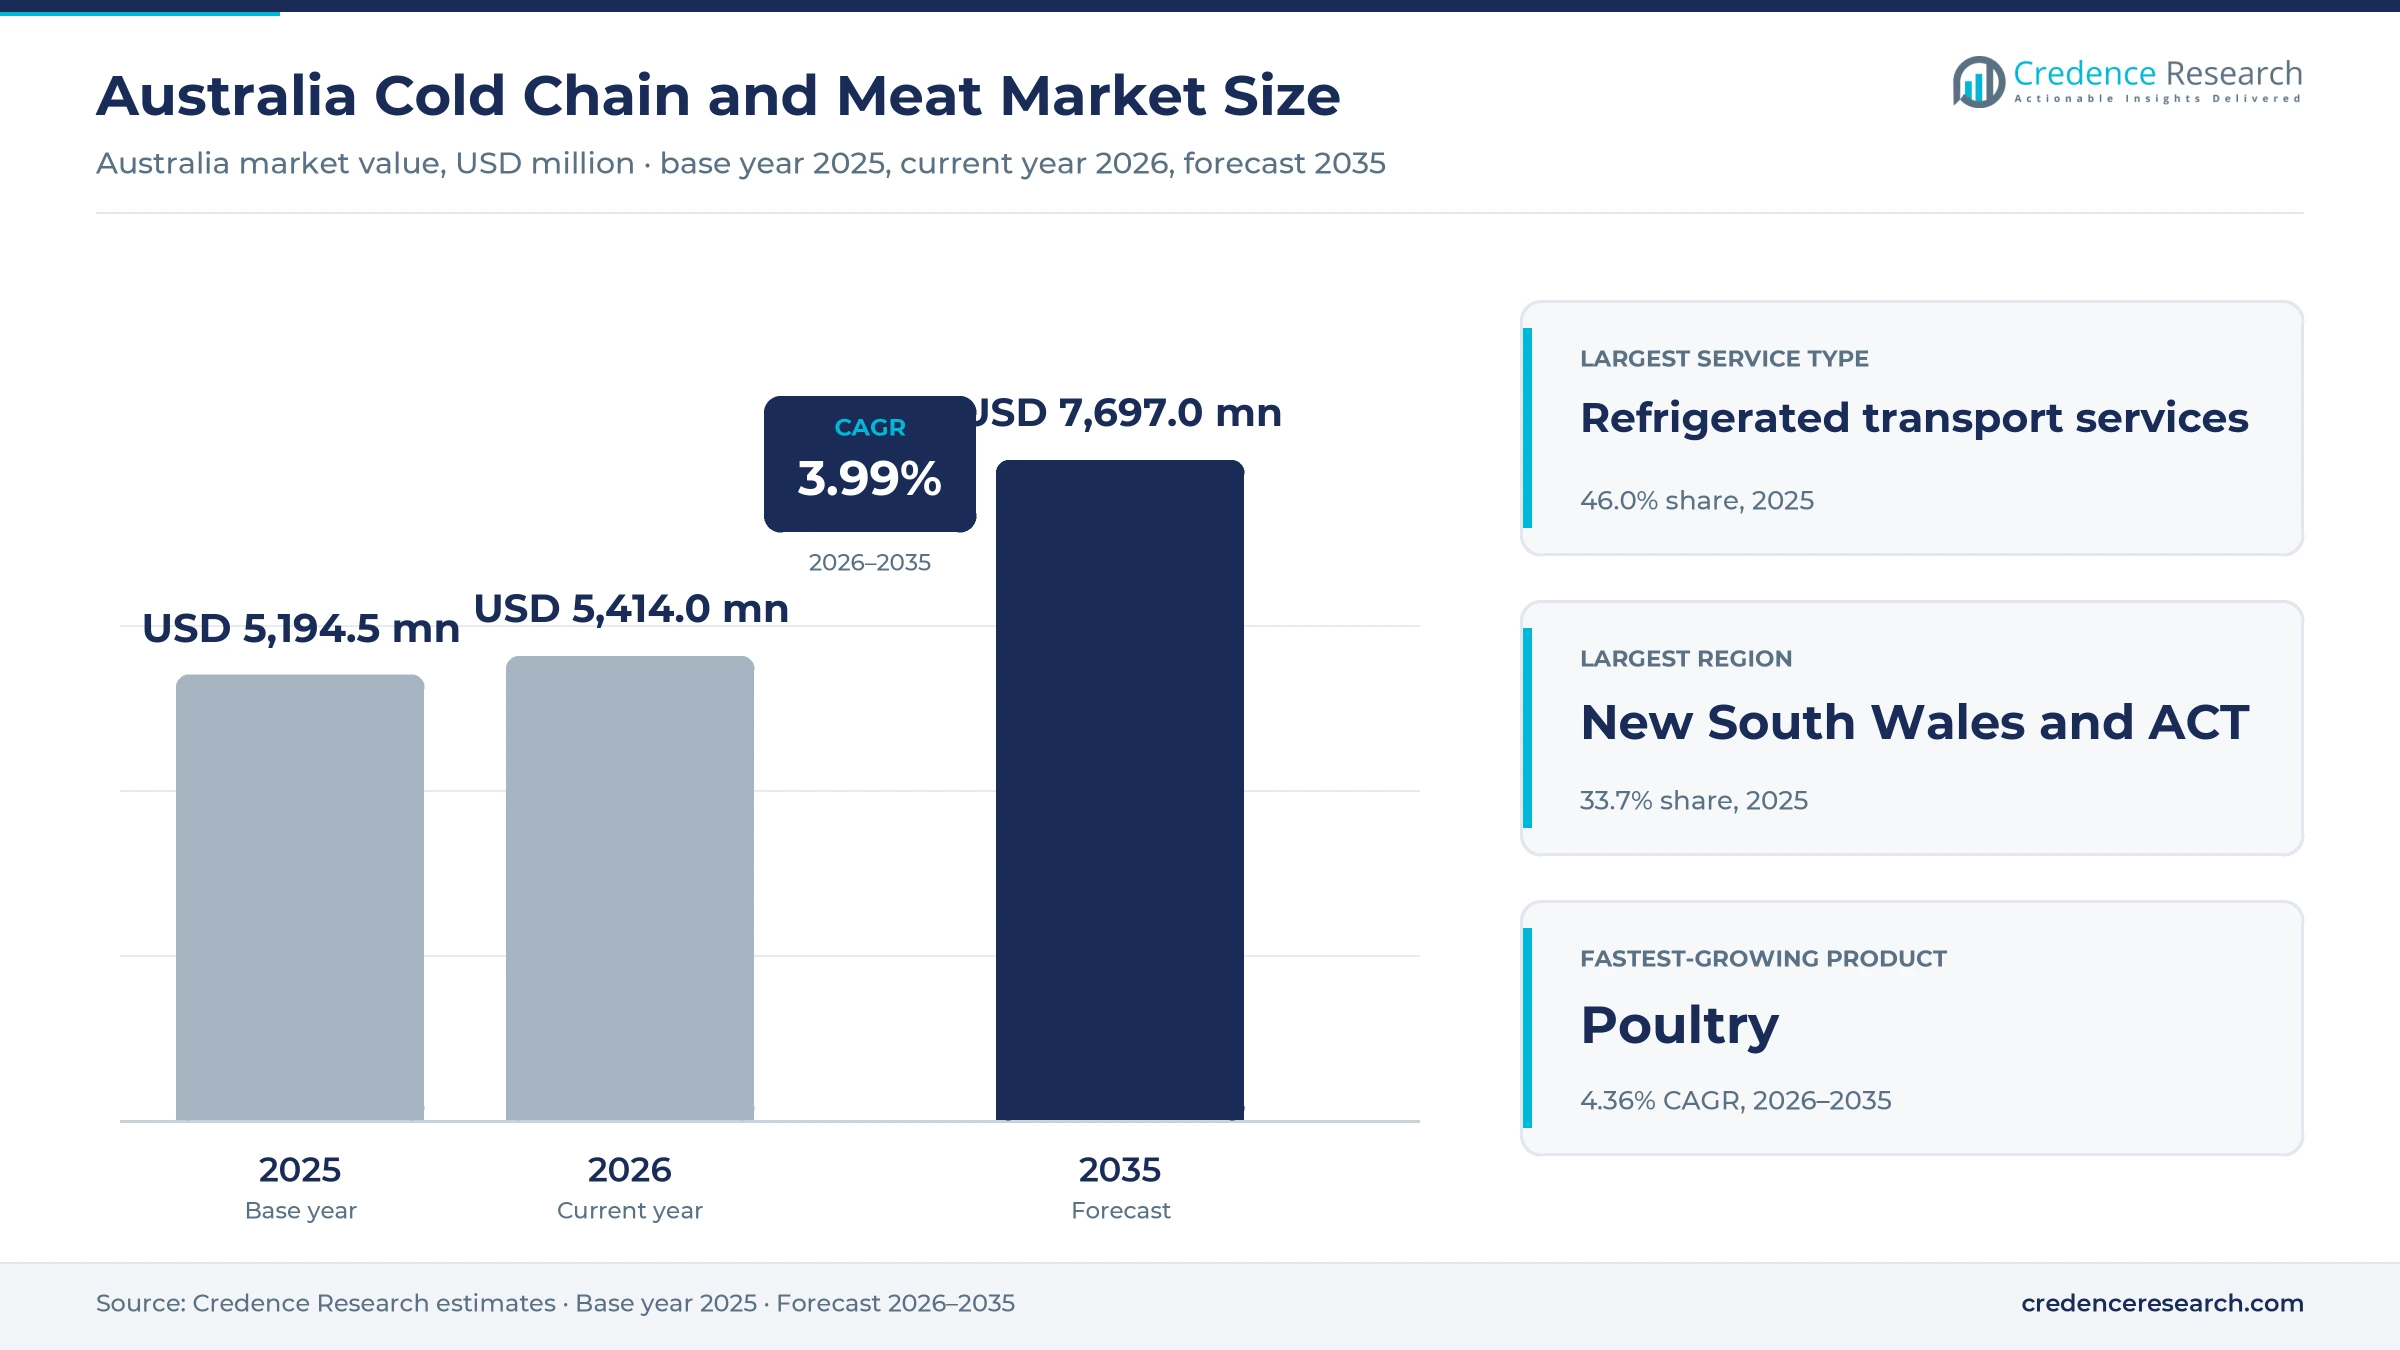
Australia Cold Chain and Meat Market Insights
- The Australia cold chain and meat market was valued at USD 5.19 billion in 2025 and is projected to reach USD 7.70 billion by 2035, at a 3.99% CAGR during 2026–2035.
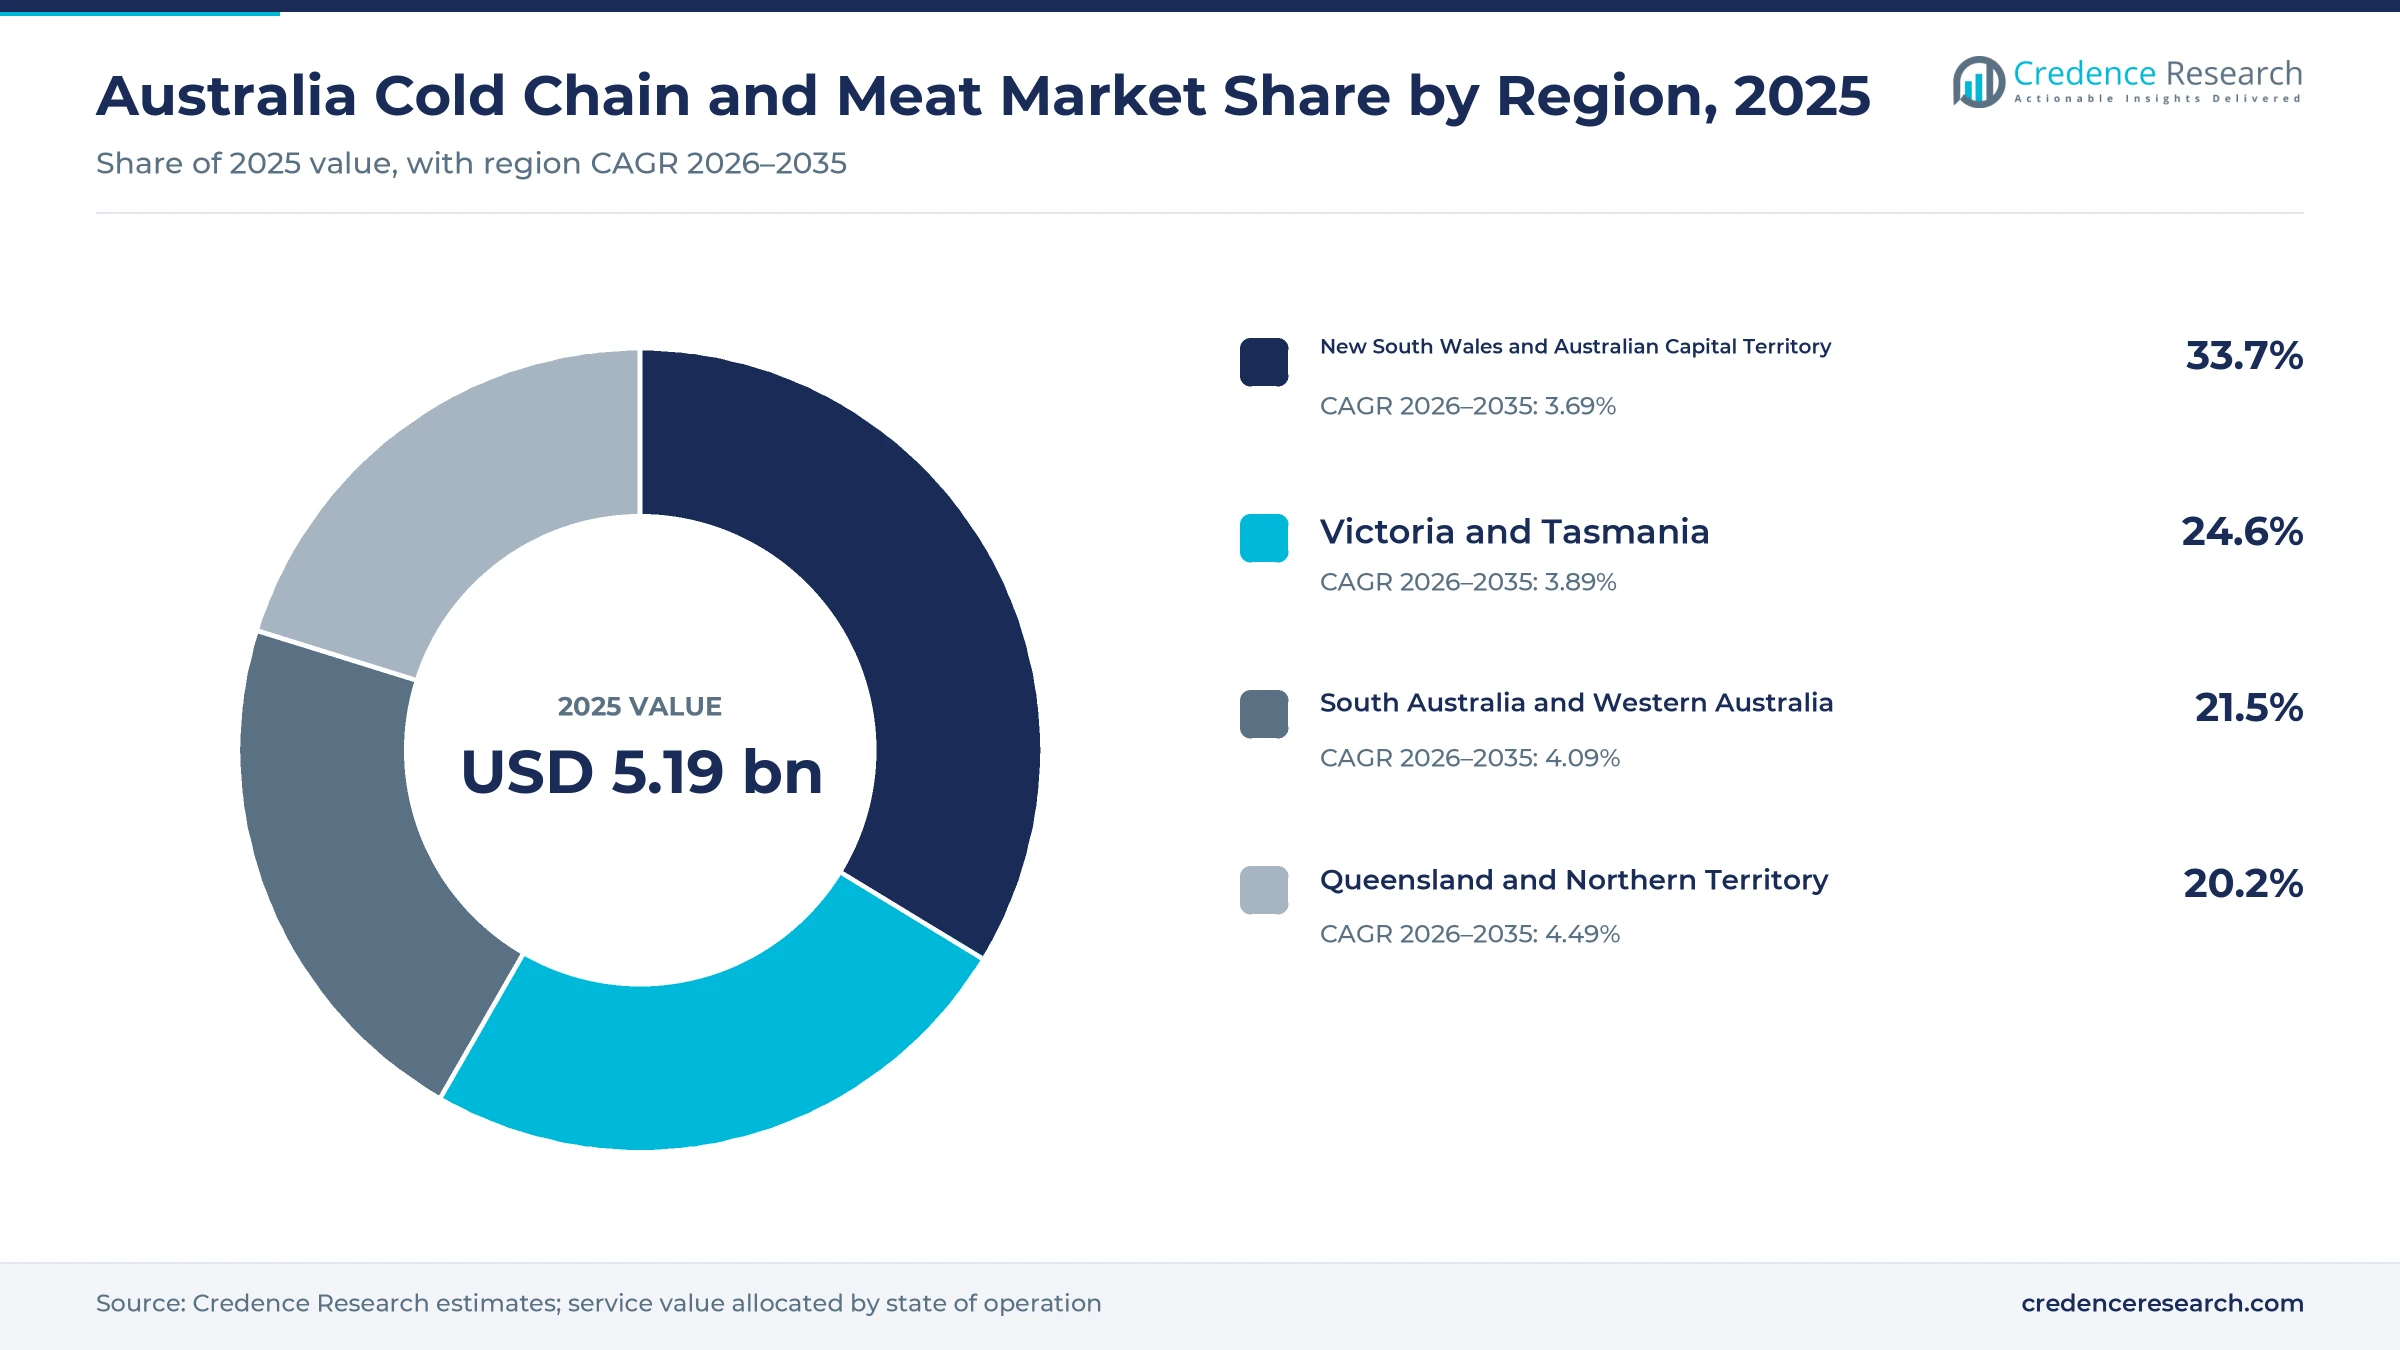
- New South Wales and the Australian Capital Territory held a 33.7% share of 2025 value, led by Sydney freezer stores and grocery demand.
- Beef and veal led product types with a 47.0% share of 2025 value, because beef dominates national slaughter and export volume.
- Australian cattle slaughter reached 9.28 million head in 2025, the highest since 1978, which pushed more carcasses through chillers and freezers.
- Lineage acquired Fremantle City Coldstores in January 2025, adding more than 8,000 pallet positions for meat and seafood near Fremantle Port.
Transport leads while value-added services grow fastest
Why does refrigerated transport lead service value?
Based on service type, the market is categorized into refrigerated storage services, refrigerated transport services and value-added cold chain services. Refrigerated Transport Services led with a 46.0% share of 2025 value, because meat moves long distances between plants, ports and stores. Value-Added Cold Chain Services grow fastest at 4.86% a year, as export buyers ask for repacking, labeling and documented temperature records.
How does beef keep the largest product share?
Based on product type, the market is categorized into beef and veal, sheep meat, poultry and pork. Beef and Veal led with a 47.0% share of 2025 value, because record beef production and exports need the most chilled and frozen handling. Poultry grows fastest at 4.36% a year, as large automated chicken plants raise volumes for supermarket and foodservice distribution.
Why are export-linked flows growing fastest?
Based on shipment flow, the market is categorized into domestic distribution, export-linked logistics and import-linked logistics. Domestic Distribution led with a 54.0% share of 2025 value, because supermarkets and foodservice outlets need daily chilled deliveries. Export-Linked Logistics grows fastest at 4.38% a year, as record beef and mutton exports need more freezing, storage and container loading.
Which customers buy the most cold chain services?
Based on customer type, the market is categorized into food producers and processors, retail and foodservice distributors, and healthcare and specialist shippers. Food Producers and Processors led with a 52.0% share of 2025 value, because meat plants buy freezing and export storage in large volumes. Healthcare and Specialist Shippers grow fastest at 5.17% a year from a smaller base, as shared stores add tightly controlled rooms.
| Segment Group | Leading Sub-segment | Share, 2025 | Fastest-growing Sub-segment | CAGR, 2026–2035 |
|---|---|---|---|---|
| By Service Type | Refrigerated Transport Services | 46.0% | Value-Added Cold Chain Services | 4.86% |
| By Product Type | Beef and Veal | 47.0% | Poultry | 4.36% |
| By Shipment Flow | Domestic Distribution | 54.0% | Export-Linked Logistics | 4.38% |
| By Customer Type | Food Producers and Processors | 52.0% | Healthcare and Specialist Shippers | 5.17% |
Request a Free Sample
Fill in your details and we'll send you a free sample report.
- Sample data tables & charts
- Research methodology
Exports, new capacity and compliance lift service demand
How do export volumes and new destinations lift demand?
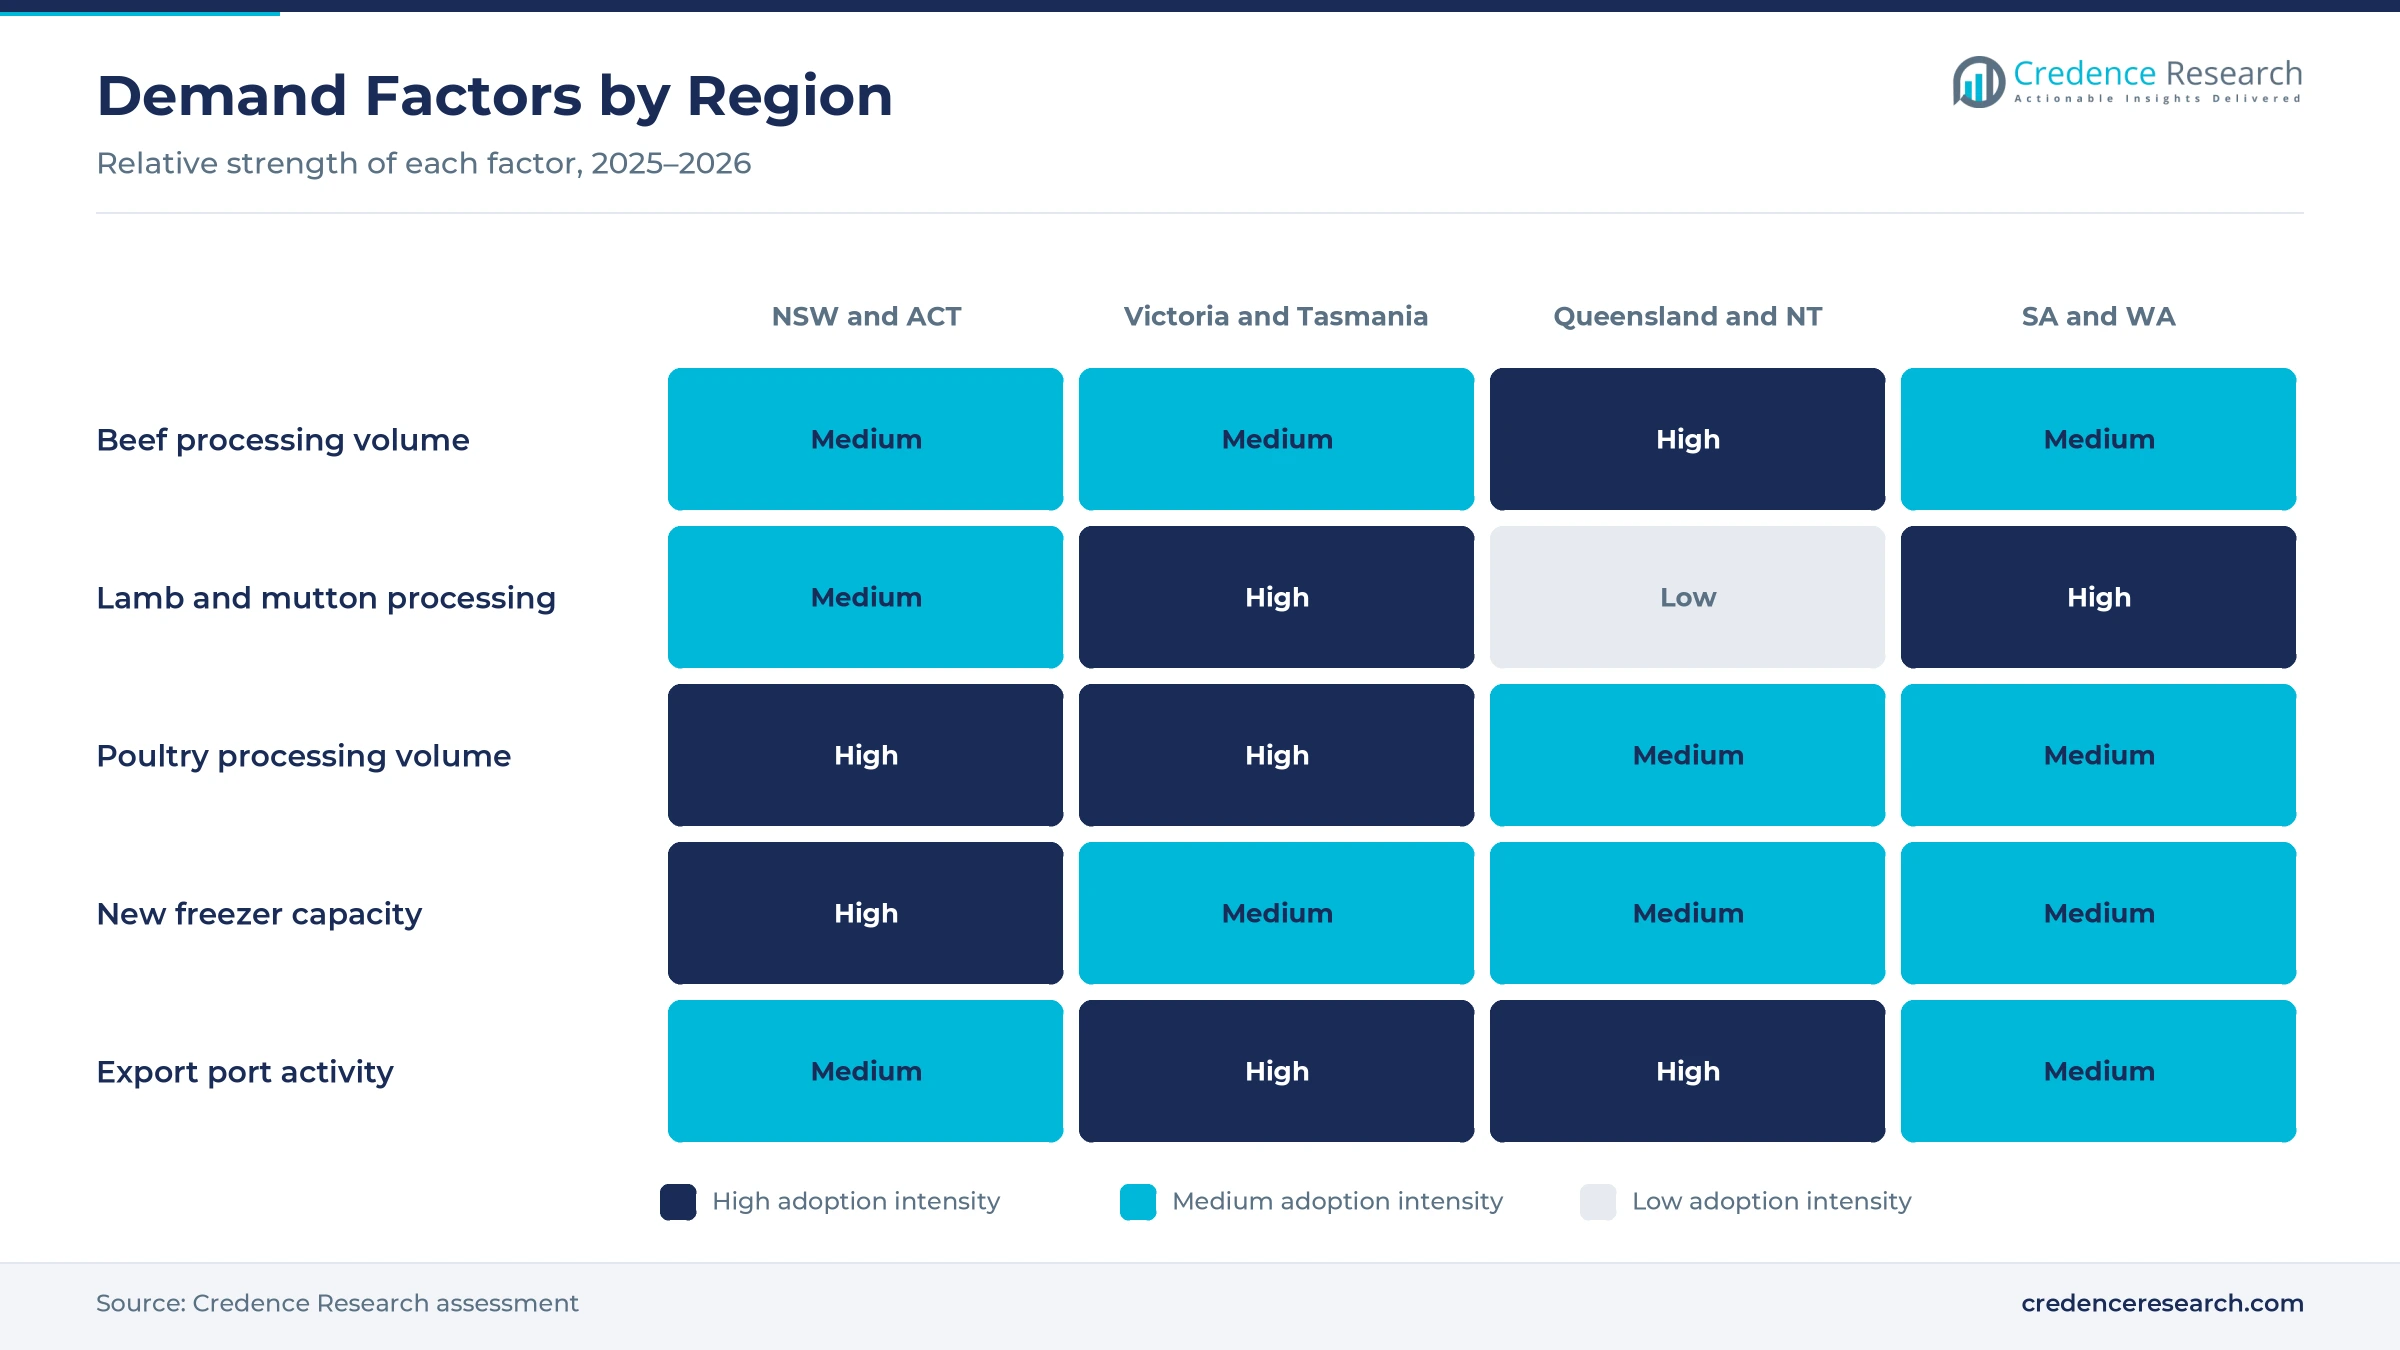
Export growth now spreads across more buyers, which keeps chilled and frozen meat moving through cold stores and port terminals all year. Australian beef exports reached a record 1,545,759 metric tons in calendar 2025, according to Beef Central, with the United States taking 453,305 metric tons and mainland China 272,939 metric tons. Japan took 257,378 metric tons and South Korea 221,350 metric tons, so no single market dominated the year. Meat & Livestock Australia also reported record mutton exports of 256,104 metric tons in fiscal 2024-25. This wider spread of buyers lets processors redirect product when one market slows, which keeps storage turning over. As a result, export-linked logistics grows at 4.38% a year, the fastest shipment flow.
Why is contracted capacity expansion adding storage?
Processors and storage operators are committing capital to new chilled and frozen space, often tied to long customer contracts. In September 2023, JBS announced an A$77 million investment at its Dinmore plant in Queensland, including expanded chiller capacity and a second shift with more than 500 new jobs. The Dinmore site handles about 10% of national beef processing capacity, so its chillers shape downstream freezing and loading. Americold announced a A$55 million freezer facility at Prospect in western Sydney in the fourth quarter of 2024, with customer access from January 2026. NewCold is also building an automated warehouse in western Sydney that is scheduled to open in 2026. In turn, operators invest in warehouse automation to raise pallet density on expensive urban land.
How do compliance rules raise service intensity?
Export meat must move under government-approved arrangements, which adds inspection, documentation and temperature records to every load. The Export Control (Meat and Meat Products) Rules 2021 began on March 28, 2021, and their approved arrangement conditions cover preparation, transportation, traceability and integrity, according to the Department of Agriculture, Fisheries and Forestry. On Dec. 3, 2024, the federal government announced that China had lifted the final suspensions on two Queensland meat establishments. The same release noted that Australia exported more than 70% of its agricultural, fisheries and forestry production to 169 markets in 2023-24. Each new market approval brings its own labeling, sampling and storage checks. As a result, value-added cold chain services grow at 4.86% a year, the fastest service type.
Why does record slaughter lift chiller throughput?
Record livestock turnoff is pushing more carcasses through chillers, boning rooms and freezers than at any time in decades. Cattle slaughter reached 9.28 million head in 2025, up 12% and the highest since 1978, while beef production hit a record 2.87 million metric tons, according to Meat & Livestock Australia. The Australian Bureau of Statistics reported 727,921 metric tons of beef and 391,018 metric tons of chicken meat in the December 2025 quarter on a seasonally adjusted basis. Lamb production also rose 11.9% over that quarter to 146,968 metric tons. Because most of this meat is chilled within hours of slaughter, storage demand tracks kill volumes closely. In turn, beef and veal held 47.0% of 2025 value, the largest product share.
Automated poultry plants and feedlots reshape meat flows
Why are automated poultry plants reshaping storage?
Poultry processors are moving volume into larger automated plants with their own cold storage, which changes what they buy from third parties. In September 2026, Food & Drink Business reported that Baiada had opened a Tamworth plant handling about 1.5 million chickens a week, with approval to reach 3 million on a second line. The plant includes automated cold storage and a three-stage chilling system that combines immersion, shock and air chilling. Inghams reported core poultry volume of 461.2 thousand metric tons in fiscal 2025 and raised its syndicated facilities by A$200 million to fund operations and automation programs. As a result, poultry grows at 4.36% a year, the fastest product type, as integrated plants add processing lines and frozen transport links.
How is the shift to feedlot-finished cattle changing flows?
More cattle are finished on grain before slaughter, which produces steadier supply and more chilled export cuts for premium buyers. In September 2025, InDaily reported that Thomas Foods International plans an A$22 million expansion of its Southern Cross Feedlot at Tintinara, lifting capacity from 27,000 to 38,000 standard cattle units. Those cattle are processed at the company's Murray Bridge plant in South Australia. In March 2026, Farm Online reported that NH Foods Australia was looking to expand its Texas feedlot in Queensland by 5,000 head. Grainfed beef exports reached 39,886 metric tons in June 2025, up 29%, according to Meat & Livestock Australia. In turn, Asian and U.S. buyers of premium beef lift demand for chilled container handling.
Can the Western Australian gateway add new capacity?
Western Australia offers room for added capacity, because its population and its Asian export links are both growing quickly. In January 2025, Lineage acquired Fremantle City Coldstores, a site less than 10 kilometers from Fremantle Port with more than 8,000 pallet positions. The facility handles mainly meat and seafood and has six blast cells with almost 250,000 kilograms of blast-freezing capacity. That deal took Lineage to 15 facilities across Australia, adding to its existing Perth site. The Australian Bureau of Statistics reported that Western Australia had the fastest population growth of any state, at 2.1% in the year to March 31, 2026. As a result, South Australia and Western Australia grow at 4.09% a year, ahead of the two southeastern zones.
Is southern lamb processing an opening for cold storage?
Processors in the south are adding lamb capacity near the main flocks, which leaves room for more chilled storage and export handling. In May 2025, the Victorian Government said Thomas Foods International's Stawell expansion would nearly double lamb output to more than 2.3 million lambs a year. The works added a chiller room for 2,000 more carcasses, new cold room storage and new truck loading bays. Victoria accounted for 37% of national mutton slaughter in 2025, the largest share of any state, according to Meat & Livestock Australia. Lamb exports reached 363,109 metric tons in fiscal 2024-25, the second-largest year on record. In turn, Victoria and Tasmania hold 24.6% of 2025 value, supported by export lamb plants and the refrigerated trucks that serve them.
Power, labor and market access risks squeeze margins
How do power costs pressure freezer margins?
Frozen meat must be held at very low temperatures around the clock, so electricity bills weigh heavily on storage operators across the country. Electricity is one of the largest operating costs for blast freezing and frozen storage, especially during hot summers. As a result, operators on fixed-rate contracts can lose margin when wholesale prices spike. Providers respond with rooftop solar, better insulation, automated high-bay stores and freezing schedules shifted to cheaper off-peak hours.
Why do labor shortages slow processing and storage?
Boning rooms, freezer stores and refrigerated fleets all need skilled workers, and many of these jobs sit in regional towns with small labor pools. Plants that add shifts must recruit hundreds of staff at once, which is hard far from major cities. In turn, unfilled roles can limit how many carcasses a plant chills and ships each day. Operators respond with automation, migrant worker programs, housing support and training for forklift and truck drivers.
How does market access risk unsettle export flows?
A sudden plant suspension or new tariff can strand product that was already frozen and packed for one overseas buyer, leaving exporters with stock to hold. Plant suspensions in China took several years to resolve before the final ones were lifted in 2024. Meat & Livestock Australia also noted that Australian beef entering the United States faced a new tariff in 2025. As a result, cold stores can fill with unsold product, so processors spread sales across more markets and plan storage buffers.
Why do long distances raise linehaul costs?
Cattle, carcasses and boxed meat often travel thousands of kilometers between farms, plants and ports, which makes linehaul one of the largest costs in the chain. Midfield Group, for example, has bought Northern Territory cattle for 40 years and trucks them to Victoria for processing. In turn, fuel, driver hours and refrigeration add cost to every load. Carriers respond with consolidated loads, backhaul freight and depots placed near the largest processing clusters.
New South Wales leads as Queensland grows fastest
| Region | Value, 2025 (USD billion) | Share, 2025 | CAGR, 2026–2035 |
|---|---|---|---|
| New South Wales and Australian Capital Territory | 1.75 | 33.7% | 3.69% |
| Victoria and Tasmania | 1.28 | 24.6% | 3.89% |
| South Australia and Western Australia | 1.12 | 21.5% | 4.09% |
| Queensland and Northern Territory | 1.05 | 20.2% | 4.49% |
Why do New South Wales and the ACT hold the largest share?
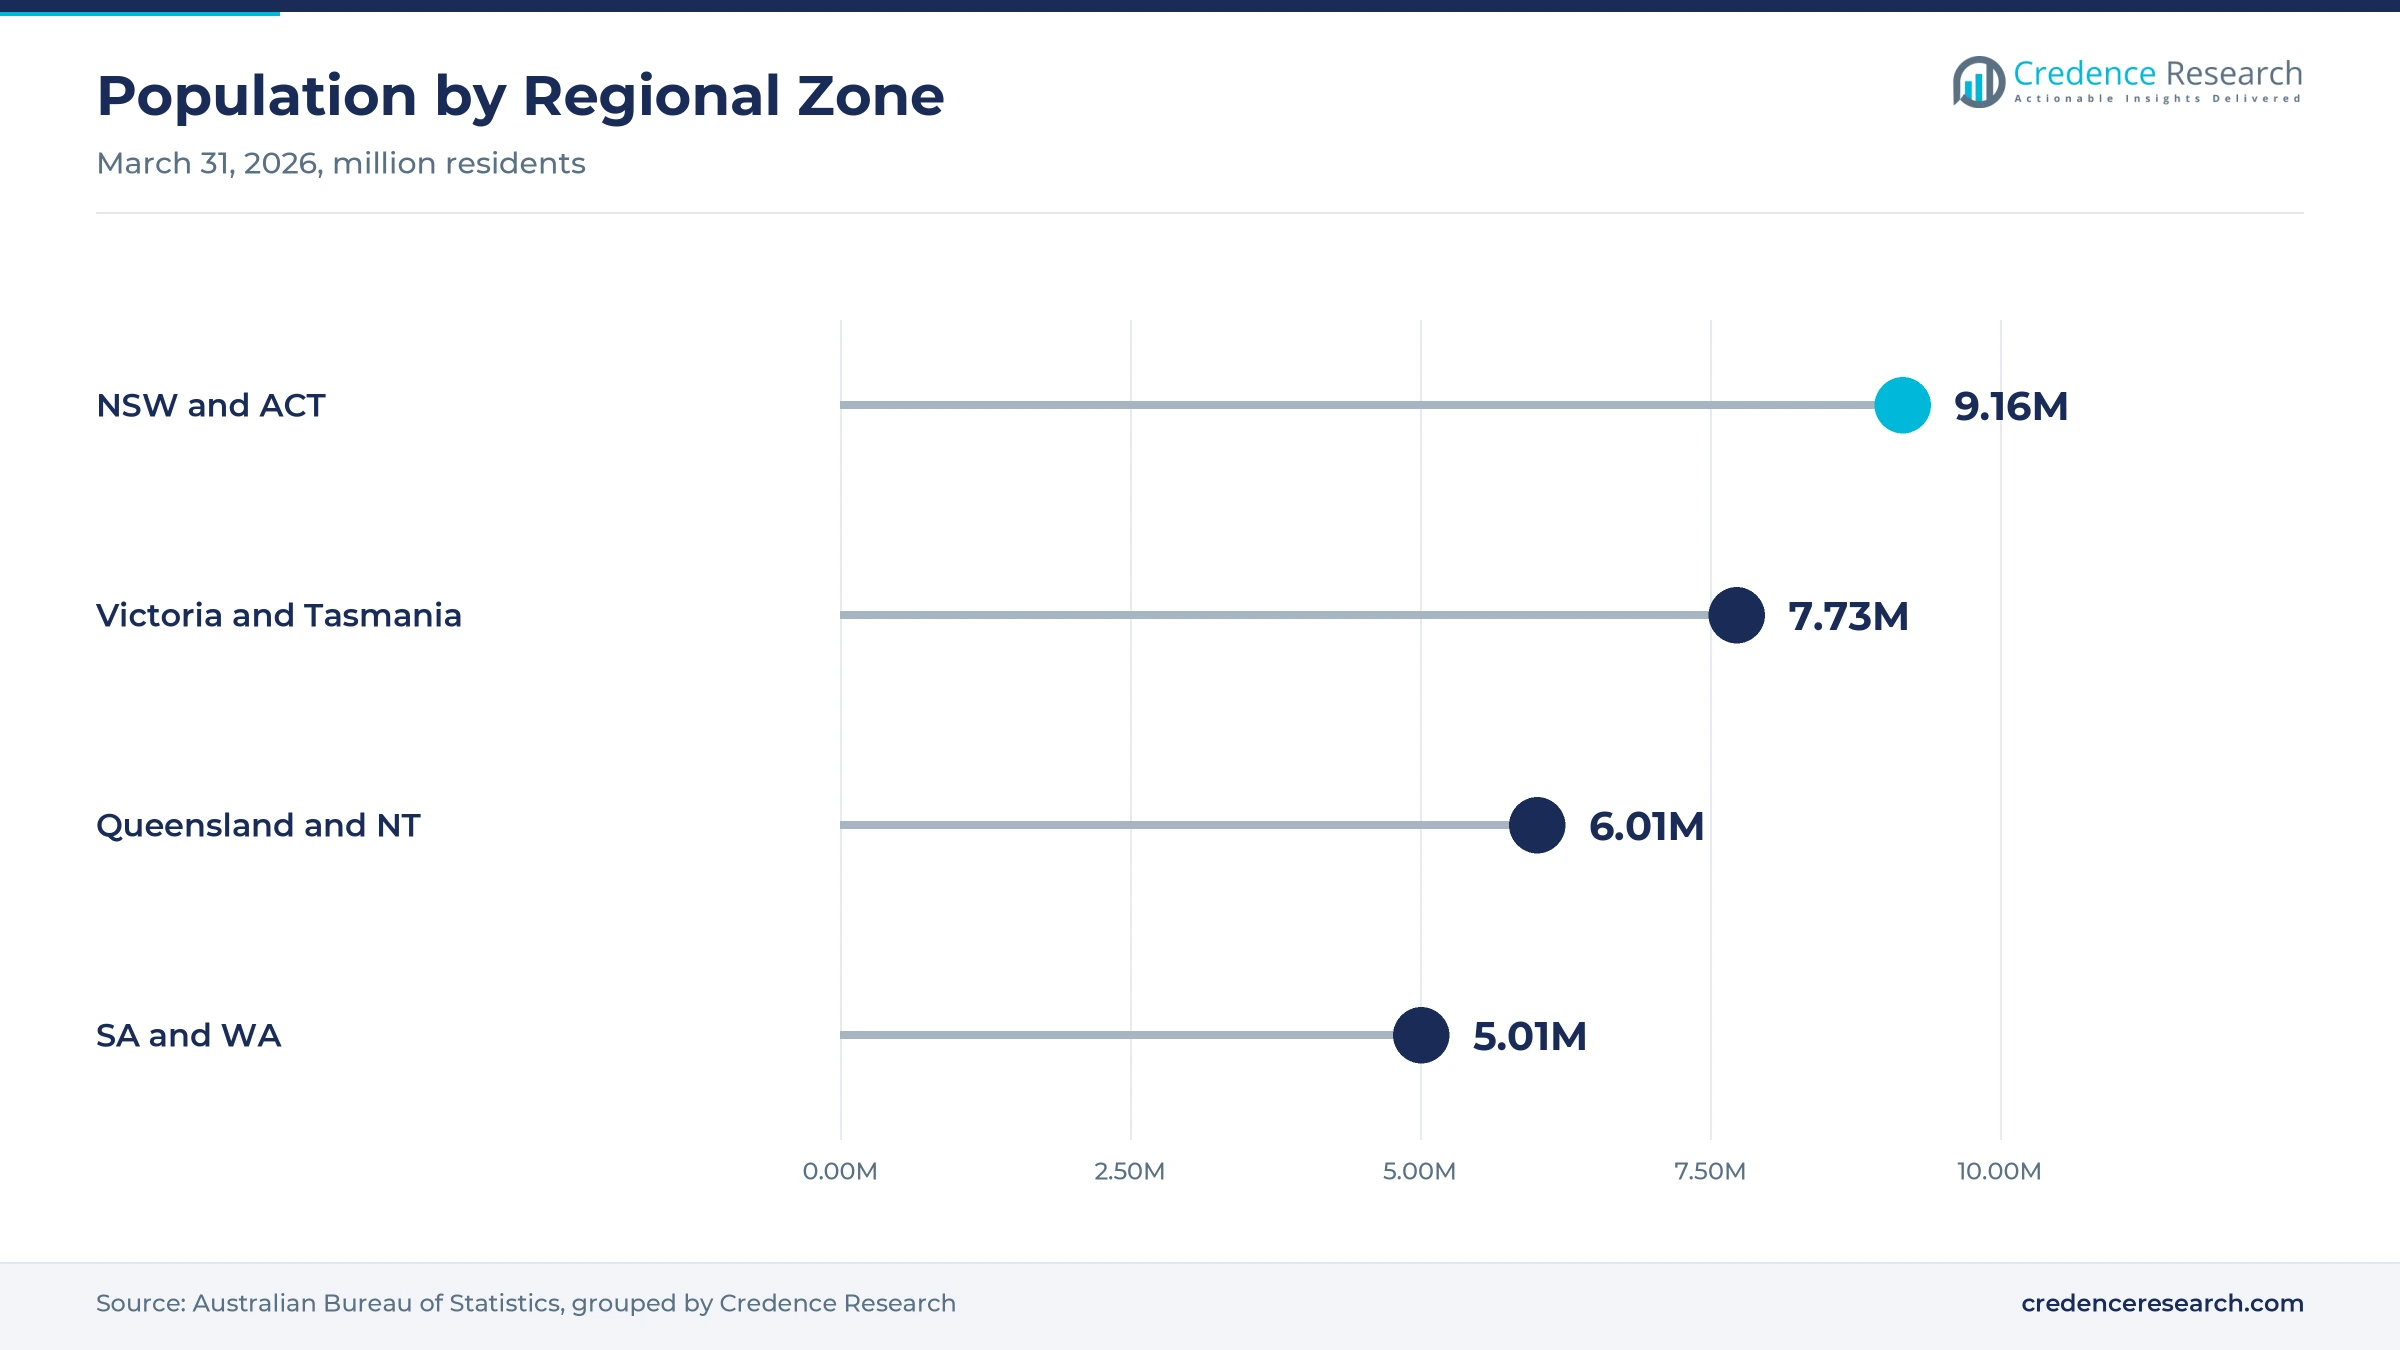
New South Wales and the Australian Capital Territory held 33.7% of 2025 value and grow at 3.69% a year, because the zone had about 9.16 million residents at March 31, 2026. Teys Australia runs beef plants at Tamworth and Wagga Wagga, while Baiada opened its Tamworth poultry plant in 2026. Americold and NewCold are adding freezer space in western Sydney. However, growth is slower than in Queensland because storage capacity is already deep.
How does lamb processing support Victoria and Tasmania?
Victoria and Tasmania held 24.6% of 2025 value and grow at 3.89% a year, because the zone combines about 7.73 million residents with the largest sheep processing base. Victoria handled 37% of national mutton slaughter in 2025, and Thomas Foods International expanded lamb capacity at Stawell. Midfield Group processes beef and sheep at Warrnambool and ships to about 90 countries. Melbourne port links give these plants direct access to container exports.
Why are South Australia and Western Australia gaining?
South Australia and Western Australia held 21.5% of 2025 value and grow at 4.09% a year, because the zone had about 5.01 million residents and strong export links. Thomas Foods International processes cattle at Murray Bridge, and Teys Australia operates a plant at Naracoorte. In Western Australia, Lineage added blast freezing near Fremantle Port in 2025. As a result, both states gain from steady lamb and beef exports to Asia.
How do beef plants lift Queensland and the NT?
Queensland and the Northern Territory held 20.2% of 2025 value and grow fastest at 4.49% a year, because the zone hosts most of the national beef processing base. Queensland slaughtered 939,300 cattle in the December 2025 quarter alone, according to Meat & Livestock Australia. Agriculture, forestry and fishing added about 2.27% of national output in 2025, according to World Bank data. JBS Dinmore and Teys plants at Beenleigh, Biloela and Rockhampton anchor demand for chilling and export storage.
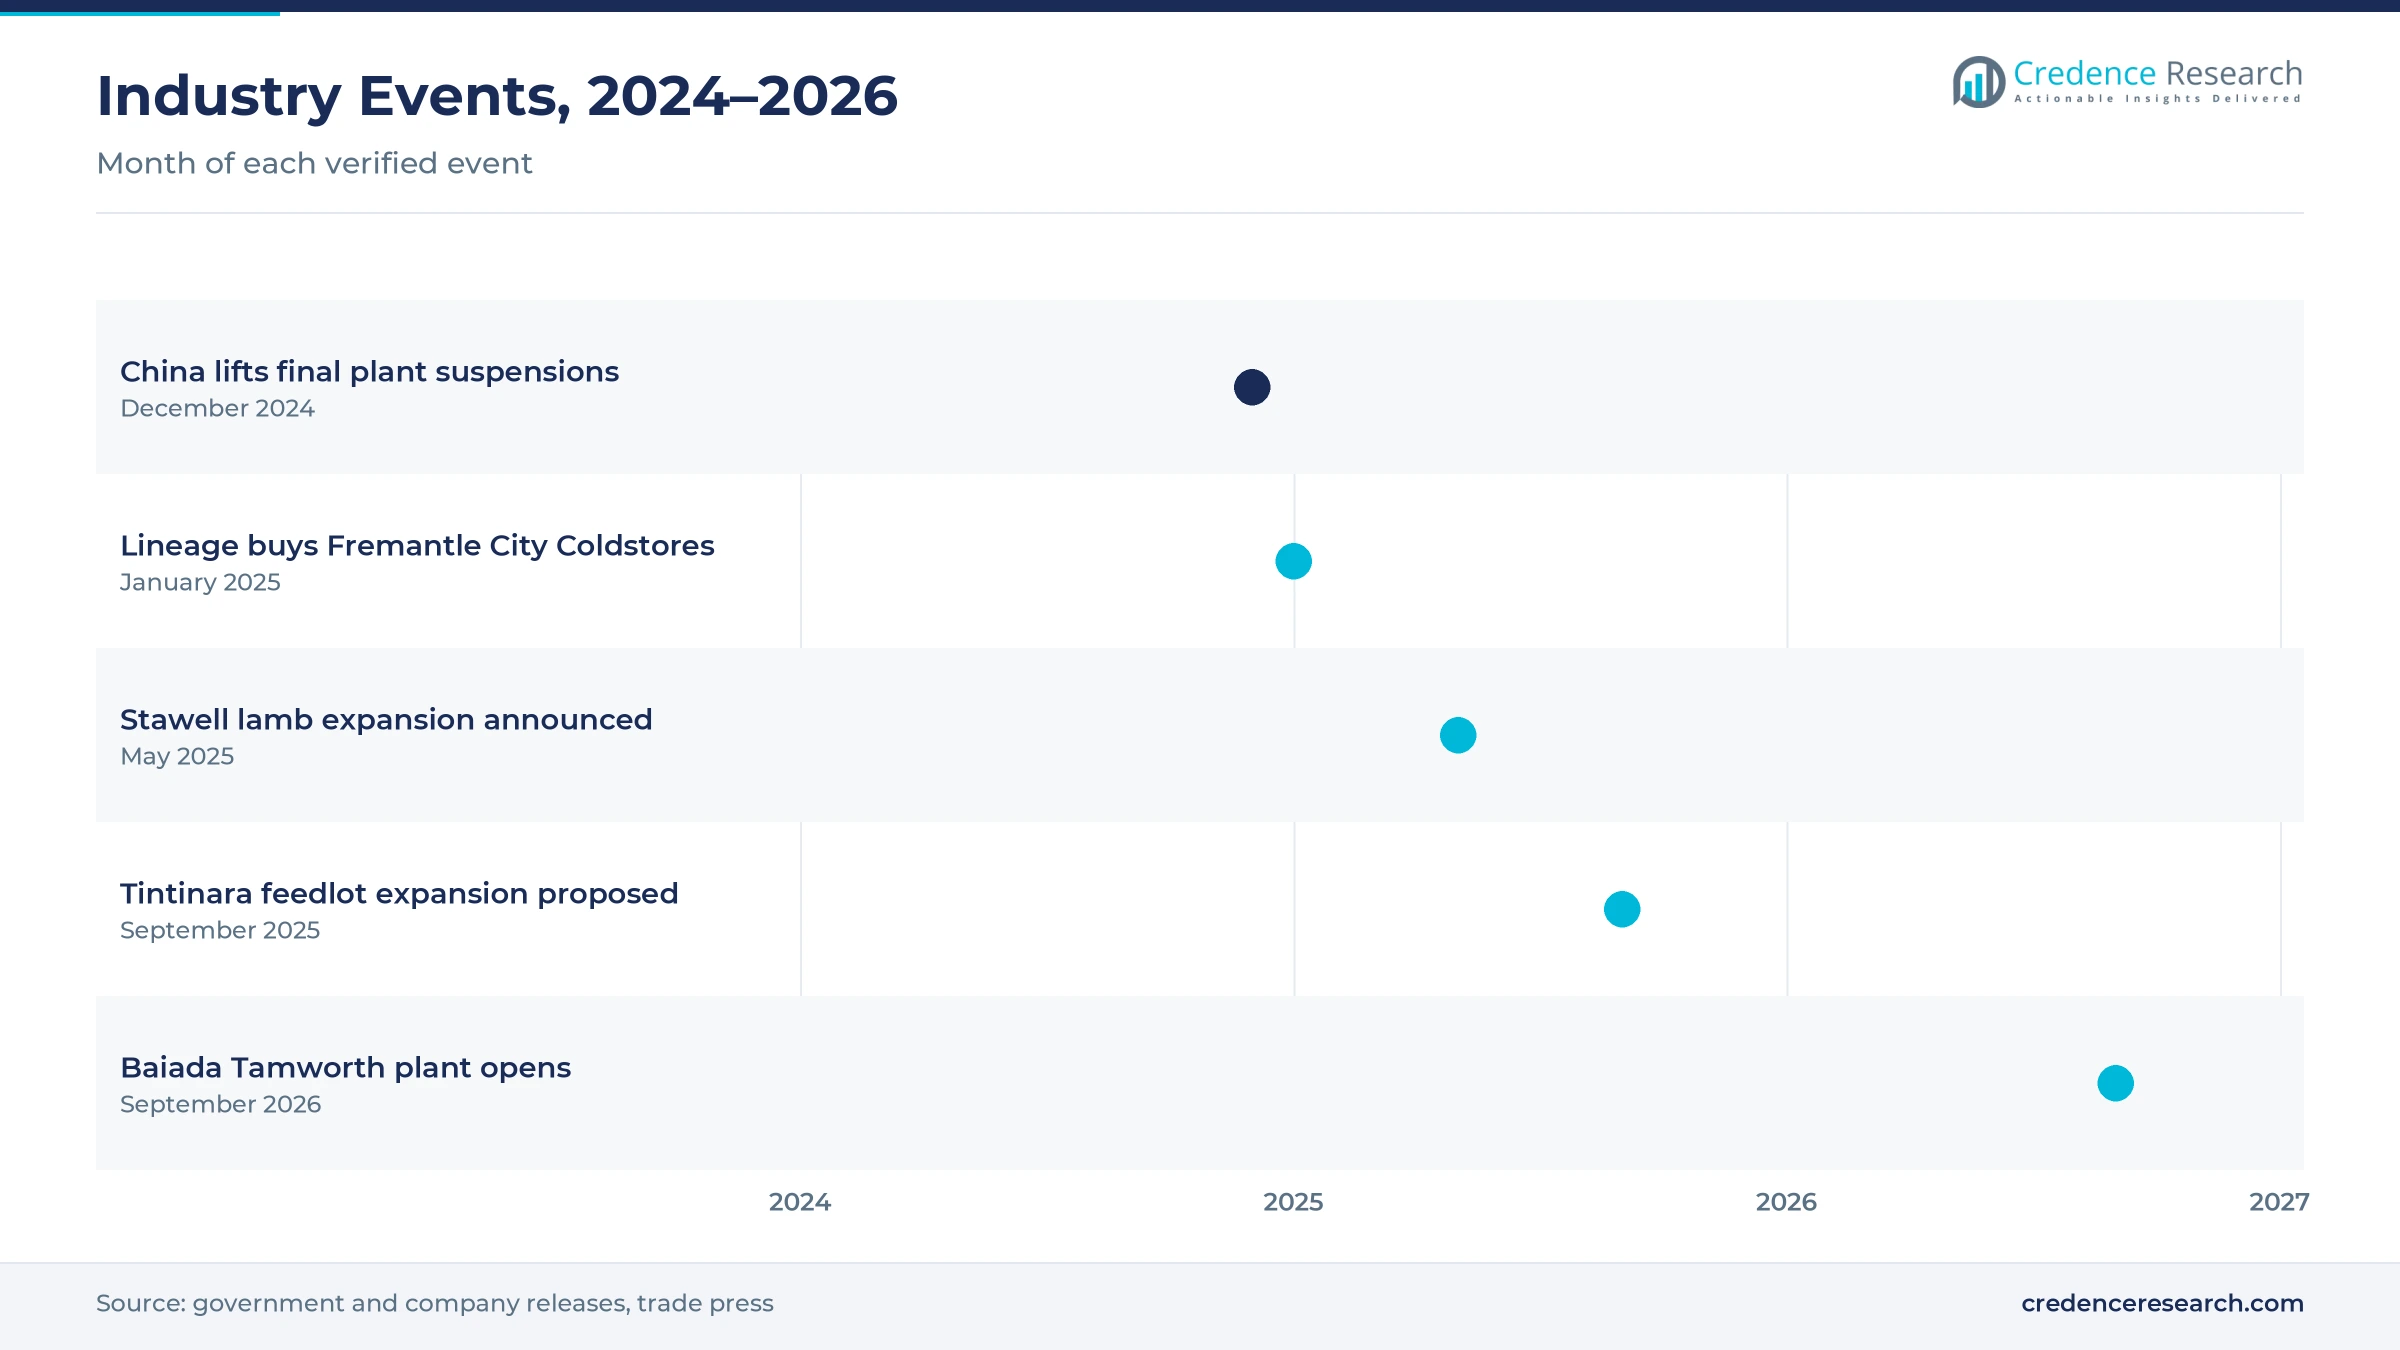
Cold store deals and plant upgrades marked 2024 to 2026
| Development | Status and market relevance |
|---|---|
| In December 2024, the federal government said China had lifted the final suspensions on two Queensland meat establishments. | Restored full red meat access to a major export market |
| In January 2025, Lineage acquired Fremantle City Coldstores in Western Australia. | Added more than 8,000 pallet positions and six blast cells for meat and seafood |
| In May 2025, the Victorian Government announced an expansion of the Thomas Foods International abattoir at Stawell. | Added a chiller room for 2,000 more carcasses and new cold room storage |
| In September 2025, Thomas Foods International proposed an A$22 million expansion of its Tintinara feedlot. | Planned capacity rise from 27,000 to 38,000 standard cattle units |
| In September 2026, Baiada opened a poultry processing plant at Tamworth in New South Wales. | Started at about 1.5 million chickens a week with automated cold storage |
Automated freezers and in-line traceability raise output
- Automated freezer stores use cranes and shuttles in deep-frozen chambers, which raises pallet density and cuts labor in hot conditions.
- In-line traceability systems link every stage of a plant, as at the Stawell abattoir, which supports export certificates and recalls.
- Multi-stage poultry chilling combines immersion, shock and air chilling, as at Baiada's Tamworth plant, which protects shelf life.
- Blast freezing cells freeze export cartons quickly before container loading, which preserves quality on long voyages to Asia and the United States.
Need a Custom Version of This Report?
Tailor the scope, geography, or segments to your exact requirements.
- Custom geography or segment scope
- Direct access to our analyst team
Processors and storage networks compete on capacity
Competition splits between large meat processors that run their own chillers and freezers and third-party networks that store and move product for many customers. JBS Australia runs Dinmore, described by the company as the largest beef plant in the southern hemisphere, while Teys Australia operates six beef plants across Queensland, New South Wales and South Australia. Thomas Foods International, Midfield Group and NH Foods Australia compete for cattle and export orders in the southern and northern supply chains. In poultry, Inghams Group and Baiada run integrated plants with in-house storage. Lineage, Americold and NewCold compete for frozen storage contracts in Sydney, Perth and other port cities. Rivals compete on capacity near ports, blast freezing speed, export approvals, automation and contract length. Processors that also own feedlots can plan freezer space further ahead, which gives them steadier export programs.
Companies profiled and their roles in this market
| Company | Type | Role in the market |
|---|---|---|
| Lineage | Cold storage network | Bought Fremantle City Coldstores in January 2025 |
| Americold | Cold storage network | Built A$55 million freezer facility at Prospect |
| NewCold | Automated cold store operator | Building automated warehouse in western Sydney |
| JBS Australia | Beef and pork processor | Expanded chiller capacity at Dinmore |
| Teys Australia | Beef processor | Runs six beef plants and a Port of Brisbane hub |
| Thomas Foods International | Multi-species processor | Expanded lamb chillers at Stawell |
| NH Foods Australia | Beef processor | Plans 5,000 head feedlot expansion in Queensland |
| Inghams Group | Poultry processor | Funds automation through larger credit facilities |
| Baiada | Poultry processor | Opened Tamworth plant with automated cold storage |
| Midfield Group | Beef and sheep processor | Ships from Warrnambool to about 90 countries |
Credence Research view on Australian meat cold chains
Credence Research's view is that Australian meat cold chain demand will grow steadily, because record slaughter, wider export reach and new freezer capacity all add temperature-controlled volume. Refrigerated transport remains the largest service, while value-added services grow fastest as importers ask for more labeling and records. Queensland should gain the most from beef processing, while southern states benefit from lamb. However, power costs, labor shortages and market access risks will keep pressure on margins. Operators that combine port access with automated freezer space should gain share.
Slaughter, export and company data anchor the sizing
The report uses 2025 as the base year on a calendar basis, and market values come from the Credence Research model. That model combines Australian Bureau of Statistics livestock and population data, Meat & Livestock Australia export statistics, federal export meat rules, World Bank data and company announcements on plants, cold stores and feedlots. Regional shares follow the client split for 2025, while segment splits and growth rates are Credence Research estimates. Sources used are official statistics, government releases, trade press and company releases, and no interviews or surveys were used.
Export reach and new freezer space carry growth to 2035
Meat cold chain revenue in Australia is expected to reach USD 7.70 billion by 2035, a 3.99% CAGR during 2026–2035, as processors and storage networks handle more beef, lamb and chicken for home and export buyers. Growth should be strongest in Queensland and the Northern Territory, where beef plants meet new export demand. After 2026, automated freezer stores in western Sydney should lower handling costs. A sharp herd rebuild or new trade barriers would lower this outlook, while faster export growth in Asia would raise it.
Frequently Asked Questions
How big is the Australia cold chain and meat market?
Which service type leads meat cold chain spending in Australia?
Which region leads the Australian market?
How do beef exports affect cold chain demand?
Which meat type is growing fastest?
How much cattle did Australia slaughter in 2025?
Who are the leading companies in the market?
What are the main challenges for operators?
Table of Content
Chapter 1 Market Segmentation
- 1.1 Segmentation Framework
- 1.1.1 Product and Service Classification
- 1.1.2 Application and End-Use Classification
- 1.1.3 Technology and Solution Classification
- 1.1.4 Customer and Distribution Channel Classification
- 1.1.5 Geographic Segmentation
- 1.1.6 Market Segment Definitions and Boundaries
- 1.2 By Service Type
- 1.2.1 Refrigerated Storage Services
- 1.2.2 Refrigerated Transport Services
- 1.2.3 Value-Added Cold Chain Services
- 1.3 By Product Type
- 1.3.1 Beef and Veal
- 1.3.2 Sheep Meat
- 1.3.3 Poultry
- 1.3.4 Pork
- 1.4 By Shipment Flow
- 1.4.1 Domestic Distribution
- 1.4.2 Export-Linked Logistics
- 1.4.3 Import-Linked Logistics
- 1.5 By Customer Type
- 1.5.1 Food Producers and Processors
- 1.5.2 Retail and Foodservice Distributors
- 1.5.3 Healthcare and Specialist Shippers
Chapter 2 Introduction
- 2.1 Report Objectives and Scope
- 2.2 Product Definition and Industry Terminology
- 2.3 Market Inclusions and Exclusions
- 2.4 Research Process
- 2.4.1 Primary Research and Expert Interviews
- 2.4.2 Secondary Research and Source Review
- 2.4.3 Top-Down and Bottom-Up Estimation
- 2.4.4 Data Triangulation and Verification
- 2.5 Market Size Measurement Basis
- 2.5.1 2025: USD 5.19 billion → 2035: USD 7.70 billion
- 2.6 Historical and Forecast Reference Periods
- 2.6.1 Historical Period: 2018-2025
- 2.6.2 Base Year: 2025
- 2.6.3 Forecast Period: 2025-2035
- 2.7 Research Assumptions and Limitations
Chapter 3 Executive Summary
- 3.1 Market Snapshot and Key Findings
- 3.2 Base-Year Market Size, 2025
- 3.3 Forecast Market Size, 2035
- 3.4 Revenue and Volume Growth Outlook
- 3.5 Key Demand and Supply Indicators
- 3.6 Leading Market Segments
- 3.7 Fastest-Growing Market Opportunities
- 3.8 Regional Performance Highlights
- 3.9 Technology and Industry Transformation
- 3.10 Competitive Landscape Summary
- 3.11 Analyst View and Strategic Implications
Chapter 4 Australia Cold Chain and Meat Market Trends and Developments
- 4.1 Historical Industry Development, 2018-2025
- 4.2 Recent Market Trends and Developments
- 4.3 Demand and Customer Behavior Trends
- 4.4 Technology and Product Innovation
- 4.5 Artificial Intelligence, Automation and Digitalization
- 4.6 Local Manufacturing and Supply Chain Realignment
- 4.7 Industry Partnerships, Mergers and Acquisitions
- 4.8 Sustainability and Circular Economy Developments
- 4.9 Government and Private Sector Investment Trends
- 4.10 Emerging Business Models and Commercialization
- 4.11 Industry Developments and Announcements
Chapter 5 Australia Cold Chain and Meat Market Production, Supply and Demand Analysis
- 5.1 Demand Trend and Consumption Analysis, 2018-2025
- 5.2 Demand Forecast, 2025-2035
- 5.3 Production and Output Trend, 2018-2025
- 5.4 Production and Output Forecast, 2025-2035
- 5.5 Installed Capacity and Capacity Utilization
- 5.6 Company-Wise Production Plants and Statistics
- 5.6.1 Installed Production Capacity
- 5.6.2 Actual Production
- 5.6.3 Planned Capacity and Expansion Targets
- 5.7 Supply Chain Structure and Procurement Trends
- 5.8 Supply-Demand Gap and Bottlenecks
- 5.9 Import Dependence and Sourcing Structure
- 5.10 Contract Manufacturing and Outsourcing
- 5.11 Regional Supply and Demand Concentration
Chapter 6 Australia Cold Chain and Meat Market Pricing Analysis
- 6.1 Pricing Structure and Measurement
- 6.2 Historical Pricing Trends, 2018-2025
- 6.3 Pricing Outlook, 2025-2035
- 6.4 Average Selling Price and Unit Economics
- 6.5 Pricing by Product and Market Segment
- 6.6 Geographic Pricing Differences
- 6.7 Key Input, Energy, Labor and Logistics Costs
- 6.8 Contract Pricing and Purchasing Models
- 6.9 Pricing Sensitivity and Competitive Positioning
- 6.10 Price, Margin and Profitability Implications
Chapter 7 Australia Cold Chain and Meat Market Dynamics
- 7.1 Market Growth Drivers
- 7.1.1 Demand-Side Drivers
- 7.1.2 Technology and Innovation Drivers
- 7.1.3 Infrastructure and Investment Drivers
- 7.1.4 Regulatory and Policy Drivers
- 7.2 Market Restraints
- 7.2.1 Cost and Affordability Constraints
- 7.2.2 Technology and Adoption Barriers
- 7.2.3 Supply Chain and Operational Constraints
- 7.3 Market Challenges
- 7.3.1 Competitive Pressure and Margin Erosion
- 7.3.2 Skills, Infrastructure and Implementation Gaps
- 7.4 Emerging Market Opportunities
- 7.5 Market Dynamics Impact and Time-Horizon Assessment
Chapter 8 Australia Cold Chain and Meat Value Chain Analysis
- 8.1 Industry Value Chain Overview
- 8.2 Upstream Suppliers and Critical Inputs
- 8.3 Technology and Component Providers
- 8.4 Manufacturing or Service Delivery
- 8.5 Distribution, Channel Partners and Integrators
- 8.6 Downstream Applications and End Users
- 8.7 Value Addition and Profit Pools
- 8.8 Vertical Integration and Outsourcing
- 8.9 Supplier Concentration and Risk
- 8.10 Supply Chain Localization and Resilience
Chapter 9 Australia Cold Chain and Meat Market Regulations and Policies
- 9.1 Relevant Laws, Standards and Compliance Frameworks
- 9.2 Product, Service, Safety and Quality Requirements
- 9.3 Government Policies, Incentives and Subsidies
- 9.4 Imports, Exports and Trade Barriers
- 9.5 Public Procurement and Local Content Requirements
- 9.6 Environmental and Sustainability Compliance
- 9.7 Upcoming Policy Changes and Market Implications
Chapter 10 Australia Cold Chain and Meat Market Hotspots and Opportunities
- 10.1 Market Opportunity Mapping and Growth Hotspots
- 10.2 High-Growth Applications and Customer Groups
- 10.3 Underserved Markets and White-Space Opportunities
- 10.4 Emerging Technology and Product Opportunities
- 10.5 New Capacity and Investment Hotspots
- 10.6 Market Entry and Expansion Opportunities
- 10.7 Distribution and Partnership Opportunities
- 10.8 Near-Term and Long-Term Commercial Potential
- 10.9 Opportunity Attractiveness and Execution Risks
Chapter 11 Australia Cold Chain and Meat Market Outlook, 2025-2035
- 11.1 Market Size and Analysis
- 11.1.1 Revenue (Market Measurement: 2025: USD 5.19 billion → 2035: USD 7.70 billion)
- 11.1.2 Market Volume and Quantity Sold
- 11.1.3 Historical Market Size, 2018-2025
- 11.1.4 Base-Year Market Size, 2025
- 11.2 Market Forecast, 2025-2035
- 11.2.1 Revenue Forecast to 2035
- 11.2.2 Volume Forecast to 2035
- 11.2.3 CAGR and Year-on-Year Growth
- 11.2.4 Incremental Revenue Opportunity
- 11.3 Forecast Assumptions and Scenario Analysis
- 11.3.1 Base-Case Forecast
- 11.3.2 Optimistic and Conservative Scenarios
- 11.3.3 Technology, Pricing and Policy Sensitivities
- 11.4 Market Attractiveness and Growth Outlook
Chapter 12 Australia Cold Chain and Meat Market Segmentation and Outlook
- 12.1 Segmentation Summary and Market Shares, 2025
- 12.2 Largest and Fastest-Growing Segments
- 12.3 By Service Type - Market Size and Forecast, 2025-2035
- 12.3.1 Segment Definition and Scope
- 12.3.2 Historical Market Size, 2018-2025
- 12.3.3 Revenue Forecast, 2025-2035
- 12.3.4 Volume Forecast, 2025-2035
- 12.3.5 Base-Year Market Share, 2025
- 12.3.6 Segment CAGR and Growth Drivers
- 12.3.7 Subsegment Market Size and Forecast
- 12.3.7.1 Refrigerated Storage Services
- 12.3.7.2 Refrigerated Transport Services
- 12.3.7.3 Value-Added Cold Chain Services
- 12.3.8 Subsegment Pricing and Adoption Trends
- 12.3.9 Leading Suppliers and Competition
- 12.3.10 Regional Demand and Opportunities
- 12.4 By Product Type - Market Size and Forecast, 2025-2035
- 12.4.1 Segment Definition and Scope
- 12.4.2 Historical Market Size, 2018-2025
- 12.4.3 Revenue Forecast, 2025-2035
- 12.4.4 Volume Forecast, 2025-2035
- 12.4.5 Base-Year Market Share, 2025
- 12.4.6 Segment CAGR and Growth Drivers
- 12.4.7 Subsegment Market Size and Forecast
- 12.4.7.1 Beef and Veal
- 12.4.7.2 Sheep Meat
- 12.4.7.3 Poultry
- 12.4.7.4 Pork
- 12.4.8 Subsegment Pricing and Adoption Trends
- 12.4.9 Leading Suppliers and Competition
- 12.4.10 Regional Demand and Opportunities
- 12.5 By Shipment Flow - Market Size and Forecast, 2025-2035
- 12.5.1 Segment Definition and Scope
- 12.5.2 Historical Market Size, 2018-2025
- 12.5.3 Revenue Forecast, 2025-2035
- 12.5.4 Volume Forecast, 2025-2035
- 12.5.5 Base-Year Market Share, 2025
- 12.5.6 Segment CAGR and Growth Drivers
- 12.5.7 Subsegment Market Size and Forecast
- 12.5.7.1 Domestic Distribution
- 12.5.7.2 Export-Linked Logistics
- 12.5.7.3 Import-Linked Logistics
- 12.5.8 Subsegment Pricing and Adoption Trends
- 12.5.9 Leading Suppliers and Competition
- 12.5.10 Regional Demand and Opportunities
- 12.6 By Customer Type - Market Size and Forecast, 2025-2035
- 12.6.1 Segment Definition and Scope
- 12.6.2 Historical Market Size, 2018-2025
- 12.6.3 Revenue Forecast, 2025-2035
- 12.6.4 Volume Forecast, 2025-2035
- 12.6.5 Base-Year Market Share, 2025
- 12.6.6 Segment CAGR and Growth Drivers
- 12.6.7 Subsegment Market Size and Forecast
- 12.6.7.1 Food Producers and Processors
- 12.6.7.2 Retail and Foodservice Distributors
- 12.6.7.3 Healthcare and Specialist Shippers
- 12.6.8 Subsegment Pricing and Adoption Trends
- 12.6.9 Leading Suppliers and Competition
- 12.6.10 Regional Demand and Opportunities
- 12.7 Segment Growth Comparison
- 12.8 Segment Attractiveness and Priority Matrix
Chapter 13 Australia Cold Chain and Meat End-Use and Application Market Outlook
- 13.1 End-Use Industry and Customer Demand Structure
- 13.2 Leading Applications and Customer Groups
- 13.3 End-Use Market Size, Share and Forecast
- 13.4 Major End-Use Industry Deep Dives
- 13.4.1 Customer Requirements and Use Cases
- 13.4.2 Demand and Replacement Cycles
- 13.4.3 Technical and Regulatory Considerations
- 13.4.4 Purchasing and Procurement Models
- 13.4.5 Leading Vendors and Distribution Channels
- 13.4.6 Forecast and Commercial Opportunities
- 13.5 Emerging Applications and Cross-Segment Demand
- 13.6 End-Use Industry Investment Priorities
Chapter 14 Australia Cold Chain and Meat Geographic Market Outlook, 2025-2035
- 14.1 Domestic Market Distribution and Demand Clusters
- 14.2 State- or Province-Wise Market Size and Forecast, 2025-2035
- 14.3 City and Metropolitan Market Outlook
- 14.4 Industrial, Manufacturing and Commercial Clusters
- 14.5 Geographic Concentration of Key End Users
- 14.6 Local Pricing and Purchasing Differences
- 14.7 Domestic Production Facilities and Capacity Map
- 14.8 Local Infrastructure and Project Pipeline
- 14.9 State-Level Policy and Incentive Differences
- 14.10 Subnational Investment Hotspots and Opportunities
- 14.11 Distribution and Logistics Networks
- 14.12 Domestic Competitive Footprint
Chapter 15 Australia Cold Chain and Meat Technology, Innovation and Sustainability Outlook
- 15.1 Technology Landscape and Maturity
- 15.2 Product, Process and Service Innovation
- 15.3 AI, Automation and Digital Tools in the Industry
- 15.4 Technology Adoption and Performance Benchmarking
- 15.5 Innovation Pipeline and R&D Investment
- 15.6 Patent and Intellectual Property Trends
- 15.7 Energy Efficiency and Resource Management
- 15.8 Sustainability, Recycling and Circularity
- 15.9 Technology Roadmap, 2025-2035
- 15.10 Risks of Obsolescence and Technology Substitution
Chapter 16 Australia Cold Chain and Meat Market Key Strategic Imperatives
- 16.1 Growth and Market Entry Priorities
- 16.2 High-Return Products and Segments
- 16.3 Pricing, Profitability and Cost Optimization
- 16.4 Technology Investment and Product Differentiation
- 16.5 Supply Chain Localization and Resilience
- 16.6 Distribution and Customer Acquisition
- 16.7 Partnership, Acquisition and Capacity Strategy
- 16.8 Regional Expansion Priorities
- 16.9 Short-, Medium- and Long-Term Actions
Chapter 17 Competition Outlook
- 17.1 Industry Competition Characteristics
- 17.2 Market Structure and Concentration
- 17.3 Market Share and Competitive Positioning, 2025
- 17.4 Company-Wise Revenue and Product Benchmarking
- 17.5 Production and Service Capacity Benchmarking
- 17.6 Technology, Pricing and Differentiation
- 17.7 Regional Footprint and Distribution Strength
- 17.8 Mergers, Acquisitions and Strategic Alliances
- 17.9 New Entrants and Competitive Threats
- 17.10 Porter's Five Forces and Industry Attractiveness
- 17.11 Competitive Outlook, 2025-2035
Chapter 18 Company Profiles
- 18.1 Company Coverage and Selection Criteria
- 18.2 Lineage
- 18.2.1 Business Description
- 18.2.2 Company Ownership and Geographic Presence
- 18.2.3 Product and Service Portfolio
- 18.2.4 Manufacturing and Operating Footprint
- 18.2.5 Production Capacity and Expansion Plans
- 18.2.6 Financial Performance and Investment
- 18.2.7 Market Share and Competitive Position
- 18.2.8 Technology and Innovation Capabilities
- 18.2.9 Strategic Alliances or Partnerships
- 18.2.10 Recent Developments
- 18.2.11 Growth Strategy and Outlook
- 18.3 Americold
- 18.4 NewCold
- 18.5 JBS Australia
- 18.6 Teys Australia
- 18.7 Thomas Foods International
- 18.8 NH Foods Australia
- 18.9 Inghams Group
- 18.10 Baiada
- 18.11 Midfield Group
- 18.12 Other Relevant Market Participants
Note: Every listed company is profiled on the structure shown under the first company. The company list is preliminary and may change based on research findings, market developments, data availability and client requirements.
Chapter 19 Disclaimer
- 19.1 Research and Forecast Disclaimer
- 19.2 Data Source and Estimation Limitations
Note: The depth of individual sections depends on data availability for this market. Volume, capacity, trade and other unit-based metrics are included where applicable.

