
A national fiber gap shapes ingredient demand
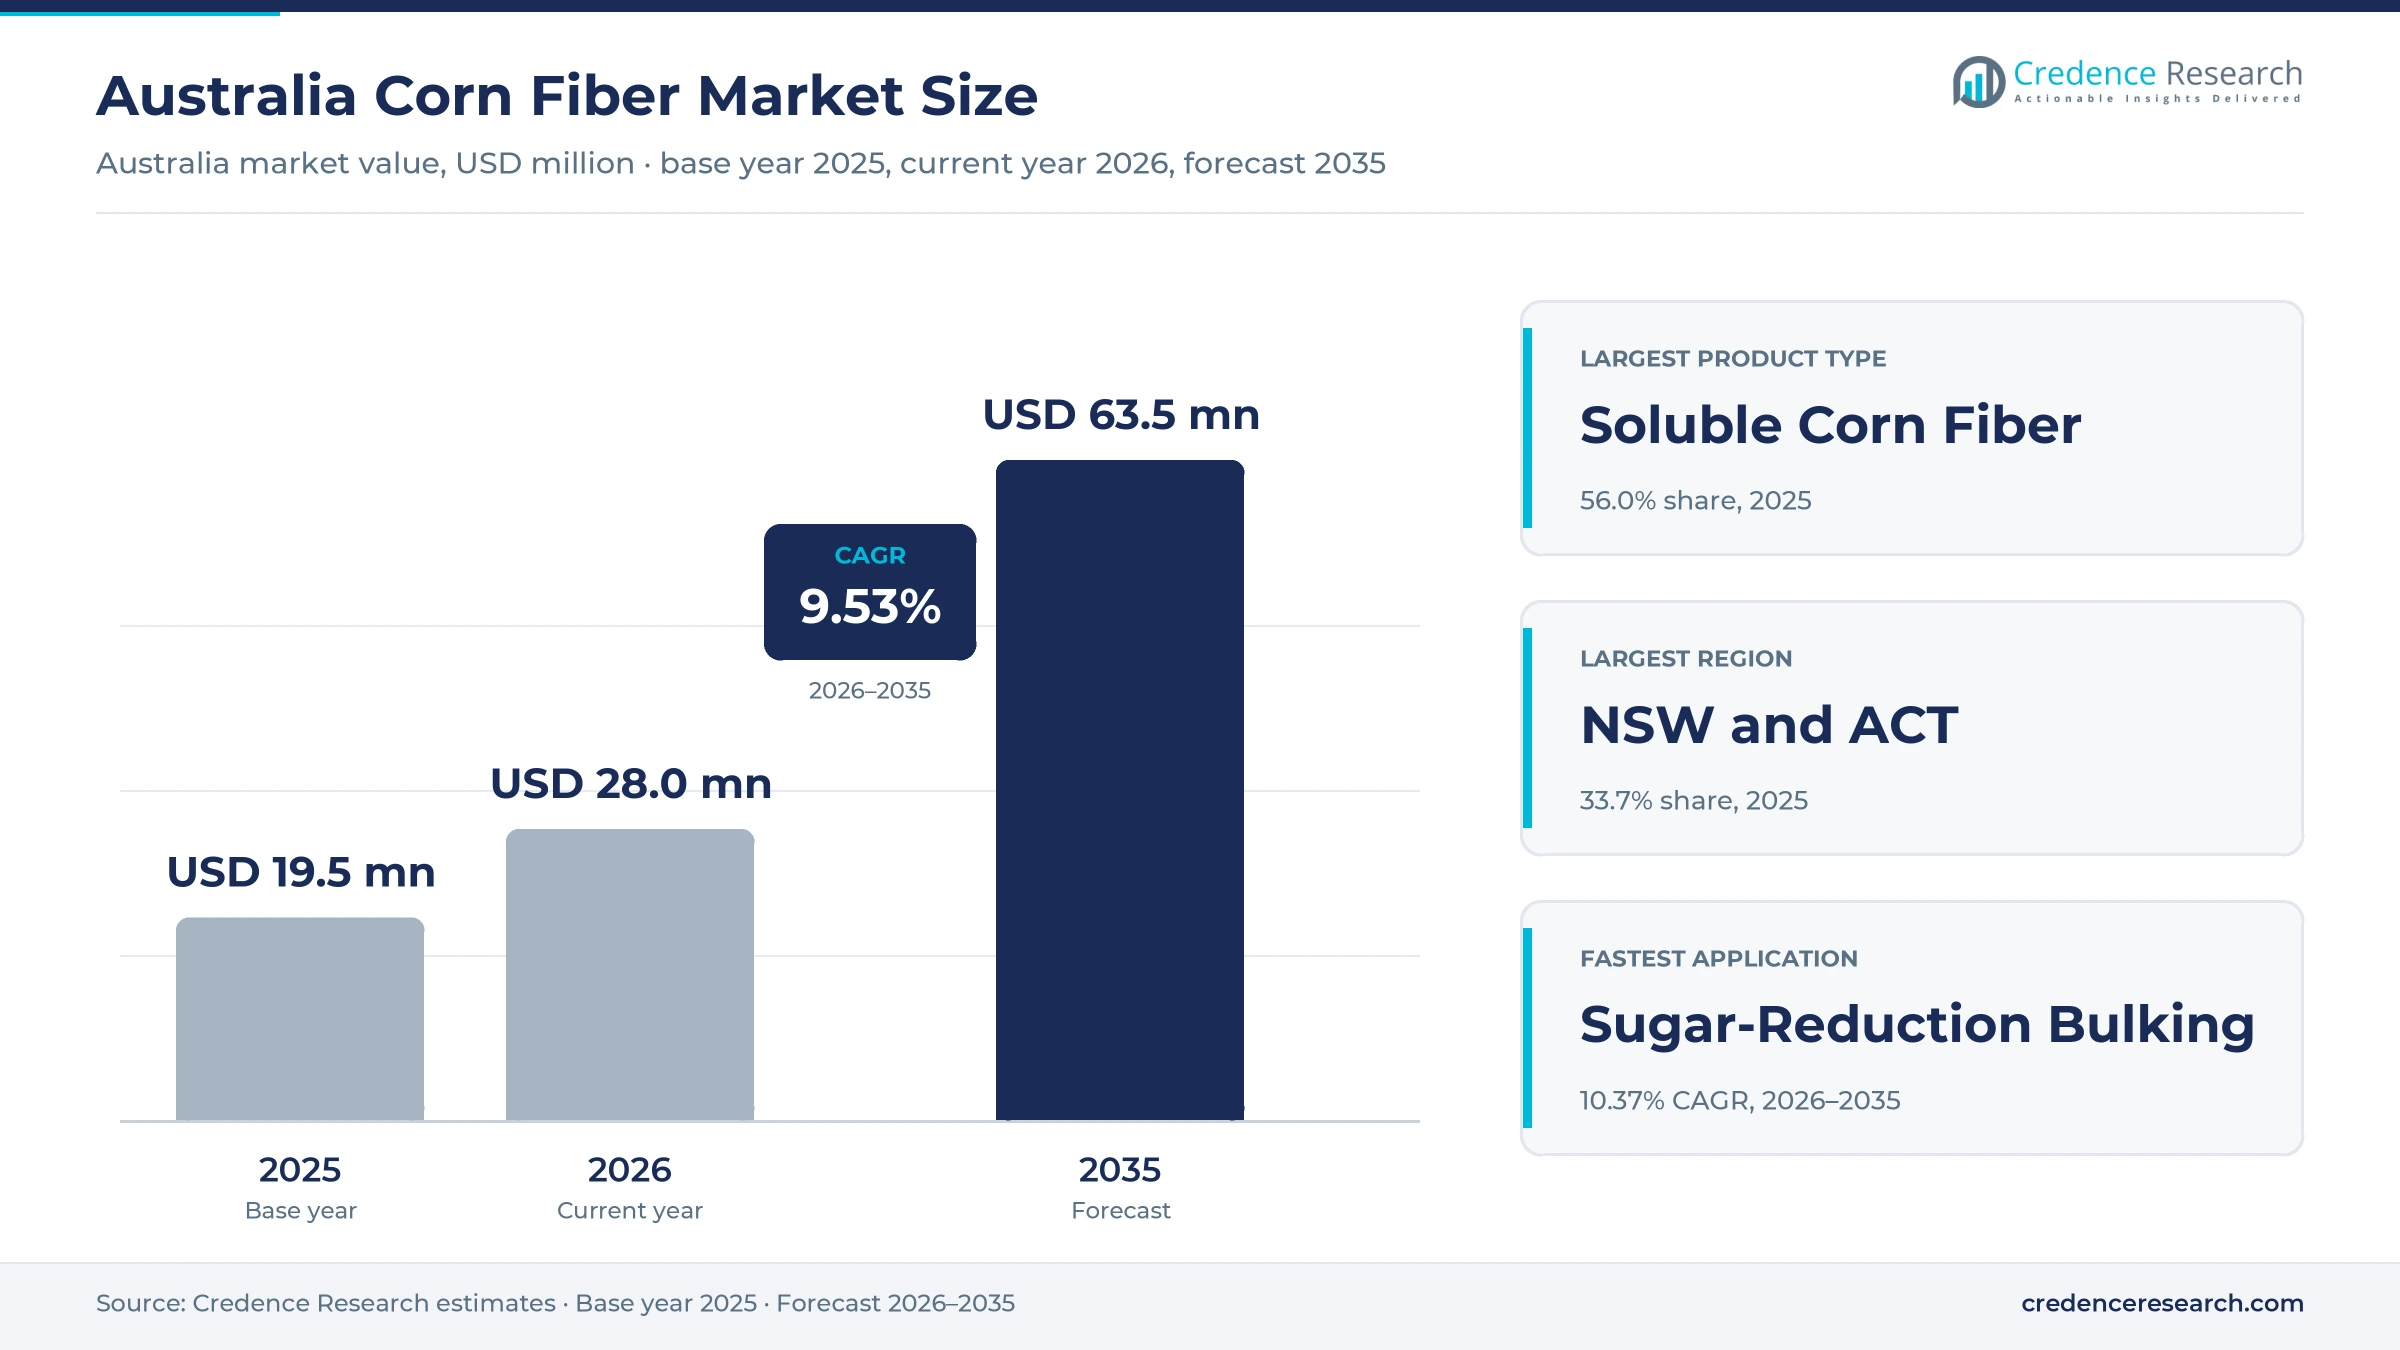
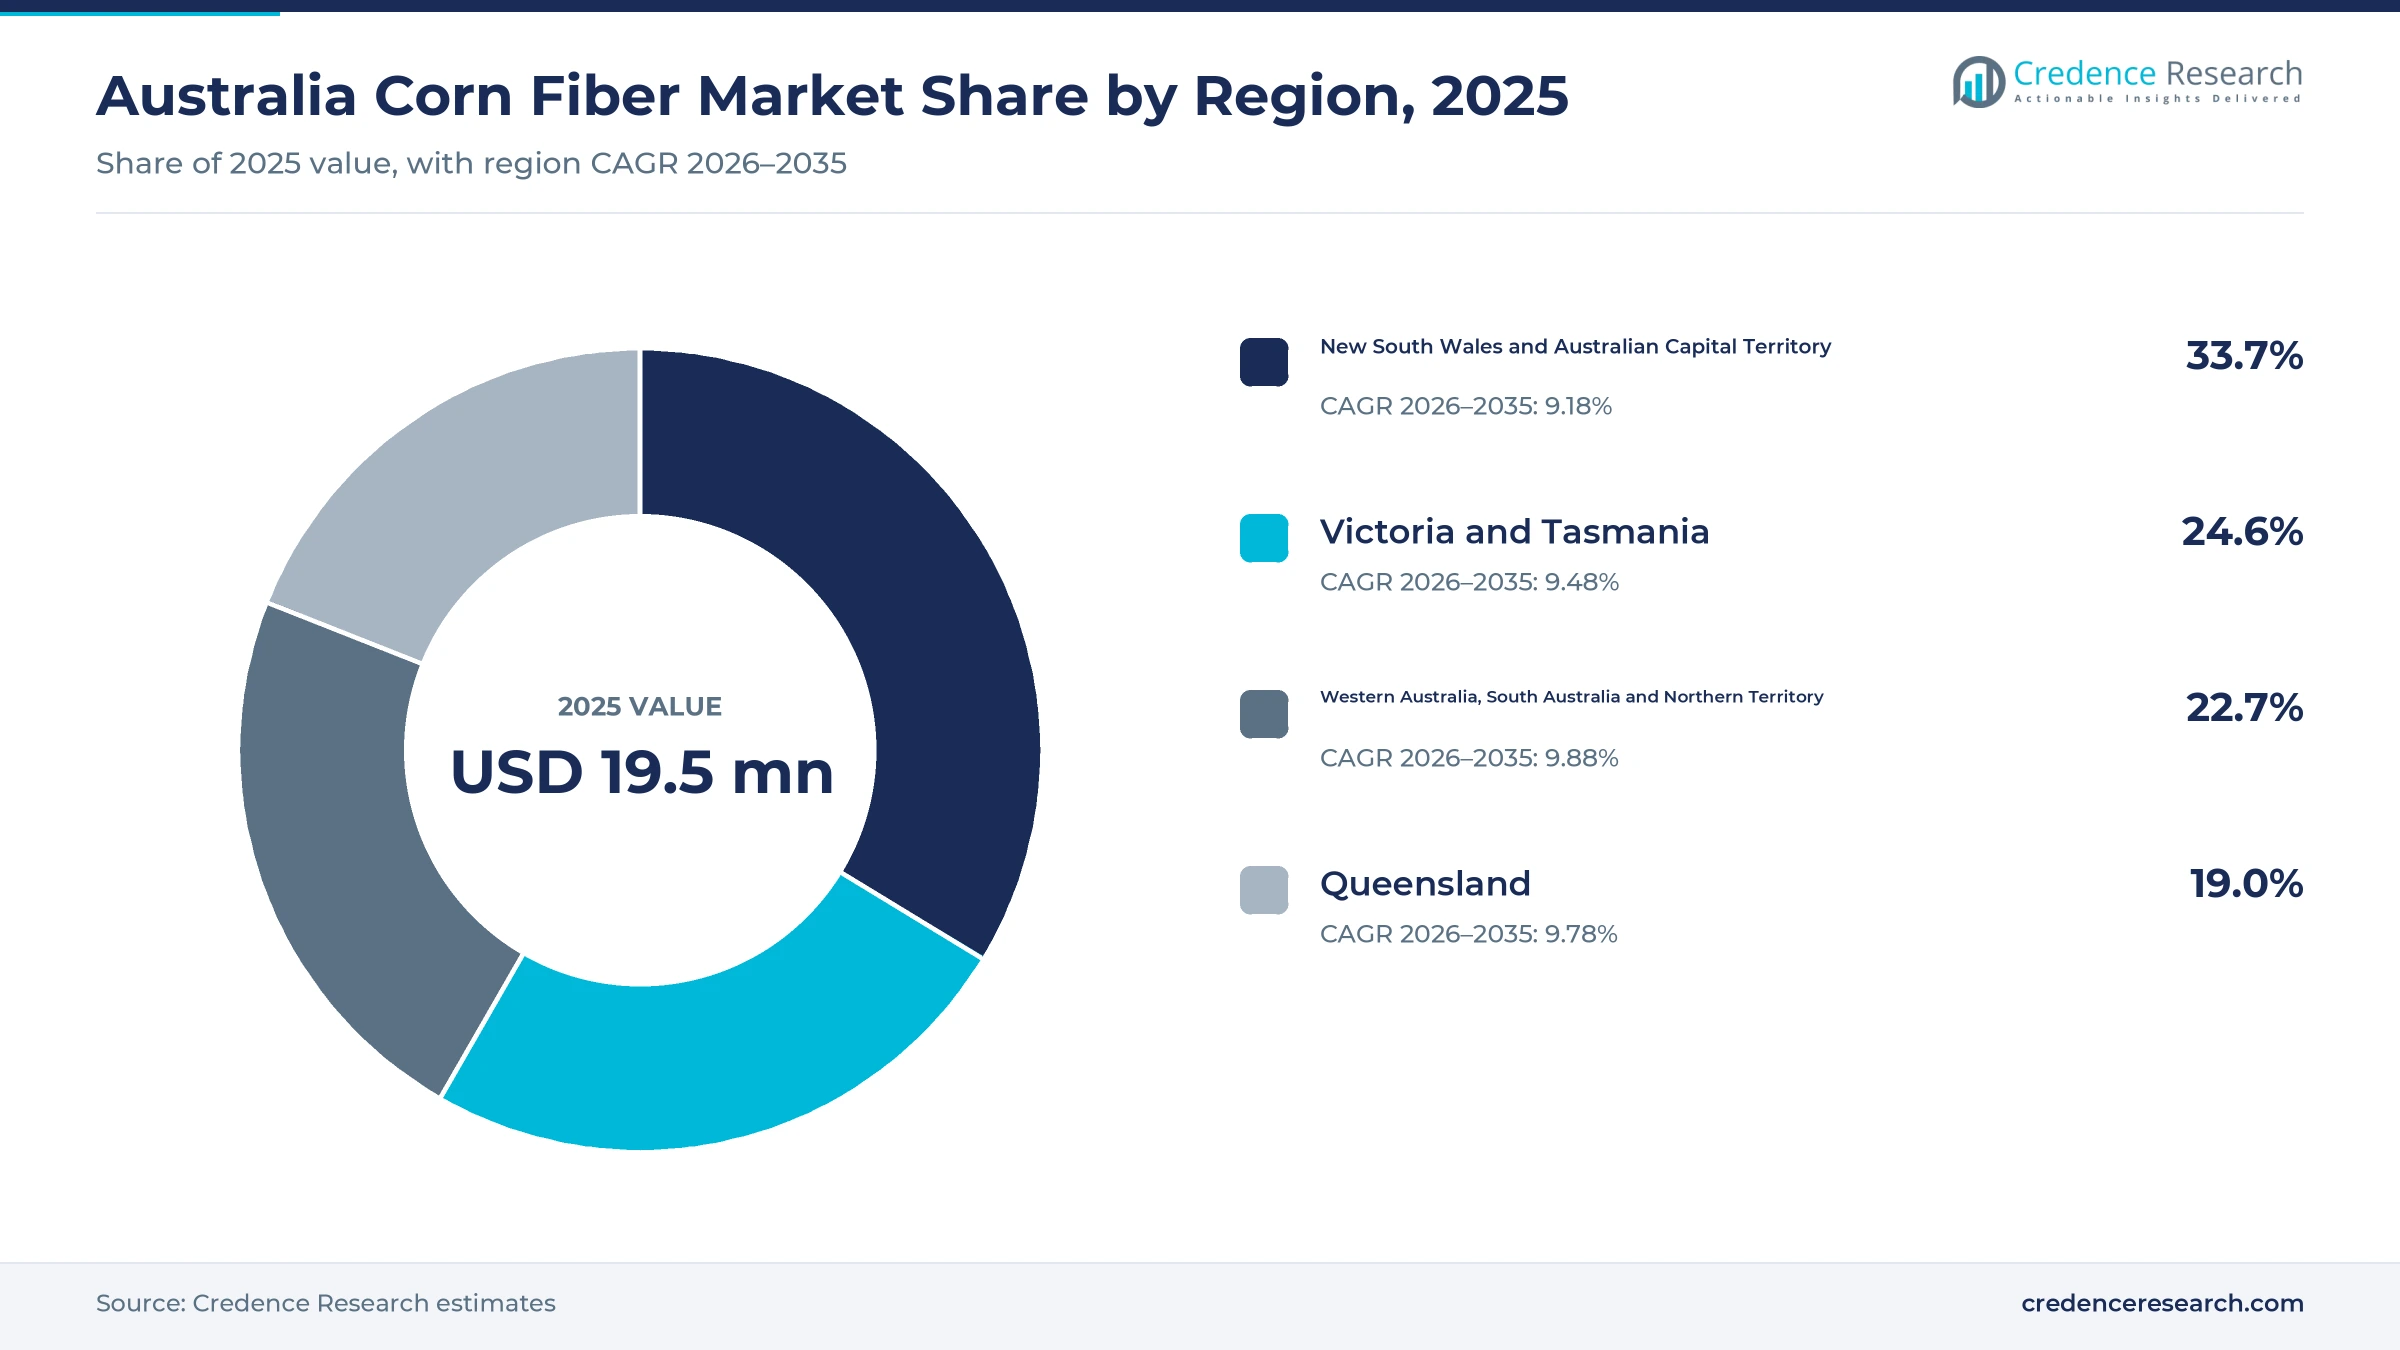
The Australia corn fiber market was valued at USD 19.5 million in 2025 and is projected to increase from USD 28.0 million in 2026 to USD 63.5 million by 2035, registering a CAGR of 9.53% during 2026–2035. Demand comes from bakers, cereal and snack makers, beverage and dairy processors, supplement brands and stockfeed mills that add fiber, replace sugar solids or balance rations. New South Wales and Australian Capital Territory held the largest regional share, 33.7% in 2025, because it is the most populous zone and New South Wales grows most of the national maize crop. Western Australia, South Australia and Northern Territory is the fastest-growing region at 9.88% a year, as Western Australia adds people faster than any other state. At the same time, food ministers have asked the national food regulator to prepare a mandatory front-of-pack star rating, in which fiber counts in a product's favor.
Which corn-derived fiber ingredients does the estimate cover?
The estimate measures the value of fiber ingredients made from maize and sold to Australian manufacturers. It counts soluble corn fiber made by converting and purifying corn starch, food-grade insoluble fiber separated from the bran and hull, and coarser corn bran sold to stockfeed mills, whether buyers order direct from producers, through ingredient distributors or through specialist formulation suppliers.
The estimate excludes corn starch, maltodextrin without a declared fiber content, corn syrups, whole grits and flours, and fibers made from wheat, oats, chicory or other crops. The value chain runs from maize growers and local dry millers or overseas wet millers through importers and distributors to the food, supplement, pharmaceutical and feed plants that blend the fiber into finished products.
Australia Corn Fiber Market Insights
- The Australia corn fiber market was valued at USD 19.5 million in 2025 and is projected to reach USD 63.5 million by 2035, registering a CAGR of 9.53% during 2026–2035.
- New South Wales and Australian Capital Territory held a 33.7% share of 2025 value, because it is the most populous zone and New South Wales supplies most domestic maize.
- Soluble corn fiber led with a 56.0% share of 2025 value, because food makers use it to add declared fiber and replace sugar solids at low use levels.
- Food ministers asked the national food regulator in February 2026 to prepare a mandatory Health Star Rating, after voluntary uptake reached only 39% of products.
- Sugar-reduction bulking grows fastest at 10.37% a year during 2026–2035, as cereal, bar, dairy and drink makers work toward national sugar reformulation targets.
Soluble grades lead while sugar-reduction uses grow fastest
Why does soluble corn fiber take most of the value?
Based on product type, the market is categorized into soluble corn fiber, food-grade insoluble corn fiber and feed-grade corn bran. Soluble corn fiber led with a 56.0% share of 2025 value, because imported soluble grades sell at many times the price of bran and dissolve clear in drinks and dairy. Soluble corn fiber grows fastest at 9.96% a year, as reformulated cereals, bars and supplements take larger volumes.
How does fiber enrichment anchor ingredient demand?
Based on application, the market is categorized into dietary fiber enrichment, sugar-reduction bulking, texture management and animal ration formulation. Dietary fiber enrichment led with 38.0% of 2025 value, because manufacturers need measured fiber to qualify for nutrition content claims. Sugar-reduction bulking grows fastest at 10.37% a year, as low-sugar formulations need a soluble ingredient that replaces the bulk and body of sugar.
Why do food and beverage makers buy the most fiber?
Based on customer type, the market is categorized into food and beverage manufacturers, supplement manufacturers, animal feed manufacturers and pharmaceutical formulators. Food and beverage manufacturers led with a 52.0% share of 2025 value, because cereals, breads, snacks and dairy carry most fiber claims. Supplement manufacturers grow fastest at 10.52% a year, as gut health powders, capsules and gummies widen their ranges.
How do ingredient distributors reach smaller processors?
Based on sales channel, the market is categorized into direct manufacturer supply, ingredient distribution and specialist formulation supply. Ingredient distribution led with a 50.0% share of 2025 value, because most soluble fiber arrives as imported bags sold through local stockists to mid-sized processors. Specialist formulation supply grows fastest at 10.06% a year, as supplement and medicine brands buy blended premixes with documented specifications.
| Segment Group | Leading Sub-segment | Share, 2025 | Fastest-growing Sub-segment | CAGR, 2026–2035 |
|---|---|---|---|---|
| By Product Type | Soluble corn fiber | 56.0% | Soluble corn fiber | 9.96% |
| By Application | Dietary fiber enrichment | 38.0% | Sugar-reduction bulking | 10.37% |
| By Customer Type | Food and beverage manufacturers | 52.0% | Supplement manufacturers | 10.52% |
| By Sales Channel | Ingredient distribution | 50.0% | Specialist formulation supply | 10.06% |
Request a Free Sample
Fill in your details and we'll send you a free sample report.
- Sample data tables & charts
- Research methodology
Fiber claims, sugar cuts and local maize supply lift use
How does the national fiber gap drive reformulation?
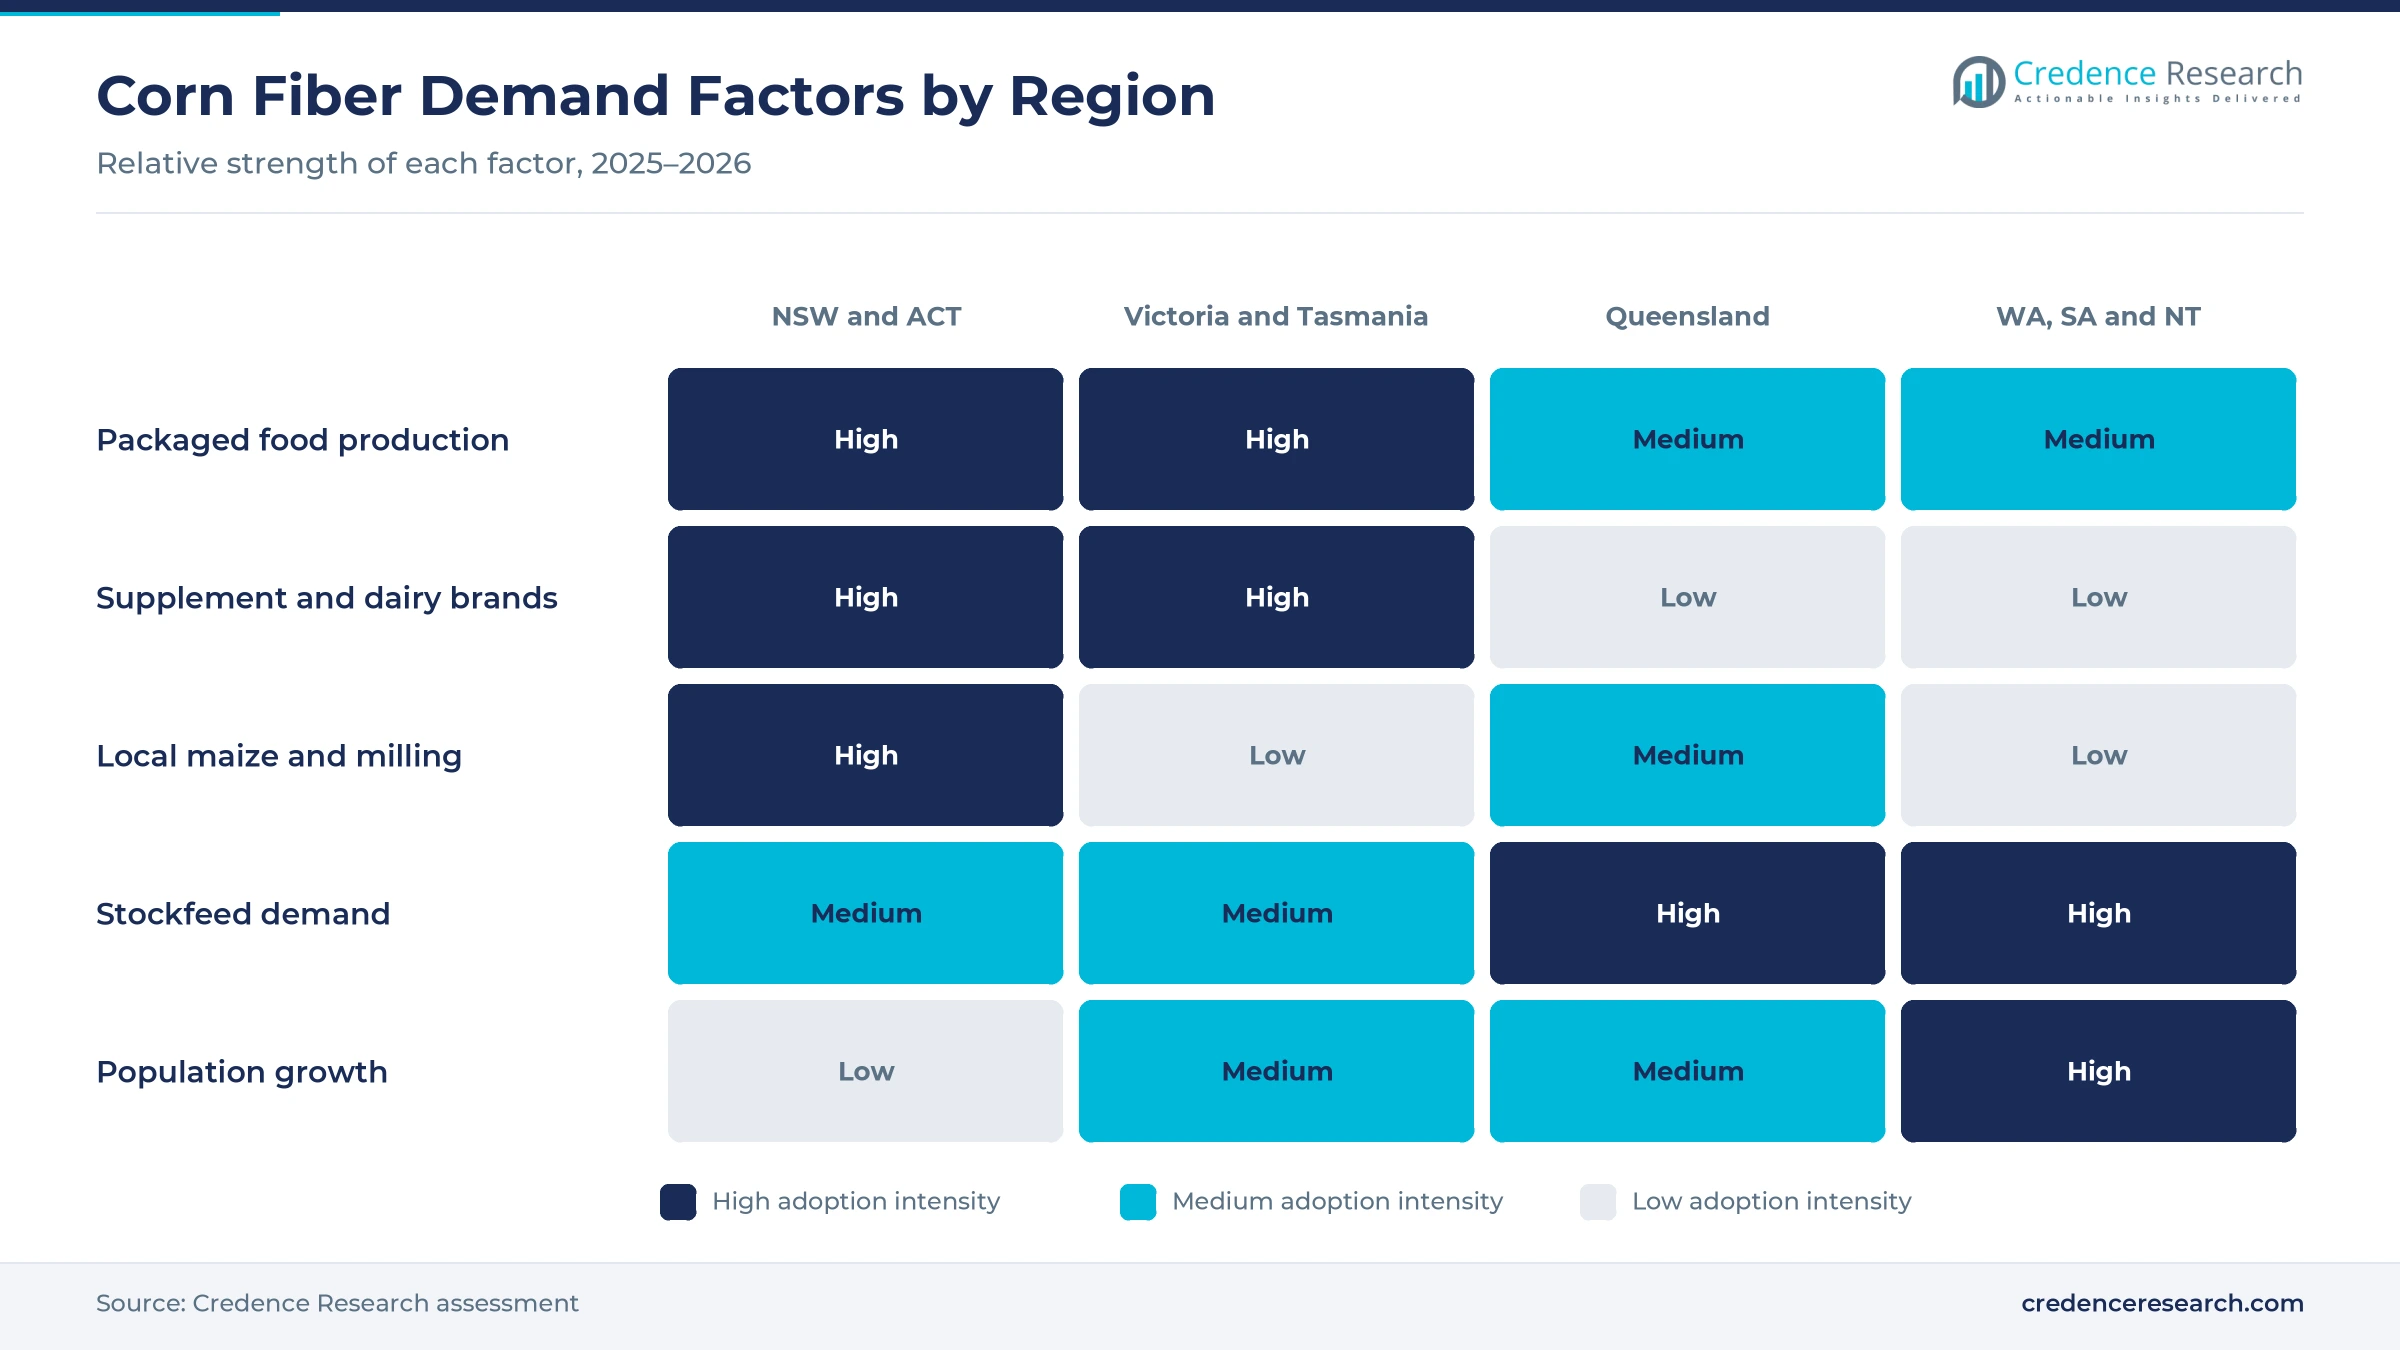
Most Australians eat less fiber than health authorities recommend, so food makers add concentrated fiber to familiar products instead of asking shoppers to change diets. An analysis of the 2011–12 national nutrition survey, published by the National Library of Medicine, found an energy-adjusted mean adult intake of 23.8 grams a day and that only 17.0% met the suggested dietary target. The adequate intake is 25 grams for women and 30 grams for men, the same study notes. The Australian Bureau of Statistics reported in September 2025 that discretionary foods still supplied 31.3% of energy intake in 2023. As a result, soluble corn fiber holds 56.0% of 2025 value, because it raises declared fiber in breads, cereals and snacks without changing taste.
Why do sugar-reduced products need soluble fiber?
Removing sugar takes away bulk, sweetness and mouthfeel, so reformulated products need a low-sugar ingredient that fills the gap. The Healthy Food Partnership sets sugar targets in nine categories, including breakfast cereals, muesli bars, sweetened yogurt and flavored milk, according to the Australian Bureau of Statistics. Of 199 participating sugar products, 32% cut sugar between June 2021 and June 2023, and the share above its maximum target fell from 30% to 22%. Tate & Lyle says its PROMITOR soluble fiber W carries at least 85% fiber and under 2% sugars for sugar reduction in bars, drinks and confectionery. In turn, sugar-reduction bulking grows fastest at 10.37% a year during 2026–2035.
How do local maize and milling capacity shape supply?
Australia grows enough maize to feed local dry mills, which supply bran and coarse fiber, while most soluble grades arrive from overseas wet millers. The Australian Bureau of Statistics reported 447,027 metric tons of maize sold in 2023–24, up 16%, with New South Wales supplying 60% of the crop. Defiance Maize Products acquired a gritting mill at Darlington Point in New South Wales in January 2022, Grain Central reported, adding to a Warwick mill in Queensland that processes about 35,000 metric tons a year. Grain Central also reported in October 2019 that Ingredion announced it would stop production at its Lane Cove corn mill in Sydney. As a result, feed-grade corn bran and food-grade insoluble fiber can be sourced close to buyers, while imported soluble grades reach them mainly through ingredient distributors.
Why do supplement and medicine approvals widen use?
Approval for use in therapeutic goods lets fiber suppliers sell beyond food into capsules, powders and listed medicines, which pay higher prices per kilogram. ADM announced in September 2025 that its Fibersol fiber ingredient had been approved by the Therapeutic Goods Administration for use in listed medicines. Tate & Lyle announced on March 31, 2020 that a general level health claim for PROMITOR Soluble Fibre, supporting a positive change in gut microbiota, was published after self-substantiation. The Australian Bureau of Statistics counted about 1.3 million Australians with diabetes in 2022, 87.6% of them with type 2, which widens the audience for low-sugar, high-fiber products. In turn, supplement manufacturers grow fastest at 10.52% a year.
Fewer sugary drinks, star labels and gut health claims
How is the shift away from sugary drinks changing recipes?
Australians are drinking fewer sugar-sweetened beverages, which pushes drink and dairy brands toward low-sugar recipes that still need body and mouthfeel. The Australian Bureau of Statistics found that 28.9% of people aged 2 and over consumed sweetened beverages in 2023, down from 42.2% in 2011–12. The share drinking sugar-sweetened drinks fell to 20.9% from 34.1% over the same period. Even so, soft drinks alone still supplied 20.1% of free sugars, and free sugars made up 8.2% of energy intake. As a result, clear soluble corn fiber gains use in flavored waters, protein drinks and prebiotic dairy drinks that replace sugar with fiber.
Why does the rise of mandatory star labels favor fiber?
A mandatory front-of-pack rating would make every packaged product's fiber content visible in a single score, which rewards recipes with added fiber. The Health Star Rating calculation treats fiber and protein as positive components and sugar, sodium and saturated fat as risk nutrients, the program's website says. Cancer Council Australia reported on Feb. 16, 2026 that only 39% of products carried the rating, well short of a 70% target. The food regulator opened consultation on a mandatory system on May 8, 2026, with submissions closing on June 21, 2026. In turn, dietary fiber enrichment keeps the largest application share, 38.0% of 2025 value.
Can gut health claims open a premium supplement niche?
Fiber claims tied to digestion let brands charge more, and Australian rules set clear gram thresholds for each claim level. Schedule 4 of the Food Standards Code allows a fiber claim at 2 grams a serving, a good source claim at 4 grams and an excellent source claim at 7 grams. A claim that fiber contributes to regular laxation must meet the same general fiber conditions, the schedule says. Tate & Lyle serves Australian brand owners developing these products from a sales office in South Melbourne. Many of those brands already source prebiotic ingredients for digestive health ranges. As a result, specialist formulation supply grows at 10.06% a year, as gut health brands buy documented, claim-ready premixes.
Is there an opening for local bran in larger feed volumes?
Stockfeed demand has grown quickly, which gives local maize millers a nearby outlet for bran and hulls that would otherwise carry little value. Feed demand rose from about 5.5 million metric tons in 2018 to about 8.7 million metric tons in 2022–23, according to the International Feed Industry Federation's Australian update. The same update counts 137 accredited feed members across 188 sites. Cargill, present in Australia since 1967, runs grain, oilseed and storage businesses in five mainland states, its Australian website says. In turn, bran can sit alongside prebiotics in animal feed in pig and poultry rations, giving local millers a steady outlet even as feed loses value share.
Import reliance, crop pests and price gaps weigh on buyers
How does import reliance expose buyers to supply risk?
Most soluble corn fiber is made in large overseas wet mills, so Australian buyers face shipping delays, exchange rate swings and minimum order sizes. Ingredion's decision to stop production at its Lane Cove corn mill in Sydney removed a local source of corn-derived ingredients. As a result, smaller processors depend on distributors that hold limited stock. Suppliers respond with local warehousing and blended premixes, although lead times still stretch when global demand for fiber ingredients rises.
Why do crop pests unsettle local bran supply?
Local bran and insoluble fiber depend on each season's maize crop, which drought and pests can cut sharply. Queensland was the only state with falls in maize production, area and value in 2023–24, which the statistics bureau linked largely to fall armyworm. In turn, mills in Queensland must source grain from New South Wales or cut throughput. Feed buyers usually switch to sorghum or wheat bran, so corn bran loses volume in poor seasons.
How does the price gap with sugar slow adoption?
Soluble corn fiber costs more per kilogram than the sugar it replaces, so reformulation raises recipe costs for price-sensitive categories. In turn, private-label cereals, bars and drinks often adopt fiber only when a retailer or a target requires it. Suppliers respond with partial sugar replacement and blends with cheaper fibers, although margins remain thin in grocery lines where shoppers compare unit prices closely.
Why do tolerance and labeling rules add development time?
High doses of fermentable fiber can cause bloating, which limits how much a single serve can contain and complicates claims. As a result, developers must balance a 4-gram good source claim against digestive comfort in drinks and snacks eaten several times a day. Claim wording, fiber measurement methods and star rating changes all need checking before launch. Suppliers offer tolerance data and label guidance, but smaller brands still face longer development cycles.
New South Wales and Australian Capital Territory lead value
| Region | Value, 2025 (USD million) | Share, 2025 | CAGR, 2026–2035 |
|---|---|---|---|
| New South Wales and Australian Capital Territory | 6.6 | 33.7% | 9.18% |
| Victoria and Tasmania | 4.8 | 24.6% | 9.48% |
| Western Australia, South Australia and Northern Territory | 4.4 | 22.7% | 9.88% |
| Queensland | 3.7 | 19.0% | 9.78% |
Why do New South Wales and Australian Capital Territory lead?
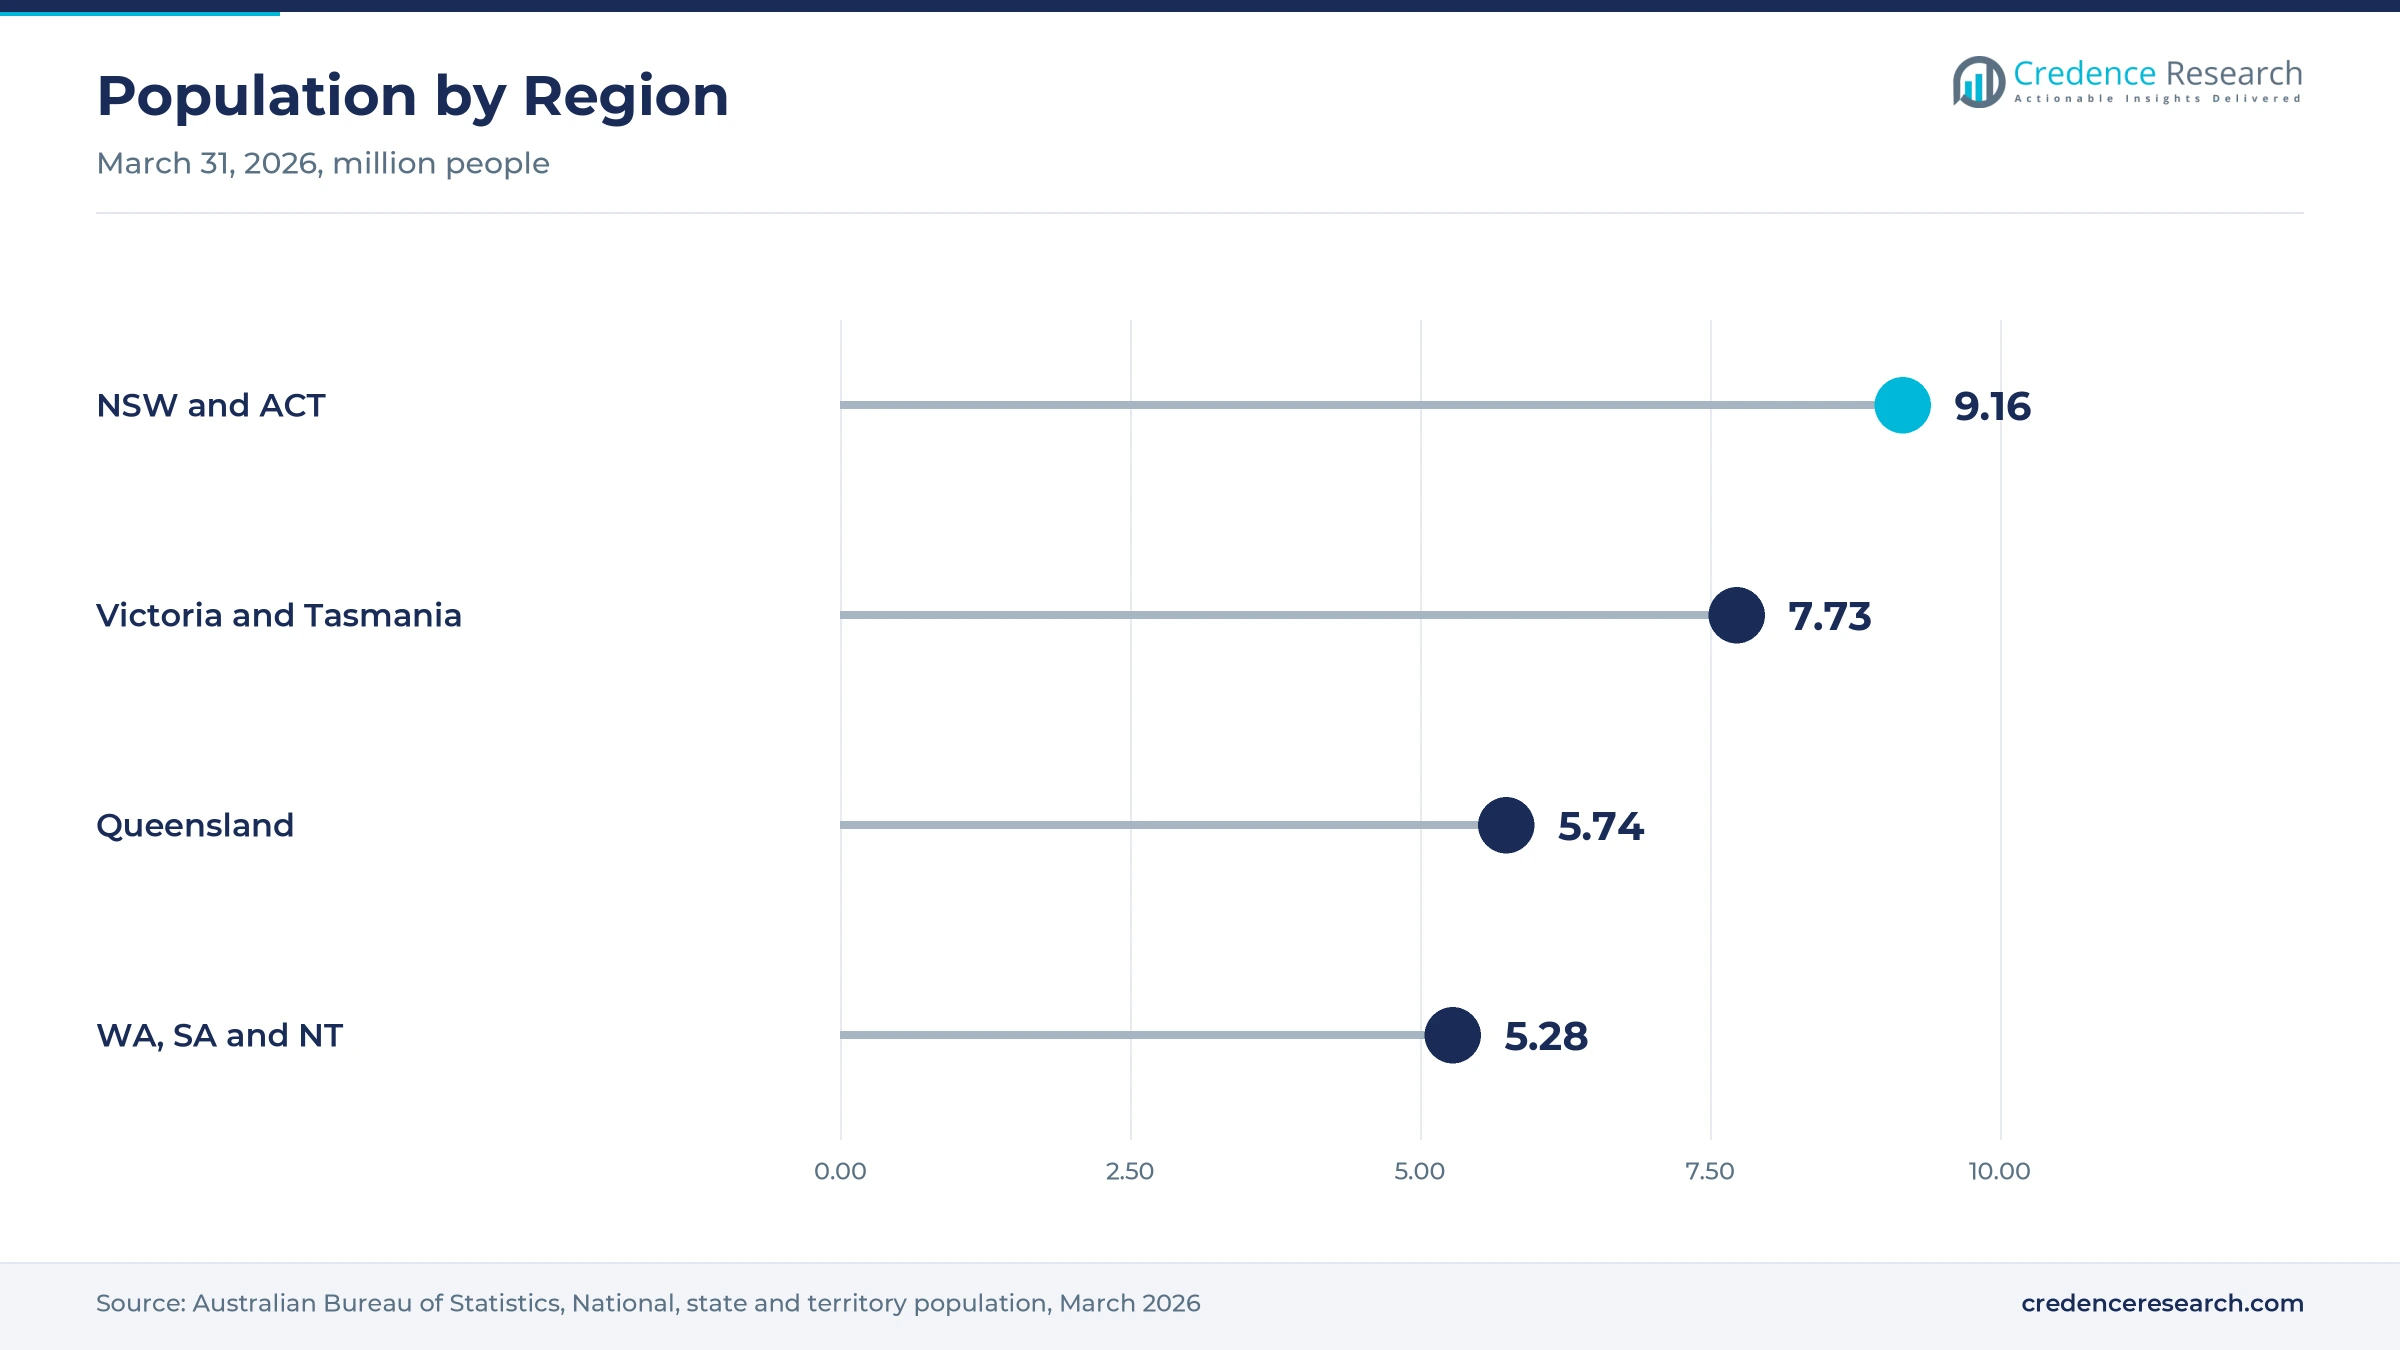
New South Wales and Australian Capital Territory held a 33.7% share of 2025 value and grows at 9.18% a year, because it is the most populous zone and the main maize-growing state. New South Wales grew 266,982 metric tons of maize in 2023–24, 60% of the national total, and the zone held about 9.16 million people in March 2026. As a result, local bran supply and large bakery and cereal plants sit close together.
Why is Victoria and Tasmania a dairy and supplement hub?
Victoria and Tasmania held a 24.6% share of 2025 value and grows at 9.48% a year, because it is the second most populous zone with about 7.73 million people. Victoria's population grew 1.6% in the year to March 2026, the Australian Bureau of Statistics reported. Tate & Lyle runs its regional sales office in South Melbourne. In turn, soluble fiber for flavored milk, yogurt and gut health powders takes a large share of zone demand.
How do western and southern states become the fastest zone?
Western Australia, South Australia and Northern Territory held a 22.7% share of 2025 value and grows fastest at 9.88% a year. Western Australia's population grew 2.1% in the year to March 2026, the fastest of any state. The zone held about 5.28 million people, and Perth's growth adds shoppers for packaged foods and supplements. As a result, both food and feed demand rise from a smaller base.
Why does Queensland combine milling and feed demand?
Queensland held a 19.0% share of 2025 value and grows at 9.78% a year, because the state combines maize milling, feedlots and growing food production. Defiance Maize Products runs a Warwick mill that processes about 35,000 metric tons of maize a year. The state population reached about 5.74 million in March 2026, growing 1.6%. However, the fall armyworm losses of 2023–24 show that local bran supply can swing sharply between seasons.
Novel food, medicine and labeling decisions since 2024
| Development | Status and market relevance |
|---|---|
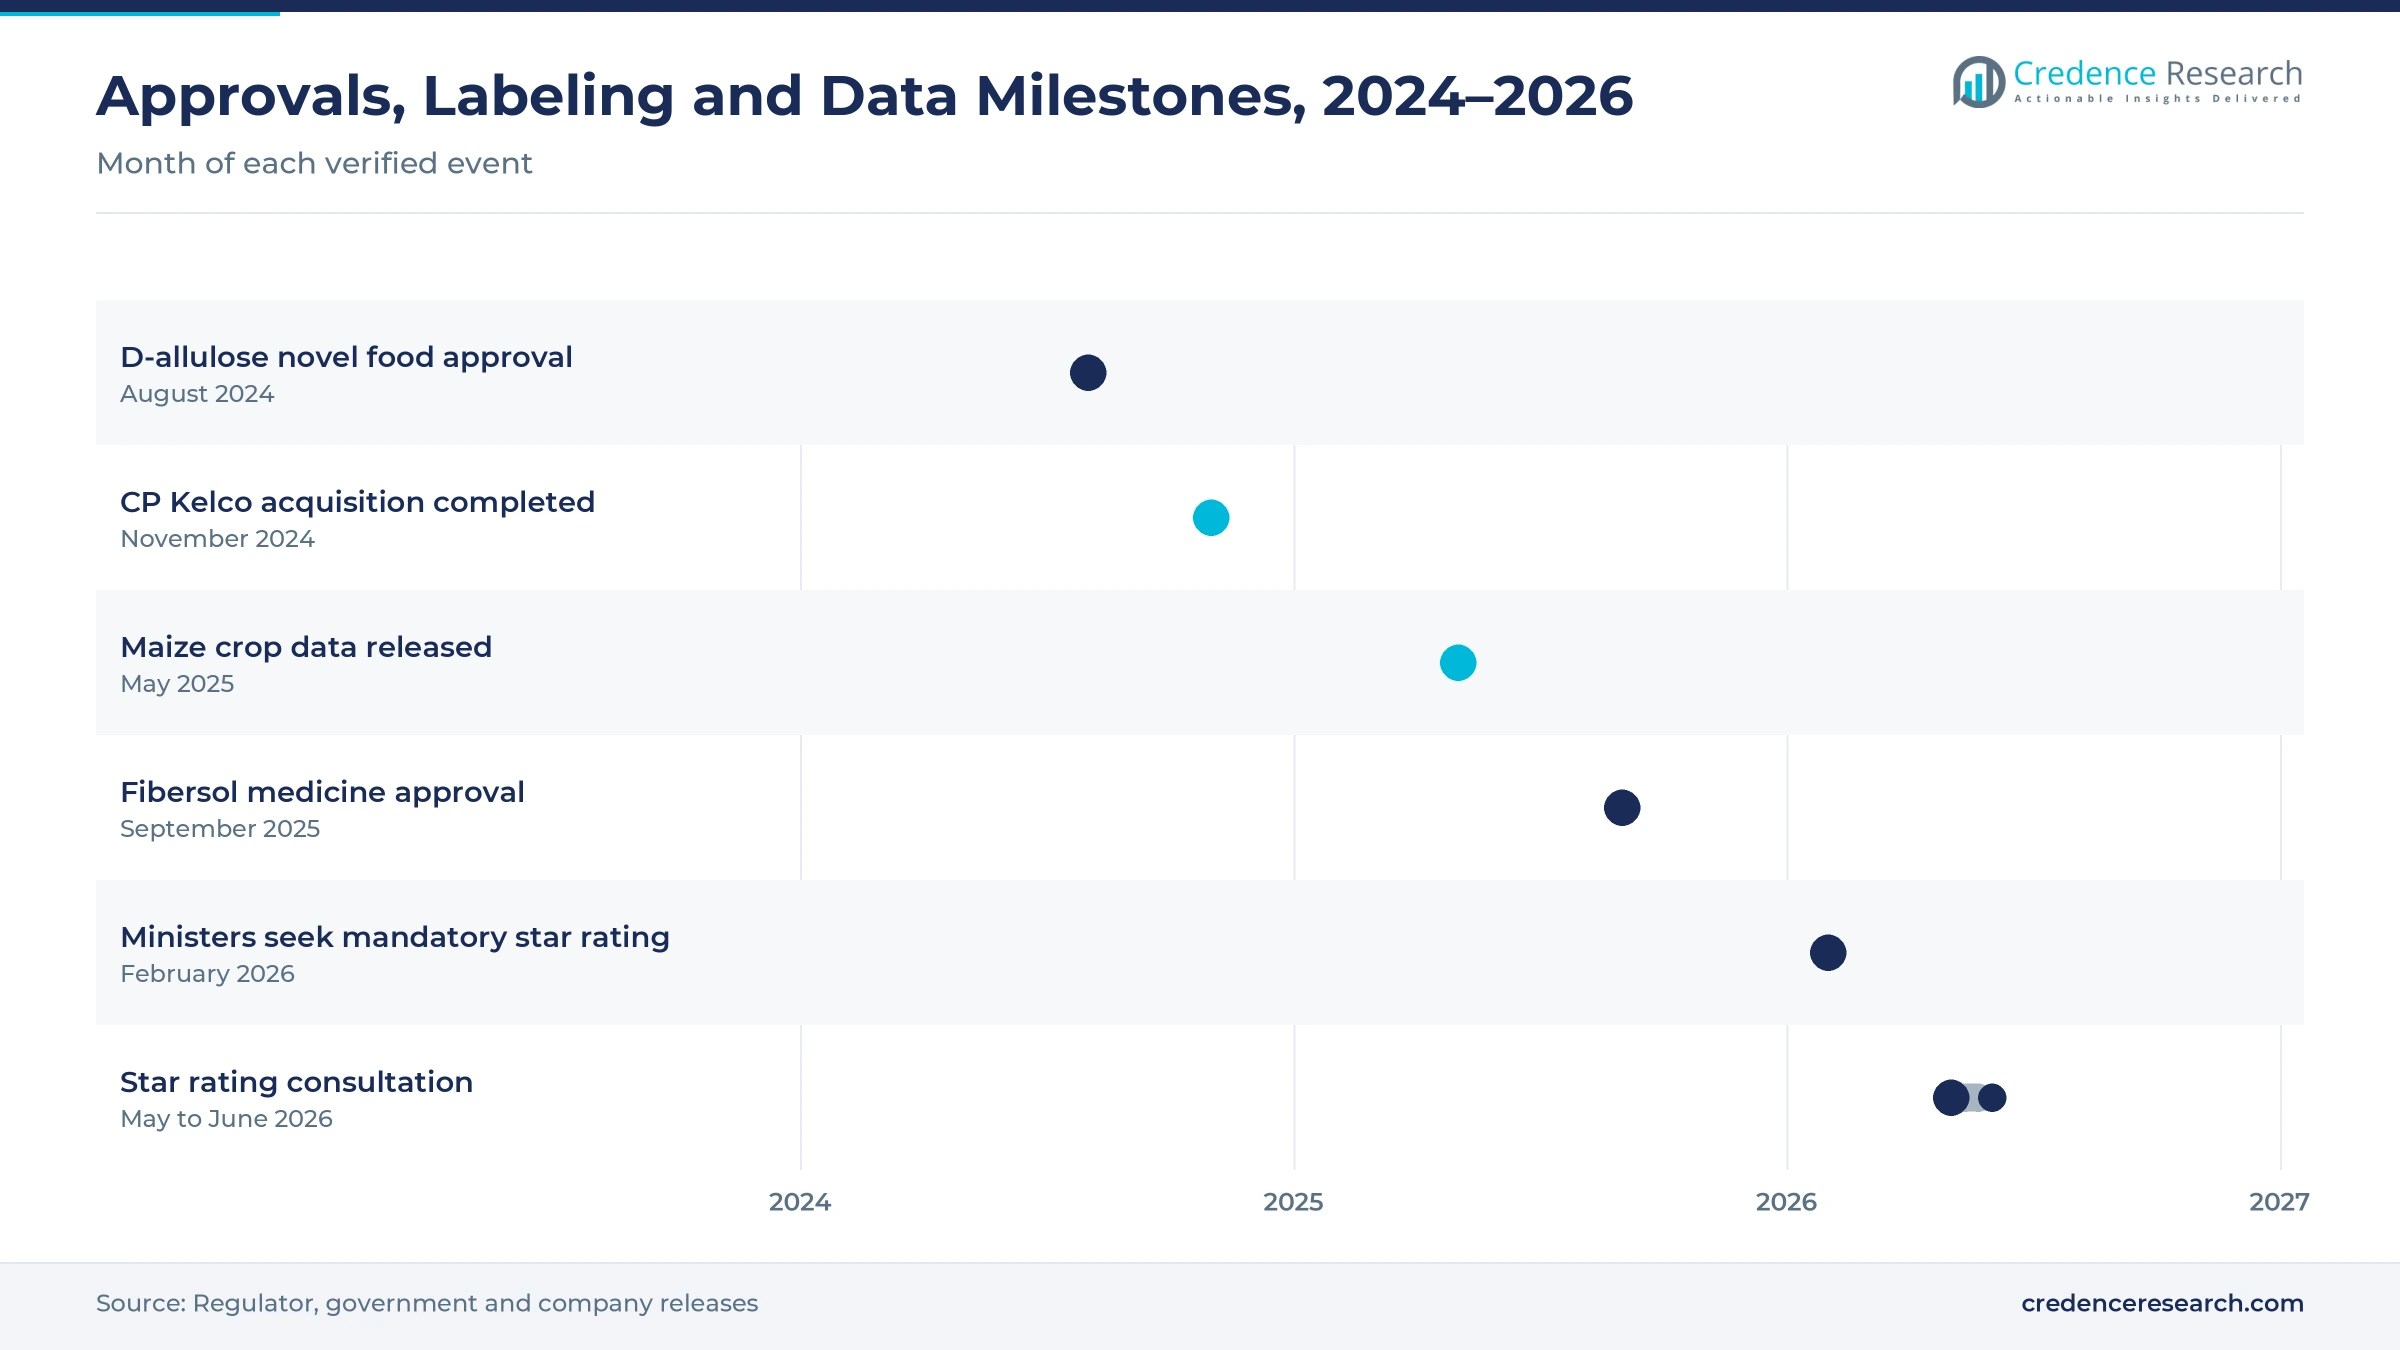
| In August 2024, the food regulator approved Samyang Corporation's application to permit D-allulose as a novel food. | Adds a sugar-replacing ingredient that often pairs with soluble fiber in reduced-sugar recipes |
| In November 2024, Tate & Lyle completed its acquisition of CP Kelco, a supplier of pectin and specialty gums. | Widens the texture and fiber toolkit offered to Australian food makers |
| In September 2025, ADM announced that its Fibersol fiber had gained approval from the Therapeutic Goods Administration. | Opens listed medicines and supplements to a soluble fiber ingredient |
| In February 2026, food ministers asked the national food regulator to prepare a mandatory Health Star Rating. | Raises the value of added fiber in front-of-pack scores |
| In May 2026, the food regulator opened consultation on Proposal P1067 for a mandatory Health Star Rating. | Submissions closed on June 21, 2026, and the proposal remains under assessment |
Milling route and purification set fiber purity
- Wet-milling separation steeps maize and splits it into starch, germ, gluten and fiber streams, which gives cleaner hull fiber for food use.
- Dry-fractionation separation mills dry kernels into grits, flour and bran, which suits local mills that sell bran to stockfeed buyers.
- Starch conversion and purification turns corn starch into soluble fiber through enzymes and refining, which yields grades of 70% to 90% fiber.
- Fiber analysis methods measure total dietary fiber for labels, which decides whether a product reaches the 2-gram, 4-gram or 7-gram claim level.
Need a Custom Version of This Report?
Tailor the scope, geography, or segments to your exact requirements.
- Custom geography or segment scope
- Direct access to our analyst team
Global ingredient majors compete through local sales teams
Competition is led by global ingredient companies that import soluble grades and support Australian brand owners through local sales and application teams. Tate & Lyle sells corn-based PROMITOR soluble fiber in grades of 70%, 85% and 90% fiber, and it holds a published gut health claim in Australia. ADM supplies Fibersol, which gained approval for Australian listed medicines in 2025. Samyang, which won approval for D-allulose in August 2024, competes on sugar-reduction systems that pair sweeteners with fiber. Cargill brings grain origination and food manufacturing supply from its long-standing Australian business. Local maize millers such as Defiance Maize Products sell bran into stockfeed. Suppliers compete on fiber purity, tolerance data, claim support and links with food additives sold to the same manufacturers.
Which suppliers lead fiber ingredient supply?
| Company | Type | Role in the market |
|---|---|---|
| Tate & Lyle | Global specialty ingredient supplier | Sells corn-based PROMITOR soluble fiber through its South Melbourne sales office |
| ADM | Global ingredient supplier | Supplies Fibersol, approved in 2025 for Australian listed medicines |
| Cargill | Grain and food ingredient group | Runs grain, oilseed and food supply businesses in Australia since 1967 |
| Samyang | Sweetener and ingredient maker | Gained Australian novel food approval for D-allulose in 2024 |
Credence Research view on Australian fiber ingredients
Credence Research's view is that Australian demand for corn fiber will grow quickly because a national fiber gap, sugar targets and front-of-pack labeling all reward recipes with added fiber. Soluble corn fiber stays the largest product type, while sugar-reduction bulking and supplement uses grow fastest. Local maize mills give a secure base for bran and insoluble grades, although soluble supply still depends on imports. Suppliers that combine claim support, tolerance data and local stock should win the most reformulation projects by 2035, especially if the Health Star Rating becomes mandatory.
How the national ingredient estimate was built
The report uses 2025 as the base year on a calendar basis, and market values come from the Credence Research model. That model combines official crop, population, nutrition survey and diabetes statistics, food regulator and legislation pages, feed industry data and company product information. Segment splits, regional shares and regional growth rates are Credence Research estimates. Sources used are government and regulator pages, statistical releases, a peer-reviewed study, company websites and trade media, and no interviews or surveys were used.
Reformulation and supplement demand carry growth to 2035
The Australia corn fiber market is expected to reach USD 63.5 million by 2035, a 9.53% CAGR during 2026–2035, as food makers add fiber and cut sugar across cereals, bars, dairy and drinks. Growth should be strongest in sugar-reduction bulking, supplement manufacturers and specialist formulation supply, because gut health products need documented, claim-ready ingredients. Import reliance, seasonal crop losses and the price gap with sugar could slow some adoption. A mandatory star rating and steady maize supply should still support demand through the forecast period.
Frequently Asked Questions
How big is the Australia corn fiber market?
Which product type leads corn fiber spending?
Which region leads the market?
Why do Australian food makers add fiber?
How do fiber claims work in Australia?
How does sugar reduction support demand?
Who are the leading companies in the market?
What are the main challenges for buyers?
Table of Content
Chapter 1 Market Segmentation
- 1.1 Segmentation Framework
- 1.1.1 Product and Service Classification
- 1.1.2 Application and End-Use Classification
- 1.1.3 Technology and Solution Classification
- 1.1.4 Customer and Distribution Channel Classification
- 1.1.5 Geographic Segmentation
- 1.1.6 Market Segment Definitions and Boundaries
- 1.2 By Product Type
- 1.2.1 Soluble corn fiber
- 1.2.2 Food-grade insoluble corn fiber
- 1.2.3 Feed-grade corn bran
- 1.3 By Application
- 1.3.1 Dietary fiber enrichment
- 1.3.2 Sugar-reduction bulking
- 1.3.3 Texture management
- 1.3.4 Animal ration formulation
- 1.4 By Customer Type
- 1.4.1 Food and beverage manufacturers
- 1.4.2 Supplement manufacturers
- 1.4.3 Animal feed manufacturers
- 1.4.4 Pharmaceutical formulators
- 1.5 By Sales Channel
- 1.5.1 Direct manufacturer supply
- 1.5.2 Ingredient distribution
- 1.5.3 Specialist formulation supply
Chapter 2 Introduction
- 2.1 Report Objectives and Scope
- 2.2 Product Definition and Industry Terminology
- 2.3 Market Inclusions and Exclusions
- 2.4 Research Process
- 2.4.1 Primary Research and Expert Interviews
- 2.4.2 Secondary Research and Source Review
- 2.4.3 Top-Down and Bottom-Up Estimation
- 2.4.4 Data Triangulation and Verification
- 2.5 Market Size Measurement Basis
- 2.5.1 2025: USD 19.5 million → 2035: USD 63.5 million
- 2.6 Historical and Forecast Reference Periods
- 2.6.1 Historical Period: 2018-2025
- 2.6.2 Base Year: 2025
- 2.6.3 Forecast Period: 2025-2035
- 2.7 Research Assumptions and Limitations
Chapter 3 Executive Summary
- 3.1 Market Snapshot and Key Findings
- 3.2 Base-Year Market Size, 2025
- 3.3 Forecast Market Size, 2035
- 3.4 Revenue and Volume Growth Outlook
- 3.5 Key Demand and Supply Indicators
- 3.6 Leading Market Segments
- 3.7 Fastest-Growing Market Opportunities
- 3.8 Regional Performance Highlights
- 3.9 Technology and Industry Transformation
- 3.10 Competitive Landscape Summary
- 3.11 Analyst View and Strategic Implications
Chapter 4 Australia Corn Fiber Market Trends and Developments
- 4.1 Historical Industry Development, 2018-2025
- 4.2 Recent Market Trends and Developments
- 4.3 Demand and Customer Behavior Trends
- 4.4 Technology and Product Innovation
- 4.5 Artificial Intelligence, Automation and Digitalization
- 4.6 Local Manufacturing and Supply Chain Realignment
- 4.7 Industry Partnerships, Mergers and Acquisitions
- 4.8 Sustainability and Circular Economy Developments
- 4.9 Government and Private Sector Investment Trends
- 4.10 Emerging Business Models and Commercialization
- 4.11 Industry Developments and Announcements
Chapter 5 Australia Corn Fiber Market Production, Supply and Demand Analysis
- 5.1 Demand Trend and Consumption Analysis, 2018-2025
- 5.2 Demand Forecast, 2025-2035
- 5.3 Production and Output Trend, 2018-2025
- 5.4 Production and Output Forecast, 2025-2035
- 5.5 Installed Capacity and Capacity Utilization
- 5.6 Company-Wise Production Plants and Statistics
- 5.6.1 Installed Production Capacity
- 5.6.2 Actual Production
- 5.6.3 Planned Capacity and Expansion Targets
- 5.7 Supply Chain Structure and Procurement Trends
- 5.8 Supply-Demand Gap and Bottlenecks
- 5.9 Import Dependence and Sourcing Structure
- 5.10 Contract Manufacturing and Outsourcing
- 5.11 Regional Supply and Demand Concentration
Chapter 6 Australia Corn Fiber Market Pricing Analysis
- 6.1 Pricing Structure and Measurement
- 6.2 Historical Pricing Trends, 2018-2025
- 6.3 Pricing Outlook, 2025-2035
- 6.4 Average Selling Price and Unit Economics
- 6.5 Pricing by Product and Market Segment
- 6.6 Geographic Pricing Differences
- 6.7 Key Input, Energy, Labor and Logistics Costs
- 6.8 Contract Pricing and Purchasing Models
- 6.9 Pricing Sensitivity and Competitive Positioning
- 6.10 Price, Margin and Profitability Implications
Chapter 7 Australia Corn Fiber Market Dynamics
- 7.1 Market Growth Drivers
- 7.1.1 Demand-Side Drivers
- 7.1.2 Technology and Innovation Drivers
- 7.1.3 Infrastructure and Investment Drivers
- 7.1.4 Regulatory and Policy Drivers
- 7.2 Market Restraints
- 7.2.1 Cost and Affordability Constraints
- 7.2.2 Technology and Adoption Barriers
- 7.2.3 Supply Chain and Operational Constraints
- 7.3 Market Challenges
- 7.3.1 Competitive Pressure and Margin Erosion
- 7.3.2 Skills, Infrastructure and Implementation Gaps
- 7.4 Emerging Market Opportunities
- 7.5 Market Dynamics Impact and Time-Horizon Assessment
Chapter 8 Australia Corn Fiber Value Chain Analysis
- 8.1 Industry Value Chain Overview
- 8.2 Upstream Suppliers and Critical Inputs
- 8.3 Technology and Component Providers
- 8.4 Manufacturing or Service Delivery
- 8.5 Distribution, Channel Partners and Integrators
- 8.6 Downstream Applications and End Users
- 8.7 Value Addition and Profit Pools
- 8.8 Vertical Integration and Outsourcing
- 8.9 Supplier Concentration and Risk
- 8.10 Supply Chain Localization and Resilience
Chapter 9 Australia Corn Fiber Market Regulations and Policies
- 9.1 Relevant Laws, Standards and Compliance Frameworks
- 9.2 Product, Service, Safety and Quality Requirements
- 9.3 Government Policies, Incentives and Subsidies
- 9.4 Imports, Exports and Trade Barriers
- 9.5 Public Procurement and Local Content Requirements
- 9.6 Environmental and Sustainability Compliance
- 9.7 Upcoming Policy Changes and Market Implications
Chapter 10 Australia Corn Fiber Market Hotspots and Opportunities
- 10.1 Market Opportunity Mapping and Growth Hotspots
- 10.2 High-Growth Applications and Customer Groups
- 10.3 Underserved Markets and White-Space Opportunities
- 10.4 Emerging Technology and Product Opportunities
- 10.5 New Capacity and Investment Hotspots
- 10.6 Market Entry and Expansion Opportunities
- 10.7 Distribution and Partnership Opportunities
- 10.8 Near-Term and Long-Term Commercial Potential
- 10.9 Opportunity Attractiveness and Execution Risks
Chapter 11 Australia Corn Fiber Market Outlook, 2025-2035
- 11.1 Market Size and Analysis
- 11.1.1 Revenue (Market Measurement: 2025: USD 19.5 million → 2035: USD 63.5 million)
- 11.1.2 Market Volume and Quantity Sold
- 11.1.3 Historical Market Size, 2018-2025
- 11.1.4 Base-Year Market Size, 2025
- 11.2 Market Forecast, 2025-2035
- 11.2.1 Revenue Forecast to 2035
- 11.2.2 Volume Forecast to 2035
- 11.2.3 CAGR and Year-on-Year Growth
- 11.2.4 Incremental Revenue Opportunity
- 11.3 Forecast Assumptions and Scenario Analysis
- 11.3.1 Base-Case Forecast
- 11.3.2 Optimistic and Conservative Scenarios
- 11.3.3 Technology, Pricing and Policy Sensitivities
- 11.4 Market Attractiveness and Growth Outlook
Chapter 12 Australia Corn Fiber Market Segmentation and Outlook
- 12.1 Segmentation Summary and Market Shares, 2025
- 12.2 Largest and Fastest-Growing Segments
- 12.3 By Product Type - Market Size and Forecast, 2025-2035
- 12.3.1 Segment Definition and Scope
- 12.3.2 Historical Market Size, 2018-2025
- 12.3.3 Revenue Forecast, 2025-2035
- 12.3.4 Volume Forecast, 2025-2035
- 12.3.5 Base-Year Market Share, 2025
- 12.3.6 Segment CAGR and Growth Drivers
- 12.3.7 Subsegment Market Size and Forecast
- 12.3.7.1 Soluble corn fiber
- 12.3.7.2 Food-grade insoluble corn fiber
- 12.3.7.3 Feed-grade corn bran
- 12.3.8 Subsegment Pricing and Adoption Trends
- 12.3.9 Leading Suppliers and Competition
- 12.3.10 Regional Demand and Opportunities
- 12.4 By Application - Market Size and Forecast, 2025-2035
- 12.4.1 Segment Definition and Scope
- 12.4.2 Historical Market Size, 2018-2025
- 12.4.3 Revenue Forecast, 2025-2035
- 12.4.4 Volume Forecast, 2025-2035
- 12.4.5 Base-Year Market Share, 2025
- 12.4.6 Segment CAGR and Growth Drivers
- 12.4.7 Subsegment Market Size and Forecast
- 12.4.7.1 Dietary fiber enrichment
- 12.4.7.2 Sugar-reduction bulking
- 12.4.7.3 Texture management
- 12.4.7.4 Animal ration formulation
- 12.4.8 Subsegment Pricing and Adoption Trends
- 12.4.9 Leading Suppliers and Competition
- 12.4.10 Regional Demand and Opportunities
- 12.5 By Customer Type - Market Size and Forecast, 2025-2035
- 12.5.1 Segment Definition and Scope
- 12.5.2 Historical Market Size, 2018-2025
- 12.5.3 Revenue Forecast, 2025-2035
- 12.5.4 Volume Forecast, 2025-2035
- 12.5.5 Base-Year Market Share, 2025
- 12.5.6 Segment CAGR and Growth Drivers
- 12.5.7 Subsegment Market Size and Forecast
- 12.5.7.1 Food and beverage manufacturers
- 12.5.7.2 Supplement manufacturers
- 12.5.7.3 Animal feed manufacturers
- 12.5.7.4 Pharmaceutical formulators
- 12.5.8 Subsegment Pricing and Adoption Trends
- 12.5.9 Leading Suppliers and Competition
- 12.5.10 Regional Demand and Opportunities
- 12.6 By Sales Channel - Market Size and Forecast, 2025-2035
- 12.6.1 Segment Definition and Scope
- 12.6.2 Historical Market Size, 2018-2025
- 12.6.3 Revenue Forecast, 2025-2035
- 12.6.4 Volume Forecast, 2025-2035
- 12.6.5 Base-Year Market Share, 2025
- 12.6.6 Segment CAGR and Growth Drivers
- 12.6.7 Subsegment Market Size and Forecast
- 12.6.7.1 Direct manufacturer supply
- 12.6.7.2 Ingredient distribution
- 12.6.7.3 Specialist formulation supply
- 12.6.8 Subsegment Pricing and Adoption Trends
- 12.6.9 Leading Suppliers and Competition
- 12.6.10 Regional Demand and Opportunities
- 12.7 Segment Growth Comparison
- 12.8 Segment Attractiveness and Priority Matrix
Chapter 13 Australia Corn Fiber End-Use and Application Market Outlook
- 13.1 End-Use Industry and Customer Demand Structure
- 13.2 Leading Applications and Customer Groups
- 13.3 End-Use Market Size, Share and Forecast
- 13.4 Major End-Use Industry Deep Dives
- 13.4.1 Customer Requirements and Use Cases
- 13.4.2 Demand and Replacement Cycles
- 13.4.3 Technical and Regulatory Considerations
- 13.4.4 Purchasing and Procurement Models
- 13.4.5 Leading Vendors and Distribution Channels
- 13.4.6 Forecast and Commercial Opportunities
- 13.5 Emerging Applications and Cross-Segment Demand
- 13.6 End-Use Industry Investment Priorities
Chapter 14 Australia Corn Fiber Geographic Market Outlook, 2025-2035
- 14.1 Domestic Market Distribution and Demand Clusters
- 14.2 State- or Province-Wise Market Size and Forecast, 2025-2035
- 14.3 City and Metropolitan Market Outlook
- 14.4 Industrial, Manufacturing and Commercial Clusters
- 14.5 Geographic Concentration of Key End Users
- 14.6 Local Pricing and Purchasing Differences
- 14.7 Domestic Production Facilities and Capacity Map
- 14.8 Local Infrastructure and Project Pipeline
- 14.9 State-Level Policy and Incentive Differences
- 14.10 Subnational Investment Hotspots and Opportunities
- 14.11 Distribution and Logistics Networks
- 14.12 Domestic Competitive Footprint
Chapter 15 Australia Corn Fiber Technology, Innovation and Sustainability Outlook
- 15.1 Technology Landscape and Maturity
- 15.2 Product, Process and Service Innovation
- 15.3 AI, Automation and Digital Tools in the Industry
- 15.4 Technology Adoption and Performance Benchmarking
- 15.5 Innovation Pipeline and R&D Investment
- 15.6 Patent and Intellectual Property Trends
- 15.7 Energy Efficiency and Resource Management
- 15.8 Sustainability, Recycling and Circularity
- 15.9 Technology Roadmap, 2025-2035
- 15.10 Risks of Obsolescence and Technology Substitution
Chapter 16 Australia Corn Fiber Market Key Strategic Imperatives
- 16.1 Growth and Market Entry Priorities
- 16.2 High-Return Products and Segments
- 16.3 Pricing, Profitability and Cost Optimization
- 16.4 Technology Investment and Product Differentiation
- 16.5 Supply Chain Localization and Resilience
- 16.6 Distribution and Customer Acquisition
- 16.7 Partnership, Acquisition and Capacity Strategy
- 16.8 Regional Expansion Priorities
- 16.9 Short-, Medium- and Long-Term Actions
Chapter 17 Competition Outlook
- 17.1 Industry Competition Characteristics
- 17.2 Market Structure and Concentration
- 17.3 Market Share and Competitive Positioning, 2025
- 17.4 Company-Wise Revenue and Product Benchmarking
- 17.5 Production and Service Capacity Benchmarking
- 17.6 Technology, Pricing and Differentiation
- 17.7 Regional Footprint and Distribution Strength
- 17.8 Mergers, Acquisitions and Strategic Alliances
- 17.9 New Entrants and Competitive Threats
- 17.10 Porter's Five Forces and Industry Attractiveness
- 17.11 Competitive Outlook, 2025-2035
Chapter 18 Company Profiles
- 18.1 Company Coverage and Selection Criteria
- 18.2 Tate & Lyle
- 18.2.1 Business Description
- 18.2.2 Company Ownership and Geographic Presence
- 18.2.3 Product and Service Portfolio
- 18.2.4 Manufacturing and Operating Footprint
- 18.2.5 Production Capacity and Expansion Plans
- 18.2.6 Financial Performance and Investment
- 18.2.7 Market Share and Competitive Position
- 18.2.8 Technology and Innovation Capabilities
- 18.2.9 Strategic Alliances or Partnerships
- 18.2.10 Recent Developments
- 18.2.11 Growth Strategy and Outlook
- 18.3 ADM
- 18.4 Cargill
- 18.5 Samyang
- 18.6 Matsutani Chemical Industry
- 18.7 Other Relevant Market Participants
Note: Every listed company is profiled on the structure shown under the first company. The company list is preliminary and may change based on research findings, market developments, data availability and client requirements.
Chapter 19 Disclaimer
- 19.1 Research and Forecast Disclaimer
- 19.2 Data Source and Estimation Limitations
Note: The depth of individual sections depends on data availability for this market. Volume, capacity, trade and other unit-based metrics are included where applicable.

