
Organic repeat buying and GM canola reshape non-GM demand
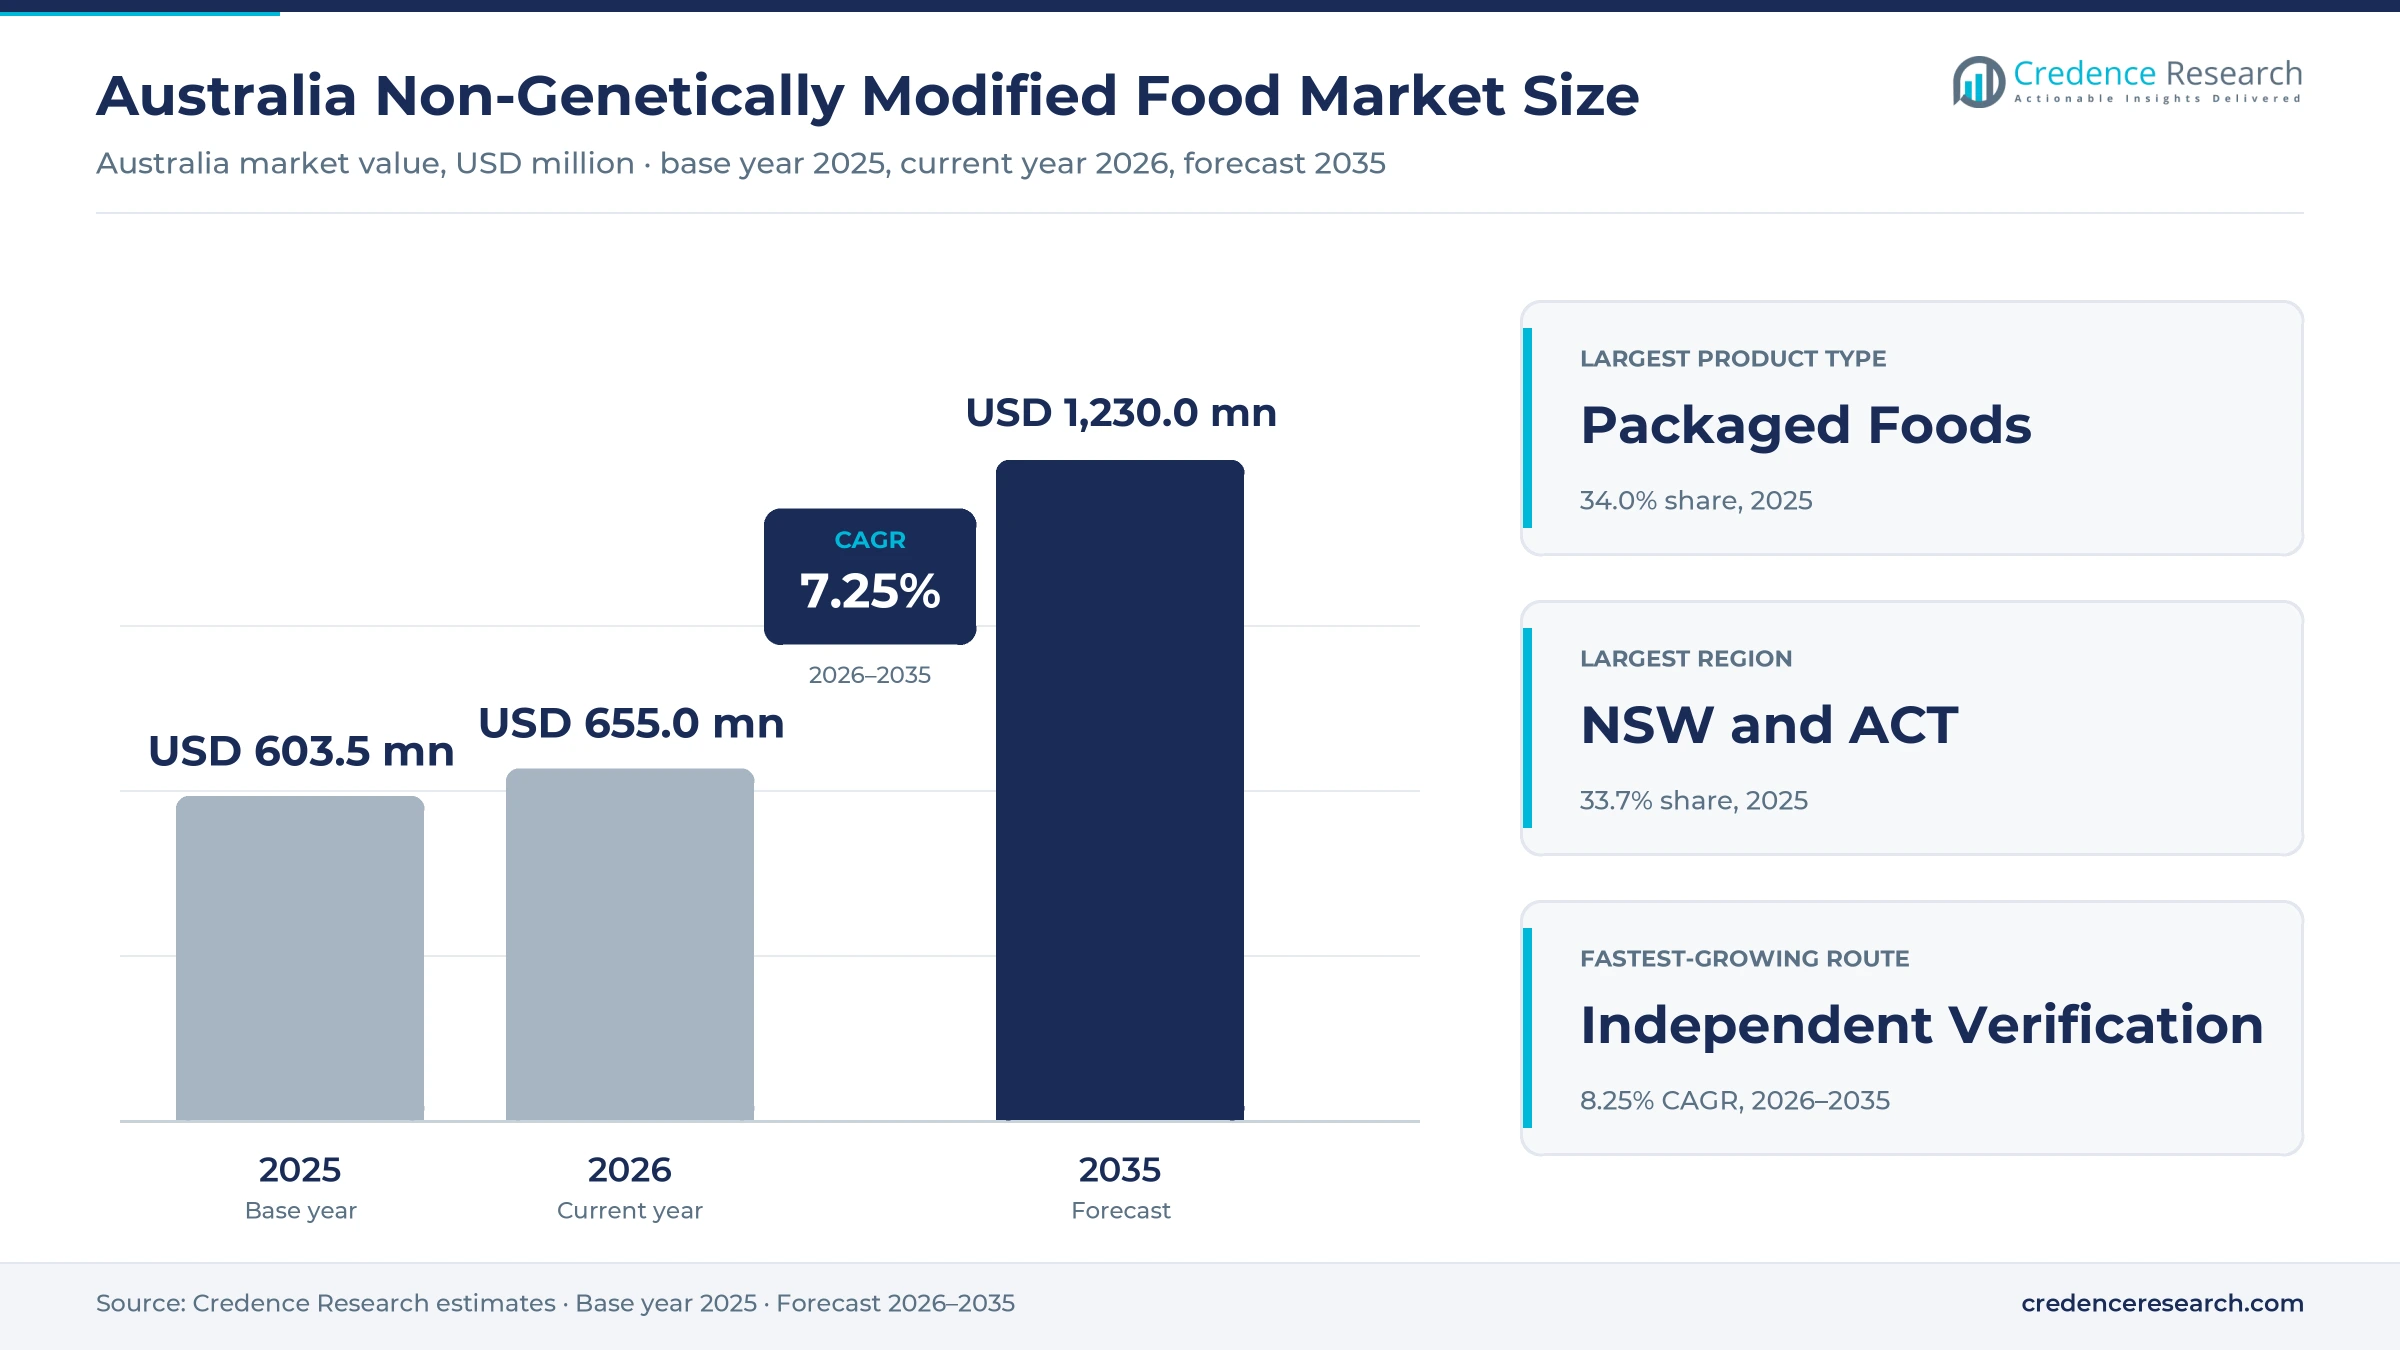
The Australia non-genetically modified food market was valued at USD 603.5 million in 2025 and is projected to increase from USD 655.0 million in 2026 to USD 1.23 billion by 2035, registering a CAGR of 7.25% during 2026–2035. Demand comes from households, cafes, caterers, schools and workplaces that choose packaged goods, plant milks, fresh produce and oils carrying certified organic, verified non-GM or supplier-backed claims. New South Wales and the Australian Capital Territory held the largest regional share, 33.7% in 2025, because the zone has the biggest population and the densest specialty retail network. Western Australia, South Australia and the Northern Territory form the fastest-growing region at 7.52% a year, helped by rapid population growth in Western Australia. In turn, the national food regulator's move to define genetically modified food by outcome rather than process is pushing brands toward independent verification of their non-GM promises.
Which foods and claims does this Australian estimate count?
The estimate measures retail and foodservice spending in Australia on packaged foods, dairy and beverages, fresh foods and proteins, and oils and specialty foods sold with a non-GM assurance. That assurance comes from organic certification, independent non-modification verification or documented supplier claims, and buyers include households, hospitality operators, workplaces and schools.
The estimate excludes conventional food sold without any non-GM claim, animal feed, seed for planting and export shipments. The value chain runs from certified farms, segregated grain handlers and oilseed pressers through processors, certifiers and wholesalers to supermarkets, specialty stores, online grocers and food service outlets.
Australia Non-Genetically Modified Food Market Insights
- The Australia non-genetically modified food market was valued at USD 603.5 million in 2025 and is projected to reach USD 1.23 billion by 2035, at a 7.25% CAGR during 2026–2035.
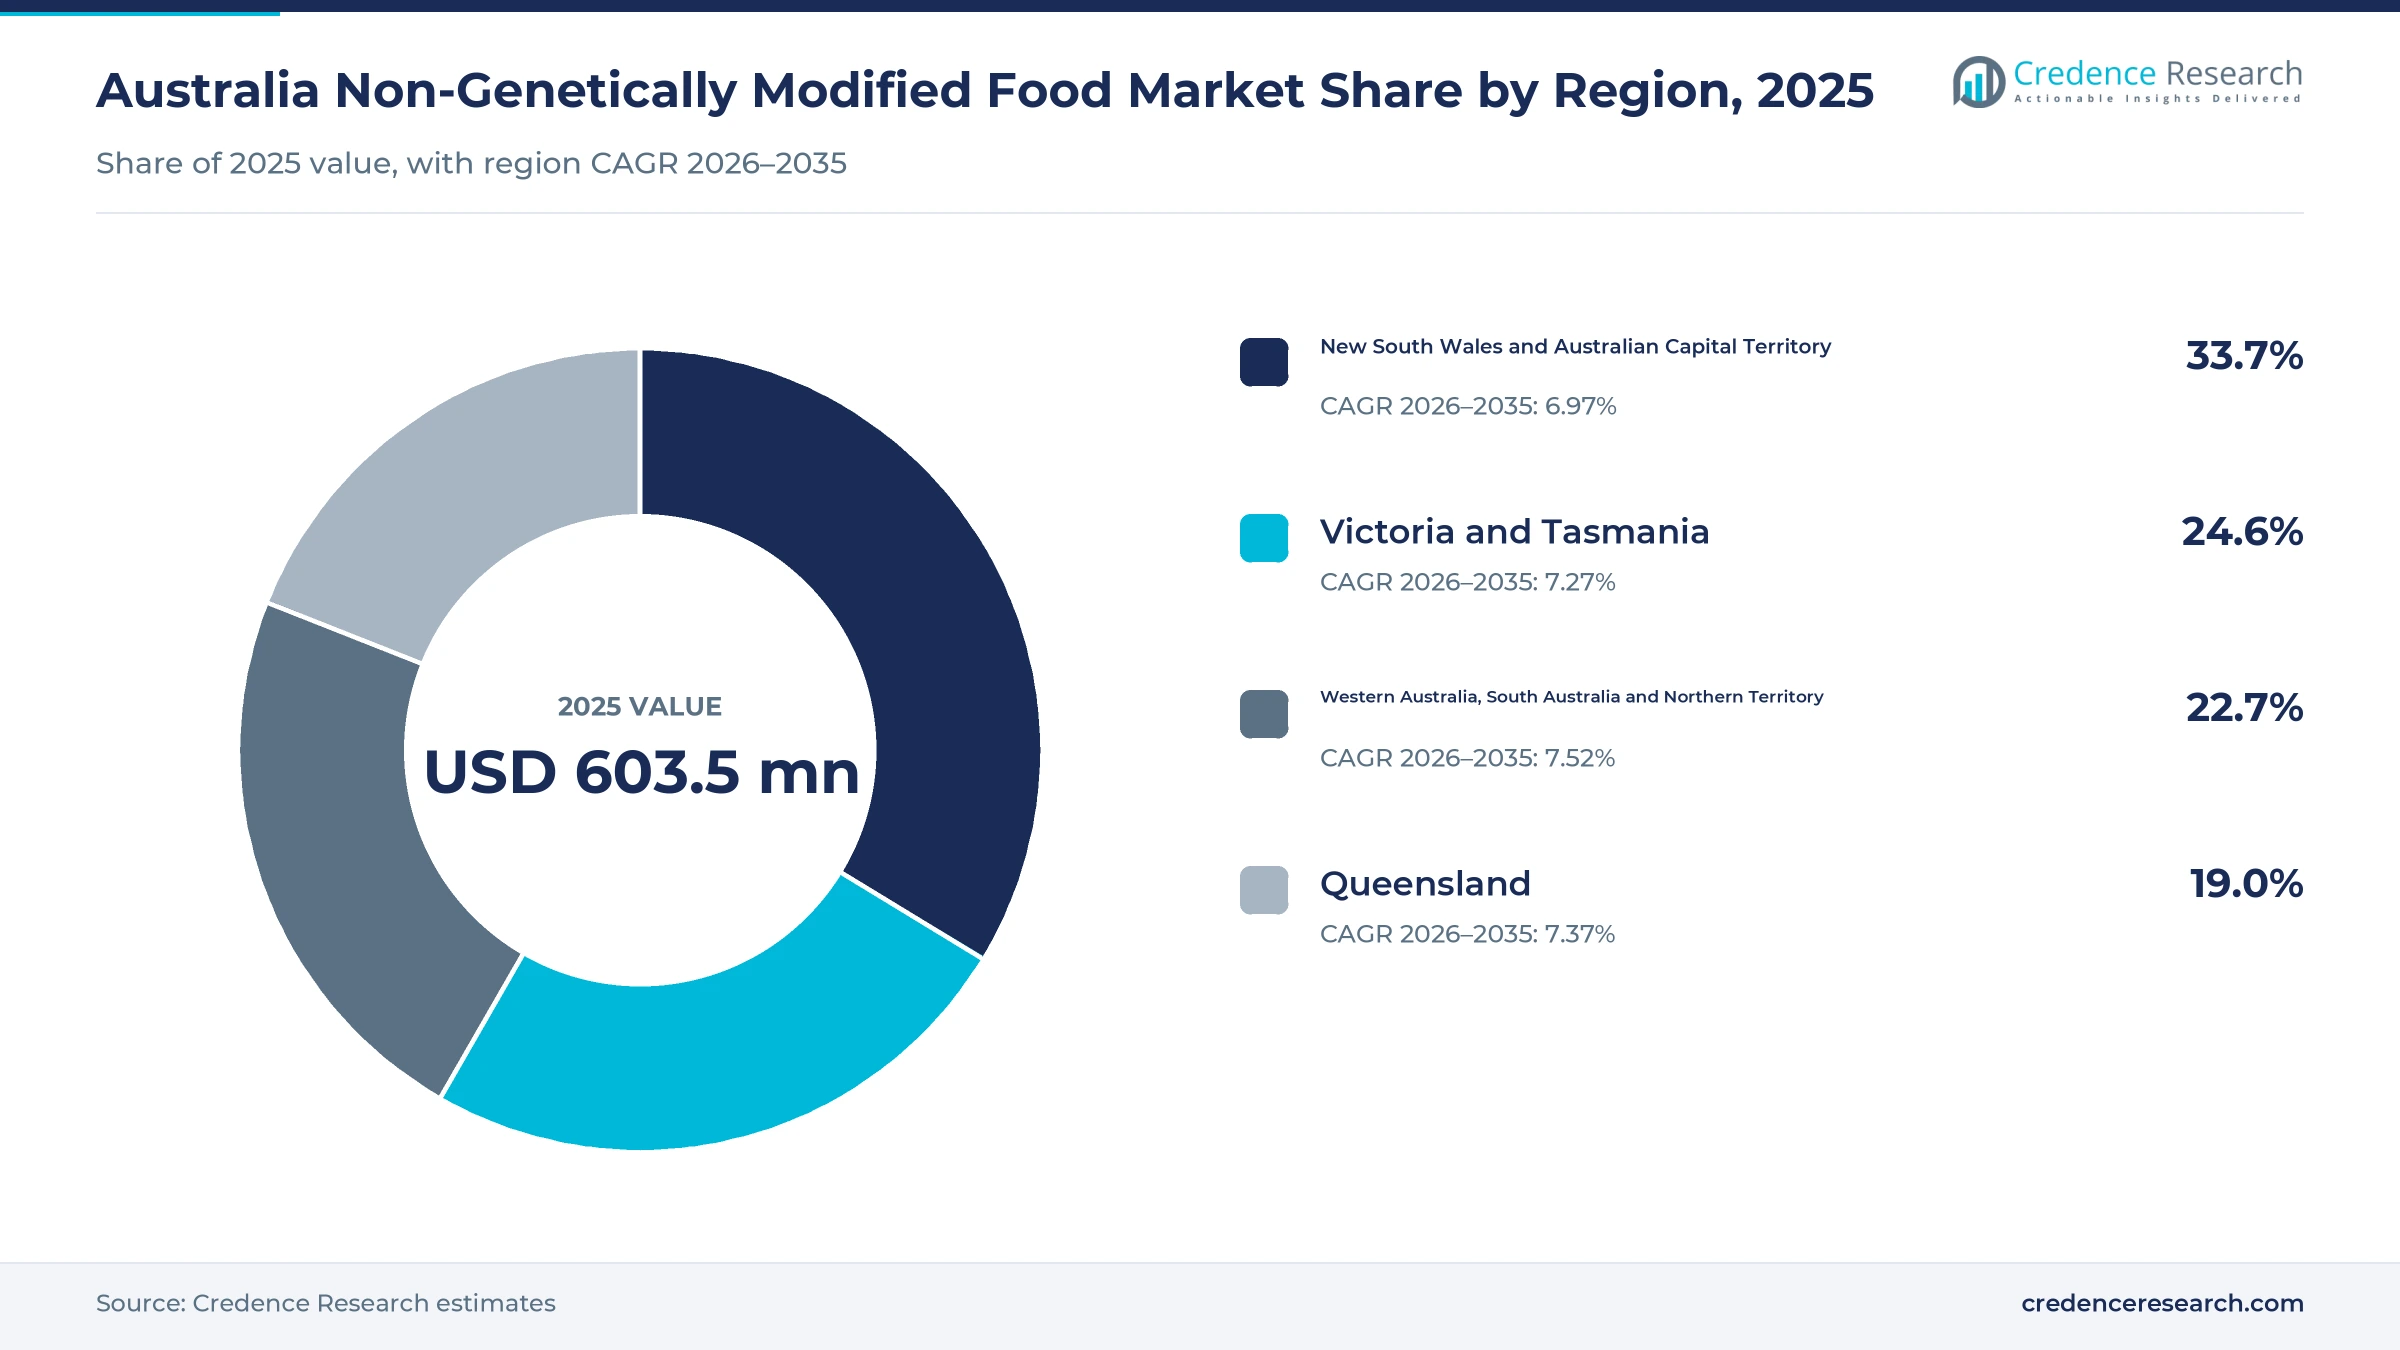
- New South Wales and the Australian Capital Territory held 33.7% of 2025 value, as the zone combines the largest population with dense specialty retail.
- Packaged foods led product types with 34.0% of 2025 value, because cereals, snacks and pantry staples carry certified organic and verified non-GM claims most often.
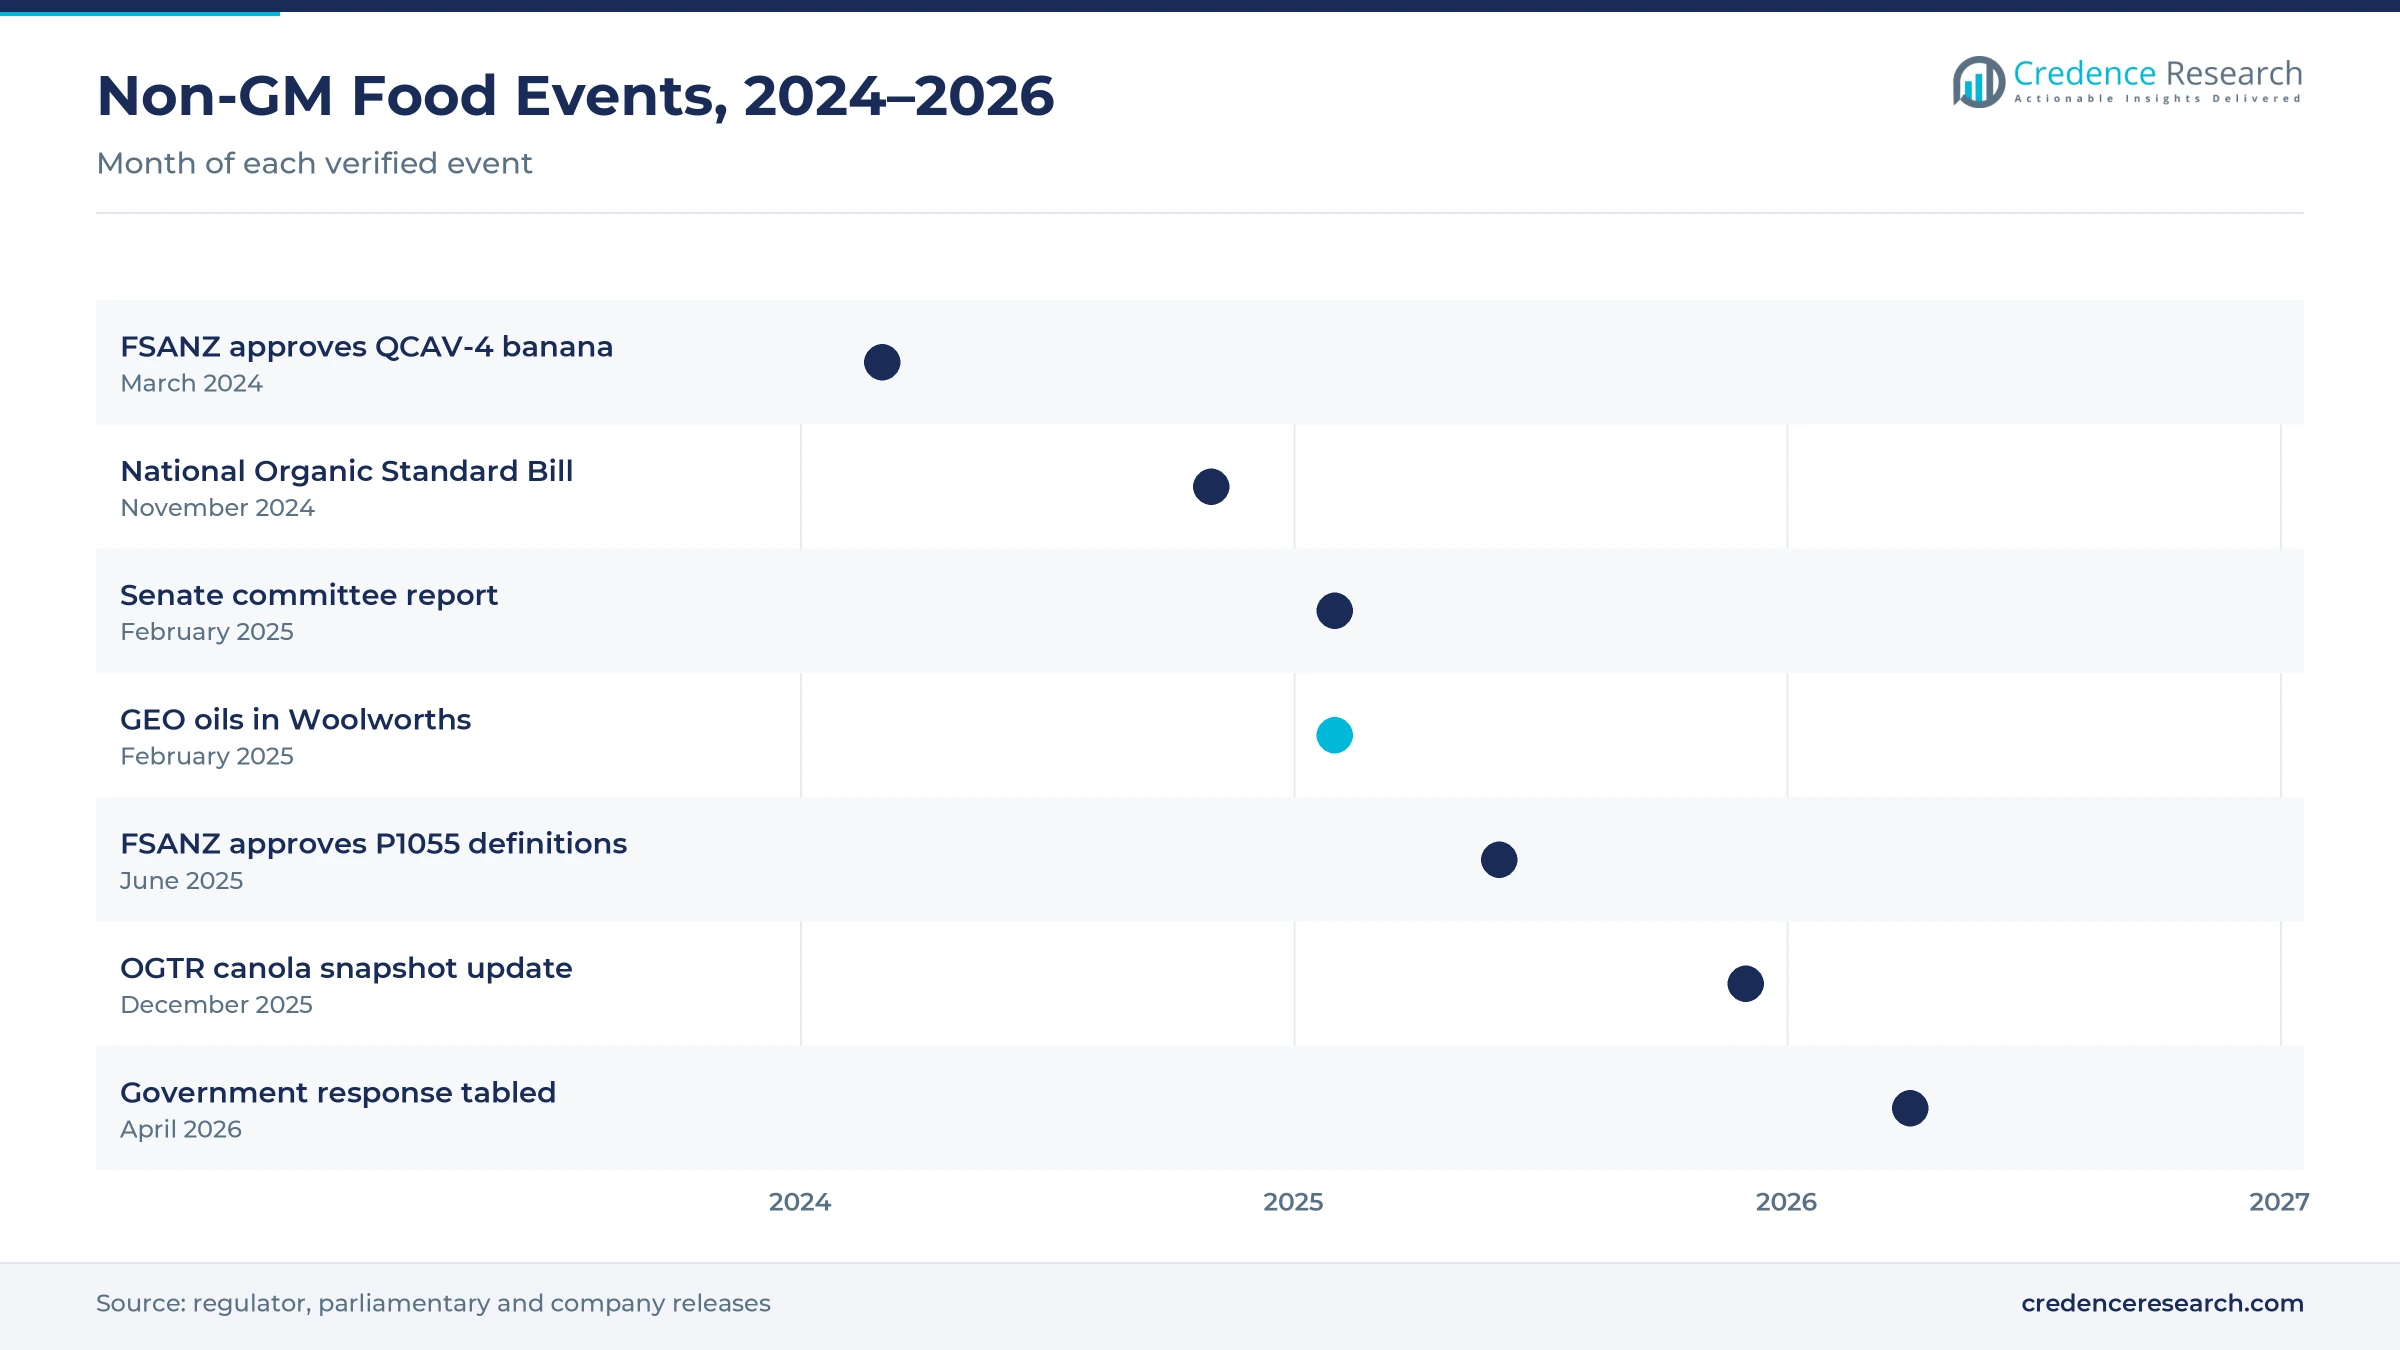
- The FSANZ Board approved outcome-based definitions for food produced using gene technology on June 4, 2025, while keeping mandatory GM labeling rules unchanged.
- Independent non-modification verification grows fastest among certification routes at 8.25% a year during 2026–2035, as brands seek proof beyond the absence of a label.
Packaged goods lead while verified oils grow fastest
Why do packaged goods carry most non-GM spending?
Based on product type, the market is categorized into packaged foods, dairy and beverages, fresh foods and proteins, and oils and specialty foods. Packaged Foods led with 34.0% of 2025 value, because cereals, flours, snacks and pantry staples are the items most often certified and bought every week. Oils and Specialty Foods grow fastest at 7.81% a year, as shoppers seek cold-pressed oils from segregated seed.
Which assurance route do shoppers trust most?
Based on certification route, the market is categorized into certified organic, independent non-modification verification and supplier-substantiated claims. Certified Organic led with 52.0% of 2025 value, because organic rules already exclude genetic modification and the logos are well known. Independent Non-Modification Verification grows fastest at 8.25% a year, as brands add tested proof to their packs.
Where do Australian buyers find non-GM products?
Based on distribution channel, the market is categorized into supermarket sales, specialty store sales, online sales and foodservice and ancillary outlet sales. Supermarket Sales led with 68.0% of 2025 value, because the major chains stock most certified ranges. Online Sales grow fastest at 8.81% a year, as shoppers compare certifications and ingredient details on screen before they buy.
Who buys the most non-GM food in Australia?
Based on customer type, the market is categorized into household purchasers, hospitality buyers and workplace and education buyers. Household Purchasers led with 78.0% of 2025 value, because most non-GM spending happens in the weekly grocery shop. Hospitality Buyers grow fastest at 7.66% a year, as cafes and restaurants add certified organic and verified ingredients to their menus.
| Segment Group | Leading Sub-segment | Share, 2025 | Fastest-growing Sub-segment | CAGR, 2026–2035 |
|---|---|---|---|---|
| By Product Type | Packaged Foods | 34.0% | Oils and Specialty Foods | 7.81% |
| By Certification Route | Certified Organic | 52.0% | Independent Non-Modification Verification | 8.25% |
| By Distribution Channel | Supermarket Sales | 68.0% | Online Sales | 8.81% |
| By Customer Type | Household Purchasers | 78.0% | Hospitality Buyers | 7.66% |
Request a Free Sample
Fill in your details and we'll send you a free sample report.
- Sample data tables & charts
- Research methodology
Organic loyalty, population and GM canola lift demand
Why does certified organic repeat buying anchor demand?
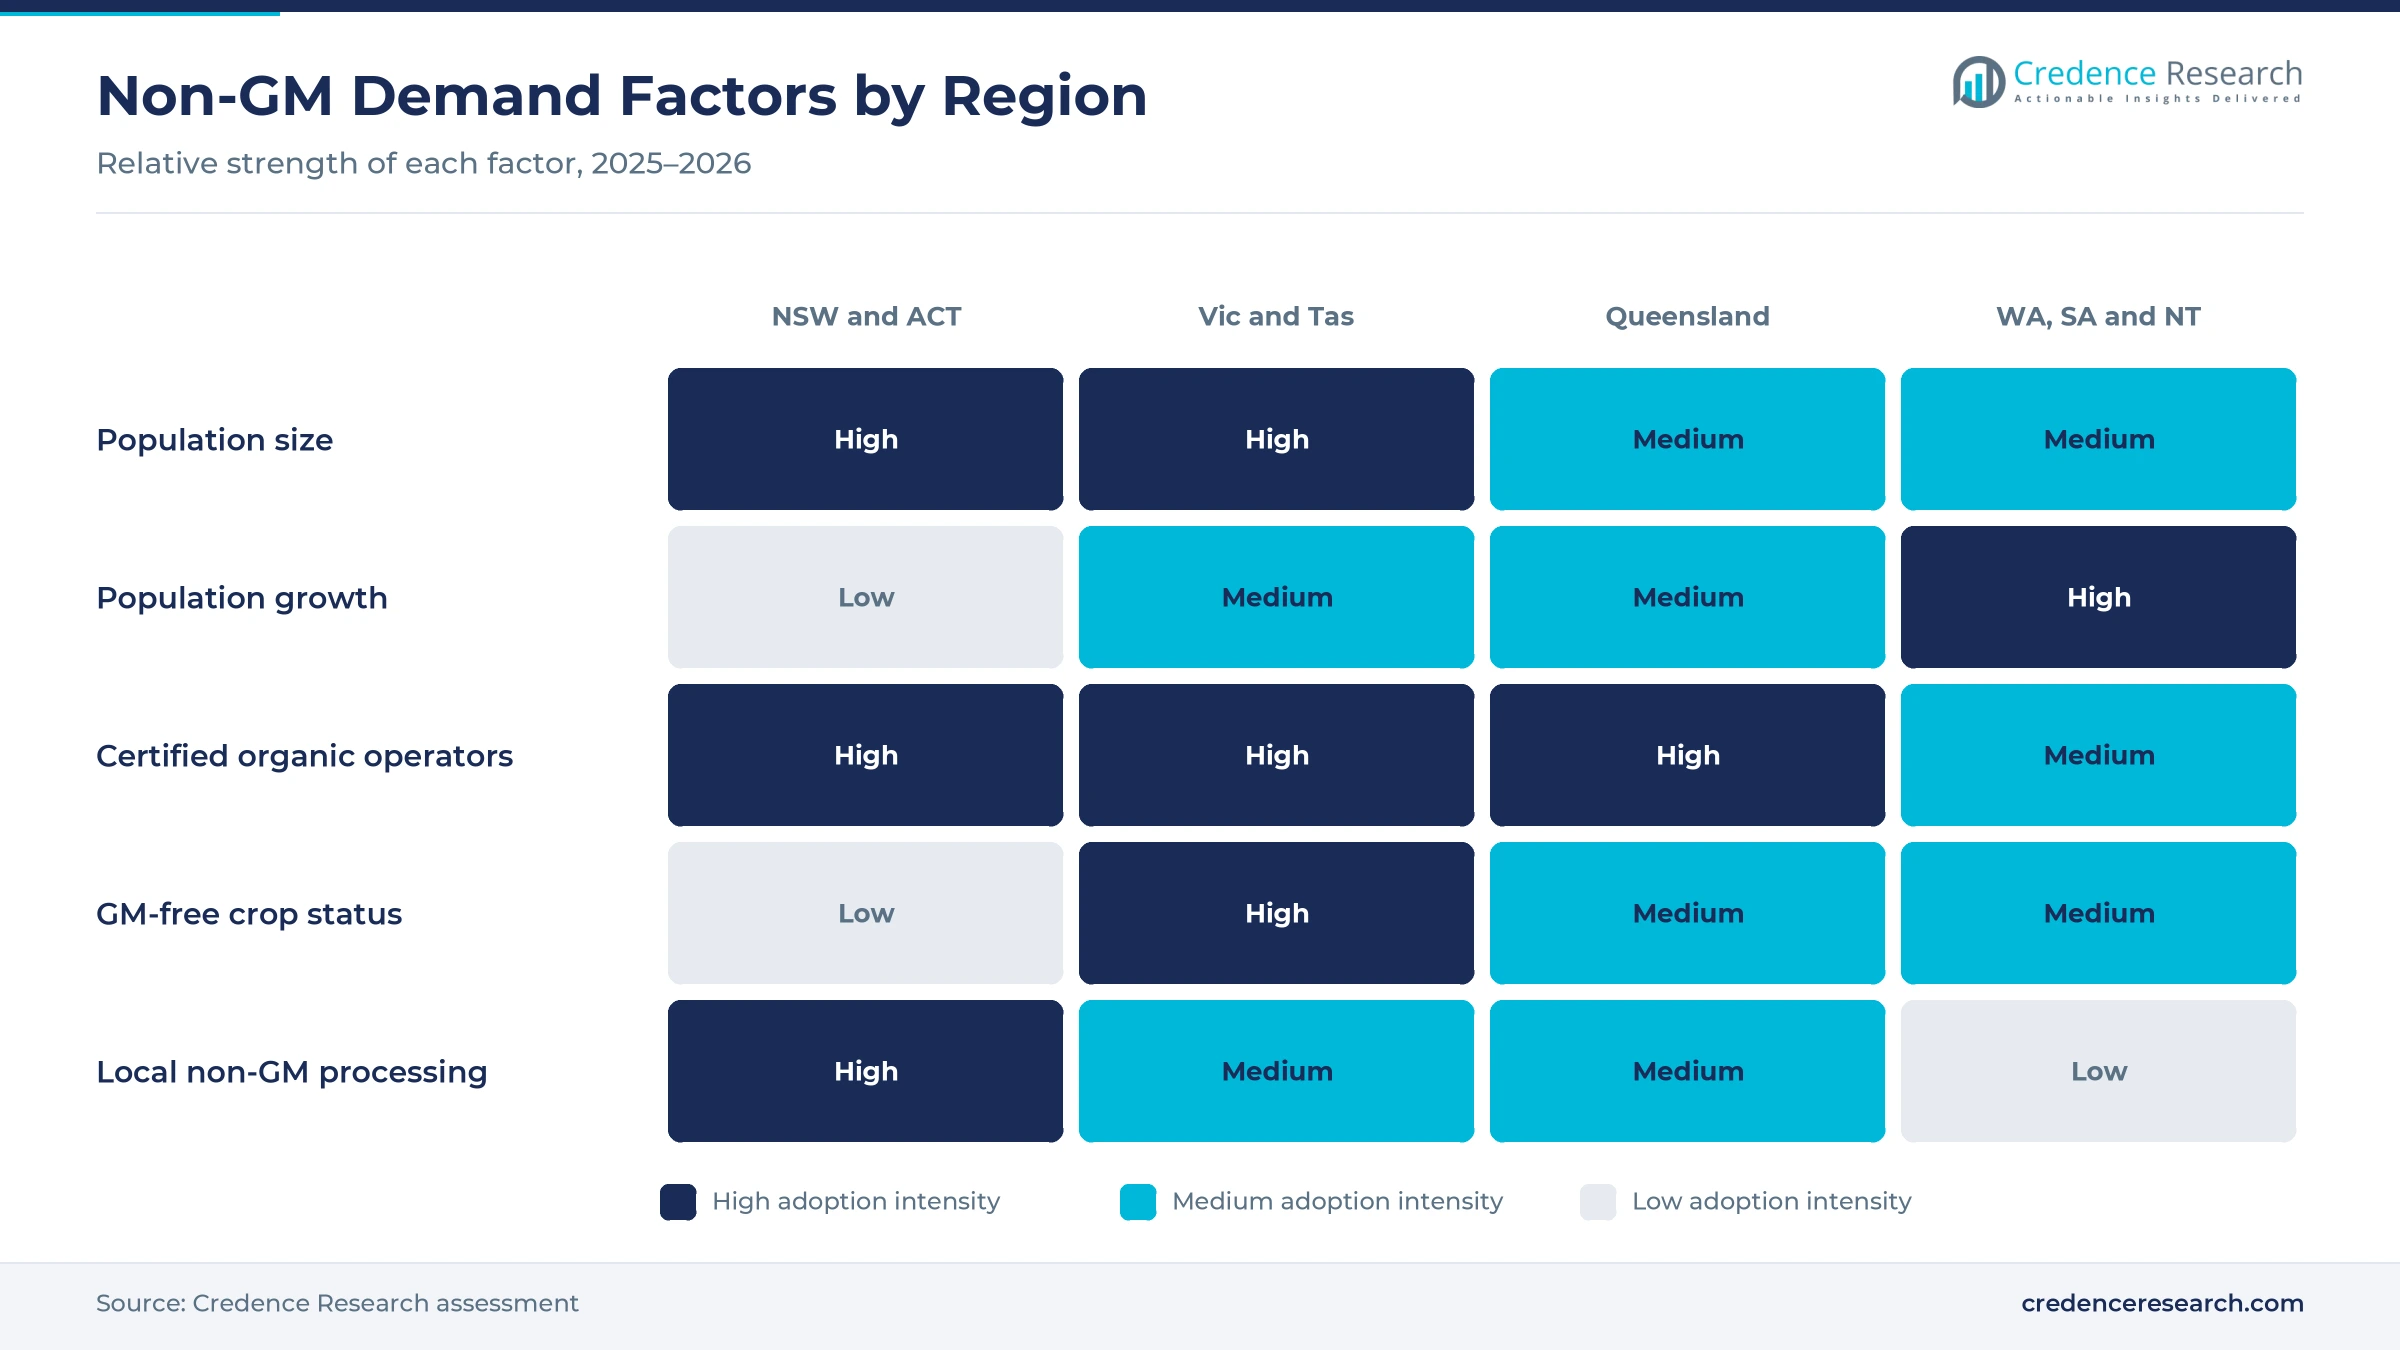
Organic certification gives shoppers the clearest assurance that an item was produced without genetic modification, so regular buyers of certified organic products form the core of this market. Domestic retail sales of certified organic products reached AUD 657.6 million in fiscal 2024-25, up 11.9%, according to Australian Organic Limited. About 76.8% of households, or 8.3 million, bought certified organic products that year, and average annual spend per buying household rose 9.9% to AUD 79.22. Major supermarkets carried 80% of those sales, which keeps repeat purchases inside the weekly shop. As a result, certified organic leads certification routes with 52.0% of 2025 value.
How does population growth widen the buyer base?
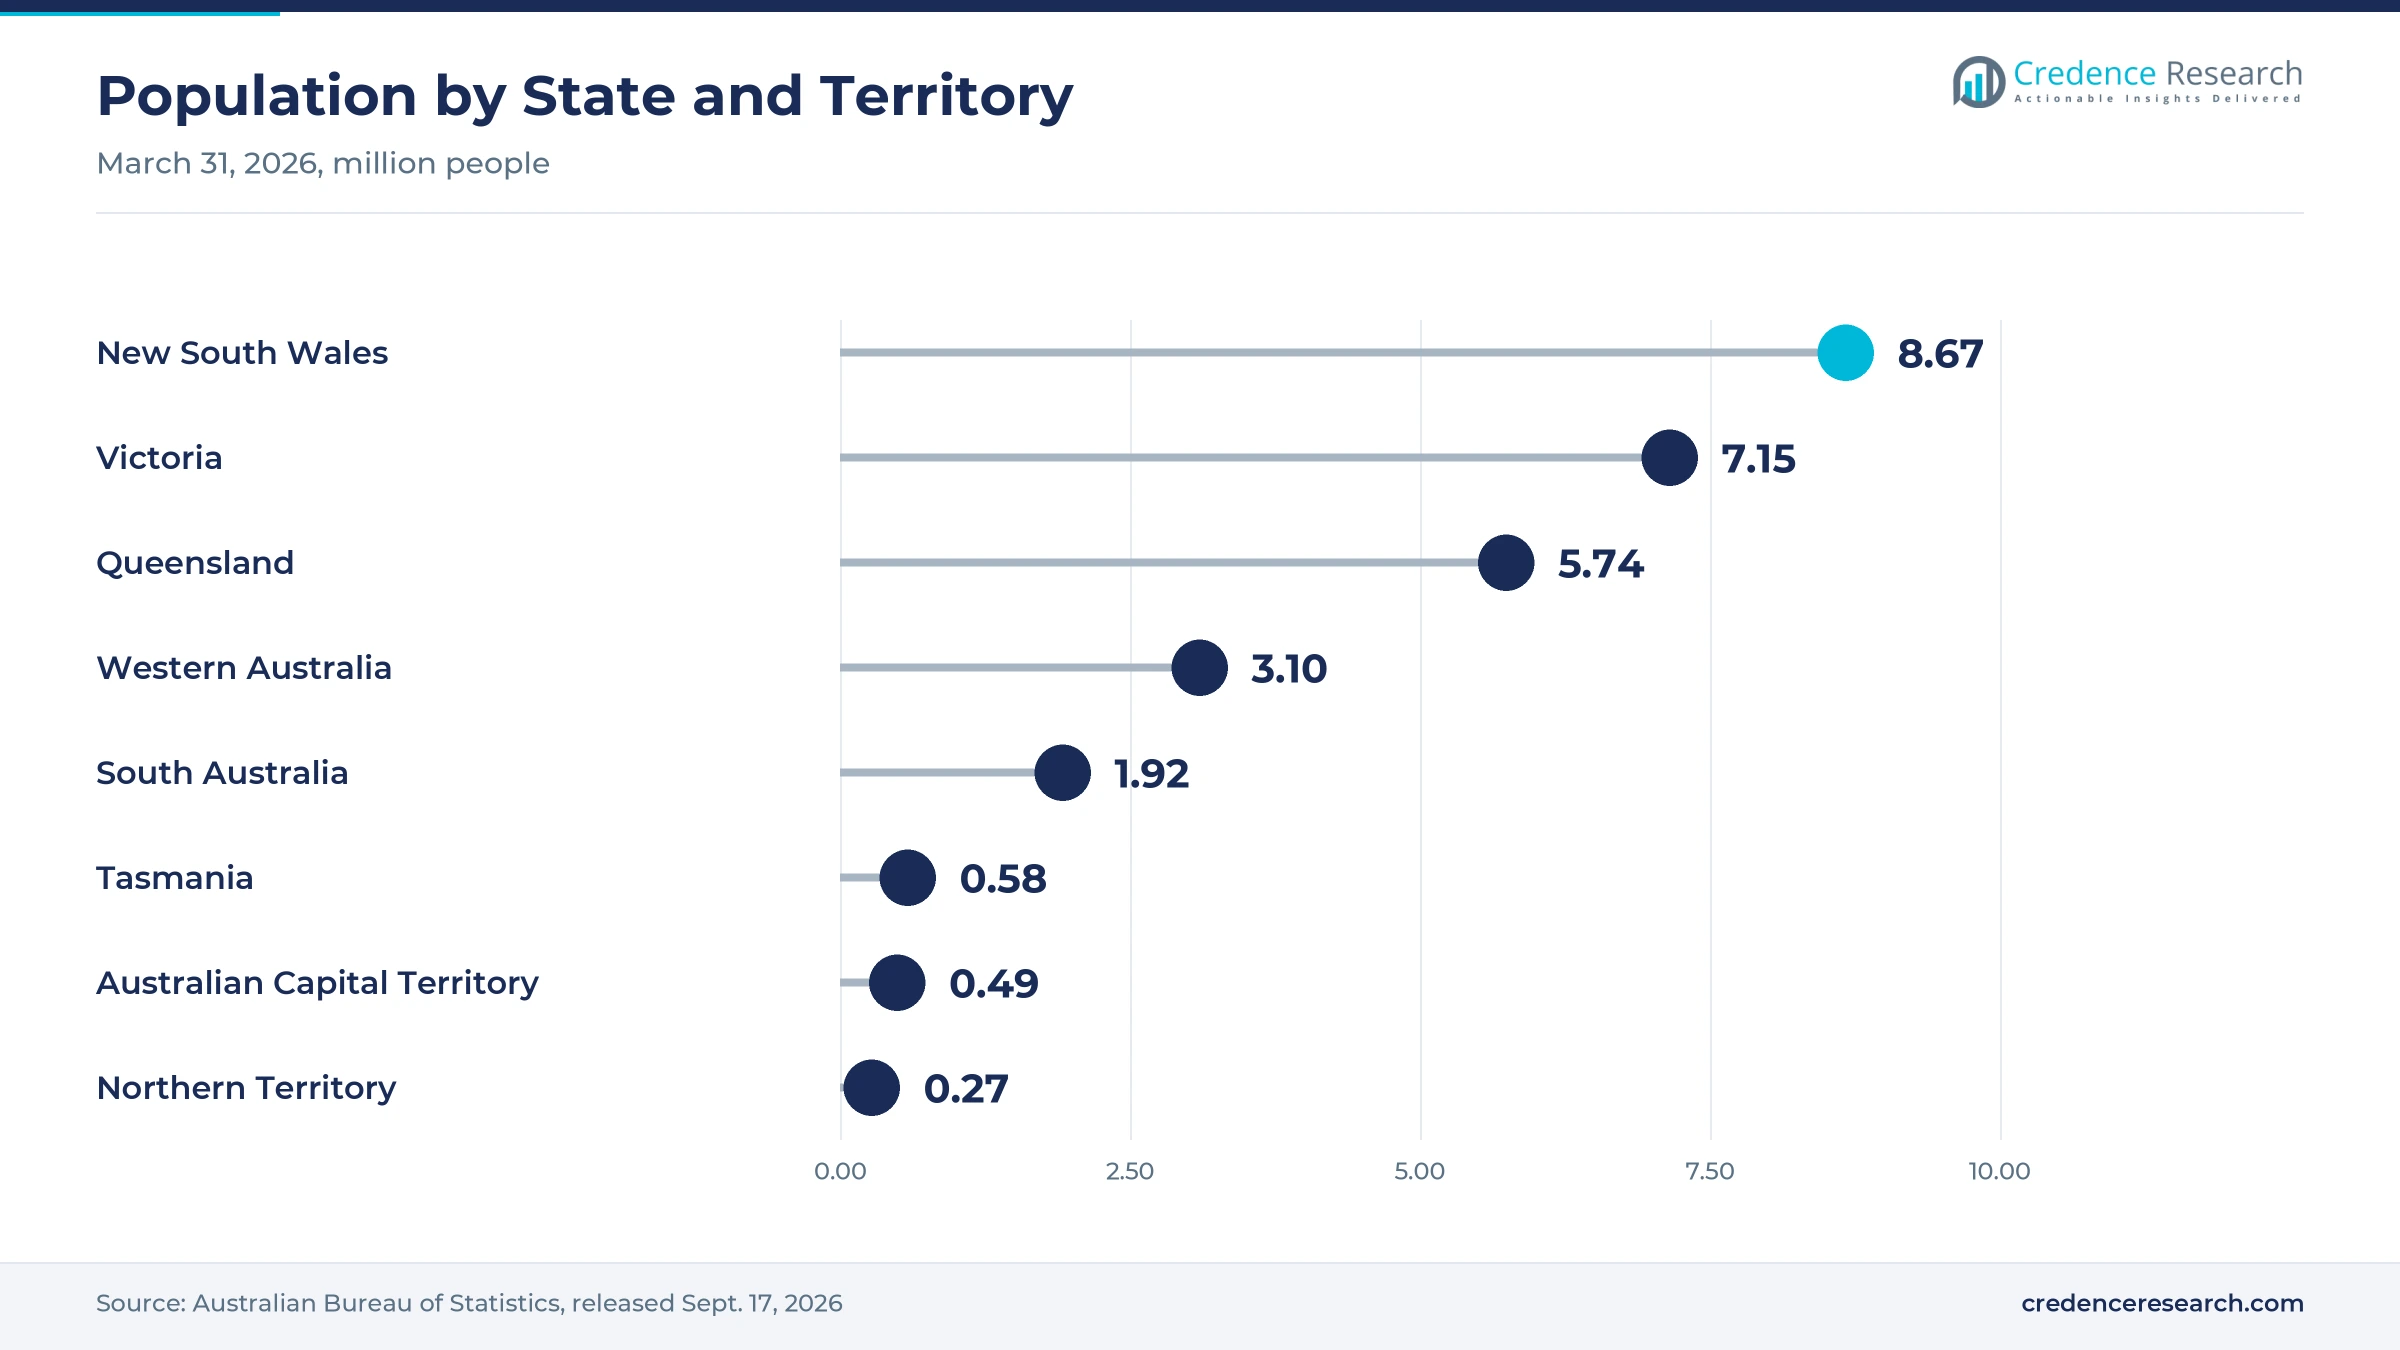
A larger population adds households, school enrollments and workplace canteens that buy groceries every week, which steadily lifts the volume of non-GM purchases even when spend per buyer is flat. Australia's population reached 27.92 million on March 31, 2026, after growing 1.4%, or 392,700 people, in a year, according to the Australian Bureau of Statistics. Western Australia grew fastest at 2.1%, while Victoria and Queensland each rose 1.6% and New South Wales rose 1.1%. The number of households buying certified organic products also rose 1.8% in fiscal 2024-25, so population gains translate into more baskets. Consequently, household purchasers lead customer types with 78.0% of 2025 value.
How do digital channels improve product information?
Online grocery and digital labels let shoppers check certification and ingredient details before they buy, because GM status is often invisible on the pack. Woolworths Group reported in August 2025 that its Australian Food eCommerce penetration reached a record 15.1% in fiscal 2025. Kialla Pure Foods prints a Plate2Farm QR code on its packets, so buyers can trace each product back to the farmer who grew the grain. Australian Oilseeds also expanded its GEO non-GMO oils to more than 1,000 Woolworths stores in February 2025, widening its online and in-store reach. The national food regulator does not keep a list of marketplace products with GM ingredients, so brand data fills that gap. As a result, online sales grow fastest among channels at 8.81% a year.
Why does widespread GM canola lift demand for verified oils?
Genetically modified canola, one of the commercial biotech crops licensed in the country, is now a large part of the national oilseed crop, so buyers who want non-GM oil need a supplier that segregates seed from paddock to bottle. About 46% of Australian canola produced in 2024 was GM, according to the Office of the Gene Technology Regulator, and the regulator first authorized commercial GM canola in 2003. Australian Oilseeds said in its March 2025 results release that it presses strictly GMO-free conventional and organic oilseeds at the largest cold pressing plant in Australia. Because highly refined oils from GM crops need no GM label, shoppers rely on these verified suppliers. Consequently, oils and specialty foods grow fastest among product types at 7.81% a year.
New GM definitions and organic prices reshape buying
Why is a shift toward outcome-based GM definitions emerging?
Regulators are moving from process-based to outcome-based definitions, which changes what counts as genetically modified on Australian shelves. The FSANZ Board approved updated definitions under Proposal P1055 on June 4, 2025, and notified food ministers, who had 60 days to request a review. Under that approach, gene-edited foods with no novel DNA would not be treated as GM, although mandatory GM labeling rules stay unchanged. Existing rules already exempt restaurant meals and allow up to 1% unintentional GM presence per ingredient, as Food Standards Australia New Zealand explains. In turn, brands that want a clear non-GM promise are turning to independent verification, which grows fastest among certification routes at 8.25% a year.
How is the rising organic price premium reshaping baskets?
Prices for certified organic goods are rising faster than general food prices, which is pushing shoppers toward lines where they see the clearest value. The average retail price per kilogram of organic products rose 9.2% in fiscal 2024-25, about three times food and non-alcoholic beverage inflation. Even so, average spend per buying household climbed 9.9%, which shows that regular buyers absorbed higher prices rather than leaving the category. Retail sales of non-certified organic products also rose 15.4% to AUD 102.6 million, which shows demand for cheaper claims. Woolworths Group said its own and exclusive brand sales grew 5.0% in fiscal 2025, outpacing branded sales. As a result, supermarket sales lead channels with 68.0% of 2025 value.
Can a national organic standard open a trust premium?
A mandatory domestic organic standard would let brands with genuine certification stand apart from loosely worded claims, which opens a clear opportunity for fully certified suppliers. Senator Bridget McKenzie introduced the National Organic Standard Bill 2024 on Nov. 19, 2024, to make the National Standard for Organic and Bio-Dynamic Produce the required domestic standard. A Senate committee recommended on Feb. 11, 2025, that the bill not pass in its current form, but it asked the agriculture department to lead a scoping exercise on domestic regulation. The government then tabled its response on April 23, 2026, which keeps the issue on the policy agenda. Consequently, suppliers already audited by approved certifying bodies stand to gain most if domestic rules tighten.
Is there room for plant milks and frozen organic lines?
Fast-growing chilled and frozen categories open space for brands that can certify every ingredient as non-GM. Frozen fruit and desserts were the fastest-growing organic category in fiscal 2024-25, up 46%, while longlife milk including plant-based options reached AUD 46.4 million in retail sales. PureHarvest sold the first Australian-made and grown soy milk in 1987 and launched Coco Quench in 2013 from its base in Victoria. Sanitarium sells So Good plant milks in soy, almond and oat alongside Weet-Bix and Up&Go. Because soy drinks depend on traceable beans, this trend also lifts demand for verified soy protein inputs. As a result, dairy and beverages give certified suppliers a large shelf for repeat purchases.
Price gaps, loose claims and segregation costs weigh
How does the organic price gap limit wider adoption?
Organic prices per kilogram rose about three times faster than food inflation in fiscal 2024-25, which stretches budgets for price-sensitive families. The share of households buying certified organic products slipped from 77.2% to 76.8% over the same year, even as total spending rose. As a result, growth depends heavily on existing buyers, and suppliers respond with larger multipacks, bulk packs and own-brand organic ranges that narrow the gap with conventional products.
Why do loose non-GM claims confuse buyers?
Australian law does not yet require domestic organic certification, and highly refined ingredients from GM crops need no label, so similar claims can carry very different levels of proof. Australian Organic Limited published a dedicated Non-GMO Standard in 2016 because labeling laws do not require disclosure of ingredients derived from GM crops. In turn, producers such as the Australian Carob Company in South Australia use third-party testing that confirms GM presence below 0.1%.
How costly is keeping GM canola out of supply chains?
GM canola can be grown commercially in New South Wales, Victoria, Western Australia and mainland South Australia, so non-GM oilseed buyers must segregate grain at farms, silos and crushing plants. Each extra cleaning step, storage bin and round of GMO testing adds cost that smaller brands cannot easily spread. Consequently, verified oils carry higher shelf prices, and pressers rely on contracted growers in districts with lower GM plantings.
Why does supermarket concentration squeeze small brands?
Major supermarkets carried 80% of certified organic retail sales in fiscal 2024-25, while specialty, independent, online and direct channels together held only 6%. This concentration gives the large chains strong pricing power over smaller millers and processors that depend on their shelf space. In response, specialist brands build online stores, health food distribution and hospitality accounts to reduce reliance on a few buyers.
NSW and ACT lead while western states grow fastest
| Region | Value, 2025 (USD million) | Share, 2025 | CAGR, 2026–2035 |
|---|---|---|---|
| New South Wales and Australian Capital Territory | 203.4 | 33.7% | 6.97% |
| Victoria and Tasmania | 148.5 | 24.6% | 7.27% |
| Western Australia, South Australia and Northern Territory | 137.0 | 22.7% | 7.52% |
| Queensland | 114.7 | 19.0% | 7.37% |
Why do New South Wales and the ACT lead non-GM spending?
New South Wales and the Australian Capital Territory held 33.7% of 2025 value and grow at 6.97% a year. The zone had about 9.16 million residents in March 2026, and New South Wales had 631 certified organic operators in fiscal 2024-25. Sanitarium, which runs its national headquarters at Berkeley Vale, invested AUD 55 million in 2022 to acquire an adjoining warehouse and distribution site. Australian Oilseeds presses GMO-free seed at Cootamundra, which gives the zone a local supply of verified oils.
How do Victoria and Tasmania support certified supply?
Victoria and Tasmania held 24.6% of 2025 value and grow at 7.27% a year. Victoria had 671 certified organic operators in fiscal 2024-25, the most of any state, and its population grew by 109,500 people in the year to March 2026. Tasmania has extended its moratorium on GM crops and animals to 2029, which gives island growers a clear GM-free story for mainland shoppers. PureHarvest also makes organic plant milks at Drouin in regional Victoria.
What role does Queensland play in organic supply?
Queensland held 19.0% of 2025 value and grows at 7.37% a year. The state had 608 certified organic operators and about 11.5 million certified hectares in fiscal 2024-25, one of the largest certified areas in the country. Kialla Pure Foods mills organic grain on the Darling Downs and was the first certified organic processor in the state. Its population grew by 90,100 people in the year to March 2026, which adds demand to a supply base whose growers also buy organic fertilizers.
How do the western and central states lead growth?
Western Australia, South Australia and the Northern Territory held 22.7% of 2025 value and grow fastest at 7.52% a year. Western Australia added 64,200 residents in the year to March 2026, the fastest growth rate of any state at 2.1%. South Australia has allowed GM crops on the mainland since late 2020 but keeps Kangaroo Island GM-free, while its 324 certified operators supply local demand.
Banana approval, organic bill and GM rules, 2024–2026
| Development | Status and market relevance |
|---|---|
| In March 2024, Food Standards Australia New Zealand approved the QCAV-4 Cavendish banana developed by Queensland University of Technology, the first whole GM fruit it has cleared. | Developer has no plans to sell it commercially |
| In November 2024, Senator Bridget McKenzie introduced the National Organic Standard Bill 2024 to make the national organic standard mandatory for domestic sales. | Committee advised against passage in February 2025 |
| In February 2025, Australian Oilseeds expanded its GEO non-GMO cold-pressed canola and vegetable oils to more than 1,000 Woolworths stores. | Pack sizes from 750 milliliters to 4 liters |
| In June 2025, the FSANZ Board approved outcome-based definitions for food produced using gene technology under Proposal P1055. | Mandatory GM labeling rules unchanged |
| In April 2026, the federal government tabled its response to the Senate inquiry on the National Organic Standard Bill 2024. | Domestic organic regulation still under review |
Outcome-based rules, cold pressing and QR traceability
- Outcome-based GM definitions judge a food by whether it contains novel DNA, which separates gene-edited foods from transgenic ones.
- Cold pressing of segregated oilseeds extracts oil without solvents from GMO-free seed, which keeps the non-GM story intact from farm to bottle.
- QR code traceability such as the Plate2Farm tracker links each packet to the farmer who grew the grain inside it.
- Third-party GM testing checks ingredients against strict limits, with some verified Australian products confirmed below 0.1% GM presence.
Need a Custom Version of This Report?
Tailor the scope, geography, or segments to your exact requirements.
- Custom geography or segment scope
- Direct access to our analyst team
Organic pioneers and oilseed pressers compete on proof
Competition is led by long-standing organic brands and specialist processors that prove their non-GM status through certification, segregation and traceable sourcing. Sanitarium Health Food Company, based at Berkeley Vale, sells Weet-Bix, Up&Go and So Good plant milks in soy, almond and oat varieties. Australian Oilseeds Holdings presses GMO-free conventional and organic oilseeds at Cootamundra and placed its GEO oils in more than 1,000 Woolworths stores in February 2025. Ceres Organics, a New Zealand-based brand sold across Australia, offers a broad shelf-stable certified organic range and requires third-party organic certification from farm partners in about 30 countries. PureHarvest, which began in 1979, makes organic plant milks in Victoria, while Kialla Pure Foods mills organic grain on the Darling Downs. Companies compete on certification depth, supply security, price premiums and supermarket ranging. In the Australia non-genetically modified food market, verifiable proof increasingly matters as much as brand heritage.
Companies profiled and their roles in this market
| Company | Type | Role in the market |
|---|---|---|
| Sanitarium Health Food Company | Breakfast and beverage brand | Weet-Bix, Up&Go and So Good plant milks from Berkeley Vale |
| Australian Oilseeds Holdings | Oilseed presser | GMO-free cold pressing at Cootamundra, GEO oils in Woolworths |
| Ceres Organics | Certified organic brand | Broad shelf-stable organic range with certified farm partners |
| PureHarvest | Organic plant milk maker | Soy, rice, oat and almond milks from Drouin, Victoria |
| Kialla Pure Foods | Organic flour miller | Darling Downs mill with Plate2Farm traceability |
Credence Research sees verification setting the pace
Credence Research's view is that non-GM food spending in Australia will grow steadily through 2035, as certified organic buyers keep spending and new GM definitions raise the value of tested proof. Packaged foods should keep the largest product share, while oils and specialty foods gain most from the spread of GM canola. New South Wales and the Australian Capital Territory will remain the largest zone, although the western and central states add demand fastest. However, the organic price premium and supermarket concentration will test smaller brands. Suppliers that pair third-party verification with online product data should gain share.
Organic sales, population and retail data anchor the model
The report uses 2025 as the base year on a calendar basis. Market values come from the Credence Research model, which combines certified organic retail sales, population, household purchasing and channel data. Regional shares follow the client data set, while regional growth and segment splits by product type, certification route, distribution channel and customer type are Credence Research estimates. Sources used are industry body market data, national statistics, regulator publications, parliamentary records and company releases, and no interviews or surveys were used.
Independent verification and online reach shape 2035
The market is expected to reach USD 1.23 billion by 2035, a 7.25% CAGR during 2026–2035, as certified organic loyalty, population growth and digital product information keep demand rising. Growth should be strongest in independent verification, online sales and oils and specialty foods, while New South Wales and the Australian Capital Territory keep the largest share. Any decision on mandatory domestic organic regulation would reward fully certified suppliers. In contrast, sustained organic price inflation or weaker household budgets could slow spending in some years.
Frequently Asked Questions
How big is the Australia non-genetically modified food market?
Which region leads non-GM food demand in Australia?
Which region grows fastest?
Which product type holds the largest share?
Must GM food be labeled in Australia?
How common is GM canola in Australia?
Who are the leading companies in this market?
What are the main risks to growth?
Table of Content
Chapter 1 Market Segmentation
- 1.1 Segmentation Framework
- 1.1.1 Product and Service Classification
- 1.1.2 Application and End-Use Classification
- 1.1.3 Technology and Solution Classification
- 1.1.4 Customer and Distribution Channel Classification
- 1.1.5 Geographic Segmentation
- 1.1.6 Market Segment Definitions and Boundaries
- 1.2 By Product Type
- 1.2.1 Packaged Foods
- 1.2.2 Dairy and Beverages
- 1.2.3 Fresh Foods and Proteins
- 1.2.4 Oils and Specialty Foods
- 1.3 By Certification Route
- 1.3.1 Certified Organic
- 1.3.2 Independent Non-Modification Verification
- 1.3.3 Supplier-Substantiated Claims
- 1.4 By Customer Type
- 1.4.1 Household Purchasers
- 1.4.2 Hospitality Buyers
- 1.4.3 Workplace and Education Buyers
Chapter 2 Introduction
- 2.1 Report Objectives and Scope
- 2.2 Product Definition and Industry Terminology
- 2.3 Market Inclusions and Exclusions
- 2.4 Research Process
- 2.4.1 Primary Research and Expert Interviews
- 2.4.2 Secondary Research and Source Review
- 2.4.3 Top-Down and Bottom-Up Estimation
- 2.4.4 Data Triangulation and Verification
- 2.5 Market Size Measurement Basis
- 2.5.1 2025: USD 603.5 million → 2035: USD 1.23 billion
- 2.6 Historical and Forecast Reference Periods
- 2.6.1 Historical Period: 2018-2025
- 2.6.2 Base Year: 2025
- 2.6.3 Forecast Period: 2025-2035
- 2.7 Research Assumptions and Limitations
Chapter 3 Executive Summary
- 3.1 Market Snapshot and Key Findings
- 3.2 Base-Year Market Size, 2025
- 3.3 Forecast Market Size, 2035
- 3.4 Revenue and Volume Growth Outlook
- 3.5 Key Demand and Supply Indicators
- 3.6 Leading Market Segments
- 3.7 Fastest-Growing Market Opportunities
- 3.8 Regional Performance Highlights
- 3.9 Technology and Industry Transformation
- 3.10 Competitive Landscape Summary
- 3.11 Analyst View and Strategic Implications
Chapter 4 Australia Non-Genetically Modified Food Market Trends and Developments
- 4.1 Historical Industry Development, 2018-2025
- 4.2 Recent Market Trends and Developments
- 4.3 Demand and Customer Behavior Trends
- 4.4 Technology and Product Innovation
- 4.5 Artificial Intelligence, Automation and Digitalization
- 4.6 Local Manufacturing and Supply Chain Realignment
- 4.7 Industry Partnerships, Mergers and Acquisitions
- 4.8 Sustainability and Circular Economy Developments
- 4.9 Government and Private Sector Investment Trends
- 4.10 Emerging Business Models and Commercialization
- 4.11 Industry Developments and Announcements
Chapter 5 Australia Non-Genetically Modified Food Market Production, Supply and Demand Analysis
- 5.1 Demand Trend and Consumption Analysis, 2018-2025
- 5.2 Demand Forecast, 2025-2035
- 5.3 Production and Output Trend, 2018-2025
- 5.4 Production and Output Forecast, 2025-2035
- 5.5 Installed Capacity and Capacity Utilization
- 5.6 Company-Wise Production Plants and Statistics
- 5.6.1 Installed Production Capacity
- 5.6.2 Actual Production
- 5.6.3 Planned Capacity and Expansion Targets
- 5.7 Supply Chain Structure and Procurement Trends
- 5.8 Supply-Demand Gap and Bottlenecks
- 5.9 Import Dependence and Sourcing Structure
- 5.10 Contract Manufacturing and Outsourcing
- 5.11 Regional Supply and Demand Concentration
Chapter 6 Australia Non-Genetically Modified Food Market Pricing Analysis
- 6.1 Pricing Structure and Measurement
- 6.2 Historical Pricing Trends, 2018-2025
- 6.3 Pricing Outlook, 2025-2035
- 6.4 Average Selling Price and Unit Economics
- 6.5 Pricing by Product and Market Segment
- 6.6 Geographic Pricing Differences
- 6.7 Key Input, Energy, Labor and Logistics Costs
- 6.8 Contract Pricing and Purchasing Models
- 6.9 Pricing Sensitivity and Competitive Positioning
- 6.10 Price, Margin and Profitability Implications
Chapter 7 Australia Non-Genetically Modified Food Market Dynamics
- 7.1 Market Growth Drivers
- 7.1.1 Demand-Side Drivers
- 7.1.2 Technology and Innovation Drivers
- 7.1.3 Infrastructure and Investment Drivers
- 7.1.4 Regulatory and Policy Drivers
- 7.2 Market Restraints
- 7.2.1 Cost and Affordability Constraints
- 7.2.2 Technology and Adoption Barriers
- 7.2.3 Supply Chain and Operational Constraints
- 7.3 Market Challenges
- 7.3.1 Competitive Pressure and Margin Erosion
- 7.3.2 Skills, Infrastructure and Implementation Gaps
- 7.4 Emerging Market Opportunities
- 7.5 Market Dynamics Impact and Time-Horizon Assessment
Chapter 8 Australia Non-Genetically Modified Food Value Chain Analysis
- 8.1 Industry Value Chain Overview
- 8.2 Upstream Suppliers and Critical Inputs
- 8.3 Technology and Component Providers
- 8.4 Manufacturing or Service Delivery
- 8.5 Distribution, Channel Partners and Integrators
- 8.6 Downstream Applications and End Users
- 8.7 Value Addition and Profit Pools
- 8.8 Vertical Integration and Outsourcing
- 8.9 Supplier Concentration and Risk
- 8.10 Supply Chain Localization and Resilience
Chapter 9 Australia Non-Genetically Modified Food Market Regulations and Policies
- 9.1 Relevant Laws, Standards and Compliance Frameworks
- 9.2 Product, Service, Safety and Quality Requirements
- 9.3 Government Policies, Incentives and Subsidies
- 9.4 Imports, Exports and Trade Barriers
- 9.5 Public Procurement and Local Content Requirements
- 9.6 Environmental and Sustainability Compliance
- 9.7 Upcoming Policy Changes and Market Implications
Chapter 10 Australia Non-Genetically Modified Food Market Hotspots and Opportunities
- 10.1 Market Opportunity Mapping and Growth Hotspots
- 10.2 High-Growth Applications and Customer Groups
- 10.3 Underserved Markets and White-Space Opportunities
- 10.4 Emerging Technology and Product Opportunities
- 10.5 New Capacity and Investment Hotspots
- 10.6 Market Entry and Expansion Opportunities
- 10.7 Distribution and Partnership Opportunities
- 10.8 Near-Term and Long-Term Commercial Potential
- 10.9 Opportunity Attractiveness and Execution Risks
Chapter 11 Australia Non-Genetically Modified Food Market Outlook, 2025-2035
- 11.1 Market Size and Analysis
- 11.1.1 Revenue (Market Measurement: 2025: USD 603.5 million → 2035: USD 1.23 billion)
- 11.1.2 Market Volume and Quantity Sold
- 11.1.3 Historical Market Size, 2018-2025
- 11.1.4 Base-Year Market Size, 2025
- 11.2 Market Forecast, 2025-2035
- 11.2.1 Revenue Forecast to 2035
- 11.2.2 Volume Forecast to 2035
- 11.2.3 CAGR and Year-on-Year Growth
- 11.2.4 Incremental Revenue Opportunity
- 11.3 Forecast Assumptions and Scenario Analysis
- 11.3.1 Base-Case Forecast
- 11.3.2 Optimistic and Conservative Scenarios
- 11.3.3 Technology, Pricing and Policy Sensitivities
- 11.4 Market Attractiveness and Growth Outlook
Chapter 12 Australia Non-Genetically Modified Food Market Segmentation and Outlook
- 12.1 Segmentation Summary and Market Shares, 2025
- 12.2 Largest and Fastest-Growing Segments
- 12.3 By Product Type - Market Size and Forecast, 2025-2035
- 12.3.1 Segment Definition and Scope
- 12.3.2 Historical Market Size, 2018-2025
- 12.3.3 Revenue Forecast, 2025-2035
- 12.3.4 Volume Forecast, 2025-2035
- 12.3.5 Base-Year Market Share, 2025
- 12.3.6 Segment CAGR and Growth Drivers
- 12.3.7 Subsegment Market Size and Forecast
- 12.3.7.1 Packaged Foods
- 12.3.7.2 Dairy and Beverages
- 12.3.7.3 Fresh Foods and Proteins
- 12.3.7.4 Oils and Specialty Foods
- 12.3.8 Subsegment Pricing and Adoption Trends
- 12.3.9 Leading Suppliers and Competition
- 12.3.10 Regional Demand and Opportunities
- 12.4 By Certification Route - Market Size and Forecast, 2025-2035
- 12.4.1 Segment Definition and Scope
- 12.4.2 Historical Market Size, 2018-2025
- 12.4.3 Revenue Forecast, 2025-2035
- 12.4.4 Volume Forecast, 2025-2035
- 12.4.5 Base-Year Market Share, 2025
- 12.4.6 Segment CAGR and Growth Drivers
- 12.4.7 Subsegment Market Size and Forecast
- 12.4.7.1 Certified Organic
- 12.4.7.2 Independent Non-Modification Verification
- 12.4.7.3 Supplier-Substantiated Claims
- 12.4.8 Subsegment Pricing and Adoption Trends
- 12.4.9 Leading Suppliers and Competition
- 12.4.10 Regional Demand and Opportunities
- 12.5 By Customer Type - Market Size and Forecast, 2025-2035
- 12.5.1 Segment Definition and Scope
- 12.5.2 Historical Market Size, 2018-2025
- 12.5.3 Revenue Forecast, 2025-2035
- 12.5.4 Volume Forecast, 2025-2035
- 12.5.5 Base-Year Market Share, 2025
- 12.5.6 Segment CAGR and Growth Drivers
- 12.5.7 Subsegment Market Size and Forecast
- 12.5.7.1 Household Purchasers
- 12.5.7.2 Hospitality Buyers
- 12.5.7.3 Workplace and Education Buyers
- 12.5.8 Subsegment Pricing and Adoption Trends
- 12.5.9 Leading Suppliers and Competition
- 12.5.10 Regional Demand and Opportunities
- 12.6 Segment Growth Comparison
- 12.7 Segment Attractiveness and Priority Matrix
Chapter 13 Australia Non-Genetically Modified Food End-Use and Application Market Outlook
- 13.1 End-Use Industry and Customer Demand Structure
- 13.2 Leading Applications and Customer Groups
- 13.3 End-Use Market Size, Share and Forecast
- 13.4 Major End-Use Industry Deep Dives
- 13.4.1 Customer Requirements and Use Cases
- 13.4.2 Demand and Replacement Cycles
- 13.4.3 Technical and Regulatory Considerations
- 13.4.4 Purchasing and Procurement Models
- 13.4.5 Leading Vendors and Distribution Channels
- 13.4.6 Forecast and Commercial Opportunities
- 13.5 Emerging Applications and Cross-Segment Demand
- 13.6 End-Use Industry Investment Priorities
Chapter 14 Australia Non-Genetically Modified Food Geographic Market Outlook, 2025-2035
- 14.1 Domestic Market Distribution and Demand Clusters
- 14.2 State- or Province-Wise Market Size and Forecast, 2025-2035
- 14.3 City and Metropolitan Market Outlook
- 14.4 Industrial, Manufacturing and Commercial Clusters
- 14.5 Geographic Concentration of Key End Users
- 14.6 Local Pricing and Purchasing Differences
- 14.7 Domestic Production Facilities and Capacity Map
- 14.8 Local Infrastructure and Project Pipeline
- 14.9 State-Level Policy and Incentive Differences
- 14.10 Subnational Investment Hotspots and Opportunities
- 14.11 Distribution and Logistics Networks
- 14.12 Domestic Competitive Footprint
Chapter 15 Australia Non-Genetically Modified Food Technology, Innovation and Sustainability Outlook
- 15.1 Technology Landscape and Maturity
- 15.2 Product, Process and Service Innovation
- 15.3 AI, Automation and Digital Tools in the Industry
- 15.4 Technology Adoption and Performance Benchmarking
- 15.5 Innovation Pipeline and R&D Investment
- 15.6 Patent and Intellectual Property Trends
- 15.7 Energy Efficiency and Resource Management
- 15.8 Sustainability, Recycling and Circularity
- 15.9 Technology Roadmap, 2025-2035
- 15.10 Risks of Obsolescence and Technology Substitution
Chapter 16 Australia Non-Genetically Modified Food Market Key Strategic Imperatives
- 16.1 Growth and Market Entry Priorities
- 16.2 High-Return Products and Segments
- 16.3 Pricing, Profitability and Cost Optimization
- 16.4 Technology Investment and Product Differentiation
- 16.5 Supply Chain Localization and Resilience
- 16.6 Distribution and Customer Acquisition
- 16.7 Partnership, Acquisition and Capacity Strategy
- 16.8 Regional Expansion Priorities
- 16.9 Short-, Medium- and Long-Term Actions
Chapter 17 Competition Outlook
- 17.1 Industry Competition Characteristics
- 17.2 Market Structure and Concentration
- 17.3 Market Share and Competitive Positioning, 2025
- 17.4 Company-Wise Revenue and Product Benchmarking
- 17.5 Production and Service Capacity Benchmarking
- 17.6 Technology, Pricing and Differentiation
- 17.7 Regional Footprint and Distribution Strength
- 17.8 Mergers, Acquisitions and Strategic Alliances
- 17.9 New Entrants and Competitive Threats
- 17.10 Porter's Five Forces and Industry Attractiveness
- 17.11 Competitive Outlook, 2025-2035
Chapter 18 Company Profiles
- 18.1 Company Coverage and Selection Criteria
- 18.2 Sanitarium Health Food Company
- 18.2.1 Business Description
- 18.2.2 Company Ownership and Geographic Presence
- 18.2.3 Product and Service Portfolio
- 18.2.4 Manufacturing and Operating Footprint
- 18.2.5 Production Capacity and Expansion Plans
- 18.2.6 Financial Performance and Investment
- 18.2.7 Market Share and Competitive Position
- 18.2.8 Technology and Innovation Capabilities
- 18.2.9 Strategic Alliances or Partnerships
- 18.2.10 Recent Developments
- 18.2.11 Growth Strategy and Outlook
- 18.3 Australian Oilseeds Holdings
- 18.4 Ceres Organics
- 18.5 PureHarvest
- 18.6 Kialla Pure Foods
- 18.7 Other Relevant Market Participants
Note: Every listed company is profiled on the structure shown under the first company. The company list is preliminary and may change based on research findings, market developments, data availability and client requirements.
Chapter 19 Disclaimer
- 19.1 Research and Forecast Disclaimer
- 19.2 Data Source and Estimation Limitations
Note: The depth of individual sections depends on data availability for this market. Volume, capacity, trade and other unit-based metrics are included where applicable.

