
Transfusion and antenatal tests sustain steady demand
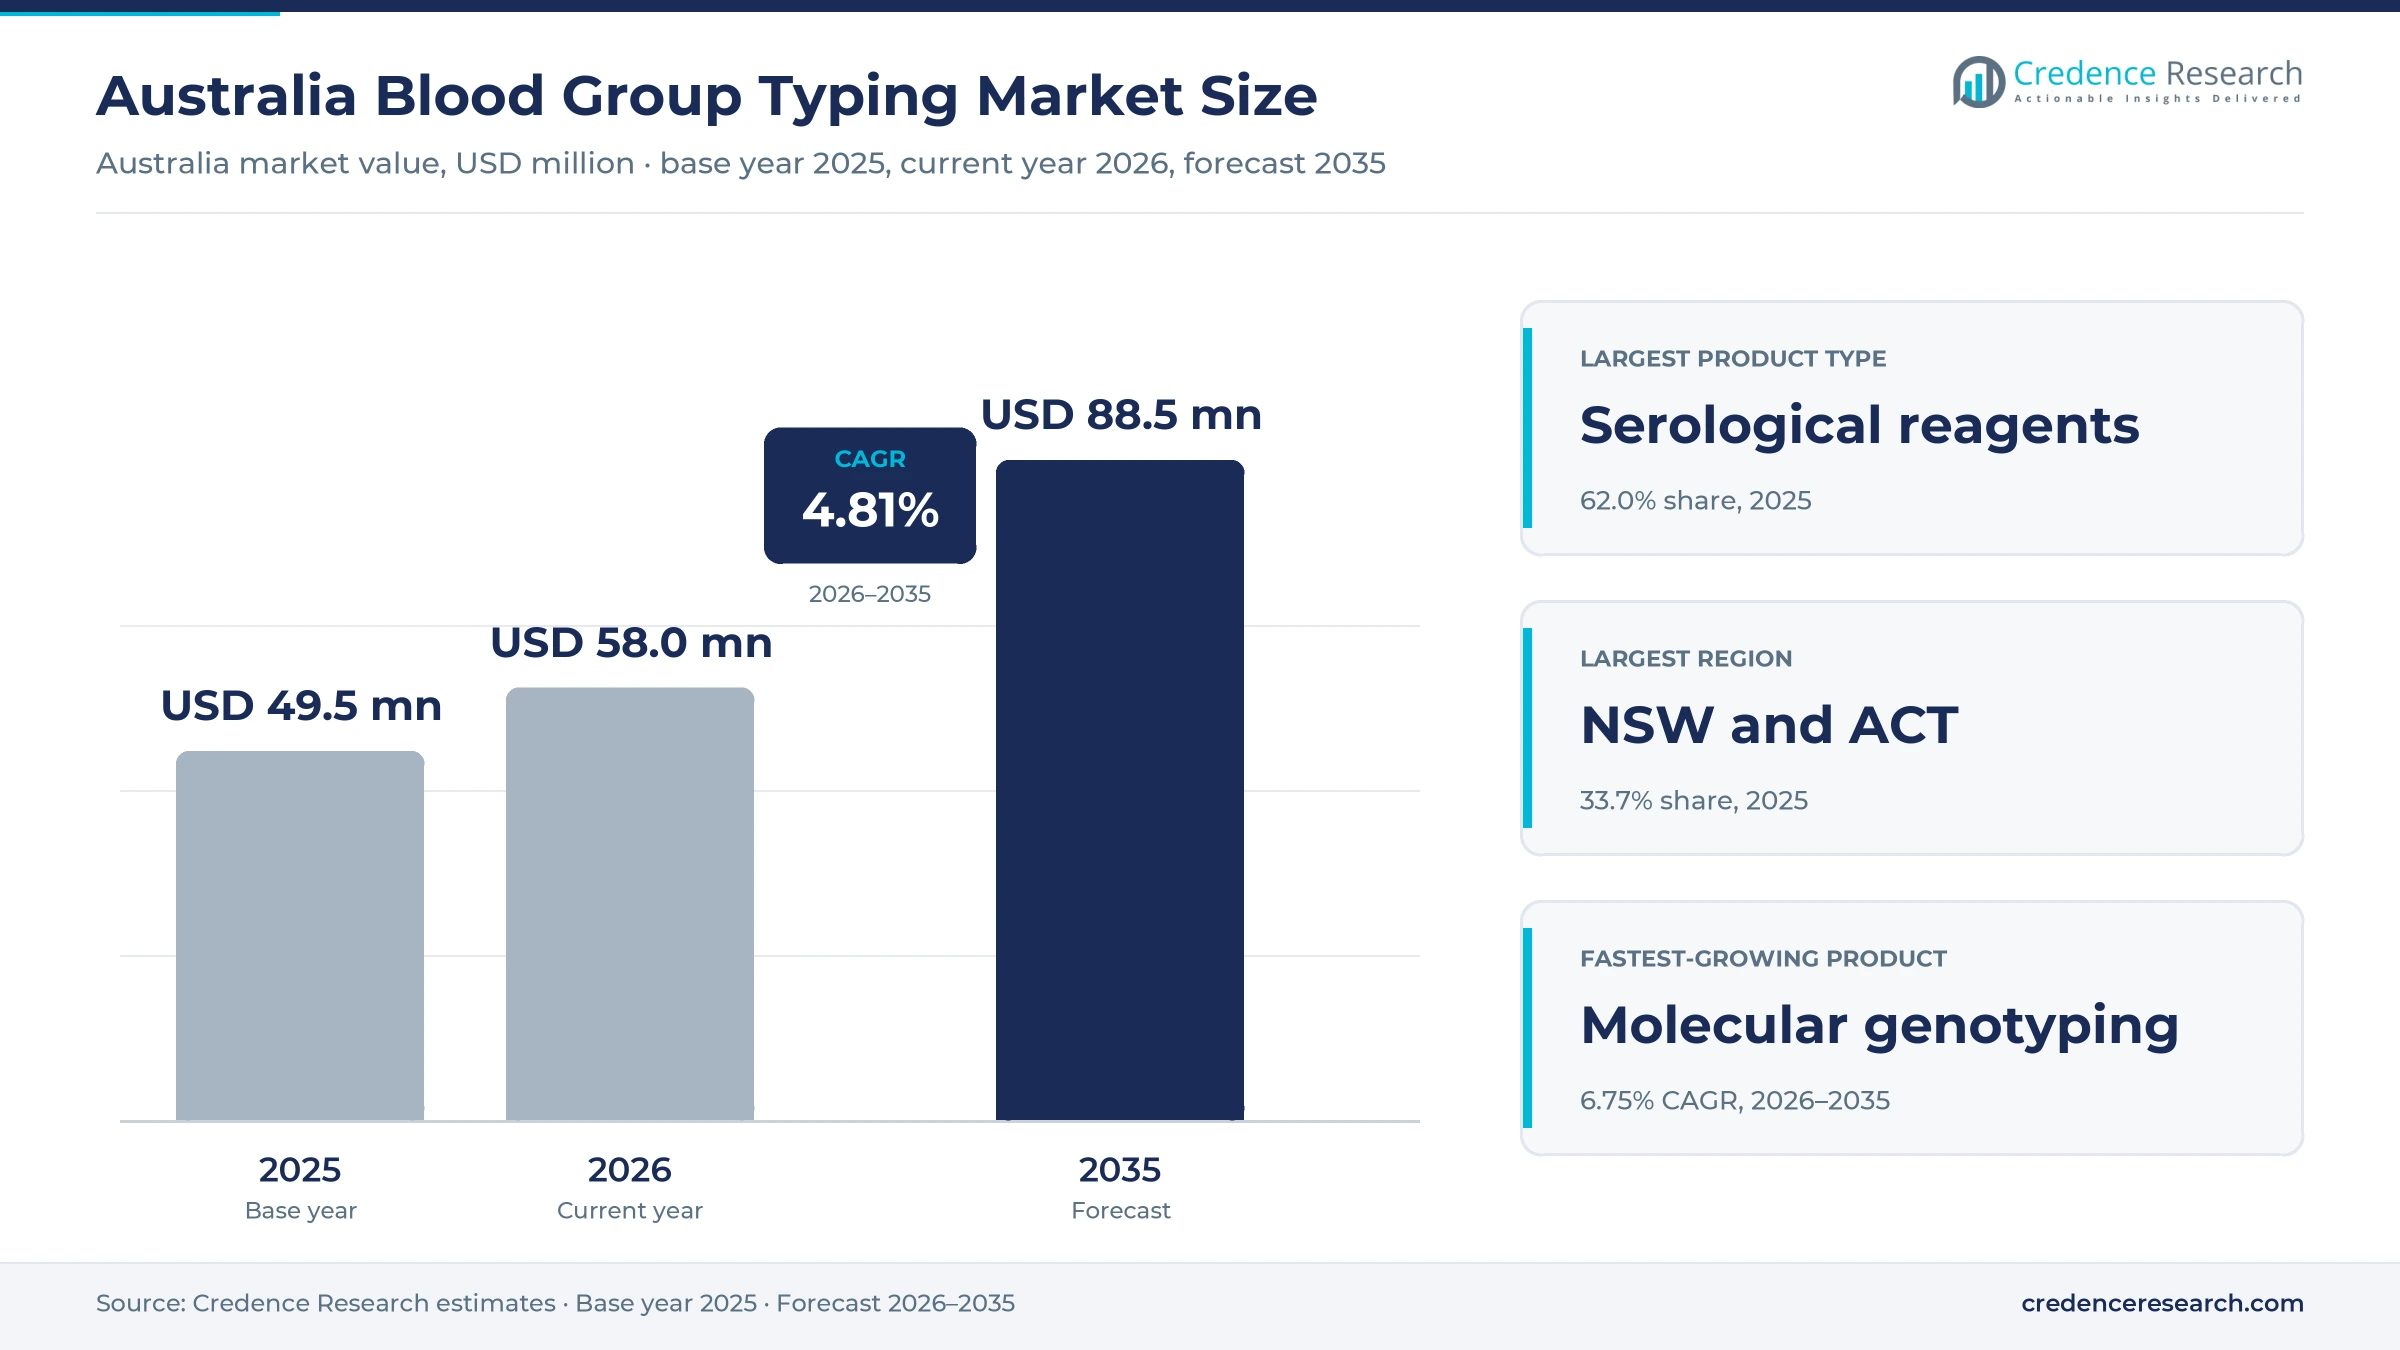
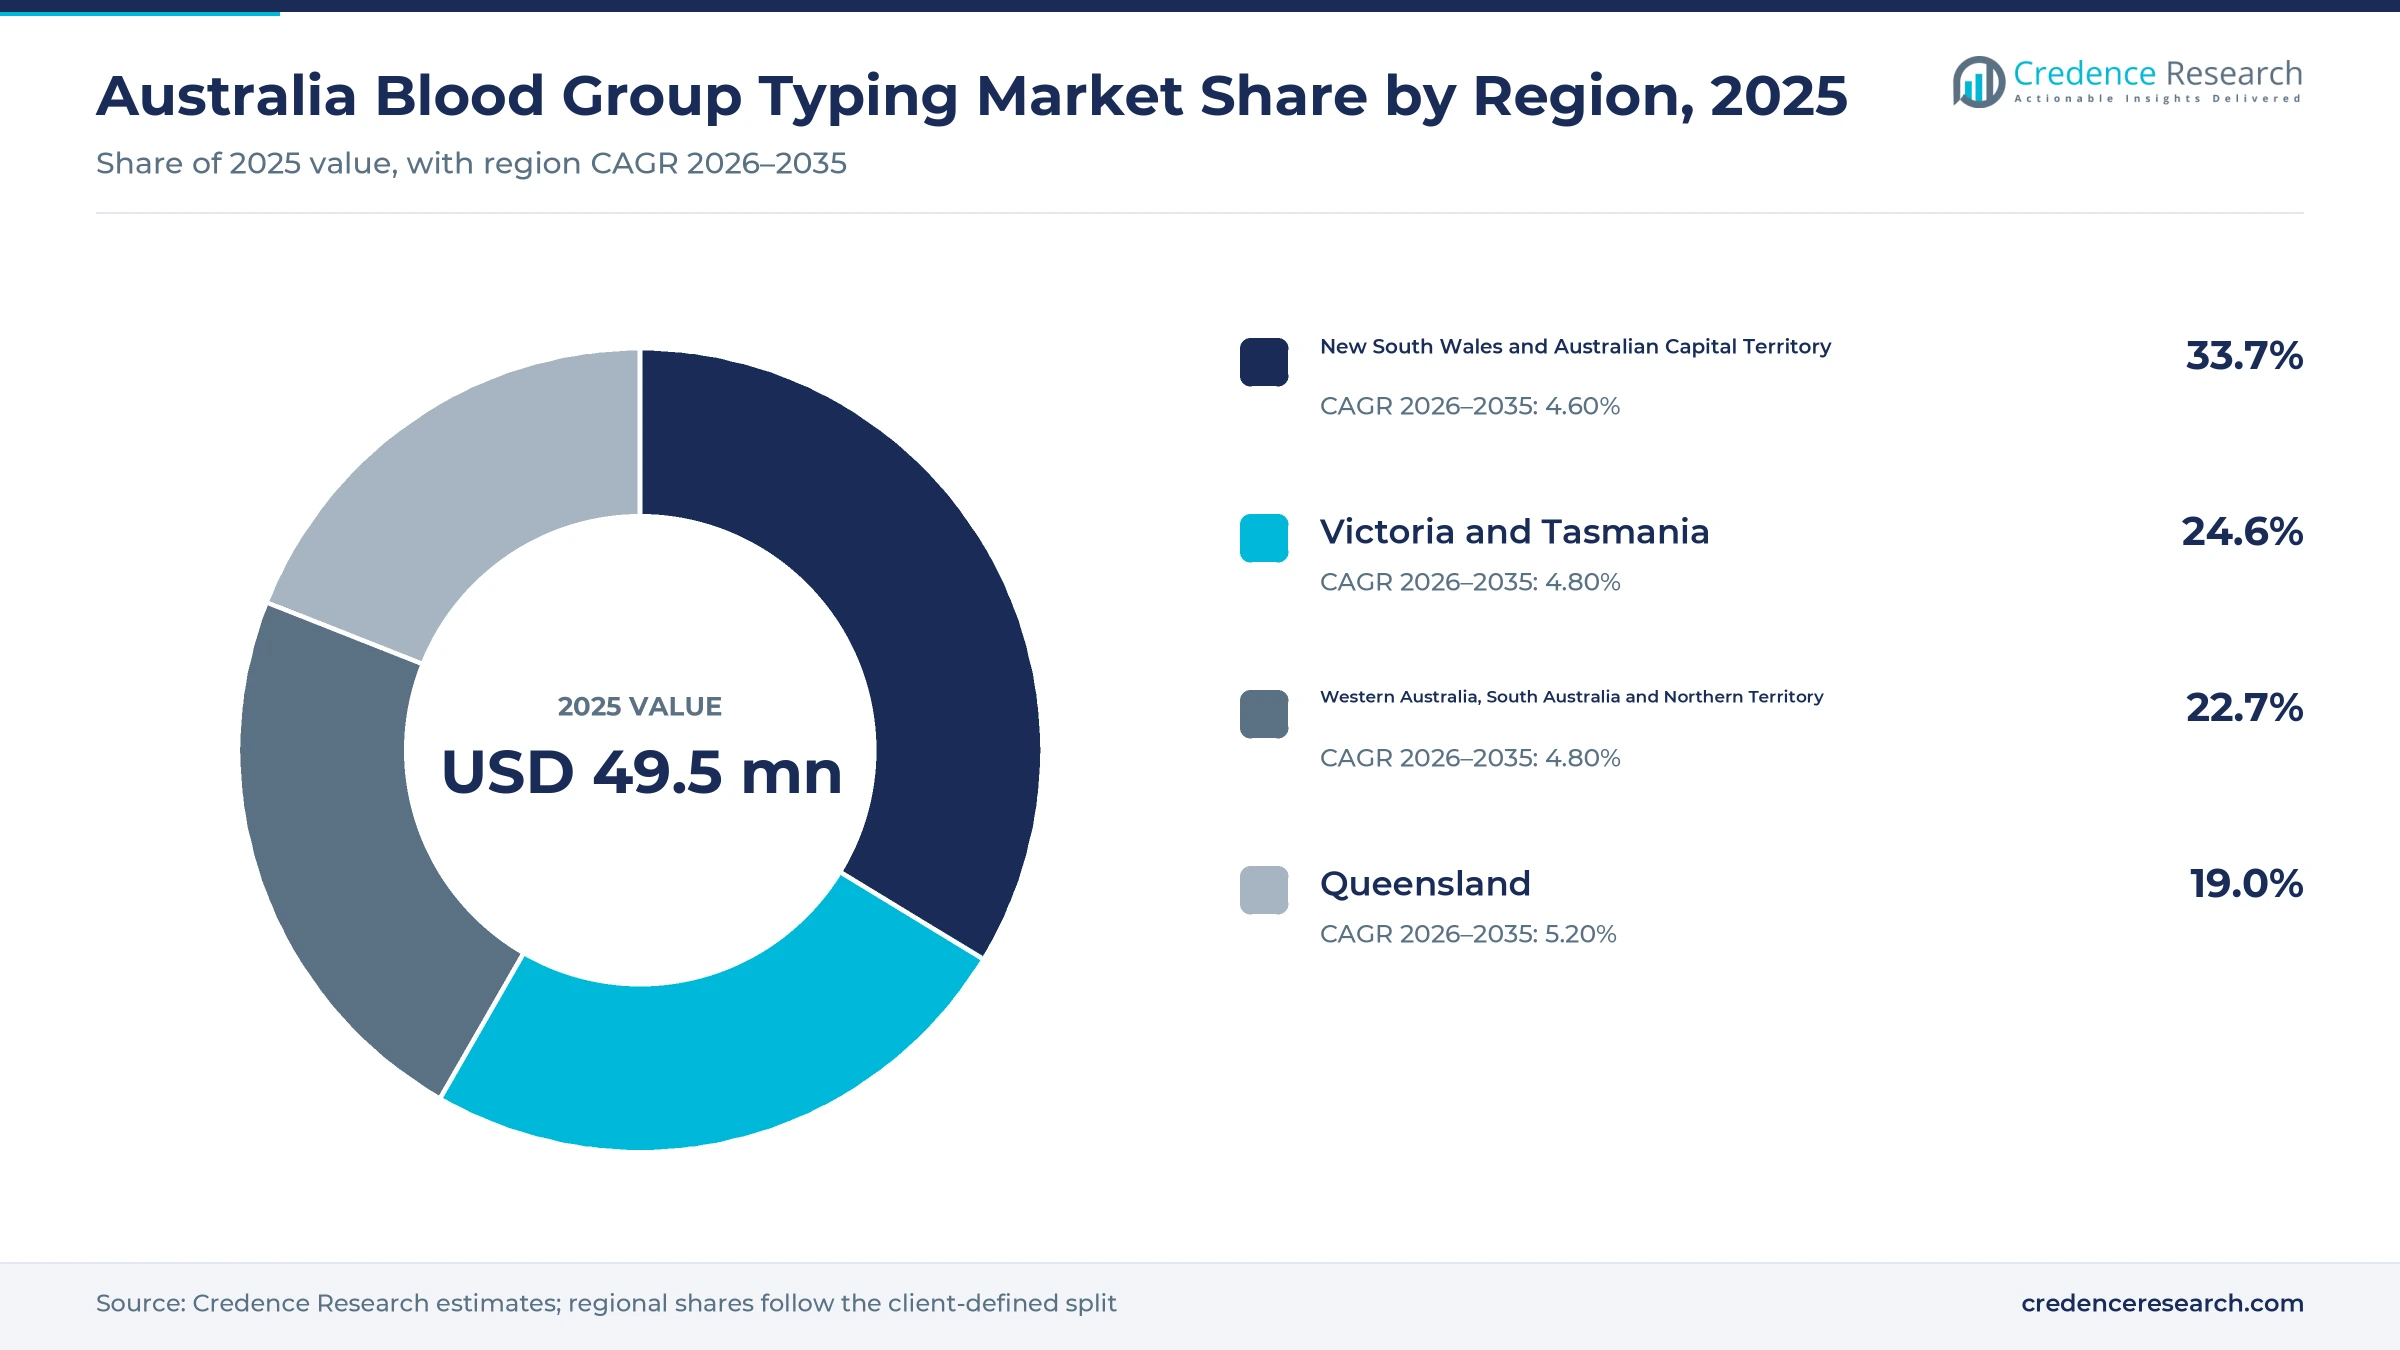
The Australia blood group typing market was valued at USD 49.5 million in 2025 and is projected to increase from USD 58.0 million in 2026 to USD 88.5 million by 2035, registering a CAGR of 4.81% during 2026–2035. Demand comes from hospital transfusion laboratories, private pathology groups, antenatal clinics and the national blood service, which test ABO and RhD groups and screen for red cell antibodies before transfusions and during pregnancy. New South Wales and Australian Capital Territory held the largest regional share, 33.7% in 2025, because the zone has the largest population and hospital network. Queensland is the fastest-growing region at 5.20% a year, as population growth and the Brisbane processing of fetal RhD tests lift volumes. In turn, national supply arrangements for red cell diagnostic products were re-established from July 1, 2025, and run until at least June 30, 2028.
Which red cell tests and products does the estimate cover?
The estimate measures spending on serological reagents, automated immunohaematology analyzers and molecular blood group genotyping used to find ABO and RhD groups, detect red cell antibodies, check compatibility and resolve extended antigens in Australia. It counts purchases by the national blood service, hospital pathology services and independent pathology providers through national standing offers, direct contracts and specialist distributors.
The estimate excludes blood components, anti-D immunoglobulin, infectious disease screening of donations and general hematology analyzers. The value chain runs from global reagent and instrument makers through Australian subsidiaries and distributors to transfusion laboratories, which report results to doctors, midwives and blood banks.
Australia Blood Group Typing Market Insights
- The Australia blood group typing market was valued at USD 49.5 million in 2025 and is projected to reach USD 88.5 million by 2035, registering a CAGR of 4.81% during 2026–2035.
- New South Wales and Australian Capital Territory held a 33.7% share of 2025 value, because the zone has the most hospitals, transfusions and births.
- Serological reagents led with a 62.0% share of 2025 value, because every transfusion and antenatal sample needs grouping and antibody screening.
- Australian hospitals were issued 708,478 red blood cell units in 2024–25, up 0.7% on the year before, according to national blood data.
- Molecular blood group genotyping grows fastest at 6.75% a year during 2026–2035, as fetal RhD testing and variant resolution move into routine care.
Reagents lead while molecular genotyping grows fastest
Why do serological reagents lead value?
Based on product type, the market is categorized into serological reagents, automated immunohaematology analyzers and molecular blood group genotyping. Serological Reagents led with a 62.0% share of 2025 value, because laboratories use antisera, reagent red cells and gel cards for every sample. Molecular Blood Group Genotyping grows fastest at 6.75% a year, as DNA methods resolve RhD and rare antigen questions.
How do routine grouping and antibody work split demand?
Based on application, the market is categorized into routine blood group determination, compatibility and antibody investigation, and extended antigen and variant resolution. Routine Blood Group Determination led with a 48.0% share of 2025 value, because ABO and RhD tests are needed before every transfusion and in pregnancy. Extended Antigen and Variant Resolution grows fastest at 6.35% a year, as complex patients need matched blood.
Which laboratories buy the most typing products?
Based on end user, the market is categorized into blood collection organizations, hospital pathology services and independent pathology providers. Hospital Pathology Services led with a 50.0% share of 2025 value, because public hospital laboratories perform most pre-transfusion testing. Independent Pathology Providers grow fastest at 5.19% a year, as private groups expand antenatal and outpatient testing.
How do national standing offers shape buying?
Based on sales channel, the market is categorized into national standing offer supply, direct institutional contracts and specialist distributor supply. National Standing Offer Supply led with a 55.0% share of 2025 value, because governments fund red cell diagnostic products for approved public laboratories. Specialist Distributor Supply grows fastest at 5.31% a year, as molecular kits reach specialist laboratories through distributors.
| Segment Group | Leading Sub-segment | Share, 2025 | Fastest-growing Sub-segment | CAGR, 2026–2035 |
|---|---|---|---|---|
| By Product Type | Serological Reagents | 62.0% | Molecular Blood Group Genotyping | 6.75% |
| By Application | Routine Blood Group Determination | 48.0% | Extended Antigen and Variant Resolution | 6.35% |
| By End User | Hospital Pathology Services | 50.0% | Independent Pathology Providers | 5.19% |
| By Sales Channel | National Standing Offer Supply | 55.0% | Specialist Distributor Supply | 5.31% |
Request a Free Sample
Fill in your details and we'll send you a free sample report.
- Sample data tables & charts
- Research methodology
Recurring tests, molecular methods and national supply
How does recurring compatibility testing sustain demand?
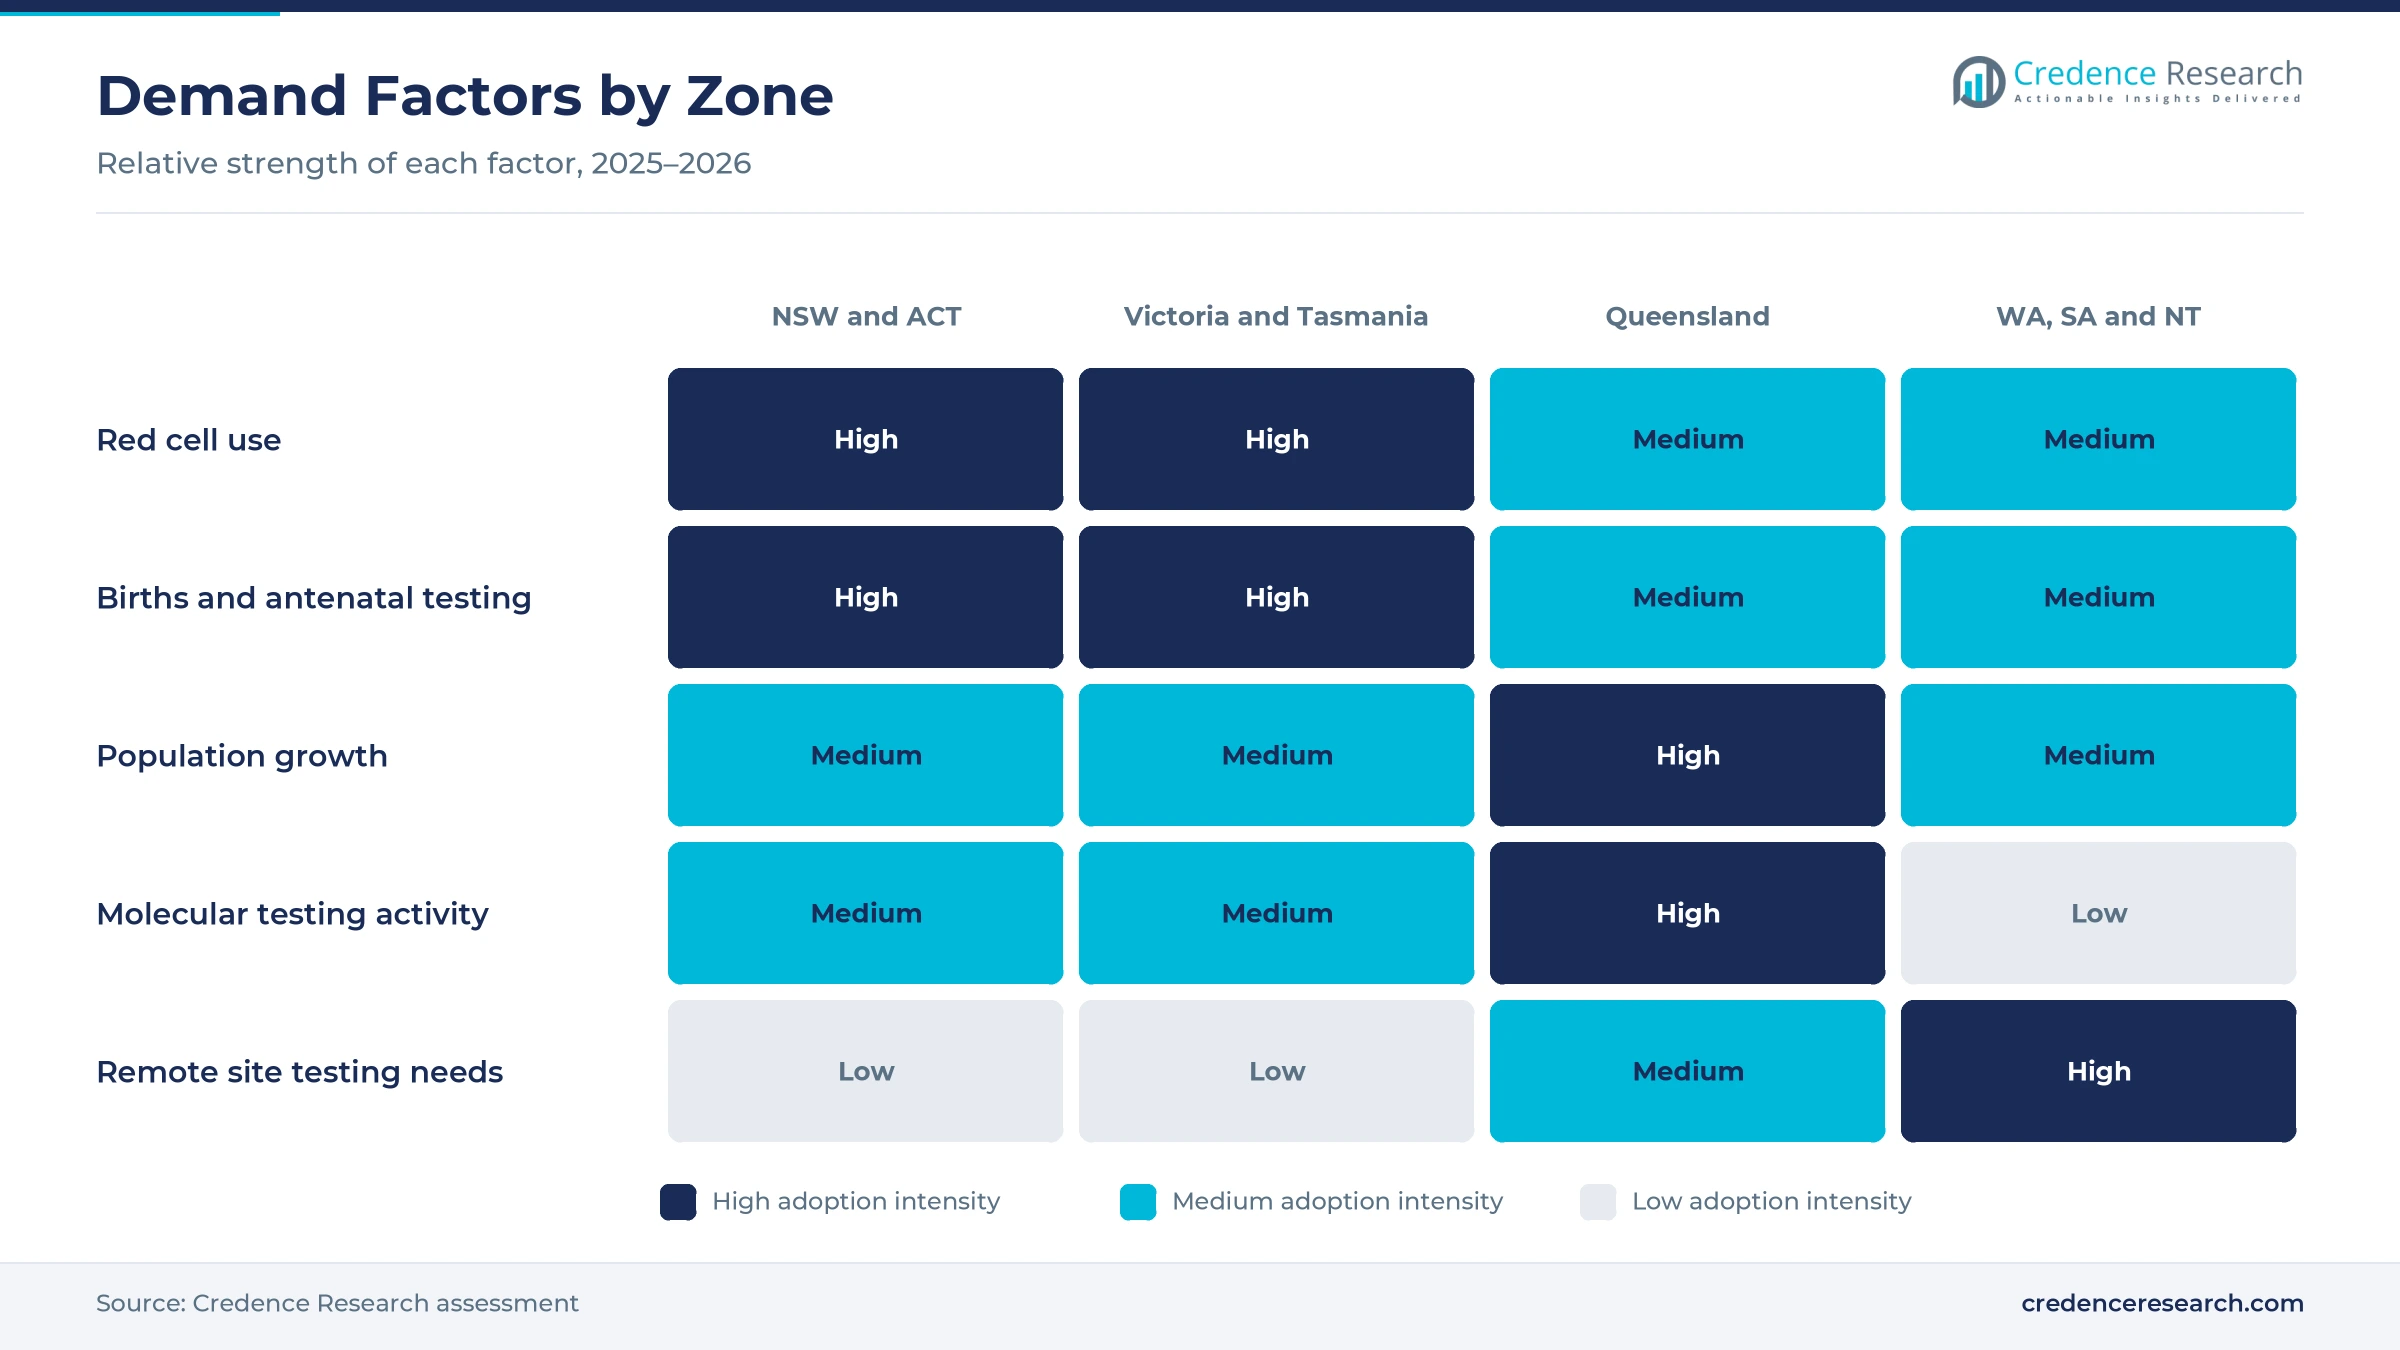
Recurring compatibility testing sustains demand, because every transfusion and most pregnancies need ABO and RhD grouping and an antibody screen. Australian hospitals were issued 708,478 red blood cell units in 2024–25, up 4,882 units or 0.7% on the year before, at 25.9 issues per 1,000 people. Australia also registered 292,318 births in 2024, up 1.9% on 2023, according to the Australian Bureau of Statistics. Each pregnancy needs grouping and antibody screening, and RhD-negative mothers need more tests. As a result, routine blood group determination holds 48.0% of 2025 value, while these tests remain a core part of the wider in vitro diagnostics sector.
Why are molecular methods gaining clinical use?
Molecular methods are gaining clinical use, because serology cannot always resolve weak, partial or rare antigens. The international blood transfusion society recognized 47 blood group systems with 366 antigens as of June 2024, according to a report led by Lifeblood researchers and indexed by the National Library of Medicine. Lifeblood researchers used targeted next-generation sequencing in a 2026 study of 191 donors to predict RhD and RhCE types. A 2025 case report with Lifeblood co-authors also used a panel covering 45 blood group systems to resolve a Bombay-type result. As a result, molecular blood group genotyping grows fastest at 6.75% a year.
How does national supply support workflow standardization?
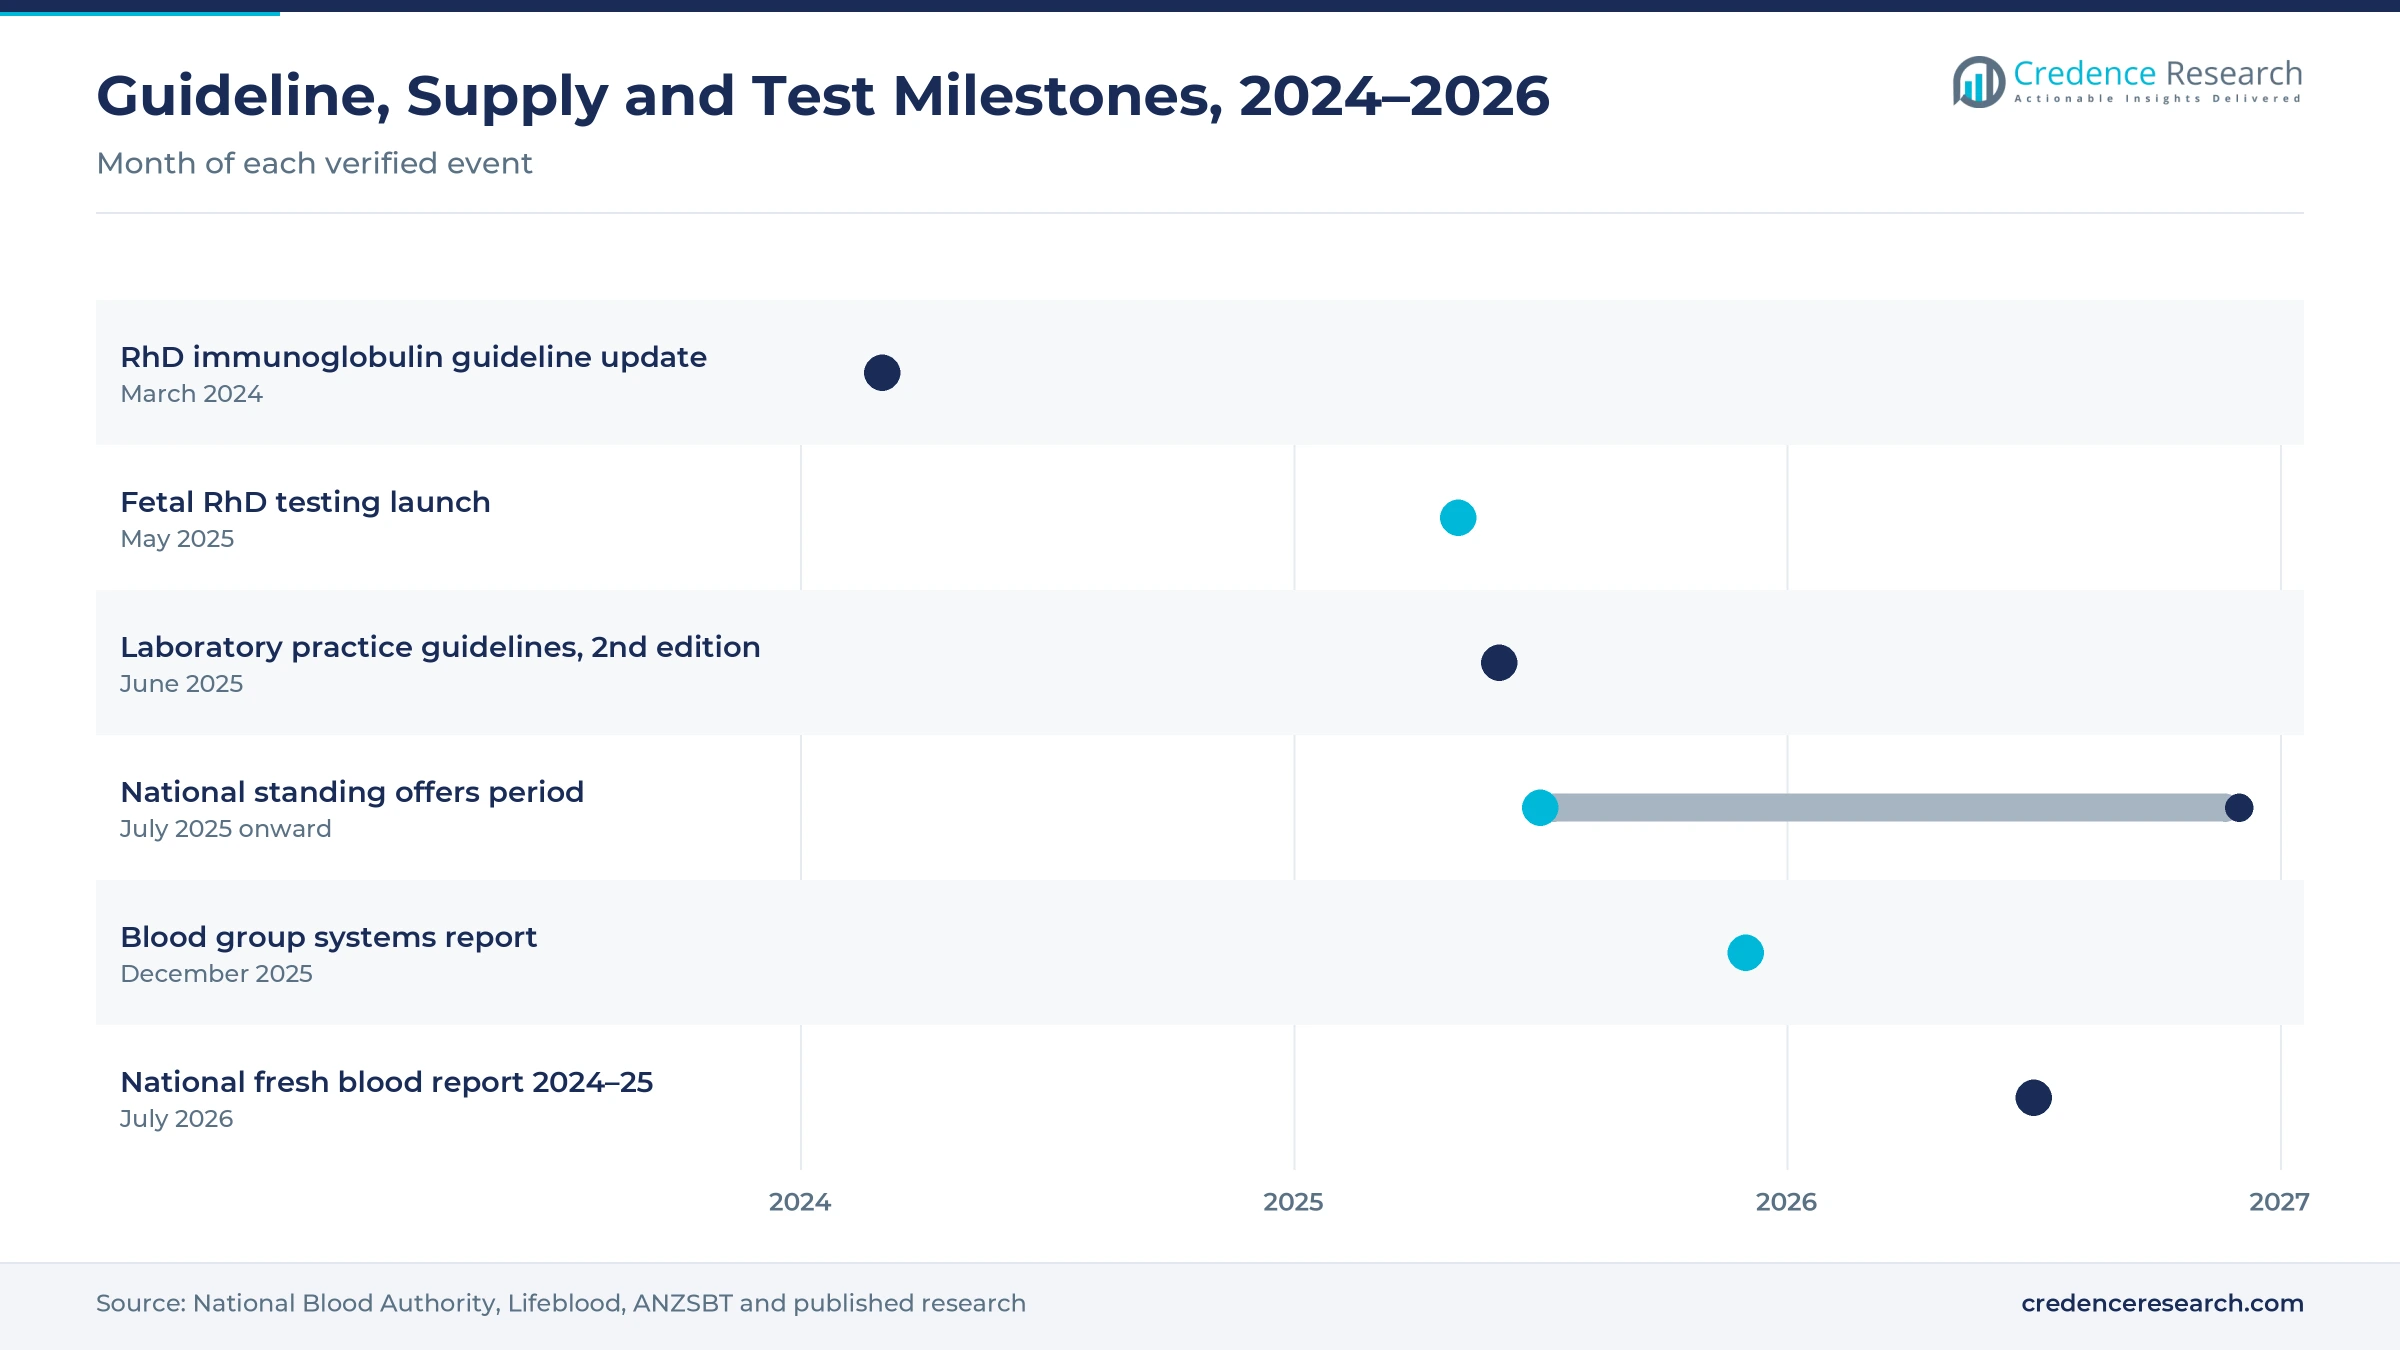
National supply supports workflow standardization, because one set of approved products and prices serves public laboratories in every state. The National Blood Authority re-established red cell diagnostic product supply from July 1, 2025, with standing offers that run until at least June 30, 2028. Four suppliers hold these offers, namely Bio-Rad Laboratories, Grifols Australia, Ortho-Clinical Diagnostics, now QuidelOrtho and Immulab. From July 1, 2025, purchases have no funding cap and no separate delivery charge for laboratories, and the Australian, state and territory governments fund them jointly. In turn, national standing offer supply holds 55.0% of 2025 value across public laboratories.
Why does the changing blood type mix add testing?
The changing blood type mix adds testing, because hospitals rely more on scarce RhD-negative units. A Lifeblood study in the Medical Journal of Australia found that 14.1% of people typed by pathology services were RhD-negative. The share of O RhD-negative red cell units issued rose from 11.7% in 2010–11 to 17.4% in 2019–20. RhD-negative donors also made up 20.5% of all donors in 2019 but only 16.2% of first-time donors. As a result, laboratories confirm groups more carefully, and compatibility and antibody investigation holds a large place in daily laboratory work, supporting demand for transfusion diagnostics across public and private hospitals.
Fetal RhD testing, automation and genotyping shape use
How is the shift to targeted antenatal RhD care changing tests?
The shift to targeted antenatal RhD care is changing tests, because doctors now predict the RhD type of the fetus before giving prophylaxis. The National Blood Authority introduced an updated guideline on RhD immunoglobulin in March 2024, which supports fetal RHD testing for all RhD-negative pregnant women in Recommendation 9. Lifeblood launched RhD testing from maternal blood on May 28, 2025, using samples collected after 15 weeks of gestation. The test is bulk billed to Medicare for eligible patients, after pathologists won Commonwealth funding in two settings. As a result, non-invasive prenatal testing for RhD adds molecular volume, which lifts the fastest-growing product group.
Why is the rise of standardized laboratory practice notable?
The rise of standardized laboratory practice is notable, because new guidance sets common rules for transfusion testing. The Australian and New Zealand Society of Blood Transfusion published the second edition of its laboratory practice guidelines in June 2025, replacing the January 2020 edition. These 2025 guidelines treat ABO and RhD determination and antibody screening as core requirements for safe practice. The national price list for 2025–28 also gives public laboratories the same reagent options from four suppliers, with no funding cap on purchases since July 2025. In turn, laboratories favor automated immunohaematology analyzers, which hold 62.0% less than reagents but add steady service contracts.
Can donor genotyping open a new opening for suppliers?
Donor genotyping can open a new opening for suppliers, because blood services need to find rare donors faster. The number of recognized blood group systems reached 47 by June 2024, with four new systems ratified between December 2021 and June 2024. O RhD-negative red cell units also rose to 17.4% of issues by 2019–20, which increases pressure on rare and negative donor panels. Lifeblood researchers already use next-generation sequencing panels to predict phenotypes from donor DNA. As a result, suppliers of high-throughput genotyping arrays and sequencing panels can win projects with blood services, while extended antigen and variant resolution grows at 6.35% a year.
Is there room to grow in private and outpatient testing?
Suppliers have room to grow in private and outpatient testing, because more antenatal and outpatient samples go to private pathology groups. Australia registered 292,318 births in 2024, and the total fertility rate was 1.481 births per woman. The median age of mothers reached 32.1 years, which keeps antenatal care visits and repeat antibody screens steady. Fetal RhD testing is also bulk billed for eligible patients, which supports referrals from community clinics. In turn, independent pathology providers grow fastest at 5.19% a year, and suppliers with compact analyzers and distributor support can serve smaller private laboratories in growing suburbs and regional towns.
Fixed pricing, skills and rare variants test laboratories
How does fixed national pricing squeeze margins?
Fixed national pricing squeezes margins, because standing offers set reagent prices for several years. As a result, suppliers cannot easily pass on higher costs for freight, raw materials or currency changes. Companies respond with analyzer service bundles, broader menus and reliable delivery, which help them protect volume when public laboratories compare products against the national price list each year. Smaller suppliers often find it hard to compete for these multi-year national agreements.
Why do workforce shortages slow laboratory work?
Workforce shortages slow laboratory work, because transfusion science needs trained staff for antibody investigations and complex cases. In turn, regional laboratories may send more samples to reference centers, which delays results for patients and clinicians. Suppliers respond with automation, remote support and training programs, which help smaller laboratories keep testing on site and reduce manual steps during busy shifts. Shared reference networks also help regional sites handle complex antibody cases.
How do rare variants complicate testing?
Rare variants complicate testing, because weak, partial or unusual antigens can give unclear serology results. As a result, laboratories must repeat tests or refer samples, which raises costs and delays compatible blood for some patients. Suppliers respond with molecular kits and reference laboratory links, which help resolve these cases faster and support safer matching for patients who need regular transfusions. Patients with thalassemia and sickle cell disease benefit most from this matching.
Why does molecular test reimbursement remain limited?
Molecular test reimbursement remains limited, because public funding covers only some genotyping uses. In turn, many laboratories still rely on serology for extended typing, even when DNA methods would give clearer answers. Suppliers respond with evidence on outcomes and costs, which supports applications for wider Medicare funding and helps hospitals justify buying sequencing and array platforms over time. Clearer funding rules would speed adoption in public and private hospital laboratories.
NSW and ACT lead while Queensland grows fastest
| Region | Value, 2025 (USD million) | Share, 2025 | CAGR, 2026–2035 |
|---|---|---|---|
| New South Wales and Australian Capital Territory | 16.7 | 33.7% | 4.60% |
| Victoria and Tasmania | 12.2 | 24.6% | 4.80% |
| Western Australia, South Australia and Northern Territory | 11.2 | 22.7% | 4.80% |
| Queensland | 9.4 | 19.0% | 5.20% |
Why do new South Wales and the ACT hold the top share?
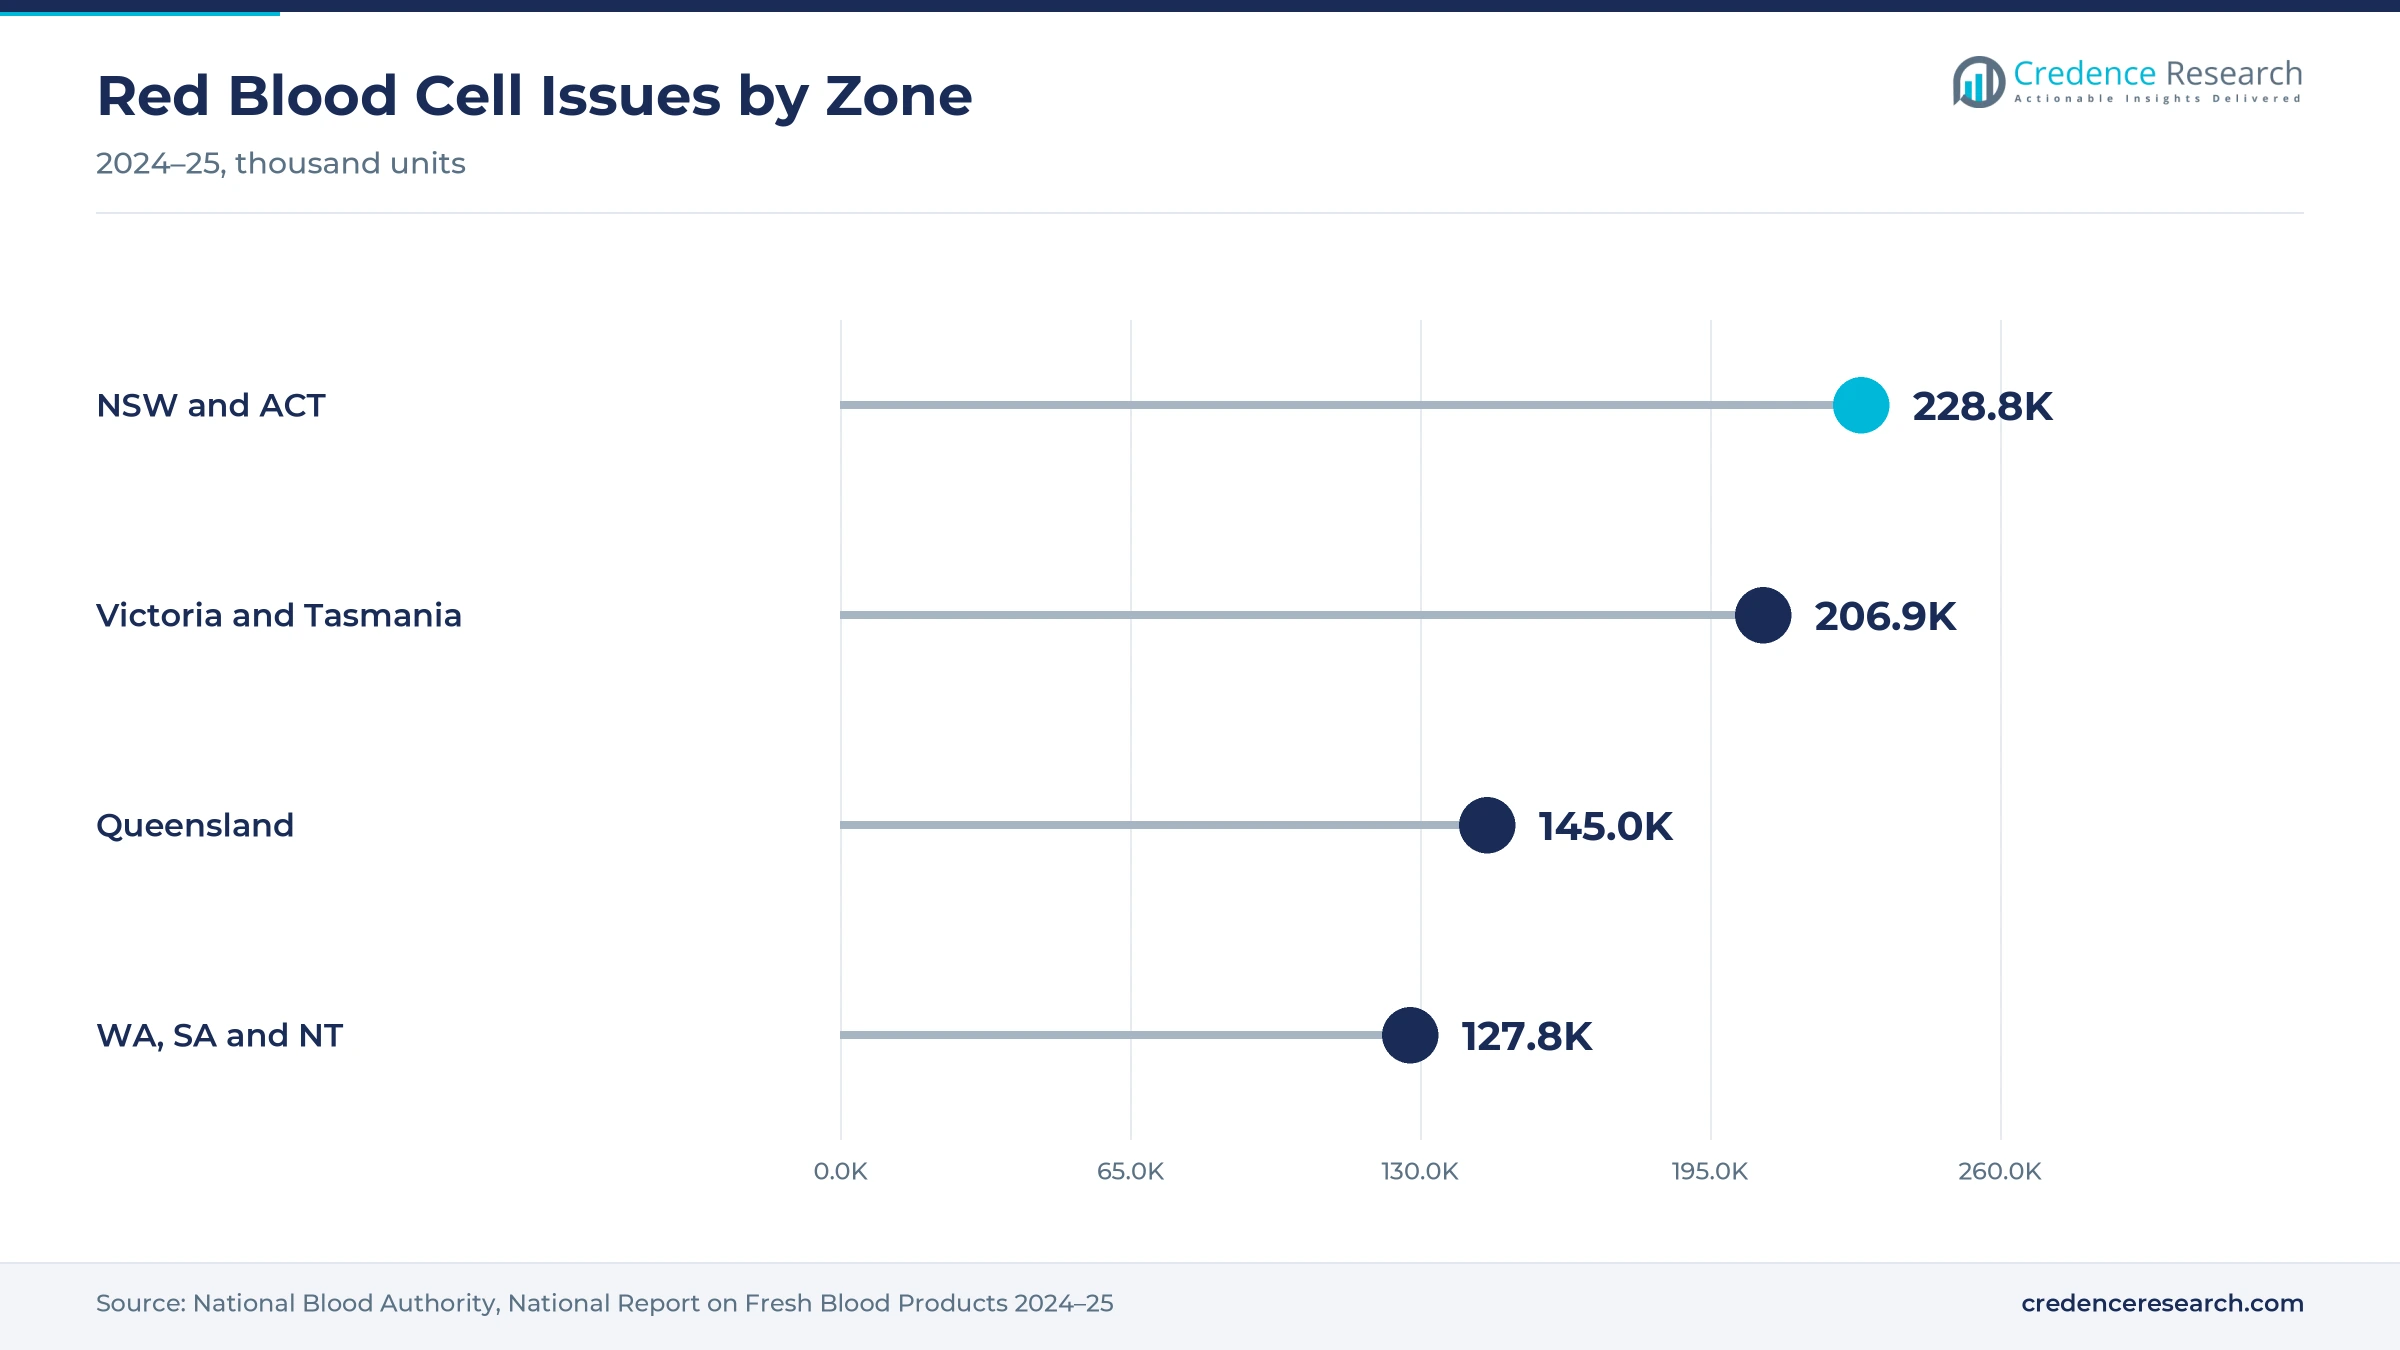
New South Wales and Australian Capital Territory held a 33.7% share of 2025 value and grow at 4.60% a year, because the zone has the largest population and hospital network. New South Wales hospitals were issued 217,237 red blood cell units in 2024–25, the most of any state. The ACT added a further 11,547 units, or 24.0 per 1,000 people, which supports steady demand for grouping and antibody screening.
How do Victoria and Tasmania support demand?
Victoria and Tasmania held a 24.6% share of 2025 value and grow at 4.80% a year, because Melbourne has a dense network of public and private hospitals. Victorian hospitals were issued 192,050 red blood cell units in 2024–25, or 27.4 per 1,000 people. Tasmania added 14,832 units, and these volumes keep transfusion laboratories busy with compatibility testing throughout the year.
Why is Queensland growing fastest?
Queensland held a 19.0% share of 2025 value and grows fastest at 5.20% a year, because the state has a large and growing population with high hospital use. Queensland hospitals were issued 145,025 red blood cell units in 2024–25, or 25.8 per 1,000 people. In turn, Brisbane also hosts the Lifeblood processing center for fetal RhD tests, which adds molecular testing activity in the state.
How do Western Australia, South Australia and the NT perform?
Western Australia, South Australia and Northern Territory held a 22.7% share of 2025 value and grow at 4.80% a year. South Australia had the highest issue rate, at 30.9 red cell units per 1,000 people in 2024–25, while Western Australia recorded 64,956 units. As a result, demand is steady, although remote sites rely on regional laboratories and transport.
Guidelines, supply deals and test launches, 2024–2026
| Development | Status and market relevance |
|---|---|
| In March 2024, the National Blood Authority released an updated guideline supporting fetal RHD testing for all RhD-negative pregnant women. | Guides targeted prophylaxis |
| In May 2025, Lifeblood began offering RhD non-invasive prenatal testing, bulk billed to Medicare for eligible patients. | Adds molecular test volume |
| In June 2025, the Australian and New Zealand Society of Blood Transfusion published the second edition of its laboratory practice guidelines. | Sets common testing rules |
| In July 2025, national standing offers for red cell diagnostic products began with four suppliers, running until at least June 2028. | No funding cap on purchases |
| In December 2025, a Lifeblood-led report confirmed 47 recognized blood group systems with 366 antigens as of June 2024. | Widens the antigen menu |
Column, solid-phase and DNA methods define testing
- Tube and microplate agglutination mixes red cells with antisera and reads visible clumping, which keeps costs low for routine and backup testing.
- Column agglutination traps clumped cells in gel or glass bead cards, which gives clear, stable reactions that analyzers can read automatically.
- Solid-phase testing binds antigens or antibodies to coated wells, which suits automated antibody screening in high-volume laboratories.
- Molecular genotyping reads blood group genes from DNA, which resolves weak and partial antigens and predicts fetal RhD type from maternal blood.
Need a Custom Version of This Report?
Tailor the scope, geography, or segments to your exact requirements.
- Custom geography or segment scope
- Direct access to our analyst team
Reagent makers compete through national standing offers
Competition is led by global reagent and instrument makers that supply Australian laboratories through local subsidiaries and distributors. Bio-Rad Laboratories, Grifols Australia, QuidelOrtho, through Ortho-Clinical Diagnostics Australia, and Immulab hold national standing offers for red cell diagnostic products until at least June 2028. These offers give approved public and blood banking laboratories access to agreed products and prices, funded jointly by governments. Rivals compete on analyzer reliability, reagent menus, service support and delivery. Because public laboratories buy through the national price list, suppliers that win standing offers secure most hospital volume. Makers of molecular kits compete for reference and specialist laboratories that resolve variants and fetal RhD questions. Werfen also expanded its transfusion portfolio when it acquired Immucor in 2023, adding the Immucor transfusion diagnostics range to its portfolio.
Which companies supply Australian laboratories?
| Company | Type | Role in the market |
|---|---|---|
| Bio-Rad Laboratories | Reagent and analyzer maker | Holds a national standing offer for red cell diagnostic products |
| Grifols | Reagent and analyzer maker | Grifols Australia holds a national standing offer |
| QuidelOrtho | Reagent and analyzer maker | Supplies through Ortho-Clinical Diagnostics Australia under a standing offer |
| Immulab | Australian reagent supplier | Holds a national standing offer for red cell diagnostic products |
Credence Research view on red cell testing demand
Credence Research's view is that Australian blood group typing demand will grow steadily because transfusions, pregnancies and antibody investigations create repeat testing every year. Serological reagents remain the largest value pool, while molecular methods add the fastest growth as fetal RhD testing and variant resolution expand. National standing offers will keep most public volume with four suppliers until at least 2028. Suppliers with automation, broad menus and molecular options should gain the most, while fixed pricing keeps margins tight.
How the national red cell testing estimate was built
The report uses 2025 as the base year on a calendar basis, and market values come from the Credence Research model. That model combines national red cell issue data, birth statistics, national supply arrangements, clinical guidelines, published research and supplier information. Segment splits and zone growth rates are Credence Research estimates, while zone shares follow the client-defined split. Sources used are official statistics, government and blood service publications, professional society guidelines and peer-reviewed research, and no interviews or surveys were used.
Molecular tests and automation carry growth to 2035
Red cell testing value is expected to reach USD 88.5 million by 2035, a 4.81% CAGR during 2026–2035, as transfusion and antenatal care keep test volumes steady. Growth should be strongest in molecular genotyping, extended antigen work and private pathology, because DNA methods resolve cases that serology cannot. The renewal of national standing offers after 2028 will shape supplier shares. Wider Medicare funding for genotyping would speed growth, while fixed pricing and staff shortages could slow it.
Frequently Asked Questions
How big is the Australia blood group typing market?
Which product type leads Australian value?
Which region leads the Australian market?
How many red blood cell units do Australian hospitals use?
What is fetal RhD testing and who offers it?
How do public laboratories buy typing products?
Who are the leading companies in the Australian market?
What are the main challenges for suppliers?
Table of Content
Chapter 1 Market Segmentation
- 1.1 Segmentation Framework
- 1.1.1 Product and Service Classification
- 1.1.2 Application and End-Use Classification
- 1.1.3 Technology and Solution Classification
- 1.1.4 Customer and Distribution Channel Classification
- 1.1.5 Geographic Segmentation
- 1.1.6 Market Segment Definitions and Boundaries
- 1.2 By Product Type
- 1.2.1 Serological Reagents
- 1.2.2 Automated Immunohaematology Analyzers
- 1.2.3 Molecular Blood Group Genotyping
- 1.3 By Application
- 1.3.1 Routine Blood Group Determination
- 1.3.2 Compatibility and Antibody Investigation
- 1.3.3 Extended Antigen and Variant Resolution
- 1.4 By End User
- 1.4.1 Blood Collection Organizations
- 1.4.2 Hospital Pathology Services
- 1.4.3 Independent Pathology Providers
- 1.5 By Sales Channel
- 1.5.1 National Standing Offer Supply
- 1.5.2 Direct Institutional Contracts
- 1.5.3 Specialist Distributor Supply
Chapter 2 Introduction
- 2.1 Report Objectives and Scope
- 2.2 Product Definition and Industry Terminology
- 2.3 Market Inclusions and Exclusions
- 2.4 Research Process
- 2.4.1 Primary Research and Expert Interviews
- 2.4.2 Secondary Research and Source Review
- 2.4.3 Top-Down and Bottom-Up Estimation
- 2.4.4 Data Triangulation and Verification
- 2.5 Market Size Measurement Basis
- 2.5.1 2025: USD 49.5 million → 2035: USD 88.5 million
- 2.6 Historical and Forecast Reference Periods
- 2.6.1 Historical Period: 2018-2025
- 2.6.2 Base Year: 2025
- 2.6.3 Forecast Period: 2025-2035
- 2.7 Research Assumptions and Limitations
Chapter 3 Executive Summary
- 3.1 Market Snapshot and Key Findings
- 3.2 Base-Year Market Size, 2025
- 3.3 Forecast Market Size, 2035
- 3.4 Revenue and Volume Growth Outlook
- 3.5 Key Demand and Supply Indicators
- 3.6 Leading Market Segments
- 3.7 Fastest-Growing Market Opportunities
- 3.8 Regional Performance Highlights
- 3.9 Technology and Industry Transformation
- 3.10 Competitive Landscape Summary
- 3.11 Analyst View and Strategic Implications
Chapter 4 Australia Blood Group Typing Market Trends and Developments
- 4.1 Historical Industry Development, 2018-2025
- 4.2 Recent Market Trends and Developments
- 4.3 Demand and Customer Behavior Trends
- 4.4 Technology and Product Innovation
- 4.5 Artificial Intelligence, Automation and Digitalization
- 4.6 Local Manufacturing and Supply Chain Realignment
- 4.7 Industry Partnerships, Mergers and Acquisitions
- 4.8 Sustainability and Circular Economy Developments
- 4.9 Government and Private Sector Investment Trends
- 4.10 Emerging Business Models and Commercialization
- 4.11 Industry Developments and Announcements
Chapter 5 Australia Blood Group Typing Market Production, Supply and Demand Analysis
- 5.1 Demand Trend and Consumption Analysis, 2018-2025
- 5.2 Demand Forecast, 2025-2035
- 5.3 Production and Output Trend, 2018-2025
- 5.4 Production and Output Forecast, 2025-2035
- 5.5 Installed Capacity and Capacity Utilization
- 5.6 Company-Wise Production Plants and Statistics
- 5.6.1 Installed Production Capacity
- 5.6.2 Actual Production
- 5.6.3 Planned Capacity and Expansion Targets
- 5.7 Supply Chain Structure and Procurement Trends
- 5.8 Supply-Demand Gap and Bottlenecks
- 5.9 Import Dependence and Sourcing Structure
- 5.10 Contract Manufacturing and Outsourcing
- 5.11 Regional Supply and Demand Concentration
Chapter 6 Australia Blood Group Typing Market Pricing Analysis
- 6.1 Pricing Structure and Measurement
- 6.2 Historical Pricing Trends, 2018-2025
- 6.3 Pricing Outlook, 2025-2035
- 6.4 Average Selling Price and Unit Economics
- 6.5 Pricing by Product and Market Segment
- 6.6 Geographic Pricing Differences
- 6.7 Key Input, Energy, Labor and Logistics Costs
- 6.8 Contract Pricing and Purchasing Models
- 6.9 Pricing Sensitivity and Competitive Positioning
- 6.10 Price, Margin and Profitability Implications
Chapter 7 Australia Blood Group Typing Market Dynamics
- 7.1 Market Growth Drivers
- 7.1.1 Demand-Side Drivers
- 7.1.2 Technology and Innovation Drivers
- 7.1.3 Infrastructure and Investment Drivers
- 7.1.4 Regulatory and Policy Drivers
- 7.2 Market Restraints
- 7.2.1 Cost and Affordability Constraints
- 7.2.2 Technology and Adoption Barriers
- 7.2.3 Supply Chain and Operational Constraints
- 7.3 Market Challenges
- 7.3.1 Competitive Pressure and Margin Erosion
- 7.3.2 Skills, Infrastructure and Implementation Gaps
- 7.4 Emerging Market Opportunities
- 7.5 Market Dynamics Impact and Time-Horizon Assessment
Chapter 8 Australia Blood Group Typing Value Chain Analysis
- 8.1 Industry Value Chain Overview
- 8.2 Upstream Suppliers and Critical Inputs
- 8.3 Technology and Component Providers
- 8.4 Manufacturing or Service Delivery
- 8.5 Distribution, Channel Partners and Integrators
- 8.6 Downstream Applications and End Users
- 8.7 Value Addition and Profit Pools
- 8.8 Vertical Integration and Outsourcing
- 8.9 Supplier Concentration and Risk
- 8.10 Supply Chain Localization and Resilience
Chapter 9 Australia Blood Group Typing Market Regulations and Policies
- 9.1 Relevant Laws, Standards and Compliance Frameworks
- 9.2 Product, Service, Safety and Quality Requirements
- 9.3 Government Policies, Incentives and Subsidies
- 9.4 Imports, Exports and Trade Barriers
- 9.5 Public Procurement and Local Content Requirements
- 9.6 Environmental and Sustainability Compliance
- 9.7 Upcoming Policy Changes and Market Implications
Chapter 10 Australia Blood Group Typing Market Hotspots and Opportunities
- 10.1 Market Opportunity Mapping and Growth Hotspots
- 10.2 High-Growth Applications and Customer Groups
- 10.3 Underserved Markets and White-Space Opportunities
- 10.4 Emerging Technology and Product Opportunities
- 10.5 New Capacity and Investment Hotspots
- 10.6 Market Entry and Expansion Opportunities
- 10.7 Distribution and Partnership Opportunities
- 10.8 Near-Term and Long-Term Commercial Potential
- 10.9 Opportunity Attractiveness and Execution Risks
Chapter 11 Australia Blood Group Typing Market Outlook, 2025-2035
- 11.1 Market Size and Analysis
- 11.1.1 Revenue (Market Measurement: 2025: USD 49.5 million → 2035: USD 88.5 million)
- 11.1.2 Market Volume and Quantity Sold
- 11.1.3 Historical Market Size, 2018-2025
- 11.1.4 Base-Year Market Size, 2025
- 11.2 Market Forecast, 2025-2035
- 11.2.1 Revenue Forecast to 2035
- 11.2.2 Volume Forecast to 2035
- 11.2.3 CAGR and Year-on-Year Growth
- 11.2.4 Incremental Revenue Opportunity
- 11.3 Forecast Assumptions and Scenario Analysis
- 11.3.1 Base-Case Forecast
- 11.3.2 Optimistic and Conservative Scenarios
- 11.3.3 Technology, Pricing and Policy Sensitivities
- 11.4 Market Attractiveness and Growth Outlook
Chapter 12 Australia Blood Group Typing Market Segmentation and Outlook
- 12.1 Segmentation Summary and Market Shares, 2025
- 12.2 Largest and Fastest-Growing Segments
- 12.3 By Product Type - Market Size and Forecast, 2025-2035
- 12.3.1 Segment Definition and Scope
- 12.3.2 Historical Market Size, 2018-2025
- 12.3.3 Revenue Forecast, 2025-2035
- 12.3.4 Volume Forecast, 2025-2035
- 12.3.5 Base-Year Market Share, 2025
- 12.3.6 Segment CAGR and Growth Drivers
- 12.3.7 Subsegment Market Size and Forecast
- 12.3.7.1 Serological Reagents
- 12.3.7.2 Automated Immunohaematology Analyzers
- 12.3.7.3 Molecular Blood Group Genotyping
- 12.3.8 Subsegment Pricing and Adoption Trends
- 12.3.9 Leading Suppliers and Competition
- 12.3.10 Regional Demand and Opportunities
- 12.4 By Application - Market Size and Forecast, 2025-2035
- 12.4.1 Segment Definition and Scope
- 12.4.2 Historical Market Size, 2018-2025
- 12.4.3 Revenue Forecast, 2025-2035
- 12.4.4 Volume Forecast, 2025-2035
- 12.4.5 Base-Year Market Share, 2025
- 12.4.6 Segment CAGR and Growth Drivers
- 12.4.7 Subsegment Market Size and Forecast
- 12.4.7.1 Routine Blood Group Determination
- 12.4.7.2 Compatibility and Antibody Investigation
- 12.4.7.3 Extended Antigen and Variant Resolution
- 12.4.8 Subsegment Pricing and Adoption Trends
- 12.4.9 Leading Suppliers and Competition
- 12.4.10 Regional Demand and Opportunities
- 12.5 By End User - Market Size and Forecast, 2025-2035
- 12.5.1 Segment Definition and Scope
- 12.5.2 Historical Market Size, 2018-2025
- 12.5.3 Revenue Forecast, 2025-2035
- 12.5.4 Volume Forecast, 2025-2035
- 12.5.5 Base-Year Market Share, 2025
- 12.5.6 Segment CAGR and Growth Drivers
- 12.5.7 Subsegment Market Size and Forecast
- 12.5.7.1 Blood Collection Organizations
- 12.5.7.2 Hospital Pathology Services
- 12.5.7.3 Independent Pathology Providers
- 12.5.8 Subsegment Pricing and Adoption Trends
- 12.5.9 Leading Suppliers and Competition
- 12.5.10 Regional Demand and Opportunities
- 12.6 By Sales Channel - Market Size and Forecast, 2025-2035
- 12.6.1 Segment Definition and Scope
- 12.6.2 Historical Market Size, 2018-2025
- 12.6.3 Revenue Forecast, 2025-2035
- 12.6.4 Volume Forecast, 2025-2035
- 12.6.5 Base-Year Market Share, 2025
- 12.6.6 Segment CAGR and Growth Drivers
- 12.6.7 Subsegment Market Size and Forecast
- 12.6.7.1 National Standing Offer Supply
- 12.6.7.2 Direct Institutional Contracts
- 12.6.7.3 Specialist Distributor Supply
- 12.6.8 Subsegment Pricing and Adoption Trends
- 12.6.9 Leading Suppliers and Competition
- 12.6.10 Regional Demand and Opportunities
- 12.7 Segment Growth Comparison
- 12.8 Segment Attractiveness and Priority Matrix
Chapter 13 Australia Blood Group Typing End-Use and Application Market Outlook
- 13.1 End-Use Industry and Customer Demand Structure
- 13.2 Leading Applications and Customer Groups
- 13.3 End-Use Market Size, Share and Forecast
- 13.4 Major End-Use Industry Deep Dives
- 13.4.1 Customer Requirements and Use Cases
- 13.4.2 Demand and Replacement Cycles
- 13.4.3 Technical and Regulatory Considerations
- 13.4.4 Purchasing and Procurement Models
- 13.4.5 Leading Vendors and Distribution Channels
- 13.4.6 Forecast and Commercial Opportunities
- 13.5 Emerging Applications and Cross-Segment Demand
- 13.6 End-Use Industry Investment Priorities
Chapter 14 Australia Blood Group Typing Geographic Market Outlook, 2025-2035
- 14.1 Domestic Market Distribution and Demand Clusters
- 14.2 State- or Province-Wise Market Size and Forecast, 2025-2035
- 14.3 City and Metropolitan Market Outlook
- 14.4 Industrial, Manufacturing and Commercial Clusters
- 14.5 Geographic Concentration of Key End Users
- 14.6 Local Pricing and Purchasing Differences
- 14.7 Domestic Production Facilities and Capacity Map
- 14.8 Local Infrastructure and Project Pipeline
- 14.9 State-Level Policy and Incentive Differences
- 14.10 Subnational Investment Hotspots and Opportunities
- 14.11 Distribution and Logistics Networks
- 14.12 Domestic Competitive Footprint
Chapter 15 Australia Blood Group Typing Technology, Innovation and Sustainability Outlook
- 15.1 Technology Landscape and Maturity
- 15.2 Product, Process and Service Innovation
- 15.3 AI, Automation and Digital Tools in the Industry
- 15.4 Technology Adoption and Performance Benchmarking
- 15.5 Innovation Pipeline and R&D Investment
- 15.6 Patent and Intellectual Property Trends
- 15.7 Energy Efficiency and Resource Management
- 15.8 Sustainability, Recycling and Circularity
- 15.9 Technology Roadmap, 2025-2035
- 15.10 Risks of Obsolescence and Technology Substitution
Chapter 16 Australia Blood Group Typing Market Key Strategic Imperatives
- 16.1 Growth and Market Entry Priorities
- 16.2 High-Return Products and Segments
- 16.3 Pricing, Profitability and Cost Optimization
- 16.4 Technology Investment and Product Differentiation
- 16.5 Supply Chain Localization and Resilience
- 16.6 Distribution and Customer Acquisition
- 16.7 Partnership, Acquisition and Capacity Strategy
- 16.8 Regional Expansion Priorities
- 16.9 Short-, Medium- and Long-Term Actions
Chapter 17 Competition Outlook
- 17.1 Industry Competition Characteristics
- 17.2 Market Structure and Concentration
- 17.3 Market Share and Competitive Positioning, 2025
- 17.4 Company-Wise Revenue and Product Benchmarking
- 17.5 Production and Service Capacity Benchmarking
- 17.6 Technology, Pricing and Differentiation
- 17.7 Regional Footprint and Distribution Strength
- 17.8 Mergers, Acquisitions and Strategic Alliances
- 17.9 New Entrants and Competitive Threats
- 17.10 Porter's Five Forces and Industry Attractiveness
- 17.11 Competitive Outlook, 2025-2035
Chapter 18 Company Profiles
- 18.1 Company Coverage and Selection Criteria
- 18.2 Bio-Rad Laboratories
- 18.2.1 Business Description
- 18.2.2 Company Ownership and Geographic Presence
- 18.2.3 Product and Service Portfolio
- 18.2.4 Manufacturing and Operating Footprint
- 18.2.5 Production Capacity and Expansion Plans
- 18.2.6 Financial Performance and Investment
- 18.2.7 Market Share and Competitive Position
- 18.2.8 Technology and Innovation Capabilities
- 18.2.9 Strategic Alliances or Partnerships
- 18.2.10 Recent Developments
- 18.2.11 Growth Strategy and Outlook
- 18.3 Grifols
- 18.4 QuidelOrtho
- 18.5 Immulab
- 18.6 Werfen
- 18.7 Beckman Coulter
- 18.8 BAG Diagnostics
- 18.9 Institut de Biotechnologies Jacques Boy
- 18.10 inno-train Diagnostik
- 18.11 Agena Bioscience
- 18.12 Other Relevant Market Participants
Note: Every listed company is profiled on the structure shown under the first company. The company list is preliminary and may change based on research findings, market developments, data availability and client requirements.
Chapter 19 Disclaimer
- 19.1 Research and Forecast Disclaimer
- 19.2 Data Source and Estimation Limitations
Note: The depth of individual sections depends on data availability for this market. Volume, capacity, trade and other unit-based metrics are included where applicable.

