
Disability support and an aging population lift chair demand
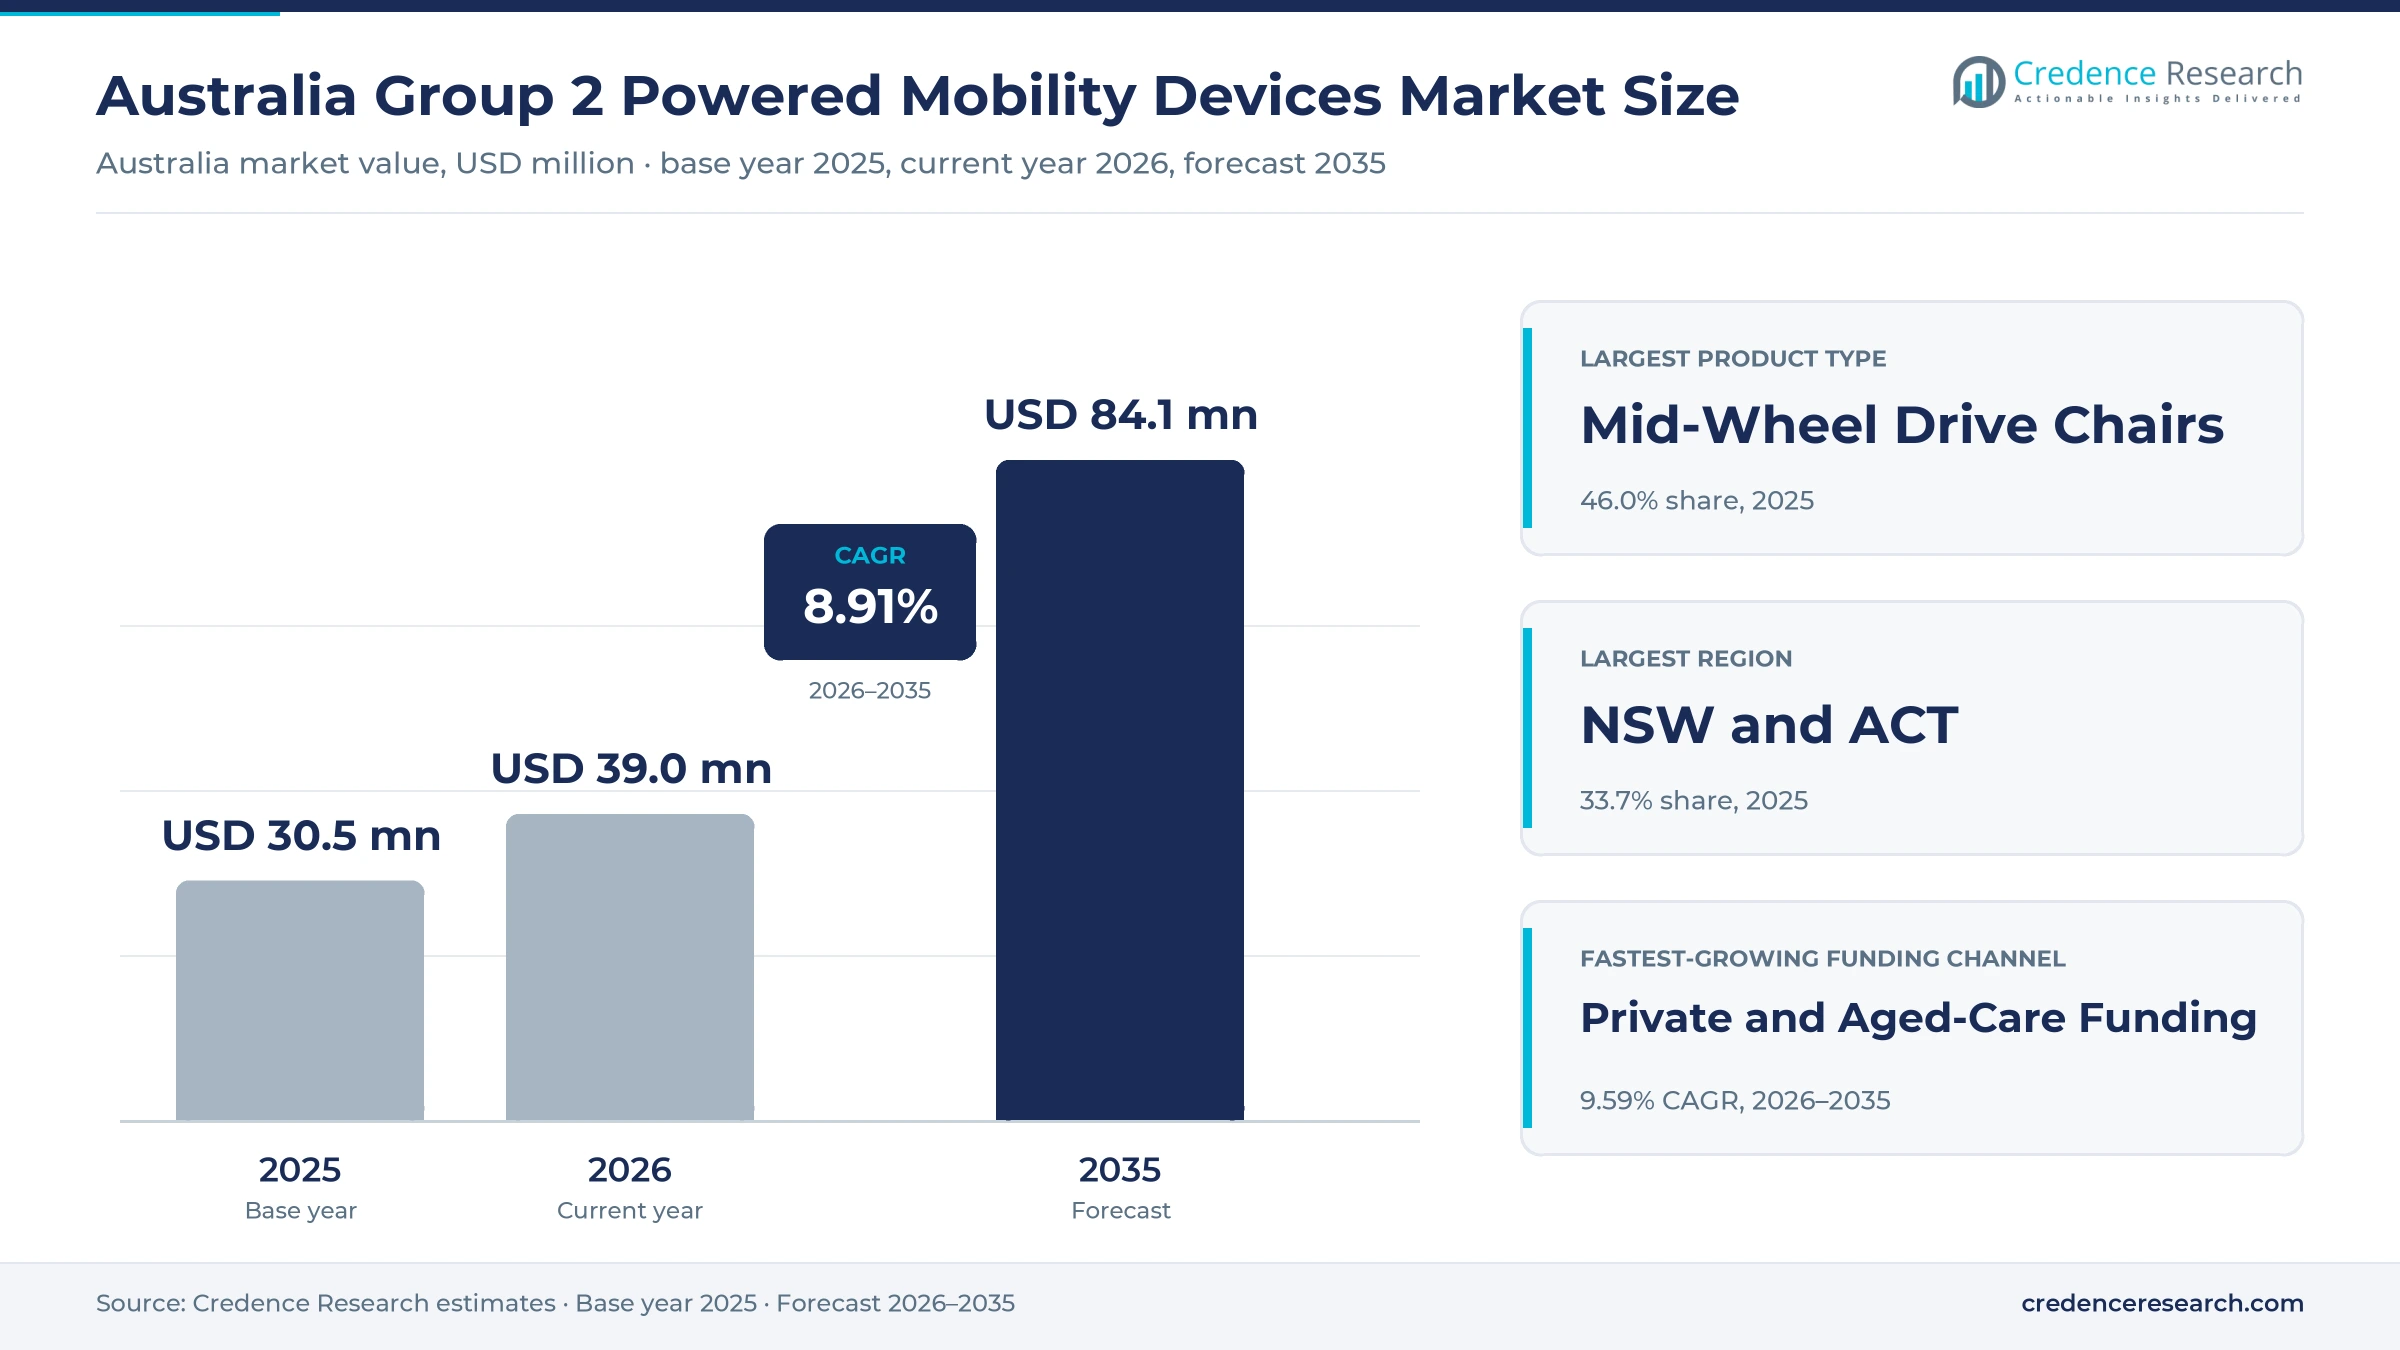
The Australia Group 2 powered mobility devices market was valued at USD 30.5 million in 2025 and is projected to increase from USD 39.0 million in 2026 to USD 84.1 million by 2035, registering a CAGR of 8.91% during 2026–2035. Demand comes from adults and children with severe mobility impairment who use powered wheelchairs at home and in the community, paid mainly through the national disability scheme, state equipment programs, veterans programs and aged-care budgets. New South Wales and Australian Capital Territory held the largest regional share, 33.7% in 2025, because the zone has the largest population. Queensland is the fastest-growing region at 9.18% a year, as people keep moving to the state from other parts of the country. In turn, a new aged-care equipment scheme that started in November 2025 opened another funding path for older buyers.
Which powered wheelchairs and buyers are counted?
The estimate measures spending in Australia on rear-wheel, front-wheel and mid-wheel drive powered wheelchairs with standard seating, including chairs, batteries and supply. It covers private households, supported accommodation and residential aged care, funded by the national disability scheme, state and territory programs, veterans programs and private or aged-care budgets.
The estimate excludes mobility scooters, power-assist add-ons for manual chairs and complex rehabilitation chairs with multiple powered seat functions. The value chain runs from manufacturers and importers through specialist providers and retailers to therapists, funders, users and carers.
Australia Group 2 Powered Mobility Devices Market Insights
- The Australia Group 2 powered mobility devices market was valued at USD 30.5 million in 2025 and is projected to reach USD 84.1 million by 2035, at an 8.91% CAGR during 2026–2035.
- New South Wales and Australian Capital Territory held 33.7% of 2025 value, because the zone has the largest population and many specialist providers.
- The national disability scheme led funding channels with 52.0% of 2025 value, as it funds chairs for working-age participants with permanent disability.
- In November 2025, a new aged-care equipment scheme began funding assistive technology such as wheelchairs for older people living at home.
- Private and aged-care funding grows fastest at 9.59% a year during 2026–2035, as more older Australians buy chairs to stay independent.
Mid-wheel drive chairs lead as aged-care funding grows
Why do mid-wheel drive chairs lead sales?
Based on product type, the market is categorized into rear-wheel drive powered wheelchairs, front-wheel drive powered wheelchairs and mid-wheel drive powered wheelchairs. Mid-Wheel Drive Powered Wheelchairs led with 46.0% of 2025 value, because their tight turning circle suits homes and units. Front-Wheel Drive Powered Wheelchairs grow fastest at 9.19% a year, as users seek stable outdoor handling.
Which funders pay for most chairs?
Based on funding channel, the market is categorized into NDIS, state and territory equipment schemes, DVA RAP and private and aged-care funding. NDIS led with 52.0% of 2025 value, because it funds chairs for most working-age users with permanent disability. Private and Aged-Care Funding grows fastest at 9.59% a year, as older buyers gain a new funding path.
Which age groups use powered chairs most?
Based on end user, the market is categorized into adults below 65 years, adults aged 65 years and above, and children and adolescents. Adults Below 65 Years led with 55.0% of 2025 value, because the national disability scheme supports people who join before age 65. Adults Aged 65 Years and Above grow fastest at 9.35% a year, as aging lifts severe mobility limits.
How do chairs reach users?
Based on distribution channel, the market is categorized into specialist assistive-technology providers, mobility equipment retailers and direct manufacturer channels. Specialist Assistive-Technology Providers led with 58.0% of 2025 value, because therapists and funders rely on their trials and setup. Direct Manufacturer Channels grow fastest at 9.41% a year, as makers sell more chairs directly to large funders and aged-care providers.
| Segment Group | Leading Sub-segment | Share, 2025 | Fastest-growing Sub-segment | CAGR, 2026–2035 |
|---|---|---|---|---|
| By Product Type | Mid-Wheel Drive Powered Wheelchairs | 46.0% | Front-Wheel Drive Powered Wheelchairs | 9.19% |
| By Funding Channel | NDIS | 52.0% | Private and Aged-Care Funding | 9.59% |
| By End User | Adults Below 65 Years | 55.0% | Adults Aged 65 Years and Above | 9.35% |
| By Distribution Channel | Specialist Assistive-Technology Providers | 58.0% | Direct Manufacturer Channels | 9.41% |
Request a Free Sample
Fill in your details and we'll send you a free sample report.
- Sample data tables & charts
- Research methodology
Disability prevalence, aging and funding rules drive demand
How does community-based disability support lift demand?
Community-based disability support lifts demand, because more people with severe mobility limits live at home and travel in their local area. The national disability survey counted 5.5 million Australians with disability in 2022, or 21.4% of the population, up from 17.7% in 2018. According to the national disability insurance agency, 782,013 participants had approved plans at June 30, 2026. That figure rose by 7,557, or 1.0%, in a single quarter. As a result, adults below 65 years lead end users with 55.0% of 2025 value, as plans fund electric wheelchairs for school, work and community life in every state.
Why do aging-related functional needs add buyers?
Aging-related functional needs add buyers, because many older Australians lose walking range and balance over time. The 2022 national survey found that 52.3% of people aged 65 and over had disability. In November 2025, the aged-care equipment scheme began funding products such as wheelchairs for older people living at home. Its high tier provides up to AUD 15,000 for assistive technology over 12 months. Veterans with a Gold Card can also receive one electric mobility aid for any condition. Consequently, adults aged 65 years and above grow fastest among end users at 9.35% a year, as more older people choose powered mobility devices to stay at home longer.
How do structured funding pathways support purchases?
Structured funding pathways support purchases, because each funder sets clear rules for assessment, trial and supply. The national disability scheme treats items from AUD 1,500 to AUD 15,000 as mid-cost technology that needs no quote. Items above AUD 15,000 are high-cost and need a written assessment from a qualified adviser. In August 2025, Victorian program guidelines set a maximum subsidy of AUD 6,000 for a powered wheelchair and AUD 2,750 for customization. As a result, the NDIS leads funding channels with 52.0% of 2025 value, while state programs serve people outside the scheme, such as those who first need a chair after age 65.
Why do replacement and review cycles sustain sales?
Replacement and review cycles sustain sales, because powered chairs wear out and users must prove they can drive safely. Victorian rules allow a replacement chair after a minimum of seven years or after a new assessment. Users must also arrange a review of their capacity to drive at least every two years. Under the veterans equipment guidelines, the contracted supplier provides a 12-month warranty and therapists schedule annual reassessments. In turn, specialist assistive-technology providers lead distribution with 58.0% of 2025 value, because they handle trials, setup, repairs and batteries for powered mobility devices over their full working life.
Connected chairs and aged-care pathways reshape buying
How is the shift to connected chairs changing service?
The shift to connected chairs is changing service, because built-in data shows how far and how often people drive. A study published in July 2026 in Assistive Technology analyzed 5,144 connected Permobil chairs used in Australia, Canada, Europe and the United States during 2023. Higher-performance F5 and M5 platforms traveled significantly farther each day than F3 and M3 models. Region explained more of the difference than model, which points to local terrain and service. In turn, suppliers pair lithium-ion batteries with remote data tools, while therapists use usage records to match chairs to daily needs. This shift also helps funders check whether expensive chairs are used often enough.
Why are aged-care purchasing pathways rising?
The rise of aged-care purchasing pathways is changing who buys chairs, because older people now have a dedicated equipment fund. The scheme that began on Nov. 1, 2025, has three tiers, under AUD 500, up to AUD 2,000 and up to AUD 15,000. Funding lasts 12 months and does not accrue, so providers must move quickly from assessment to supply. Victorian rules also let level 3 and 4 home care recipients apply for a powered wheelchair subsidy. As a result, private and aged-care funding grows fastest among funding channels at 9.59% a year, and suppliers of assistive technologies for older people gain new referral paths.
Can regional service networks open new sales?
Regional service networks offer a clear opening, because users outside capital cities need trials, repairs and spare parts close to home. Aidacare added its 27th location in March 2020 when it bought Mobility2You on the New South Wales Central Coast. It also acquired the Total Mobility business with effect from Oct. 1, 2020. Western Australia had the fastest population growth of any state in the year to March 2026, and it gained 10,314 people from interstate migration over that year. In turn, dealers that open regional workshops and mobile repair vans can win NDIS and aged-care customers who now wait for metropolitan technicians, especially in mining towns and coastal retirement areas.
Is there room to grow through local design and direct supply?
Local design and direct supply offer room to grow, because Australian users need chairs that handle rough terrain, heat and long distances. Sunrise Medical acquired Magic Mobility in August 2018, and the brand builds personalized power chairs at a facility in Melbourne. Sunrise described the brand as the leader in off-road and all-terrain power chairs. Victorian rules also fund up to AUD 2,750 for chair customization. Consequently, direct manufacturer channels grow fastest among channels at 9.41% a year, while smart wheelchair features add value from 2026. Local assembly also shortens lead times for custom seating and controls.
Subsidy caps, assessment delays and repairs slow access
How do subsidy caps limit access?
Subsidy caps limit access, because state programs pay less than the full price of many powered chairs. The Victorian powered wheelchair subsidy is capped at AUD 6,000, which leaves a gap for many users who need custom seating. As a result, people outside the national disability scheme often pay part of the cost themselves or wait longer. Charities, loan pools and refurbished stock help, although they cannot meet all demand.
Why do assessment steps delay supply?
Assessment steps delay supply, because funders require a therapist assessment and a trial before approval. Veterans programs use a three-step process of request, assessment and trial, and each step needs approval before the next starts. Consequently, shortages of occupational therapists in regional areas extend waiting times. Telehealth reviews and standard templates help, although safety checks still need a therapist present at delivery. Therefore, approval times remain a key bottleneck for supply in regional areas.
How do repairs and batteries cause downtime?
Repairs and batteries cause downtime, because powered chairs depend on motors, controllers and batteries that wear out. Victorian users must pay for tubes and tires as general wear and tear. In turn, a chair that breaks down can leave a person housebound until a technician arrives. Service contracts, spare chairs and remote fault data reduce this risk, although regional coverage remains thin. Batteries also need safe storage, regular charging and timely replacement by trained technicians.
Will safety and speed rules restrict some models?
Safety and speed rules can restrict some models, because state programs only buy chairs that stay within local limits. Victorian guidelines set a speed limit of 10 kilometers per hour for wheelchairs and scooters. As a result, faster imported models may not qualify for public subsidies. Makers must therefore offer local settings and documentation, which adds cost and delays the launch of new models. Smaller importers find these compliance steps especially costly for low-volume models.
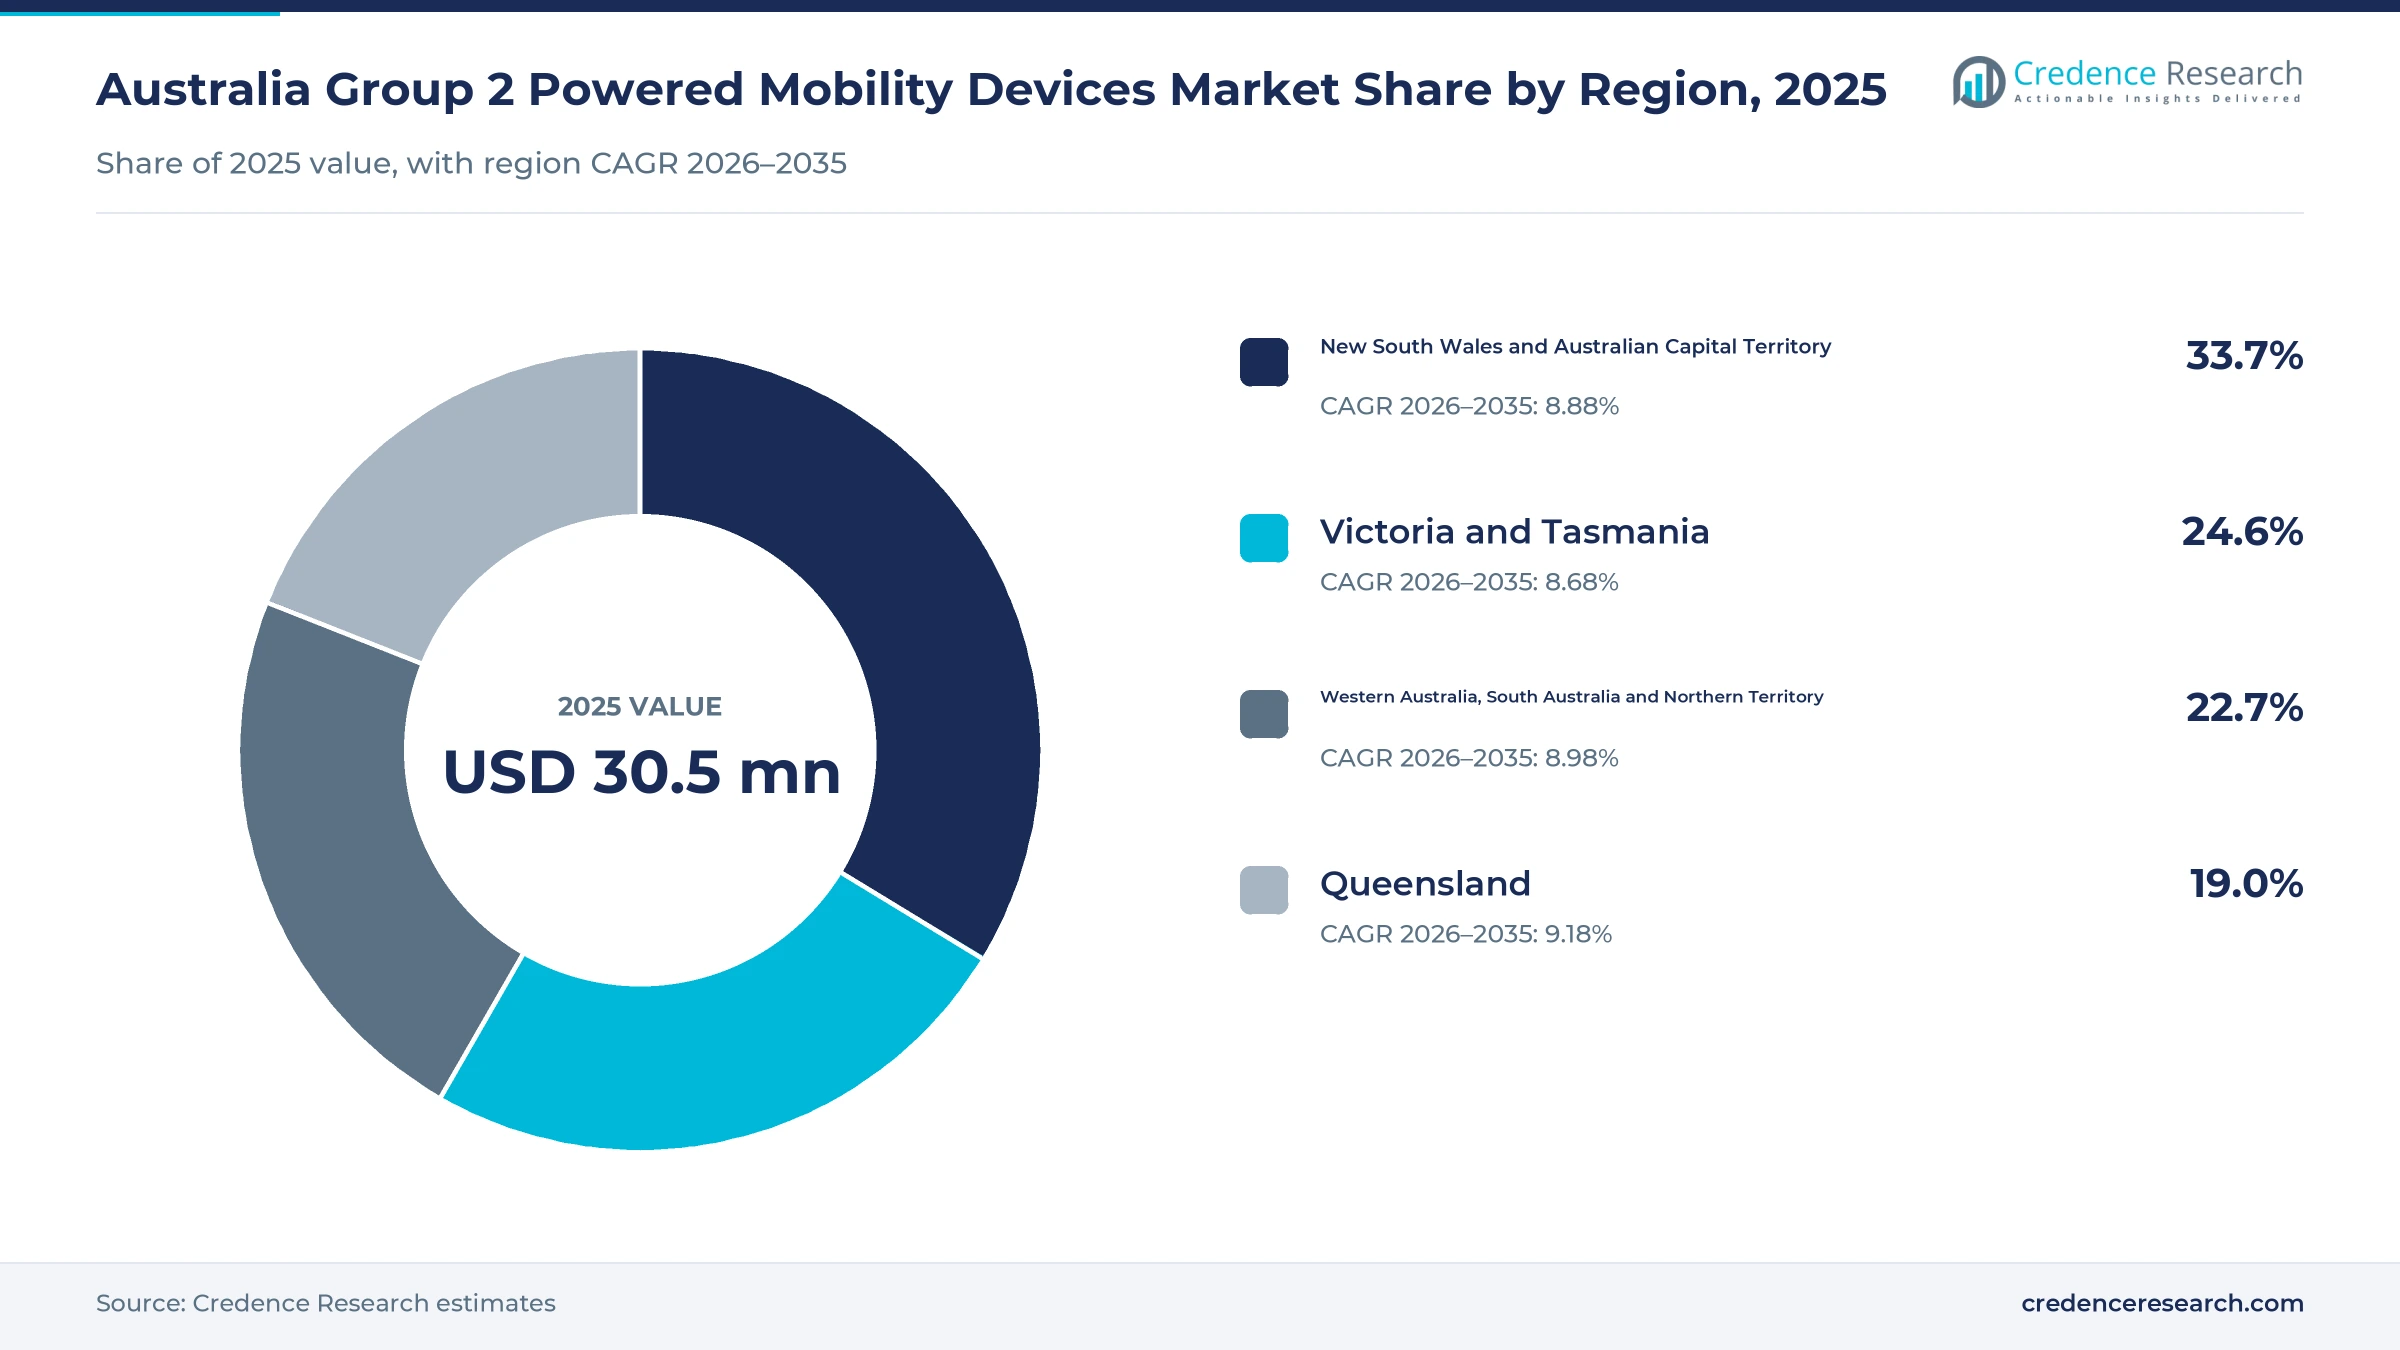
New South Wales leads as Queensland adds demand fastest
| Region | Value, 2025 (USD million) | Share, 2025 | CAGR, 2026–2035 |
|---|---|---|---|
| New South Wales and Australian Capital Territory | 10.3 | 33.7% | 8.88% |
| Victoria and Tasmania | 7.5 | 24.6% | 8.68% |
| Western Australia, South Australia and Northern Territory | 6.9 | 22.7% | 8.98% |
| Queensland | 5.8 | 19.0% | 9.18% |
Why do New South Wales and the ACT lead spending?
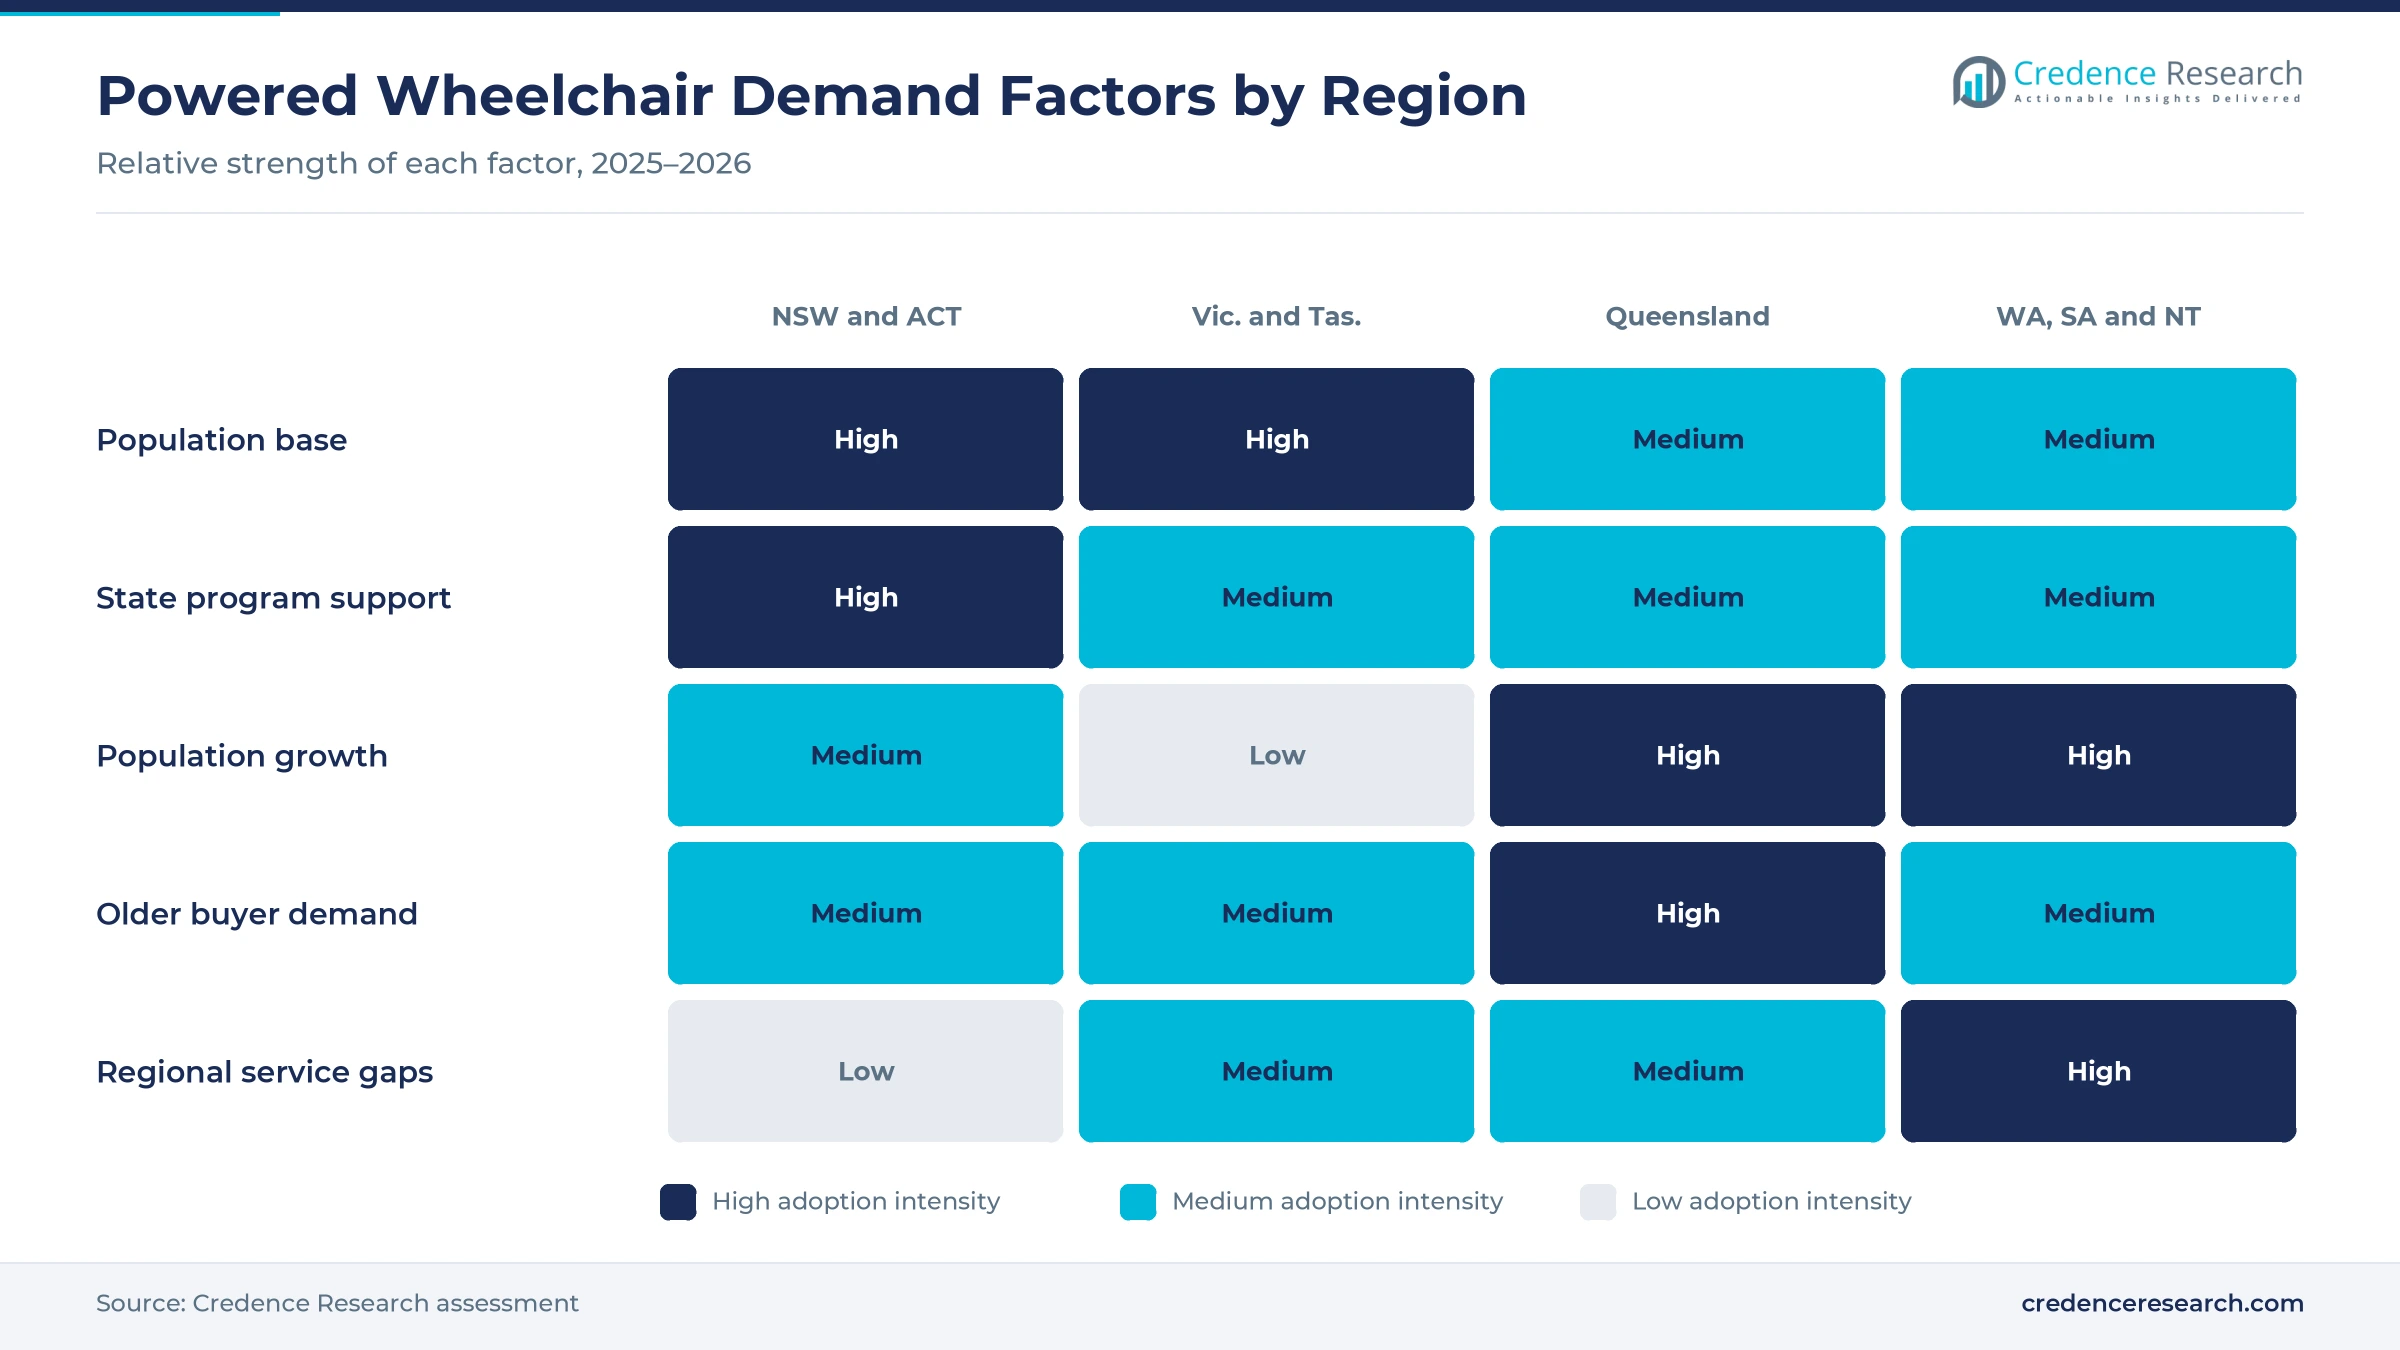
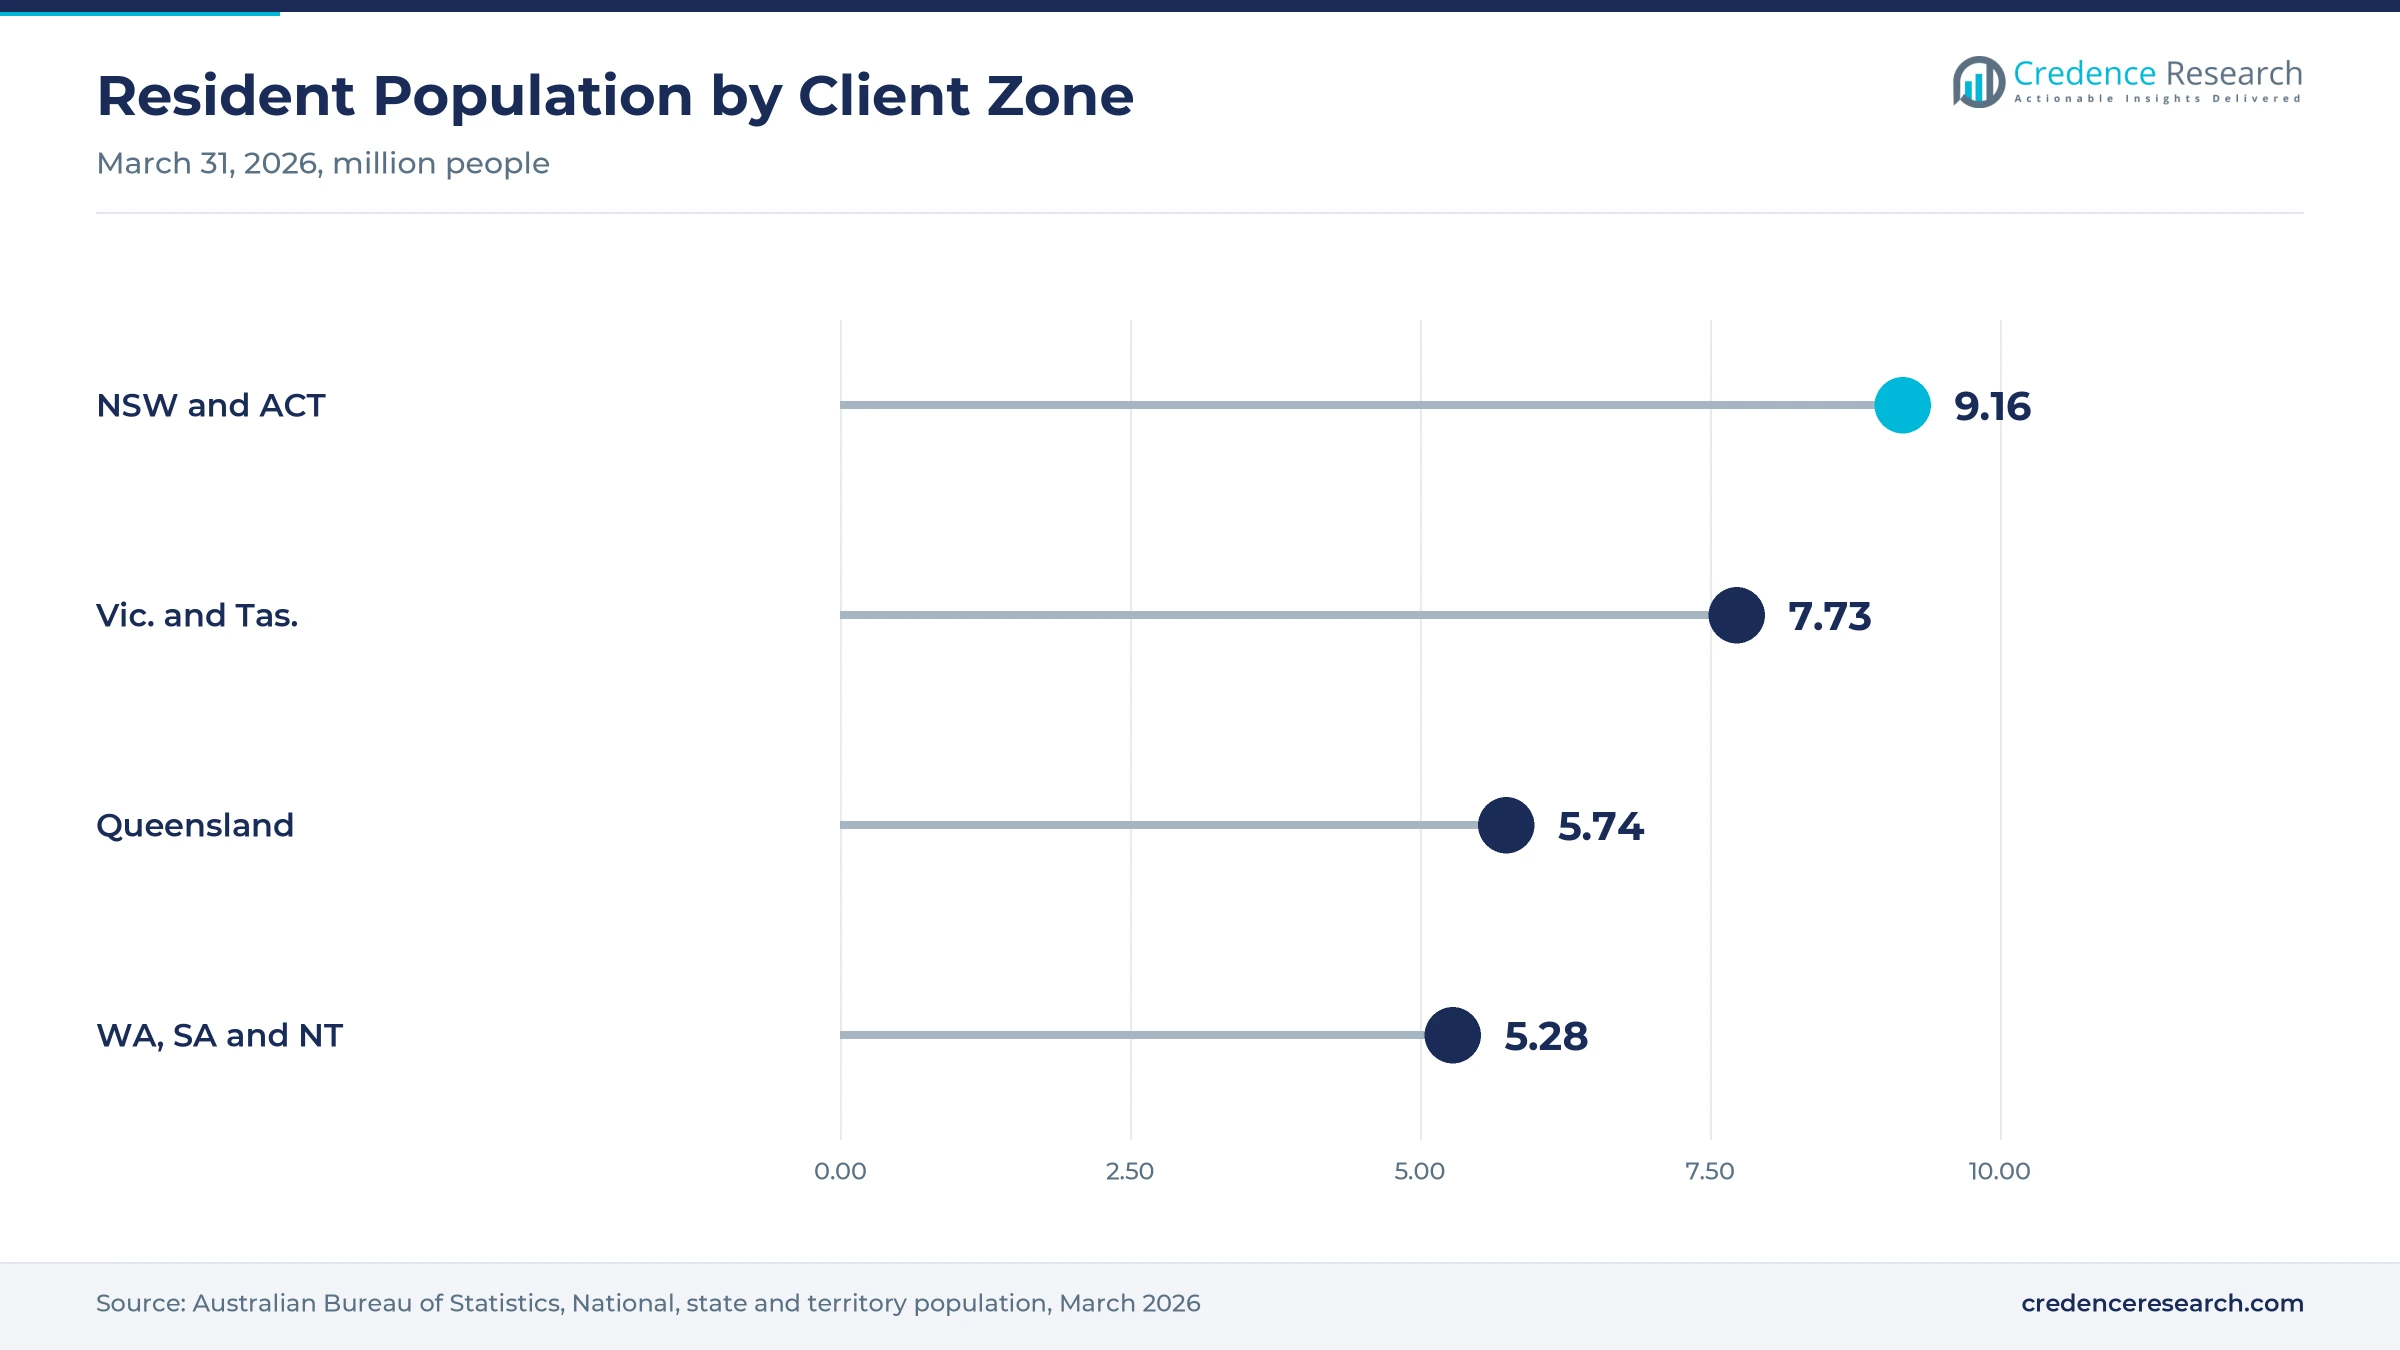
New South Wales and Australian Capital Territory held a 33.7% share of 2025 value and grow at 8.88% a year. New South Wales had 8.67 million residents and the capital territory had 489,000 at March 31, 2026. EnableNSW supplies power wheelchairs for community access and keeps a waitlist when items are unavailable. As a result, a large population, a statewide program and many Sydney dealers keep this zone in the lead.
How do Victoria and Tasmania fund powered chairs?
Victoria and Tasmania held a 24.6% share of 2025 value and grow at 8.68% a year. Victoria had 7.15 million residents and Tasmania had 580,000 at March 31, 2026. The Victorian aids and equipment program funds a powered wheelchair subsidy of up to AUD 6,000 for eligible people outside the national disability scheme. In turn, capped subsidies and slower population growth keep this zone growing more slowly than Queensland through 2035.
Why is Queensland the fastest-growing region?
Queensland held a 19.0% share of 2025 value and grows fastest at 9.18% a year. The state had 5.74 million residents at March 31, 2026, and gained 14,718 people from interstate migration in the year to March. Many retirees move to the Gold Coast and Sunshine Coast, which lifts demand from older buyers. Consequently, aged-care funding and population growth lift sales faster than in other zones, especially in coastal cities.
How do the western, southern and northern states compare?
Western Australia, South Australia and Northern Territory held a 22.7% share of 2025 value and grow at 8.98% a year. Western Australia had the fastest population growth of any state in the year to March 2026. As a result, Perth and Adelaide dealers drive most sales of powered mobility devices in this zone, while remote towns rely on visiting technicians.
Funding reforms, data releases and new evidence since 2024
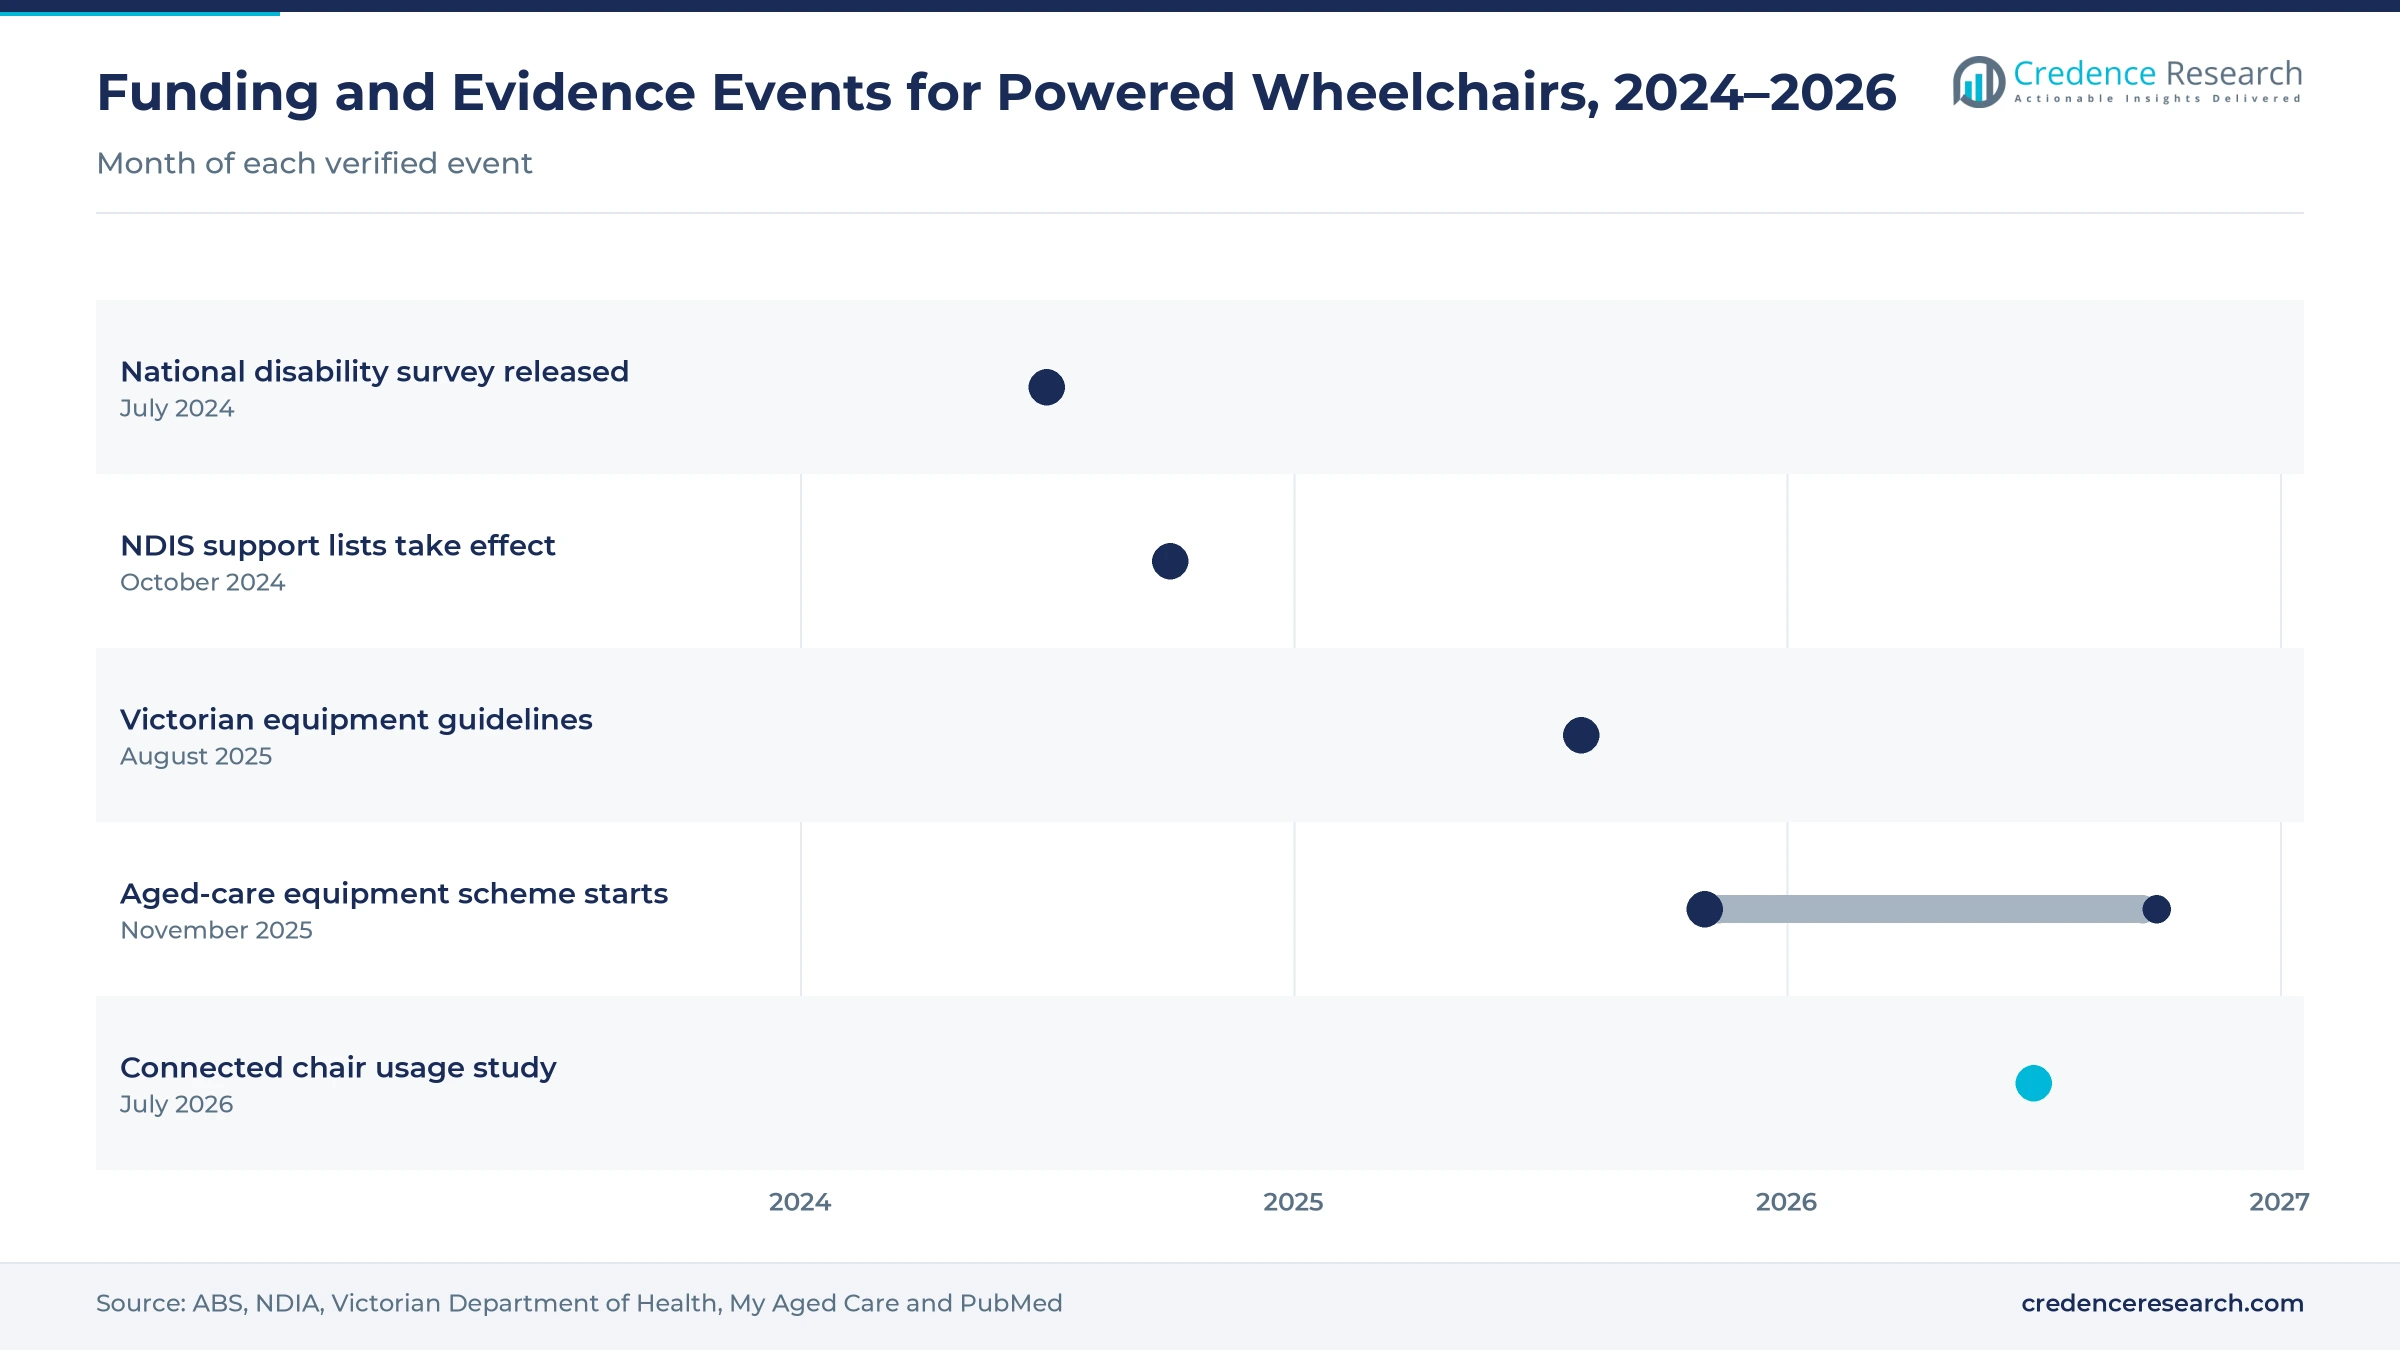
| Development | Status and market relevance |
|---|---|
| In July 2024, the national statistics agency released survey data showing 5.5 million Australians with disability in 2022. | 21.4% of the population |
| In October 2024, new NDIS support lists took effect while keeping access to assistive technology for participants. | Funding rules clarified |
| In August 2025, Victoria published aids and equipment program guidelines with a AUD 6,000 powered wheelchair subsidy. | State subsidy caps |
| In November 2025, the federal government launched the aged-care equipment scheme, funding assistive technology for older people at home. | Up to AUD 15,000 |
| In July 2026, a study of 5,144 connected Permobil chairs across four regions, including Australia, was published. | Usage data evidence |
Drive layouts, batteries and connected data shape choice
- Mid-wheel drive bases give a tight turning circle, which helps users move inside smaller homes and units.
- Lithium battery systems cut weight and extend range, which suits users who travel longer distances each day.
- Connected battery systems send usage and fault data to suppliers, which supports faster repairs and better prescribing.
- All-terrain drive platforms handle gravel, grass and slopes, which matters for regional and rural Australian users.
Need a Custom Version of This Report?
Tailor the scope, geography, or segments to your exact requirements.
- Custom geography or segment scope
- Direct access to our analyst team
Global makers and national dealers compete on service
Competition combines global wheelchair makers, local brands and national dealer networks that supply funders and users. Sunrise Medical announced its acquisition of Magic Mobility in August 2018, adding a local brand. Permobil is a registered sponsor with the national device regulator, and a July 2026 study used data from 5,144 of its connected chairs, including chairs in Australia. Sunrise Medical owns Magic Mobility, which builds all-terrain power chairs in Melbourne. Aidacare runs a national network after it acquired Mobility2You and the Total Mobility business in 2020. Independent Living Specialists supplies assistive technology to NDIS participants across several states. Suppliers compete on trial access, therapist support, repair speed, battery service and funder approvals, rather than on list price alone. In turn, companies that combine local stock, mobile repairs and connected data are best placed to win contracts with state programs and aged-care providers.
Companies profiled and their roles in this market
| Company | Type | Role in the market |
|---|---|---|
| Permobil | Manufacturer | Power wheelchairs and connected chair data, registered sponsor in Australia |
| Sunrise Medical | Manufacturer | Owns Magic Mobility, which builds all-terrain power chairs in Melbourne |
| Aidacare | Dealer and service network | National stores and service after 2020 acquisitions |
| Independent Living Specialists | Dealer | Assistive technology supply for NDIS participants |
Credence Research view on powered wheelchair spending
Credence Research's view is that Australian spending on standard powered wheelchairs will grow strongly through 2035, as disability support, aging and new aged-care funding widen the buyer base. Mid-wheel drive chairs should keep the largest share, while front-wheel drive chairs and aged-care funded sales grow faster. Queensland will add demand fastest, although New South Wales and the capital territory keep the largest share. However, suppliers that shorten assessment and repair times will gain the most from rising demand for powered mobility devices.
How the powered wheelchair estimate was built
The report uses 2025 as the base year, with values in USD million at current prices. Market values come from the Credence Research model, which combines user numbers, funding rules, replacement cycles and average chair prices. Regional shares follow the client zone split, and segment splits by product type, funding channel, end user and distribution channel are Credence Research estimates. Sources used are national statistics, scheme reports, program guidelines, published studies and company websites, and no interviews or surveys were used.
Funding reform and aging shape demand through 2035
The market is expected to reach USD 84.1 million by 2035, an 8.91% CAGR during 2026–2035, as more Australians with disability and more older people buy powered chairs. Growth should be strongest in aged-care funded sales, front-wheel drive chairs, direct supply and Queensland, while New South Wales and the capital territory keep the largest share. Connected batteries should help suppliers plan repairs and replace worn parts sooner. In contrast, subsidy caps and long assessment queues could slow access for people outside the national disability scheme.
Frequently Asked Questions
How big is the Australia Group 2 powered mobility devices market?
Which region leads powered wheelchair spending?
Which region grows fastest?
Which funding channel pays for most chairs?
How does the new aged-care scheme help buyers?
How much does Victoria subsidize a powered wheelchair?
Who are the leading participants in this market?
What are the main risks to growth?
Table of Content
Chapter 1 Market Segmentation
- 1.1 Segmentation Framework
- 1.1.1 Product and Service Classification
- 1.1.2 Application and End-Use Classification
- 1.1.3 Technology and Solution Classification
- 1.1.4 Customer and Distribution Channel Classification
- 1.1.5 Geographic Segmentation
- 1.1.6 Market Segment Definitions and Boundaries
- 1.2 By Product Type
- 1.2.1 Rear-Wheel Drive Powered Wheelchairs
- 1.2.2 Front-Wheel Drive Powered Wheelchairs
- 1.2.3 Mid-Wheel Drive Powered Wheelchairs
- 1.3 By Funding Channel
- 1.3.1 NDIS
- 1.3.2 State and Territory Equipment Schemes
- 1.3.3 DVA RAP
- 1.3.4 Private and Aged-Care Funding
- 1.4 By End User
- 1.4.1 Adults Below 65 Years
- 1.4.2 Adults Aged 65 Years and Above
- 1.4.3 Children and Adolescents
Chapter 2 Introduction
- 2.1 Report Objectives and Scope
- 2.2 Product Definition and Industry Terminology
- 2.3 Market Inclusions and Exclusions
- 2.4 Research Process
- 2.4.1 Primary Research and Expert Interviews
- 2.4.2 Secondary Research and Source Review
- 2.4.3 Top-Down and Bottom-Up Estimation
- 2.4.4 Data Triangulation and Verification
- 2.5 Market Size Measurement Basis
- 2.5.1 2025: USD 30.5 million → 2035: USD 84.1 million
- 2.6 Historical and Forecast Reference Periods
- 2.6.1 Historical Period: 2018-2025
- 2.6.2 Base Year: 2025
- 2.6.3 Forecast Period: 2025-2035
- 2.7 Research Assumptions and Limitations
Chapter 3 Executive Summary
- 3.1 Market Snapshot and Key Findings
- 3.2 Base-Year Market Size, 2025
- 3.3 Forecast Market Size, 2035
- 3.4 Revenue and Volume Growth Outlook
- 3.5 Key Demand and Supply Indicators
- 3.6 Leading Market Segments
- 3.7 Fastest-Growing Market Opportunities
- 3.8 Regional Performance Highlights
- 3.9 Technology and Industry Transformation
- 3.10 Competitive Landscape Summary
- 3.11 Analyst View and Strategic Implications
Chapter 4 Australia Group 2 Powered Mobility Devices Market Trends and Developments
- 4.1 Historical Industry Development, 2018-2025
- 4.2 Recent Market Trends and Developments
- 4.3 Demand and Customer Behavior Trends
- 4.4 Technology and Product Innovation
- 4.5 Artificial Intelligence, Automation and Digitalization
- 4.6 Local Manufacturing and Supply Chain Realignment
- 4.7 Industry Partnerships, Mergers and Acquisitions
- 4.8 Sustainability and Circular Economy Developments
- 4.9 Government and Private Sector Investment Trends
- 4.10 Emerging Business Models and Commercialization
- 4.11 Industry Developments and Announcements
Chapter 5 Australia Group 2 Powered Mobility Devices Market Production, Supply and Demand Analysis
- 5.1 Demand Trend and Consumption Analysis, 2018-2025
- 5.2 Demand Forecast, 2025-2035
- 5.3 Production and Output Trend, 2018-2025
- 5.4 Production and Output Forecast, 2025-2035
- 5.5 Installed Capacity and Capacity Utilization
- 5.6 Company-Wise Production Plants and Statistics
- 5.6.1 Installed Production Capacity
- 5.6.2 Actual Production
- 5.6.3 Planned Capacity and Expansion Targets
- 5.7 Supply Chain Structure and Procurement Trends
- 5.8 Supply-Demand Gap and Bottlenecks
- 5.9 Import Dependence and Sourcing Structure
- 5.10 Contract Manufacturing and Outsourcing
- 5.11 Regional Supply and Demand Concentration
Chapter 6 Australia Group 2 Powered Mobility Devices Market Pricing Analysis
- 6.1 Pricing Structure and Measurement
- 6.2 Historical Pricing Trends, 2018-2025
- 6.3 Pricing Outlook, 2025-2035
- 6.4 Average Selling Price and Unit Economics
- 6.5 Pricing by Product and Market Segment
- 6.6 Geographic Pricing Differences
- 6.7 Key Input, Energy, Labor and Logistics Costs
- 6.8 Contract Pricing and Purchasing Models
- 6.9 Pricing Sensitivity and Competitive Positioning
- 6.10 Price, Margin and Profitability Implications
Chapter 7 Australia Group 2 Powered Mobility Devices Market Dynamics
- 7.1 Market Growth Drivers
- 7.1.1 Demand-Side Drivers
- 7.1.2 Technology and Innovation Drivers
- 7.1.3 Infrastructure and Investment Drivers
- 7.1.4 Regulatory and Policy Drivers
- 7.2 Market Restraints
- 7.2.1 Cost and Affordability Constraints
- 7.2.2 Technology and Adoption Barriers
- 7.2.3 Supply Chain and Operational Constraints
- 7.3 Market Challenges
- 7.3.1 Competitive Pressure and Margin Erosion
- 7.3.2 Skills, Infrastructure and Implementation Gaps
- 7.4 Emerging Market Opportunities
- 7.5 Market Dynamics Impact and Time-Horizon Assessment
Chapter 8 Australia Group 2 Powered Mobility Devices Value Chain Analysis
- 8.1 Industry Value Chain Overview
- 8.2 Upstream Suppliers and Critical Inputs
- 8.3 Technology and Component Providers
- 8.4 Manufacturing or Service Delivery
- 8.5 Distribution, Channel Partners and Integrators
- 8.6 Downstream Applications and End Users
- 8.7 Value Addition and Profit Pools
- 8.8 Vertical Integration and Outsourcing
- 8.9 Supplier Concentration and Risk
- 8.10 Supply Chain Localization and Resilience
Chapter 9 Australia Group 2 Powered Mobility Devices Market Regulations and Policies
- 9.1 Relevant Laws, Standards and Compliance Frameworks
- 9.2 Product, Service, Safety and Quality Requirements
- 9.3 Government Policies, Incentives and Subsidies
- 9.4 Imports, Exports and Trade Barriers
- 9.5 Public Procurement and Local Content Requirements
- 9.6 Environmental and Sustainability Compliance
- 9.7 Upcoming Policy Changes and Market Implications
Chapter 10 Australia Group 2 Powered Mobility Devices Market Hotspots and Opportunities
- 10.1 Market Opportunity Mapping and Growth Hotspots
- 10.2 High-Growth Applications and Customer Groups
- 10.3 Underserved Markets and White-Space Opportunities
- 10.4 Emerging Technology and Product Opportunities
- 10.5 New Capacity and Investment Hotspots
- 10.6 Market Entry and Expansion Opportunities
- 10.7 Distribution and Partnership Opportunities
- 10.8 Near-Term and Long-Term Commercial Potential
- 10.9 Opportunity Attractiveness and Execution Risks
Chapter 11 Australia Group 2 Powered Mobility Devices Market Outlook, 2025-2035
- 11.1 Market Size and Analysis
- 11.1.1 Revenue (Market Measurement: 2025: USD 30.5 million → 2035: USD 84.1 million)
- 11.1.2 Market Volume and Quantity Sold
- 11.1.3 Historical Market Size, 2018-2025
- 11.1.4 Base-Year Market Size, 2025
- 11.2 Market Forecast, 2025-2035
- 11.2.1 Revenue Forecast to 2035
- 11.2.2 Volume Forecast to 2035
- 11.2.3 CAGR and Year-on-Year Growth
- 11.2.4 Incremental Revenue Opportunity
- 11.3 Forecast Assumptions and Scenario Analysis
- 11.3.1 Base-Case Forecast
- 11.3.2 Optimistic and Conservative Scenarios
- 11.3.3 Technology, Pricing and Policy Sensitivities
- 11.4 Market Attractiveness and Growth Outlook
Chapter 12 Australia Group 2 Powered Mobility Devices Market Segmentation and Outlook
- 12.1 Segmentation Summary and Market Shares, 2025
- 12.2 Largest and Fastest-Growing Segments
- 12.3 By Product Type - Market Size and Forecast, 2025-2035
- 12.3.1 Segment Definition and Scope
- 12.3.2 Historical Market Size, 2018-2025
- 12.3.3 Revenue Forecast, 2025-2035
- 12.3.4 Volume Forecast, 2025-2035
- 12.3.5 Base-Year Market Share, 2025
- 12.3.6 Segment CAGR and Growth Drivers
- 12.3.7 Subsegment Market Size and Forecast
- 12.3.7.1 Rear-Wheel Drive Powered Wheelchairs
- 12.3.7.2 Front-Wheel Drive Powered Wheelchairs
- 12.3.7.3 Mid-Wheel Drive Powered Wheelchairs
- 12.3.8 Subsegment Pricing and Adoption Trends
- 12.3.9 Leading Suppliers and Competition
- 12.3.10 Regional Demand and Opportunities
- 12.4 By Funding Channel - Market Size and Forecast, 2025-2035
- 12.4.1 Segment Definition and Scope
- 12.4.2 Historical Market Size, 2018-2025
- 12.4.3 Revenue Forecast, 2025-2035
- 12.4.4 Volume Forecast, 2025-2035
- 12.4.5 Base-Year Market Share, 2025
- 12.4.6 Segment CAGR and Growth Drivers
- 12.4.7 Subsegment Market Size and Forecast
- 12.4.7.1 NDIS
- 12.4.7.2 State and Territory Equipment Schemes
- 12.4.7.3 DVA RAP
- 12.4.7.4 Private and Aged-Care Funding
- 12.4.8 Subsegment Pricing and Adoption Trends
- 12.4.9 Leading Suppliers and Competition
- 12.4.10 Regional Demand and Opportunities
- 12.5 By End User - Market Size and Forecast, 2025-2035
- 12.5.1 Segment Definition and Scope
- 12.5.2 Historical Market Size, 2018-2025
- 12.5.3 Revenue Forecast, 2025-2035
- 12.5.4 Volume Forecast, 2025-2035
- 12.5.5 Base-Year Market Share, 2025
- 12.5.6 Segment CAGR and Growth Drivers
- 12.5.7 Subsegment Market Size and Forecast
- 12.5.7.1 Adults Below 65 Years
- 12.5.7.2 Adults Aged 65 Years and Above
- 12.5.7.3 Children and Adolescents
- 12.5.8 Subsegment Pricing and Adoption Trends
- 12.5.9 Leading Suppliers and Competition
- 12.5.10 Regional Demand and Opportunities
- 12.6 Segment Growth Comparison
- 12.7 Segment Attractiveness and Priority Matrix
Chapter 13 Australia Group 2 Powered Mobility Devices End-Use and Application Market Outlook
- 13.1 End-Use Industry and Customer Demand Structure
- 13.2 Leading Applications and Customer Groups
- 13.3 End-Use Market Size, Share and Forecast
- 13.4 Major End-Use Industry Deep Dives
- 13.4.1 Customer Requirements and Use Cases
- 13.4.2 Demand and Replacement Cycles
- 13.4.3 Technical and Regulatory Considerations
- 13.4.4 Purchasing and Procurement Models
- 13.4.5 Leading Vendors and Distribution Channels
- 13.4.6 Forecast and Commercial Opportunities
- 13.5 Emerging Applications and Cross-Segment Demand
- 13.6 End-Use Industry Investment Priorities
Chapter 14 Australia Group 2 Powered Mobility Devices Geographic Market Outlook, 2025-2035
- 14.1 Domestic Market Distribution and Demand Clusters
- 14.2 State- or Province-Wise Market Size and Forecast, 2025-2035
- 14.3 City and Metropolitan Market Outlook
- 14.4 Industrial, Manufacturing and Commercial Clusters
- 14.5 Geographic Concentration of Key End Users
- 14.6 Local Pricing and Purchasing Differences
- 14.7 Domestic Production Facilities and Capacity Map
- 14.8 Local Infrastructure and Project Pipeline
- 14.9 State-Level Policy and Incentive Differences
- 14.10 Subnational Investment Hotspots and Opportunities
- 14.11 Distribution and Logistics Networks
- 14.12 Domestic Competitive Footprint
Chapter 15 Australia Group 2 Powered Mobility Devices Technology, Innovation and Sustainability Outlook
- 15.1 Technology Landscape and Maturity
- 15.2 Product, Process and Service Innovation
- 15.3 AI, Automation and Digital Tools in the Industry
- 15.4 Technology Adoption and Performance Benchmarking
- 15.5 Innovation Pipeline and R&D Investment
- 15.6 Patent and Intellectual Property Trends
- 15.7 Energy Efficiency and Resource Management
- 15.8 Sustainability, Recycling and Circularity
- 15.9 Technology Roadmap, 2025-2035
- 15.10 Risks of Obsolescence and Technology Substitution
Chapter 16 Australia Group 2 Powered Mobility Devices Market Key Strategic Imperatives
- 16.1 Growth and Market Entry Priorities
- 16.2 High-Return Products and Segments
- 16.3 Pricing, Profitability and Cost Optimization
- 16.4 Technology Investment and Product Differentiation
- 16.5 Supply Chain Localization and Resilience
- 16.6 Distribution and Customer Acquisition
- 16.7 Partnership, Acquisition and Capacity Strategy
- 16.8 Regional Expansion Priorities
- 16.9 Short-, Medium- and Long-Term Actions
Chapter 17 Competition Outlook
- 17.1 Industry Competition Characteristics
- 17.2 Market Structure and Concentration
- 17.3 Market Share and Competitive Positioning, 2025
- 17.4 Company-Wise Revenue and Product Benchmarking
- 17.5 Production and Service Capacity Benchmarking
- 17.6 Technology, Pricing and Differentiation
- 17.7 Regional Footprint and Distribution Strength
- 17.8 Mergers, Acquisitions and Strategic Alliances
- 17.9 New Entrants and Competitive Threats
- 17.10 Porter's Five Forces and Industry Attractiveness
- 17.11 Competitive Outlook, 2025-2035
Chapter 18 Company Profiles
- 18.1 Company Coverage and Selection Criteria
- 18.2 Permobil
- 18.2.1 Business Description
- 18.2.2 Company Ownership and Geographic Presence
- 18.2.3 Product and Service Portfolio
- 18.2.4 Manufacturing and Operating Footprint
- 18.2.5 Production Capacity and Expansion Plans
- 18.2.6 Financial Performance and Investment
- 18.2.7 Market Share and Competitive Position
- 18.2.8 Technology and Innovation Capabilities
- 18.2.9 Strategic Alliances or Partnerships
- 18.2.10 Recent Developments
- 18.2.11 Growth Strategy and Outlook
- 18.3 Pride Mobility
- 18.4 Sunrise Medical
- 18.5 KARMA Medical
- 18.6 Merits Australia
- 18.7 Shoprider Australia
- 18.8 K Care Healthcare Solutions
- 18.9 Independent Living Specialists
- 18.10 Aidacare
- 18.11 Astris PME
- 18.12 Other Relevant Market Participants
Note: Every listed company is profiled on the structure shown under the first company. The company list is preliminary and may change based on research findings, market developments, data availability and client requirements.
Chapter 19 Disclaimer
- 19.1 Research and Forecast Disclaimer
- 19.2 Data Source and Estimation Limitations
Note: The depth of individual sections depends on data availability for this market. Volume, capacity, trade and other unit-based metrics are included where applicable.

